
Abstract
Concrete arch dams have been widely constructed worldwide, and many of these dams are located in areas with high seismic activity. However, strong seismic loading poses a severe threat to concrete arch dams, and dams have the risk of suffering damage and the possibility of an ensuing dam break. In past decades, seismic and structural health monitoring has undergone rapid growth in the context of arch dams to track the operation state of arch dams under strong seismic loading. In fact, arch dams with damage caused by seismic loading normally exhibit nonlinear dynamic behaviors and time-variable dynamic properties. To effectively identify the structural damage state development of arch dams under seismic loading, an online damage identification method using a novel recursive time-variable autoregressive with exogenous (TVARX) input model was presented in this paper. To improve the tracking capability for the time-variable coefficients of the TVARX model, an adaptive adjustment algorithm of variable weighting factors was incorporated into the recursive least-squares method. In the proposed method, the predicted model residual, a damage index named the fit ratio (FR), the difference between fit ratios (DF), and a damage index based on the change in ARX model parameters (CH) were proposed to identify the presence of damage, damage area, and relative damage extent for arch dams. Eventually, the proposed approach was used for the online damage state identification of arch dams in a numerical simulation example and a shaking table test, and the identification results demonstrated the effectiveness of the proposed approach.
Keywords
Introduction
Concrete arch dams have been widely constructed and operated by countries worldwide due to comprehensive benefits such as flood control, power generation, shipping, and water supply. 1 However, concrete arch dams also present risks to public safety and economic infrastructure. These risks come from the possibility of structural damage and the ensuing dam break,2,3 and the occurrence of dam breaks may be related to material aging, structural defects, and strong seismic loads. Specifically, seismic loading poses a severe threat to concrete arch dams in areas with high seismic activity, and unexpected damage may arise and propagate on the dam during seismic loading. The structure of a concrete arch dam shows nonlinear dynamic characteristics when it is destroyed under seismic loading, and variation in dynamic properties over time means that the dam is a time-variable structural system. As a result, the rigidity and integrity of the dam will be weakened, and the ability to bear an external load will be reduced. There have already been several cases of concrete dams being damaged by seismic loads, threatening the security of concrete dams.4–7 Therefore, the damage identification of concrete arch dams is important for understanding their operation state, promoting project benefits, and ensuring their safe operation. As one part of Structural Health Monitoring, the goal of damage identification is to detect, localize, and quantify the structural damage of concrete dams due to earthquakes in this study.
In the last few decades, significant attention has been given to structural damage identification in the scientific and engineering communities.8–11 Structural damage identification methods were classified as local damage identification methods and global damage identification methods. The local damage identification methods were nondestructive testing, such as ultrasonic inspection, 12 ground penetration radar detection, 13 and acoustic emissions, 14 through which the rough structural damage areas should be known in advance. These types of methods often use detection data from damaged structures, and baseline data from undamaged structures are not needed. The results show that the local damage identification method was effective for small and regular structures, but difficult for large and complex structures. Hence, to effectively identify the damage for large and complicated structures, the vibration-based damage identification method as a global damage identification technique has been developed.9,15 The fundamental idea behind the vibration-based damage identification method was that the loss of strength, stiffness, and other physical properties of a certain structure (structural damage) will cause changes in dynamic properties, and then the vibration response was modified as dynamic properties of the structure such as stiffness, damping, natural frequency, and mode shape can be detected through the vibration response. In view of this property, structures were monitored to obtain periodically sampled vibration data from an array of sensors, and numerous vibration-based methodologies were put forward to detect, quantify, and localize damage for a given structure with various levels of efficiency.
Hitherto, vibration-based methodologies aimed at time-invariant structures have achieved remarkable progress and wide application.9,15,16 For example, Altunisik et al. 3 applied the enhanced frequency decomposition method to extract the natural frequency, mode shape, and damping ratio of five ambient vibration tests of damaged and retrofitted a model of an arch dam model, through which the effect of retrofitting on the dynamic characteristics of the dam model was evaluated. Wang and Ren 17 proposed a new structural damage method called the local damage factor to evaluate both the presence and relative severity of structural damage of a gravity dam model. Sevim et al. 2 applied enhanced frequency domain decomposition and stochastic subspace identification (SSI) techniques to estimate the modal parameters of a prototype arch dam model under four damage scenarios, and the changing rules of the modal parameters with the increase in cracks on the dam were concluded. Esmaielzadeh et al. 18 applied the Hilbert-Huang method to extract the primary natural frequencies of a dam with three levels of damage, and a parameter called the relative frequency error was introduced to identify the location and severity of structural damage in a concrete gravity dam. Vaez et al. 19 applied the wavelet transform method to obtain the first four vibration modes of the Koyna Dam with various scenarios of damage, and the damage position was identified as abrupt changes in the wavelet coefficients in the damaged area.
On the other hand, vibration-based methodologies aimed at time-variable structures have also gradually made extraordinary progress and are mainly classified as nonparametric methods and time-dependent parametric methods. Nonparametric methods are methods based on time-frequency domain representations, such as short-time Fourier transforms, 20 wavelet-based methods, 21 the Wigner-Ville distribution, 22 and the Hilbert–Huang transform. 23 These nonparametric methods mainly relied on the visual examination of the obtained time-frequency diagram or pattern recognition techniques capable of examining the fingerprint caused by a certain defect. Although satisfactory identification results can be obtained by these nonparametric methods, these analyses are batch-based and were not suitable for online structural damage identification.
Time-dependent parametric methods are time domain methods based on the time-dependent state space or time-dependent time series models. The time-dependent state space model was derived from the time-dependent structural dynamics equations, and then the state equation and the observation equation with state variable were established. 24 The equations not only aim to establish the relationship between the external input and output of the structural system, but can also track structural state variables such as displacement, velocity, stiffness, and damping. By tracking the structural state variables over time using recursive algorithms such as the Kalman filter, 25 extended Kalman filter, 26 and particle filter, 27 the goal of the time-varying structural damage identification was realized. As one of the most precise and effective global damage identification methods, time series methods have gained wide attention and successful applications in structural damage identification areas. To effectively identify damage to time-variant structures by using time series models, time-dependent time series models were developed. Different from the traditional time series model, the model parameters were time-varying. These models started from the simple time-varying autoregressive (TAR) output-only models to more complex and computationally demanding models such as the time-varying autoregressive moving-average model (TARMA), time-varying autoregressive with eXogenous (TVARX) model, and time-varying autoregressive moving-average with eXogenous (TVARMAX) model. The fundamental idea behind using these time series models for damage identification was that the obtained model coefficients are relevant to the dynamic properties of the structural system. A time series model with time dependence was used to analyze the vibration response of the structure, such as displacement, velocity, and acceleration. The initial vibration response was taken as the reference health state, and the model coefficients of the model were obtained by minimizing the residual errors. These obtained model coefficients and model residuals in the initial phase are then compared for the subsequent phases to obtain the model coefficients or residual errors at each time. Any deviations of the model coefficients or model residuals can be regarded to indicate damage in the structure. The time series models offer a number of potential advantages, such as (i) simple representation, because the model may consist of a limited number of parameters, (ii) improved tracking accuracy and resolution of the time-variable dynamics, (iii) high sensitivity to damage, (iv) the capability of capturing the easily ignored structural state information, and (v) flexibility in analysis, prediction, damage identification, and control applications. Inspired by these potential advantages, several damage-sensitive features extracted from the model coefficients and residual errors were proposed, and statistical analysis techniques were developed to detect changes in these damage-sensitive features, which may indicate damage to the structures. For example, Spiridonakos and Fassois 28 proposed a damage identification method based on the Functional Series Time-dependent AutoRegressive (FS-TAR) model and a proper statistical decision-making scheme for inherently time-variable structures; then, the proposed method was verified by a pick-and-place mechanism. Poulimenos and Fassois 29 proposed an online fault detection method based on functional series time-dependent autoregressive with eXogenous excitation (FS-TARX) models and online inspection schemes with statistical decision making, and then the proposed method was demonstrated via a laboratory “bridge-like” structure. Huang et al. 30 proposed a novel approach to estimate the instantaneous modal parameters of time-variable structures via the FS-TARX model, and the approach was demonstrated through a damaged frame specimen during shaking testing.
At present, vibration-based damage identification methodologies for concrete dams mainly focus on time-invariance structures, and some examples are mentioned above. However, as discussed above, concrete dams exhibit time-variable dynamic properties when the dam is damaged during an earthquake, and some researchers have attempted to track time-variable modal parameter and the damage state evolution. For example, Cheng et al. 31 proposed a new recursive stochastic subspace identification (RSSI) method based on the generalized yet another subspace tracker to track the time-variable modal parameters of concrete dams during earthquakes, and the proposed method was verified by tracking the time-variable characteristics of the Pacoima arch dam during three different earthquakes. Li et al. 32 proposed an online modal parameter identification procedure based on the SSI algorithm and density-based spatial clustering of applications with noise (DBSCAN) algorithm for arch dams, and the proposed method was verified by the Dagangshan Dam. It can be seen that the research of vibration-based methodologies for time-variable concrete dams is still limited, and the application of these modal parameter methodologies for concrete dams also had some limitations or shortcomings like any other large structures33,34: (i) modal frequencies mainly depend on the global behaviors of the structure, while damage is often a local phenomenon; (ii) it was difficult to extract high-order modes that are more sensitive to minor damage, and to isolate the minor damage information from the influence of environmental variability and measurement noise; and (iii) computing burden for large and complex structures. Therefore, the quality and efficiency of damage identification for time-variable concrete dams under seismic loading should be improved.
In view of the advantages and wide application of time-dependent time series models in the damage identification of different time-variant structures, this paper aimed to provide an effective time-dependent time series method for the damage identification of time-variable concrete arch dams under seismic loading. The popular autoregressive with eXogenous (ARX) model is the simplest model incorporating the input signal, and has been one of the most widely used linear dynamic models due to its simple form and easy-to-compute model parameters. Moreover, the model coefficients of the ARX model had a direct correlation with structural stiffness, and combined with advantages such as convenient calculation, fine robustness, and high sensitivity to damage, 35 the ARX model had been one of the popularly employed damage identification methods. The TVARX model was developed from the ARX model, which is often utilized to establish the input–output relationship of a time-variable linear system. The recursive least-squares method was an online approach with fine computational efficiency in estimating the time-variable parameters of the TVARX model 30 but was slow in tracking the time-variable coefficients and highly sensitive to initial conditions. Hitherto, some techniques such as variable forgetting factors, the sliding window technique, and covariance matrix resetting, have been incorporated into the recursive least-squares method to minimize these shortcomings. To effectively identify and track the damage development of concrete arch dams under seismic loading, in this study, an adaptive adjustment algorithm of variable weighting factors was incorporated into the recursive least-squares method to establish an efficient recursive TVARX model. By applying the newly established recursive TVARX model to analyze the real-time measured vibration response of a concrete arch dam, the predicted model residual was proposed to identify the presence of damage (i.e., the exact time instant of damage) occurring on the dam. Once the presence of damage on the concrete arch dam was identified, the identification of the damage position became the next goal in this study. Generally, concrete arch dams have large volumes and limited arranged dynamic sensors, so the accurate space coordinate of damage is difficult to determine. In addition, the vibration responses of different measuring points had different sensibility to damage, and the measuring points close to the damage location had better sensitivity. According to this feature, based on the positions of the arranged dynamic sensors, the dam body was divided into several areas. Then the damage can be located in a certain area, in which the dynamic sensor had the greatest sensibility to damage. Therefore, the goal of determining the damage position is converted into the identification of the rough damage area on the dam. To effectively identify the damage area of a concrete arch dam, after determining the presence of damage, a damage index named the fit ratio (FR) and the difference between fit ratios (DF) were proposed as damage indexes. By comparing the DF parameter for different measuring points at the damaged periods, the damage area can be located, in which the measuring point had the largest DF parameter. Furthermore, considering the relationship between the ARX model parameters and structural stiffness, a damage index based on the change in ARX model parameters (CH) was proposed to identify the relative damage extent of the concrete arch dam.
In this study, assuming that the mean value of the vibration response is zero or constant, the non-stationary vibration was modeled and analyzed using the established model, which was based on a single collected vibration response and input response. By analyzing the collected vibration responses for different measuring points, the goal of this study was attempted to be achieved. To verify the effectiveness of the proposed approach, the online damage state identification of arch dams was carried out by a numerical simulation example and a dynamic model test, and the identification results demonstrate the effectiveness of the proposed approach.
The contribution of this paper can be summarized as follows:
A recursive TVARX model was proposed, in which an adaptive adjustment algorithm of variable weighting factors was incorporated into the recursive least-squares method to improve the tracking capability for the time-variable coefficients of the TVARX model.
A framework of online damage identification for concrete arch dams in three aspects: identifying the presence of damage, the rough damage area, and the relative damage extent of damage on arch dams. It was based on the proposed recursive TVARX approach, which promoted the development of damage identification of concrete dams under dynamic loads.
The rest of this article is organized as follows: the recursive TVARX approach is proposed in Section “The recursive TVARX approach.” Section “Examples” validates the proposed approach by a numerical arch dam model and an experimental arch dam model. Conclusions are given in Section 4.
The recursive TVARX approach
Recursive TVARX model with weighting factors
When the output responses and input of a time-variable dynamic system are measured, the mathematical expression of the TVARX model can be built 30
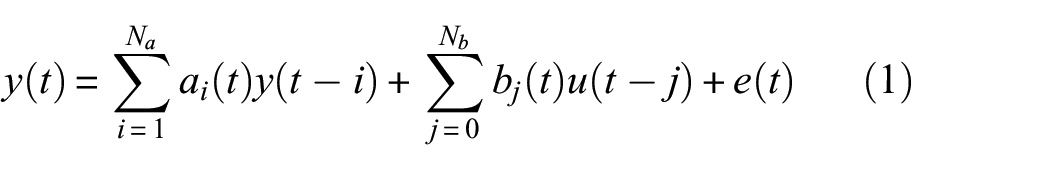
where
The model orders of the ARX model are determined by an iterative order determination method proposed by Entezami and Shariatmadar. 36
Equation (1) can also be rewritten in the following form:

where
Supposing the initial time instant is
At time instant
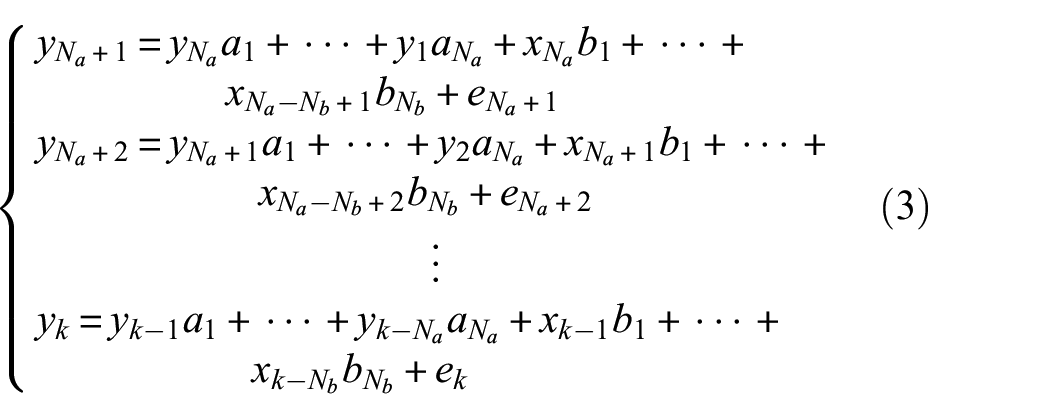
The time-invariant ARX model coefficients vector
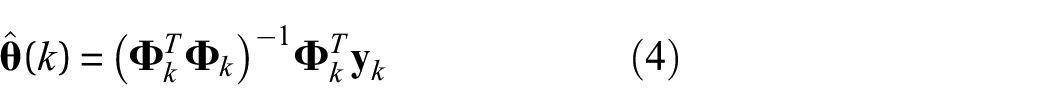
where
To expediently express the recursive equations, denote the covariance matrix
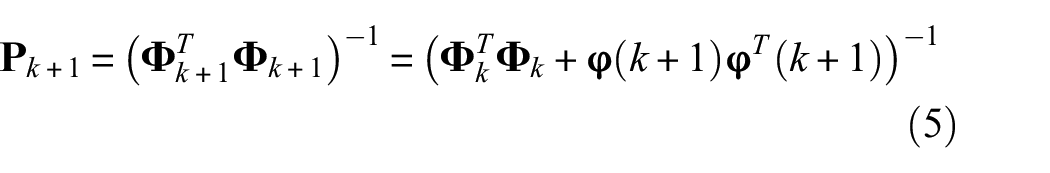
The inversion of Equation (5) is:
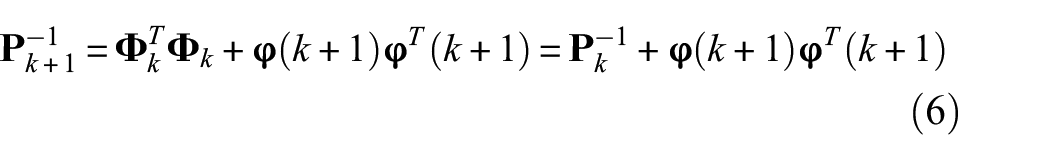
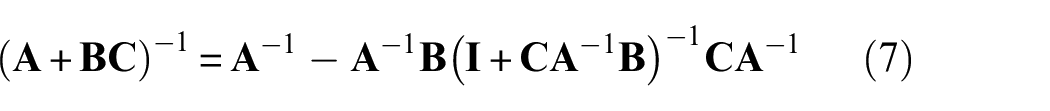
Using the matrix inversion formula:
Equation (6) can be equivalently written as:
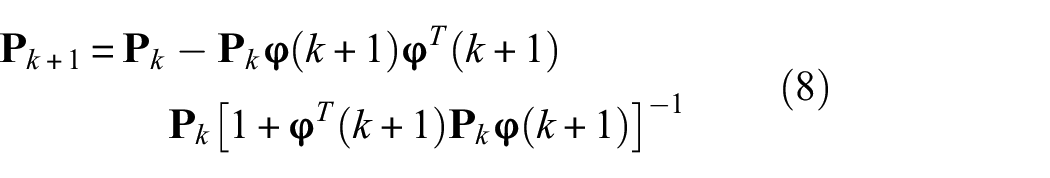
Based on the above equations, the recursive least-square method is used to realize the recursive estimation of TVARX model coefficients


where
Considering the different influences of new response information and old response information on the structural health state, the weighting factor is introduced to provide different weights for new response information and old response information, thus modifying the objective function and minimizing the objective function
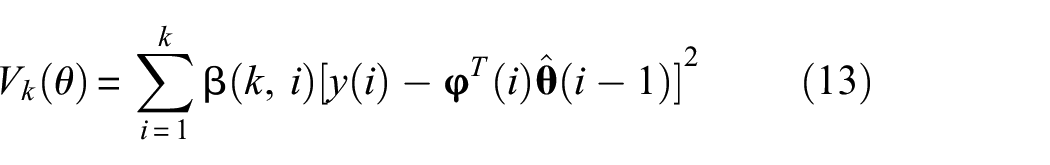
where
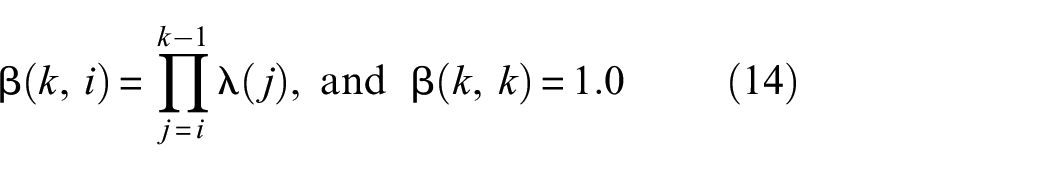
The above Equations (13) and (14) demonstrate that the previous response information is gradually forgotten with increasing time. The smaller the weighting factor
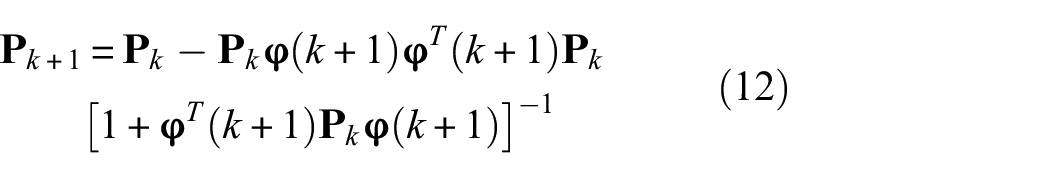
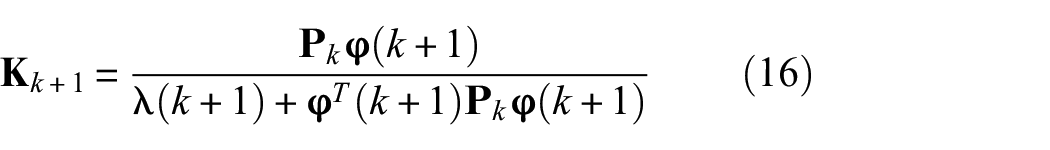
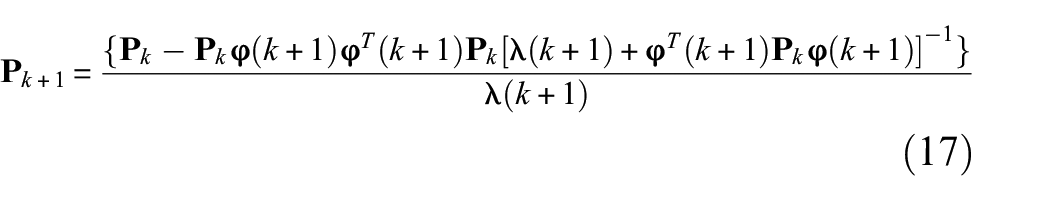
Based on Equations (9)–(13), the weighted recursive least-square equations of the TVARX model parameter

Since the amplitude of the seismic loading in the initial short period from the beginning to
Calculation of the variable weighting factor
For the time-variable structural system, its dynamic properties do not vary with a certain trend, that is, sometimes it changes quickly, sometimes it changes very slowly, and occasionally a sudden change may occur. To effectively track the parameter change of the structural system, it is necessary to adaptively adjust the weighting factors according to the changing speed of the system parameter. The greater the change in the system parameters, the greater the model residual will be. When the model residual changes obviously, the old information in the previous period should be suppressed, and the effect of new dynamic response information should be improved to ensure the accuracy of the model. Then, variable weighting factors are studied based on the change in the model residual as follows:
Equation (10) lists the prior model residual, and the posterior model residual is defined:

Substituting Equations (9) and (10) into Equation (18), the following equation is obtained:

Supposing the measured response contains noise term

By substituting Equations (16) and (19) into Equation (20), and simultaneously considering the weighting factor to be negatively correct with the model residual, the following equation is obtained:
where
Since the actual input response and output response are not related to noise, the variable weighting factor is obtained by solving Equation (21) as follows:
where
In addition, the estimated values of

where
The noise term

where
Theoretically, there is the relationship that

where
For other situations, the variable weighting factor is estimated as follows:
where
Therefore, Equations (15), (16), (17), (26), and (27|) constitute the recursive TVARX approach with variable weighting factors. By analyzing the changes in the model parameters in the TVARX model, the evolution of the structural damage can be identified.
The damage indexes for the concrete arch dam
To effectively identify the presence of structural damage, a damage index extracted from the obtained ARX model coefficients and residual errors are proposed.
(1) Identify the presence of damage on the concrete arch dam
Under seismic load action, the output and input responses can be obtained from the arranged sensors. The predicted response at
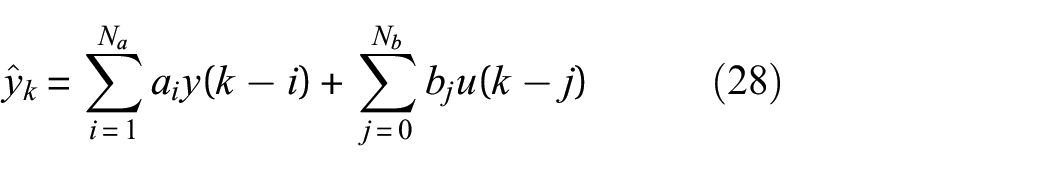
where
When there is no damage or damage development on the dam, the concrete dam is a linear time-invariant system, and the dynamic response of the dam is stable. After determining the optimal model order, the above recursive ARX model can be used to describe the linear time-invariance process, and the model residual sequence approximates white noise
(2) Identify the damage area of the arch dam
Once the presence of damage on the concrete arch dam is identified, the identification of the damage position becomes the next goal. Generally, concrete arch dams have large volumes and limited arranged dynamic sensors, so the accurate space coordinate of damage is difficult to determine. In addition, the vibration responses of different measuring points have different sensibility to damage, and the closer the measuring point is to the damage position, the greater sensibility to damage its vibration response is. According to this feature, based on the positions of the arranged dynamic sensors, the dam body is divided into several different areas. Then the damage can be located in a certain area, in which the dynamic sensor has the greatest sensibility to damage. Therefore, the goal of determining the damage position is converted into the identification of the rough damage area on the dam.
As mentioned above, the predicted response substantially deviates from the measured vibration response when the dam is damaged. Obviously, the largest deviation occurs on the measuring point nearest to the damage position. Since the response amplitudes for different measuring points are different, a damage index named the FR and the DF are proposed to normatively describe the deviation for different measuring points.
The FR of an ARX model is calculated as follows:
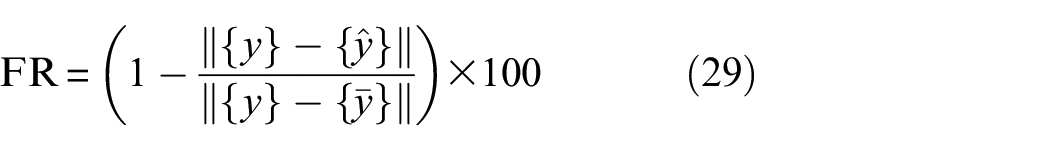
where
FR is calculated for the damage period and the previous nondamage period. Then, the difference between FR in the two periods is calculated:
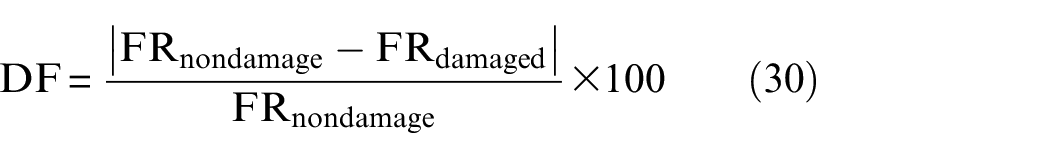
By comparing the DF parameter for different measuring points at the damaged periods, the damage area can be located, in which the measuring point has the largest DF parameter.
(3) Identify the relative damage extent of the arch dam
The ARX model parameters are related to the stiffness and damping of the dam, and the ARX model parameters will change due to damage to the concrete arch dam. Obviously, the greater the damage extent is, the greater the change in the ARX model parameters. Thus, the following structural damage evaluation index based on the change in ARX model parameters (CH) is proposed:
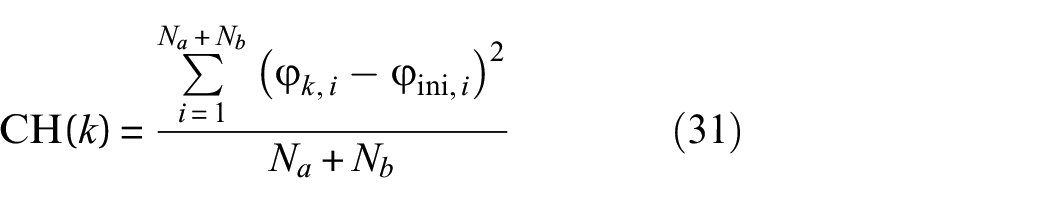
where
Examples
Numerical simulation example
Dynamic simulation of a concrete arch dam
Taking a concrete arch dam as an example, a three-dimensional dynamic finite element simulation analysis was carried out. The main benefits of this project include producing electricity, and flood prevention, and the normal reservoir level is 1880 m. Figure 1 shows the planform of the dam body and the diagram of arch crown beam section A-A. It can be seen that this dam is a dome dam, and the thicknesses of the dam body at different elevations can be seen in Figure 1(b). The blue marked fonts in Figure 1(b) designate elevations, and the red marked fonts designate the thickness of the arch crown beam section A-A in the corresponding elevation. The dam crest elevation is 1885.0 m, and the lowest dam foundation elevation is 1580.0 m. The maximum dam height is 305.0 m, the dam crest width is 16.0 m, and the dam bottom thickness is 63.0 m.
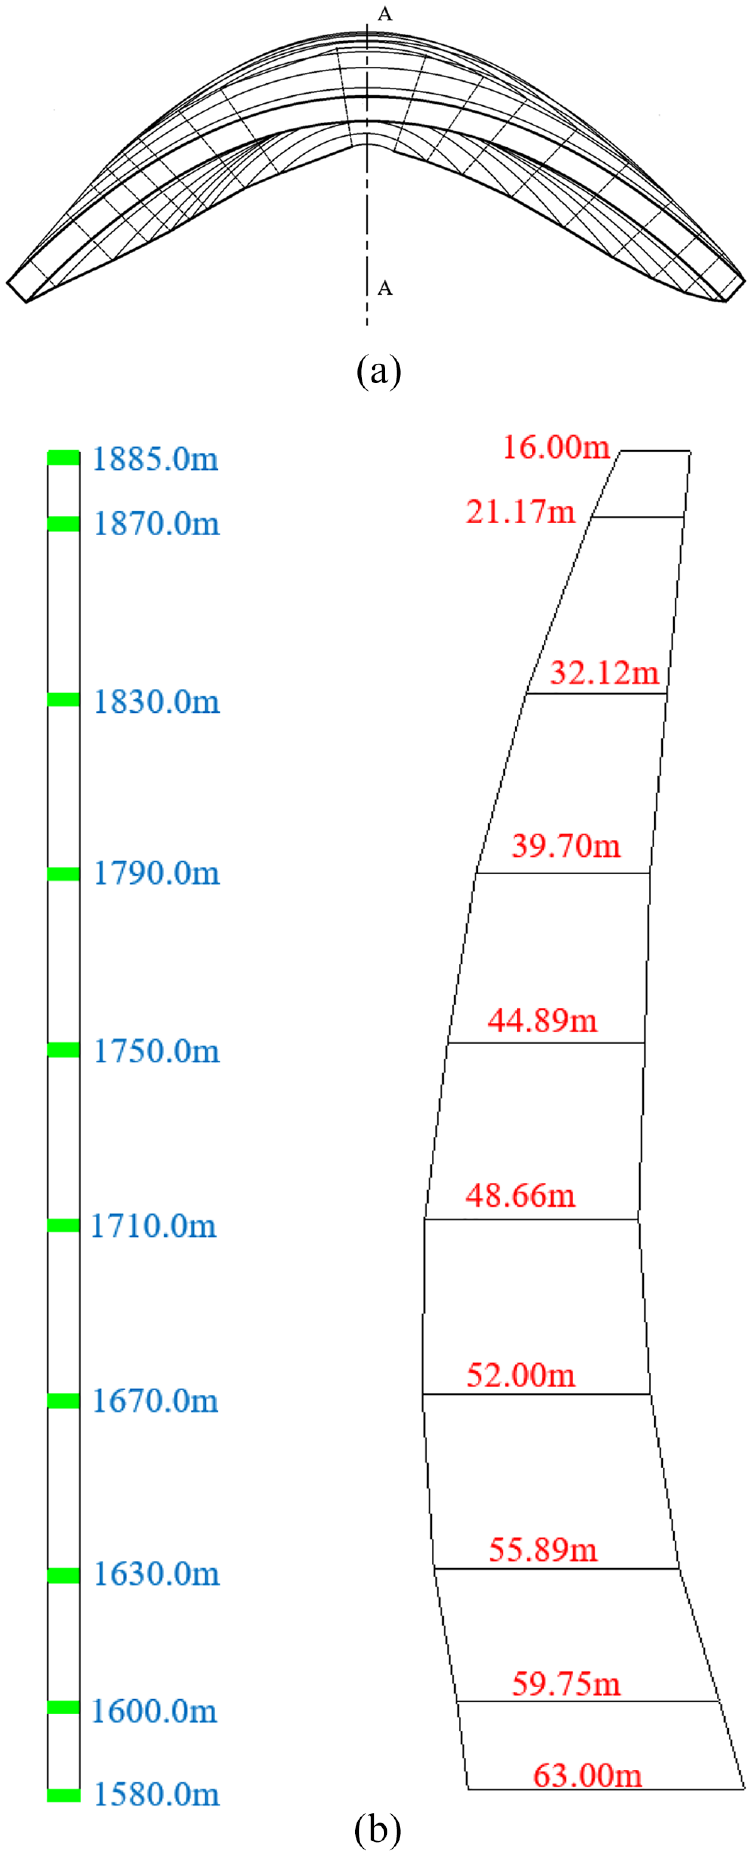
The planform of the dam body and the diagram of arch crown beam section A-A: (a) planform of the arch dam body and (b) section A-A.
Figure 2 shows the finite element model of the arch dam. The model was extended 2.5 times the dam height for the upstream and downstream directions, and it was extended two times the dam height for the direction toward the foundation. The numerical simulation was simplified, and the transverse joints were not considered. The 8-node hexahedron C3D8R element was used for meshing. The entire model had 56,921 nodes and 50,714 elements, including 4696 elements in the dam body.
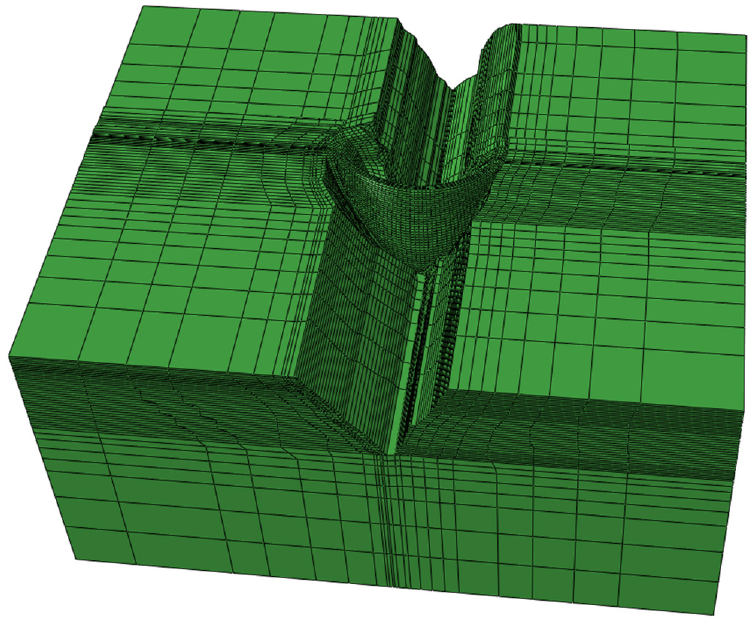
Finite element model of a concrete arch dam.
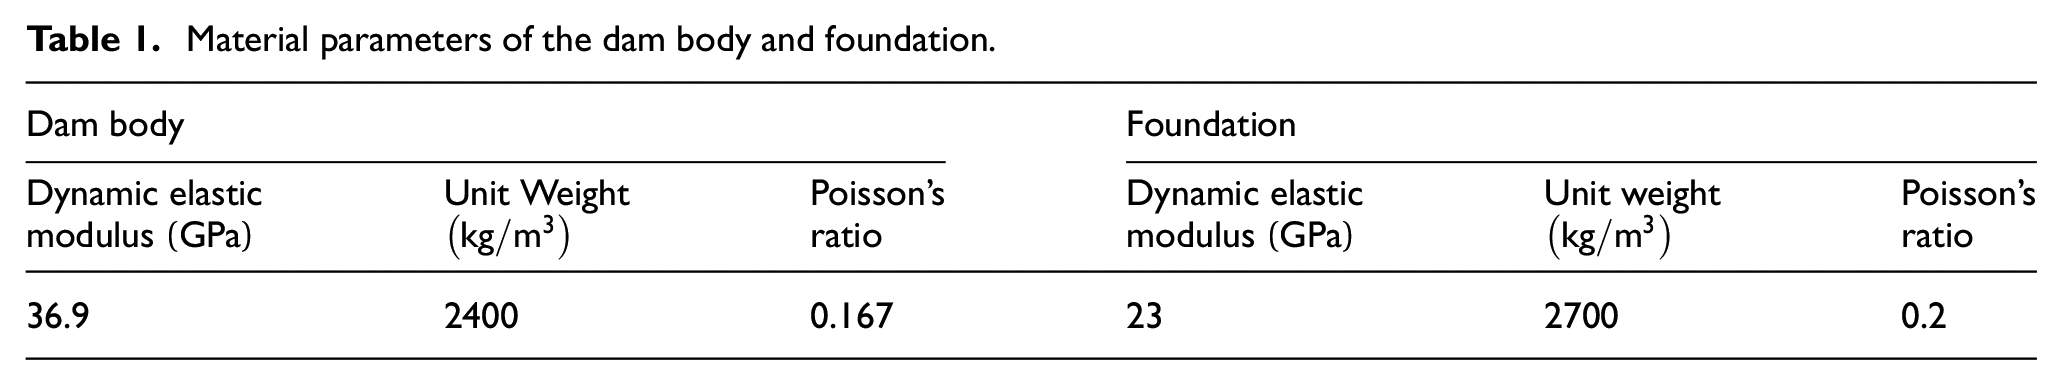
Table 1 shows the material parameters of the dam body and foundation, in which all the dam foundation material was assumed to be one material. In this simulation, the foundation was considered a massless foundation. Rayleigh damping
Material parameters of the dam body and foundation.
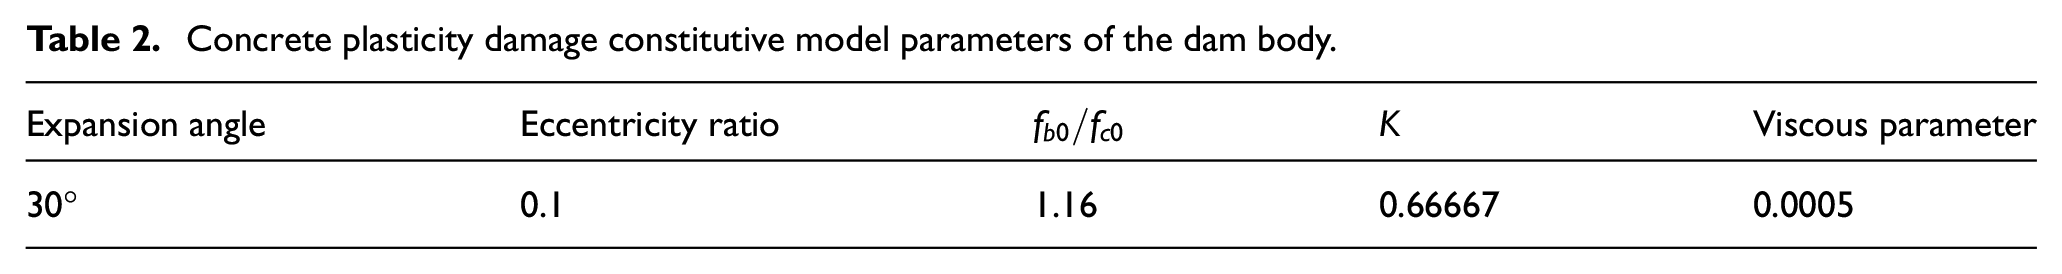
Concrete plasticity damage constitutive model parameters of the dam body.
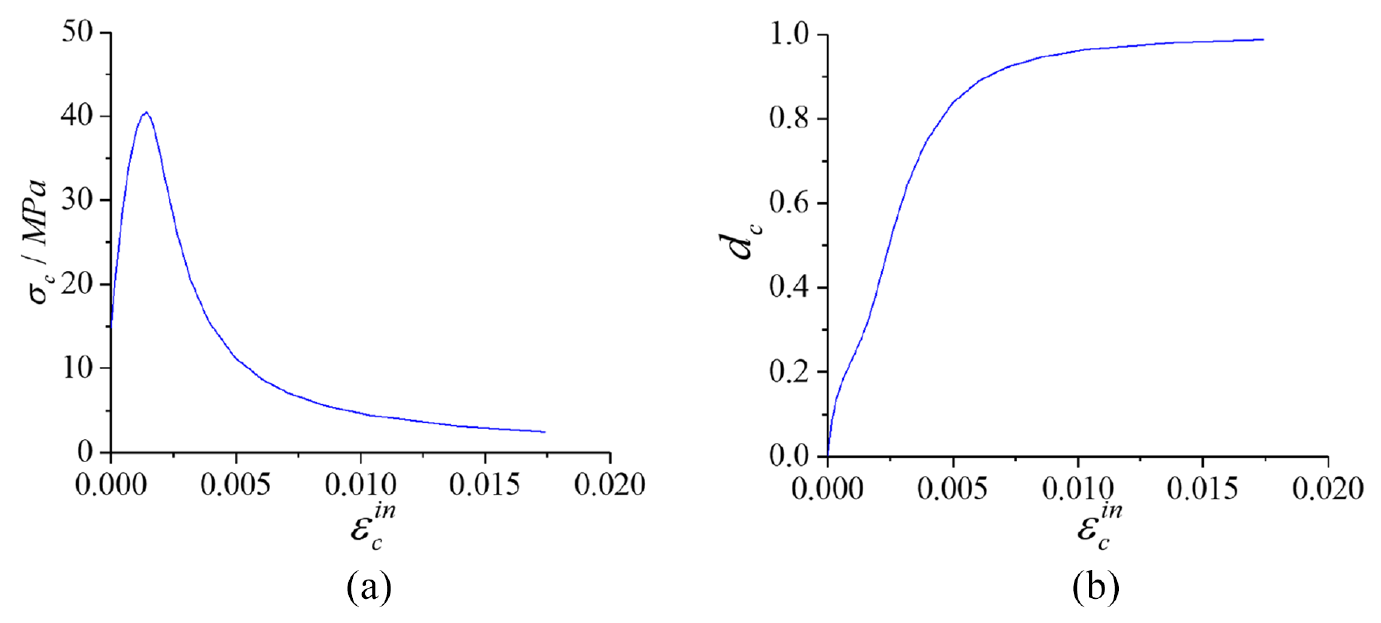
Relationship curve between the compressive stress
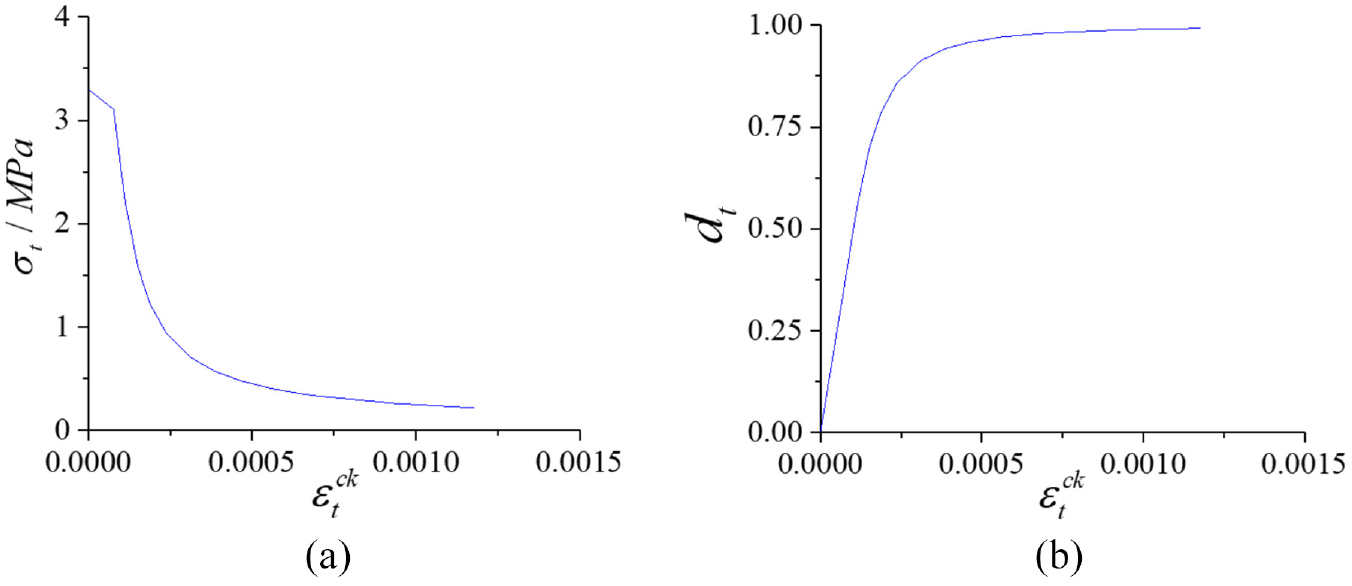
Relationship curve between the tensile stress
The additional mass method was used to consider the hydrodynamic pressure, 29 and its computational formula was given:
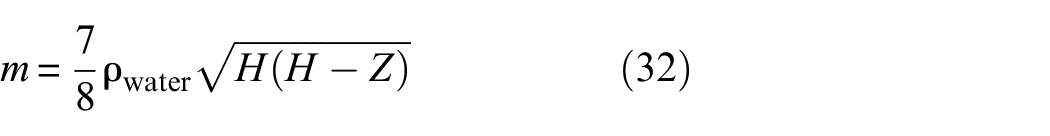
where
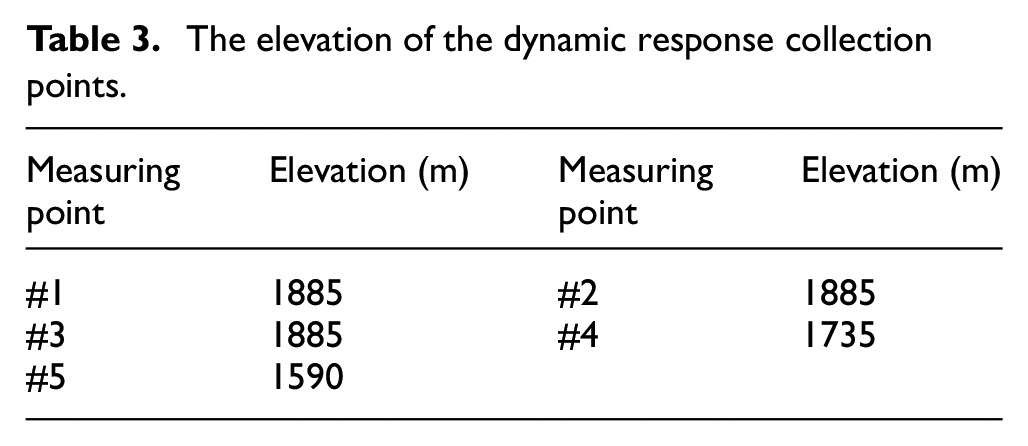
To simulate damage to the concrete arch dam, a dynamic load was designed according to the structural properties of the dam, through which the low-order frequency of the arch dam can be excited. The acceleration peak value and the duration of the designed dynamic load were 0.4 g and 25.0 s, respectively, and the load direction was along the river. The time history curve and Fourier spectra of the dynamic load is shown in Figure 5. Large-scale finite element software was used for the structural calculation, and the subroutine of the additional mass method was compiled to consider the interaction between the water and the dam. The collection time was 25 s, and the measurement points are shown in Figure 6. Table 3 lists the elevation of the collection points, and the sampling frequency is taken as 100 Hz.
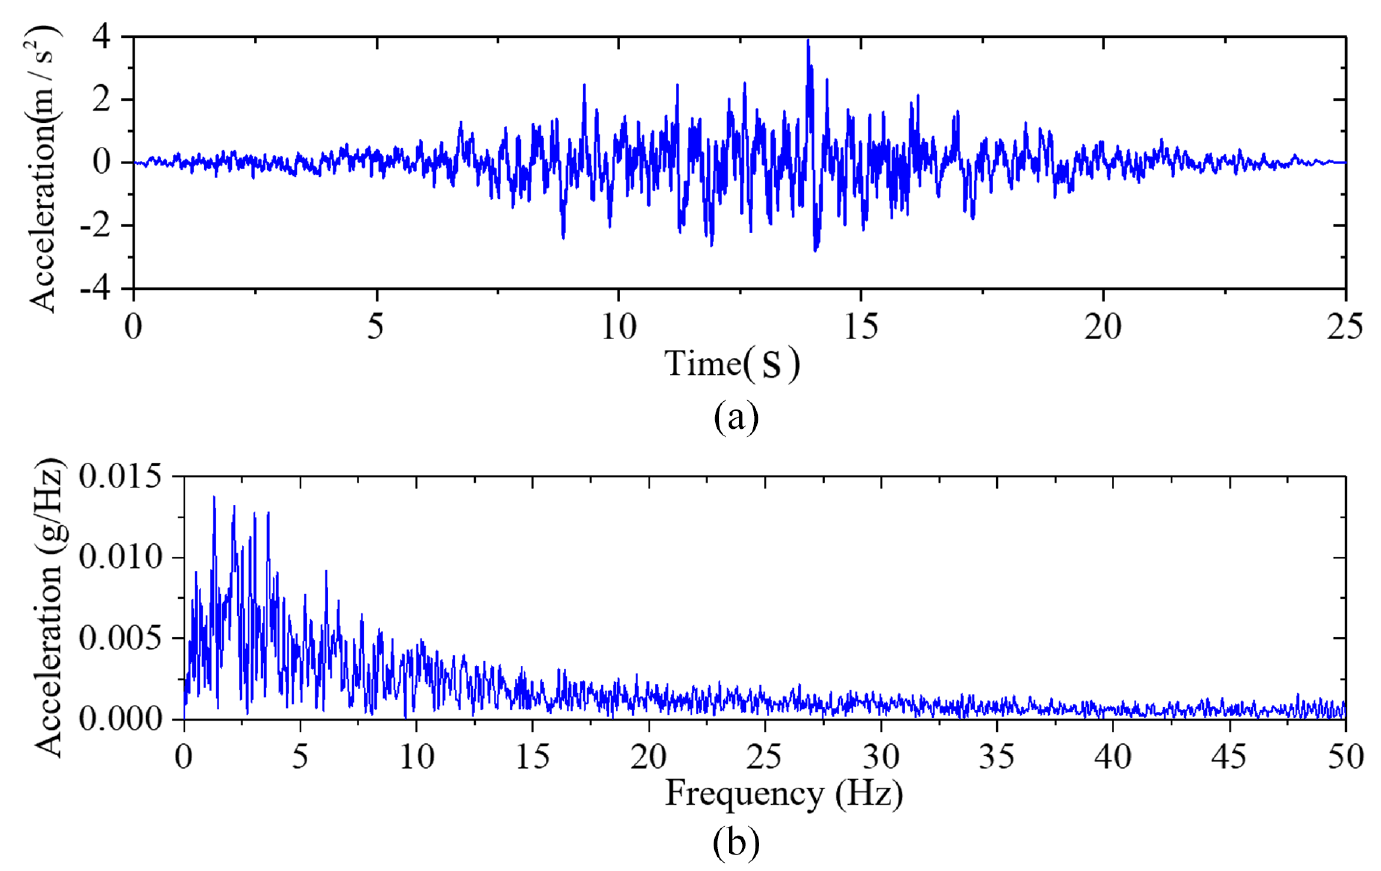
Time history curve and Fourier spectra of the horizontal seismic acceleration: (a) time history curve and (b) Fourier spectra.
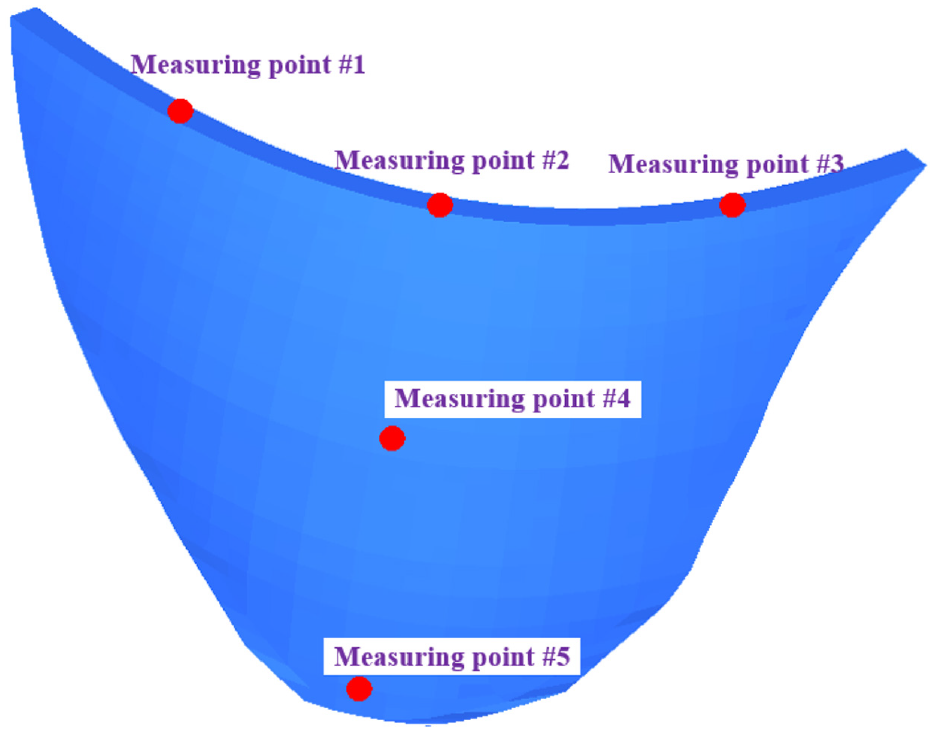
The location of the dynamic response collection points.
The elevation of the dynamic response collection points.
Simulation result analysis of the concrete arch dam model
The acceleration of the collection points on the arch dam is shown in Figure 7, and the location of each measurement point was shown in Figure 6. With the increase in the elevation of the measurement points, the dynamic response showed an increasing trend as a whole. Among the three measuring points at the top, the dynamic response of measuring point #2 was the largest, and the dynamic responses of measuring points #1 and #3 on both sides of the dam crest were relatively small.
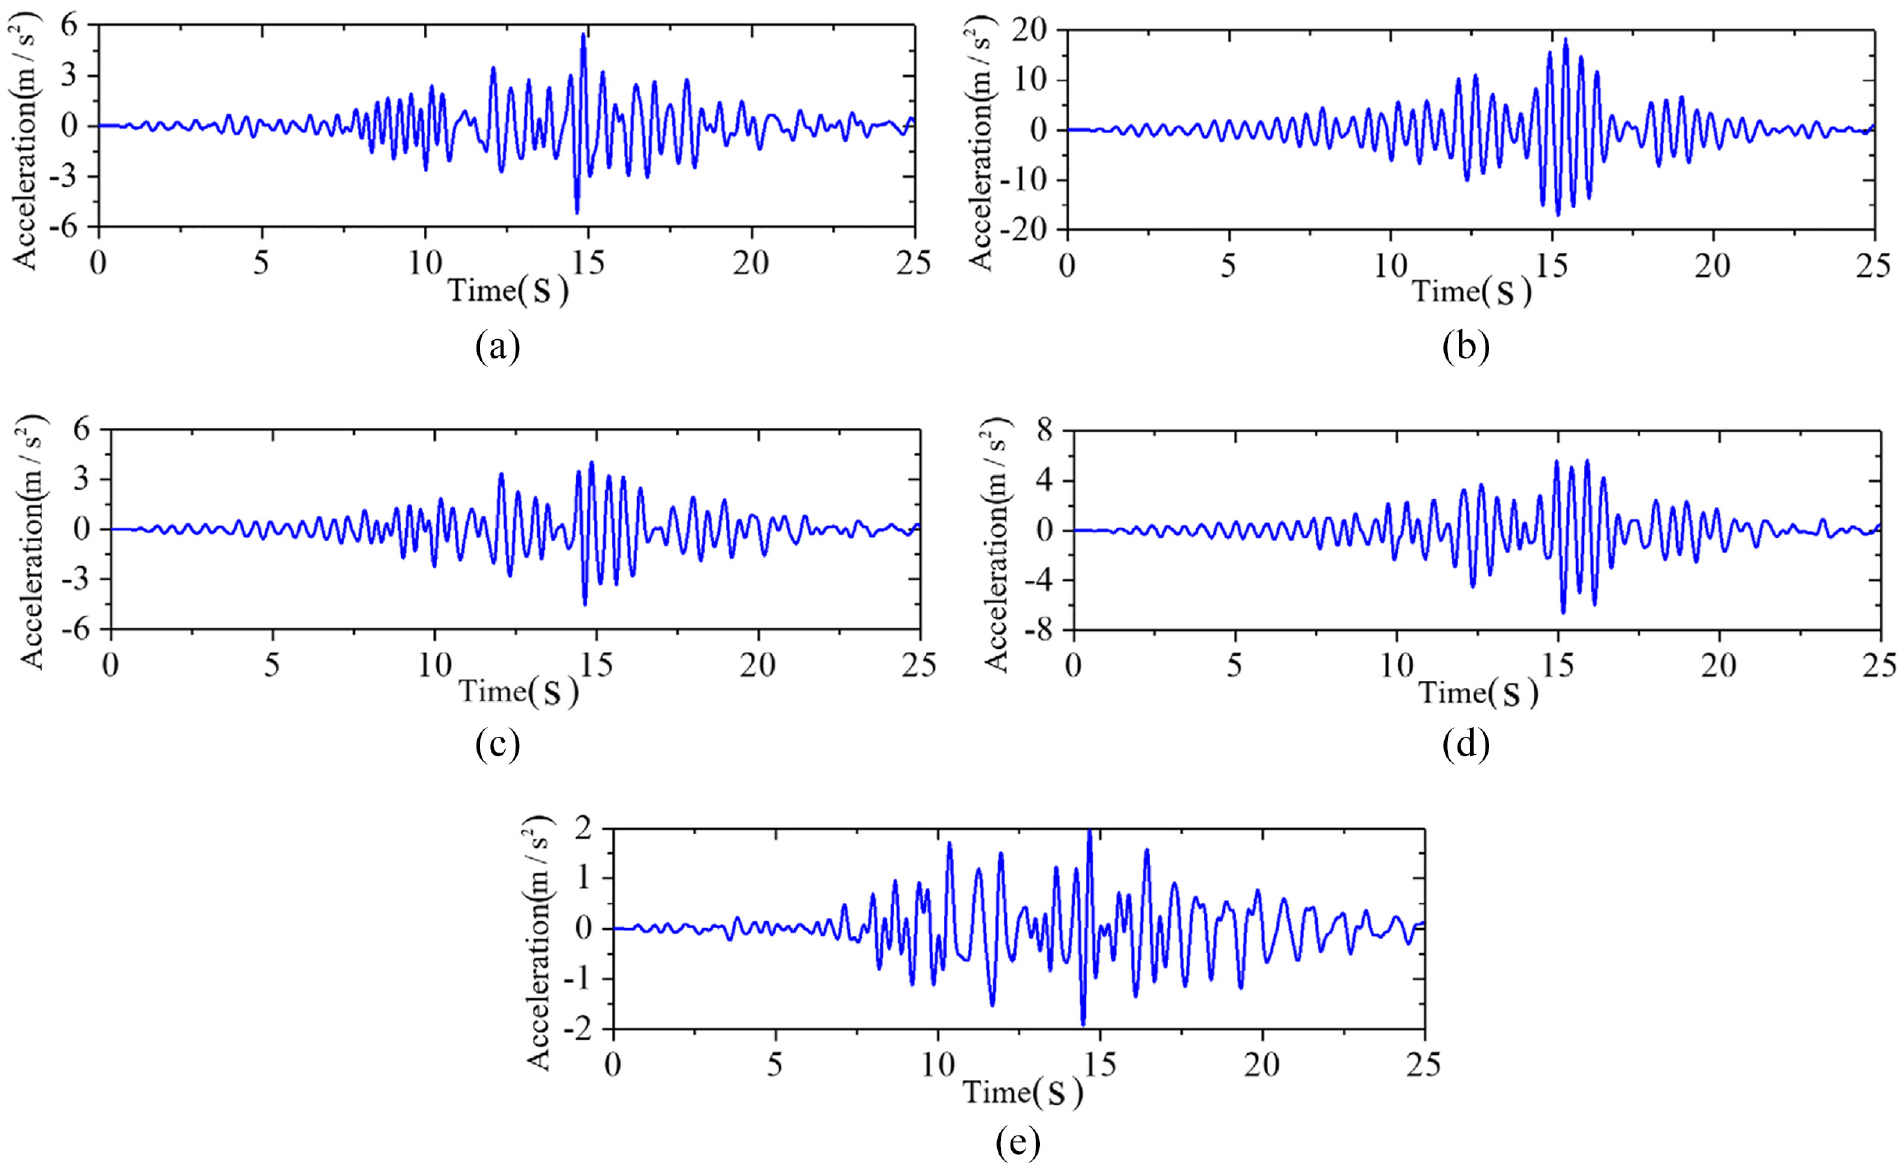
Time history curve of the dynamic response at each measurement point: (a) measuring point #1, (b) measuring point #2, (c) measuring point #3, (d) measuring point #4, and (e) measuring point #5.
Figure 8 shows the tensile damage of the dam body at
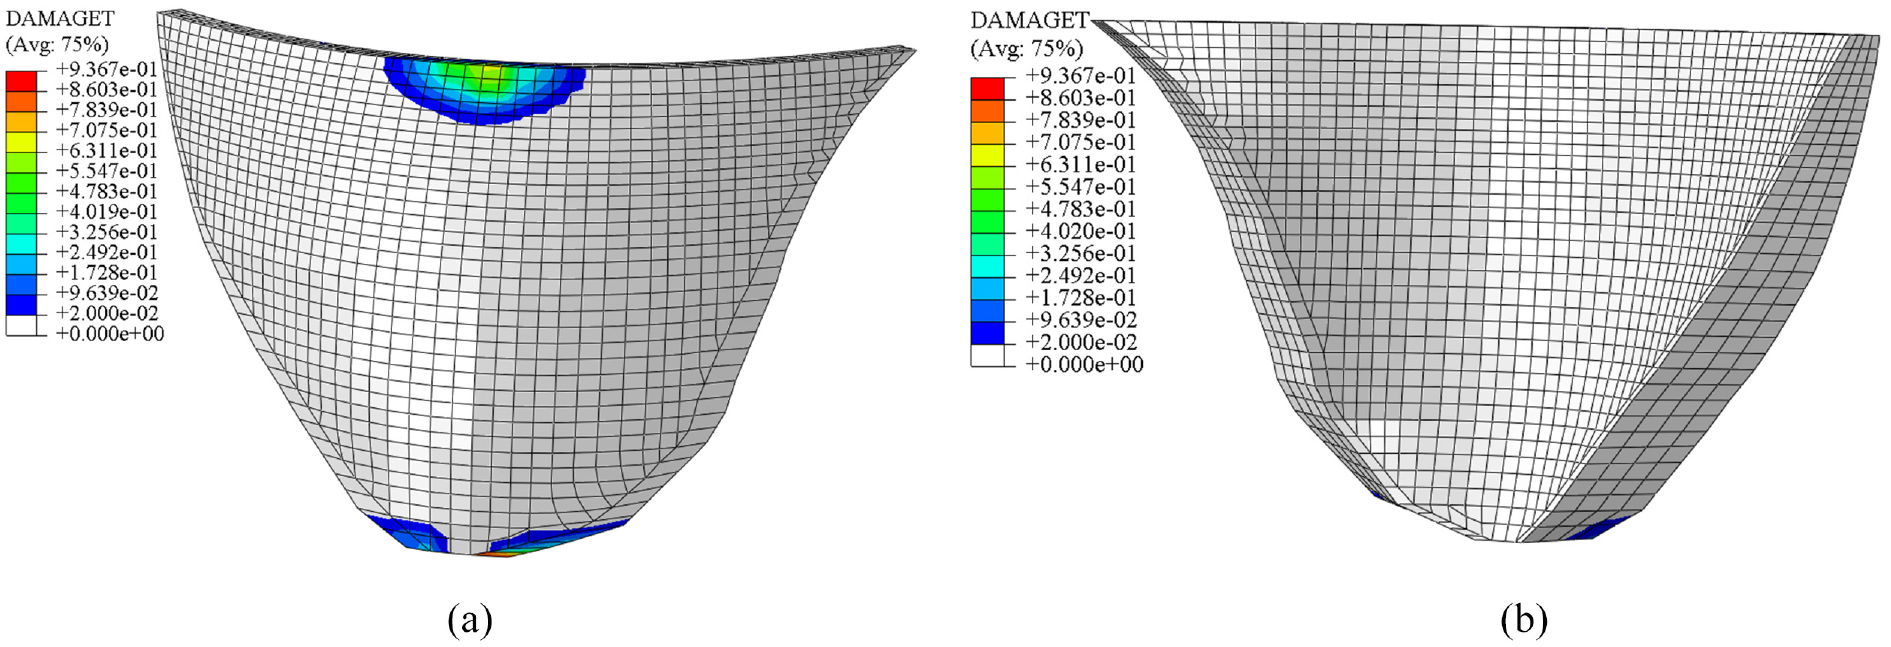
Tensile failure diagram of the dam body at
To visually display damage development over time, it was necessary to draw the process line of the tensile damage factor DAMAGET in the positions of the arch crown, heel, left abutment, and right abutment over time, as shown in Figure 9. The tensile damage factor DAMAGET in the left abutment and right abutment were 0, which indicated that there was no damage on the two parts. While the dam heel starts to show damage at
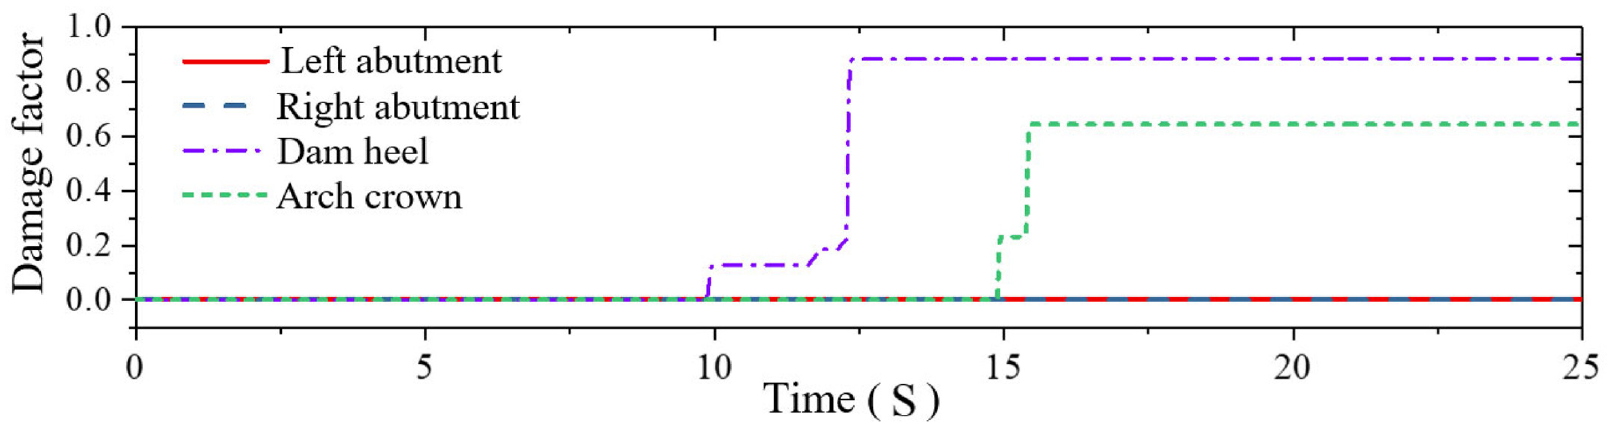
Time history of the damage factors at different locations of the dam.
To verify the effectiveness of the algorithm proposed in this paper, the dynamic response of each measuring point shown in Figure 6 is selected for analysis. First, the noise-free dynamic response was used for identification analysis, and then the influence of different levels of noise on the model identification results was studied.
The noise-free dynamic response analysis
Before applying the proposed algorithm to the analysis for each measuring point, the ARX model order should be determined. In this study, different model orders were selected to analyze the vibration response in the period of the first 2 s, and the optimal ARX model order was finally obtained by using an iterative order determination method proposed by Entezami and Shariatmadar. 36 Table 4 shows the optimal ARX model order for each measuring point.
The ARX model order of each measuring point.
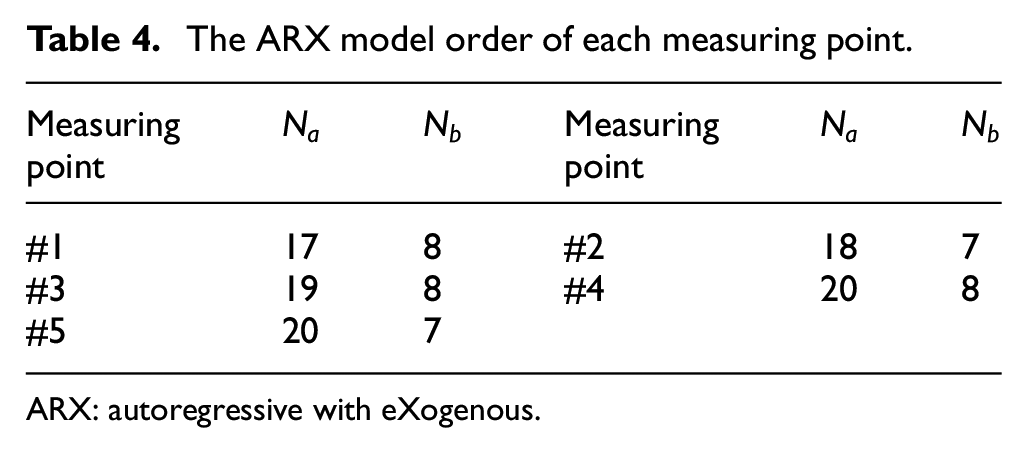
ARX: autoregressive with eXogenous.
Identify the presence of damage
Then, the proposed recursive TVARX model was used to analyze the vibration responses for different measuring points, and the period from 0 to 1.0 s was taken as the initial dynamic response period. Figure 10 shows the identified predicted residual of the five measuring points, and three times the model residual variance for each measuring point in the initial nondestructive state are 0.0021, 0.0023, 0.0019, 0.0024, and 0.0011. The predicted residuals begin to suddenly change at measuring point #5, which was located at the bottom of the crown. For measuring point #5, the excessive changing periods were
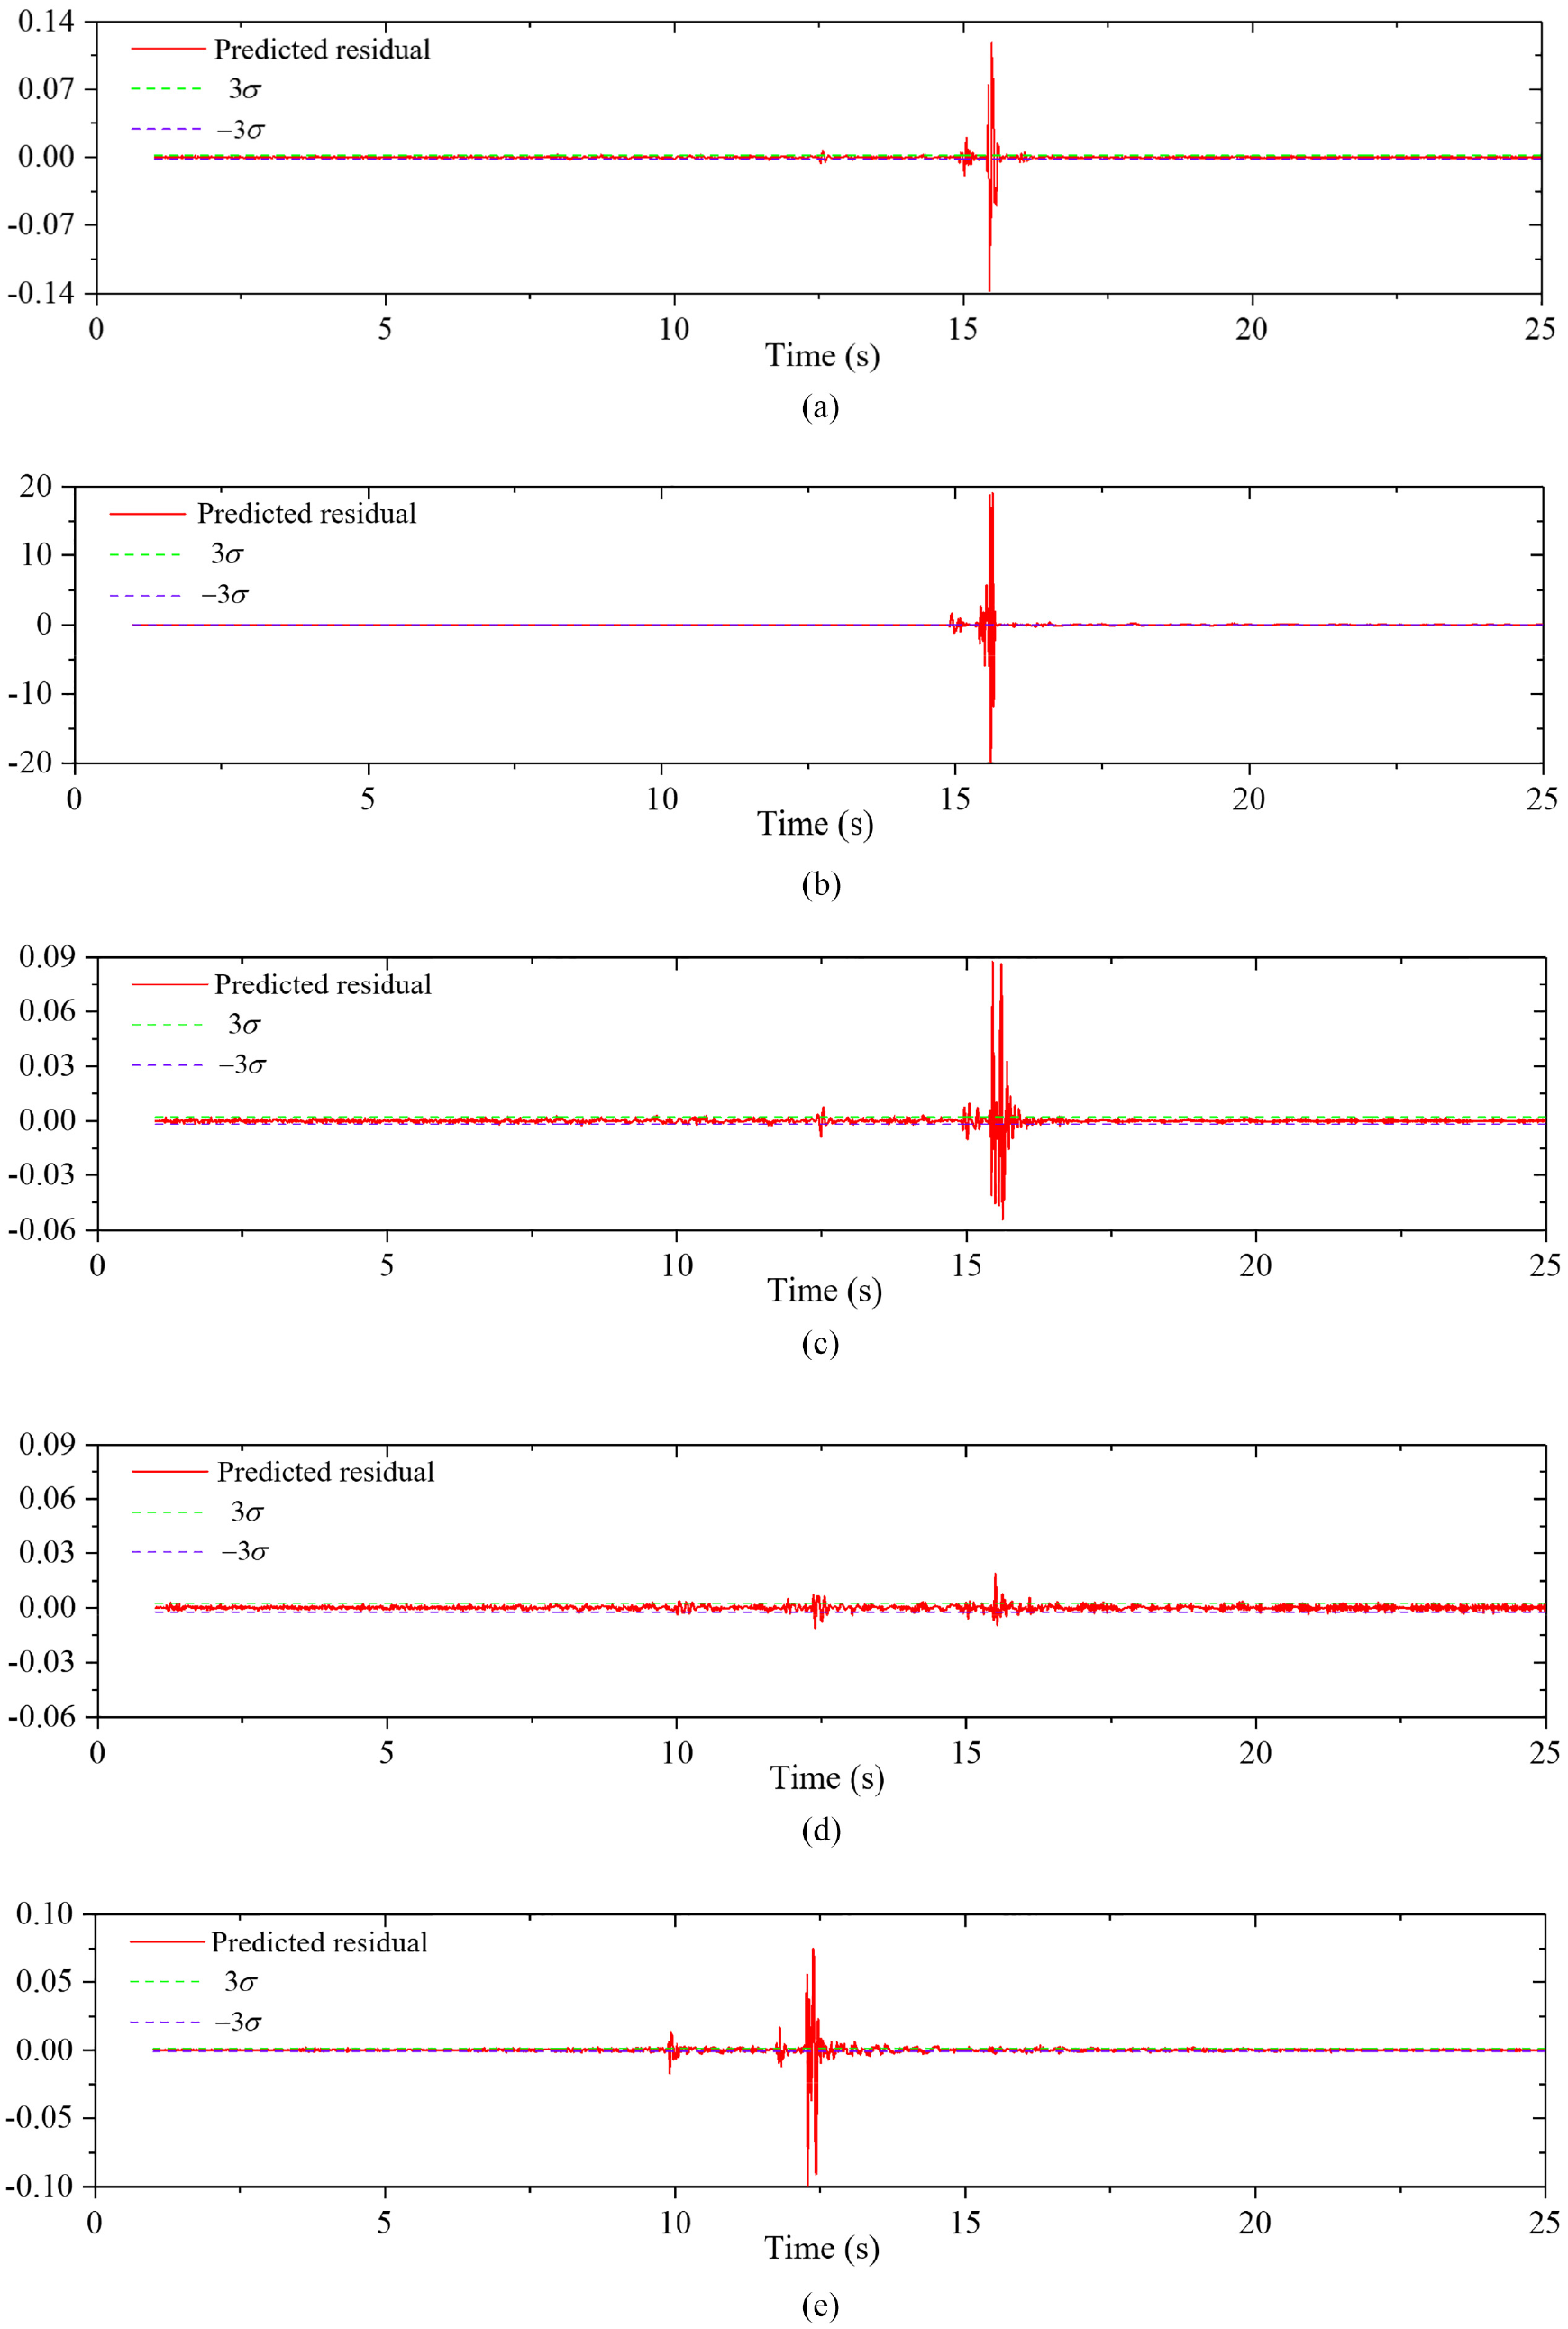
Predicted residual of the five measuring points: (a) measuring point #1,
Identify the damage area
After determining the presence of damage on the concrete arch dam, the identification of the damage position was the next goal. As mentioned above, the identification of the damage position was converted into the damage area location, and the dam body was divided into five parts based on the positions of the five measuring points, as shown in Figure 11. For the calculation of parameters FR and DF according to Equations (29) and (30), the calculation duration was taken as 0.2 s for both damaged and undamaged conditions. The nondamage period was selected as t = 1.0–1.2 s, and the damaged period started from the exact time of damage as analyzed above.
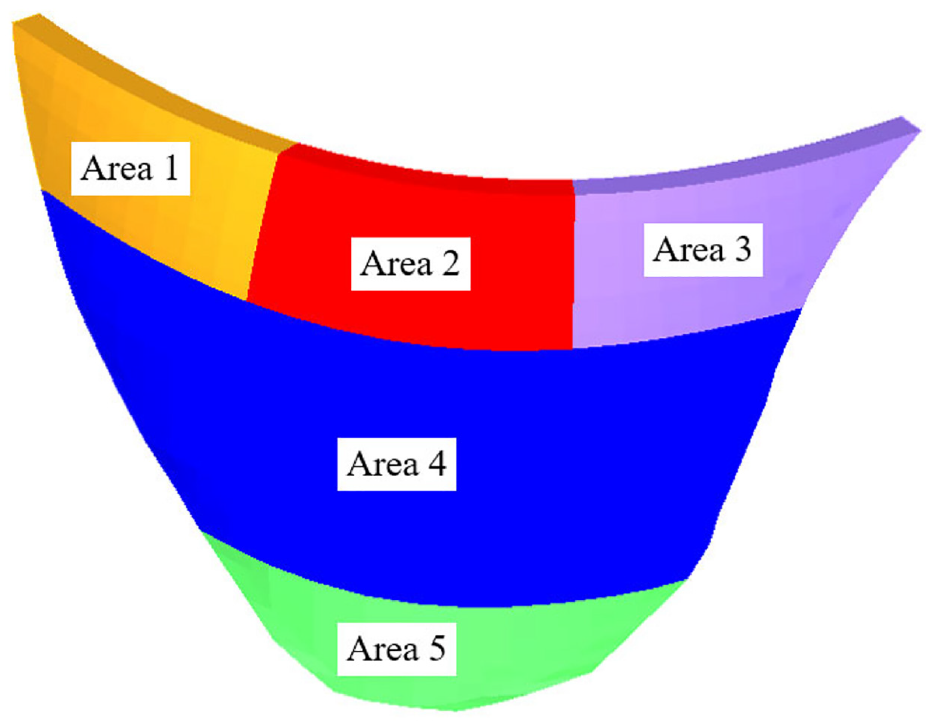
The divided five areas of the dam body.
Figure 12 shows parameter DF for each measuring point at the identified damage periods. It can be seen that parameter DF of measuring point #5 was larger than other points in the periods t = 9.87–10.07 s, t = 11.74–11.94 s, and t = 12.34–12.54 s, so the damage position was identified in Area 5 at these three periods. In the subsequent two periods t = 14.94–15.14 s and t = 15.43–15.63 s, parameter DF of measuring point #2 is the largest, so the damage position was identified in Area 2 in the two periods. The identification result was consistent with the simulated result.
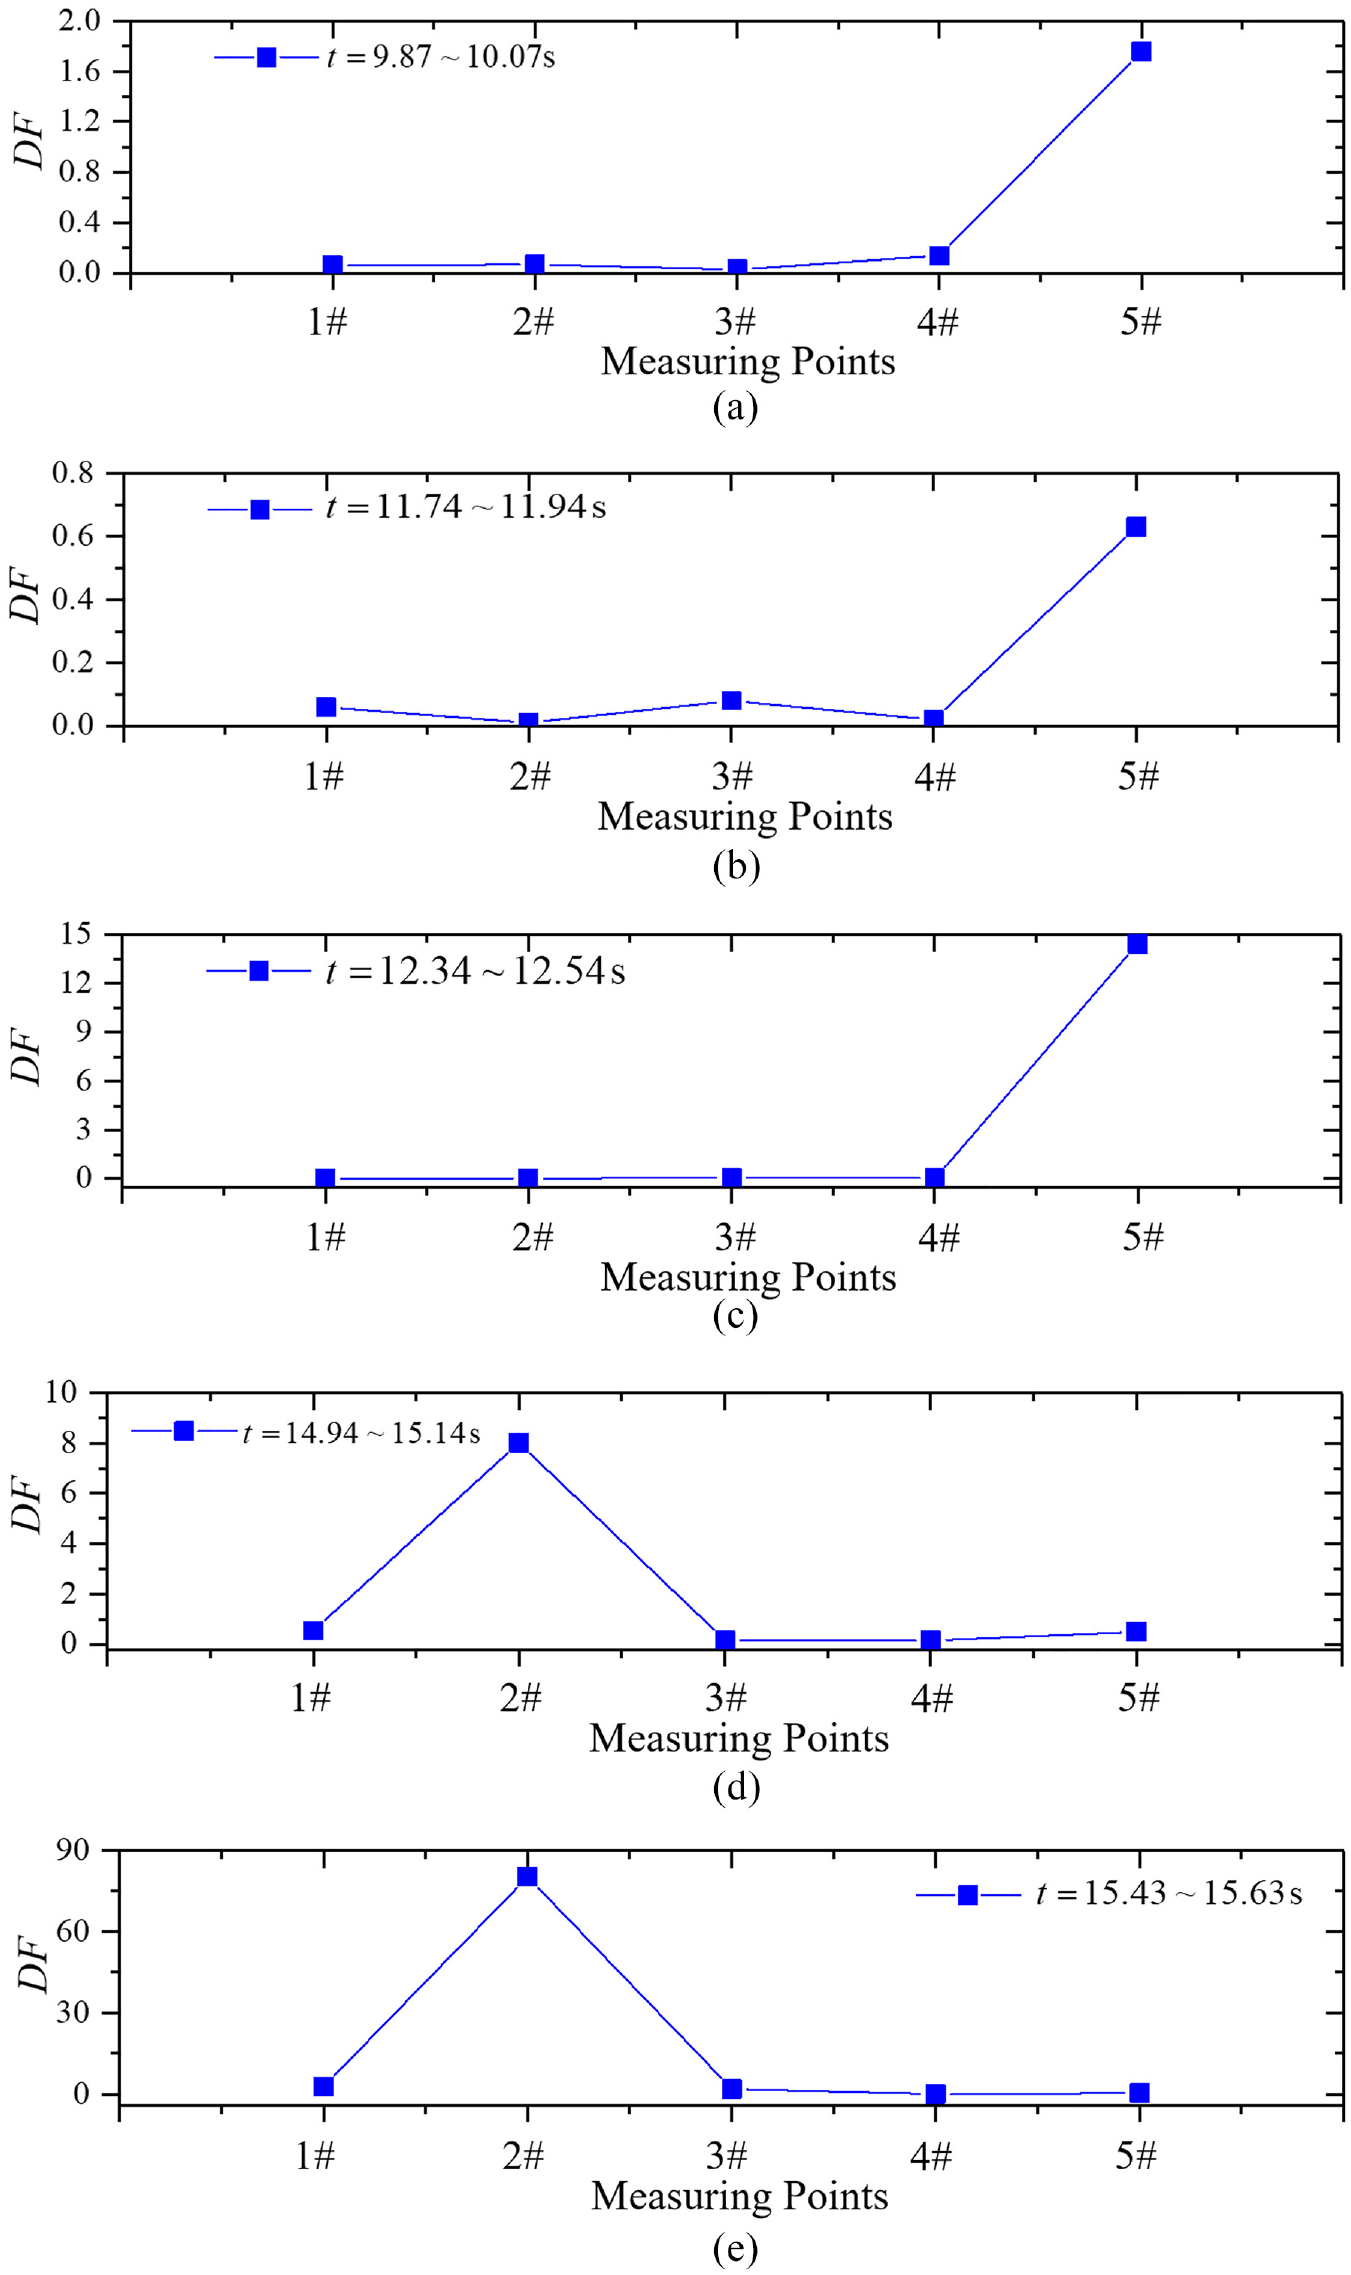
Parameter DF for each measuring point at the identified damaged periods: (a) t = 9.87–10.07 s, (b) t = 11.74–11.94 s, (c) t = 12.34–12.54 s, (d) t = 14.94–15.14 s, and (e) t = 15.43–15.63 s.
Identify the relative damage extent
After determining the damage position of the dam body, the relative damage extent should be identified in the next phase. Figure 13 shows the parameter CH of the five measuring points. It can be seen that parameter CH of each measuring point increases when damage occurred or increased on the dam, and the time of the change in parameter CH for each measuring point was generally consistent with the damage periods of the dam body. Obviously, the identified CH value of each measuring point was consistent with the damage extent and development process of the dam body. Thus, the identified CH can be used to identify the relative damage extent of the arch dam.
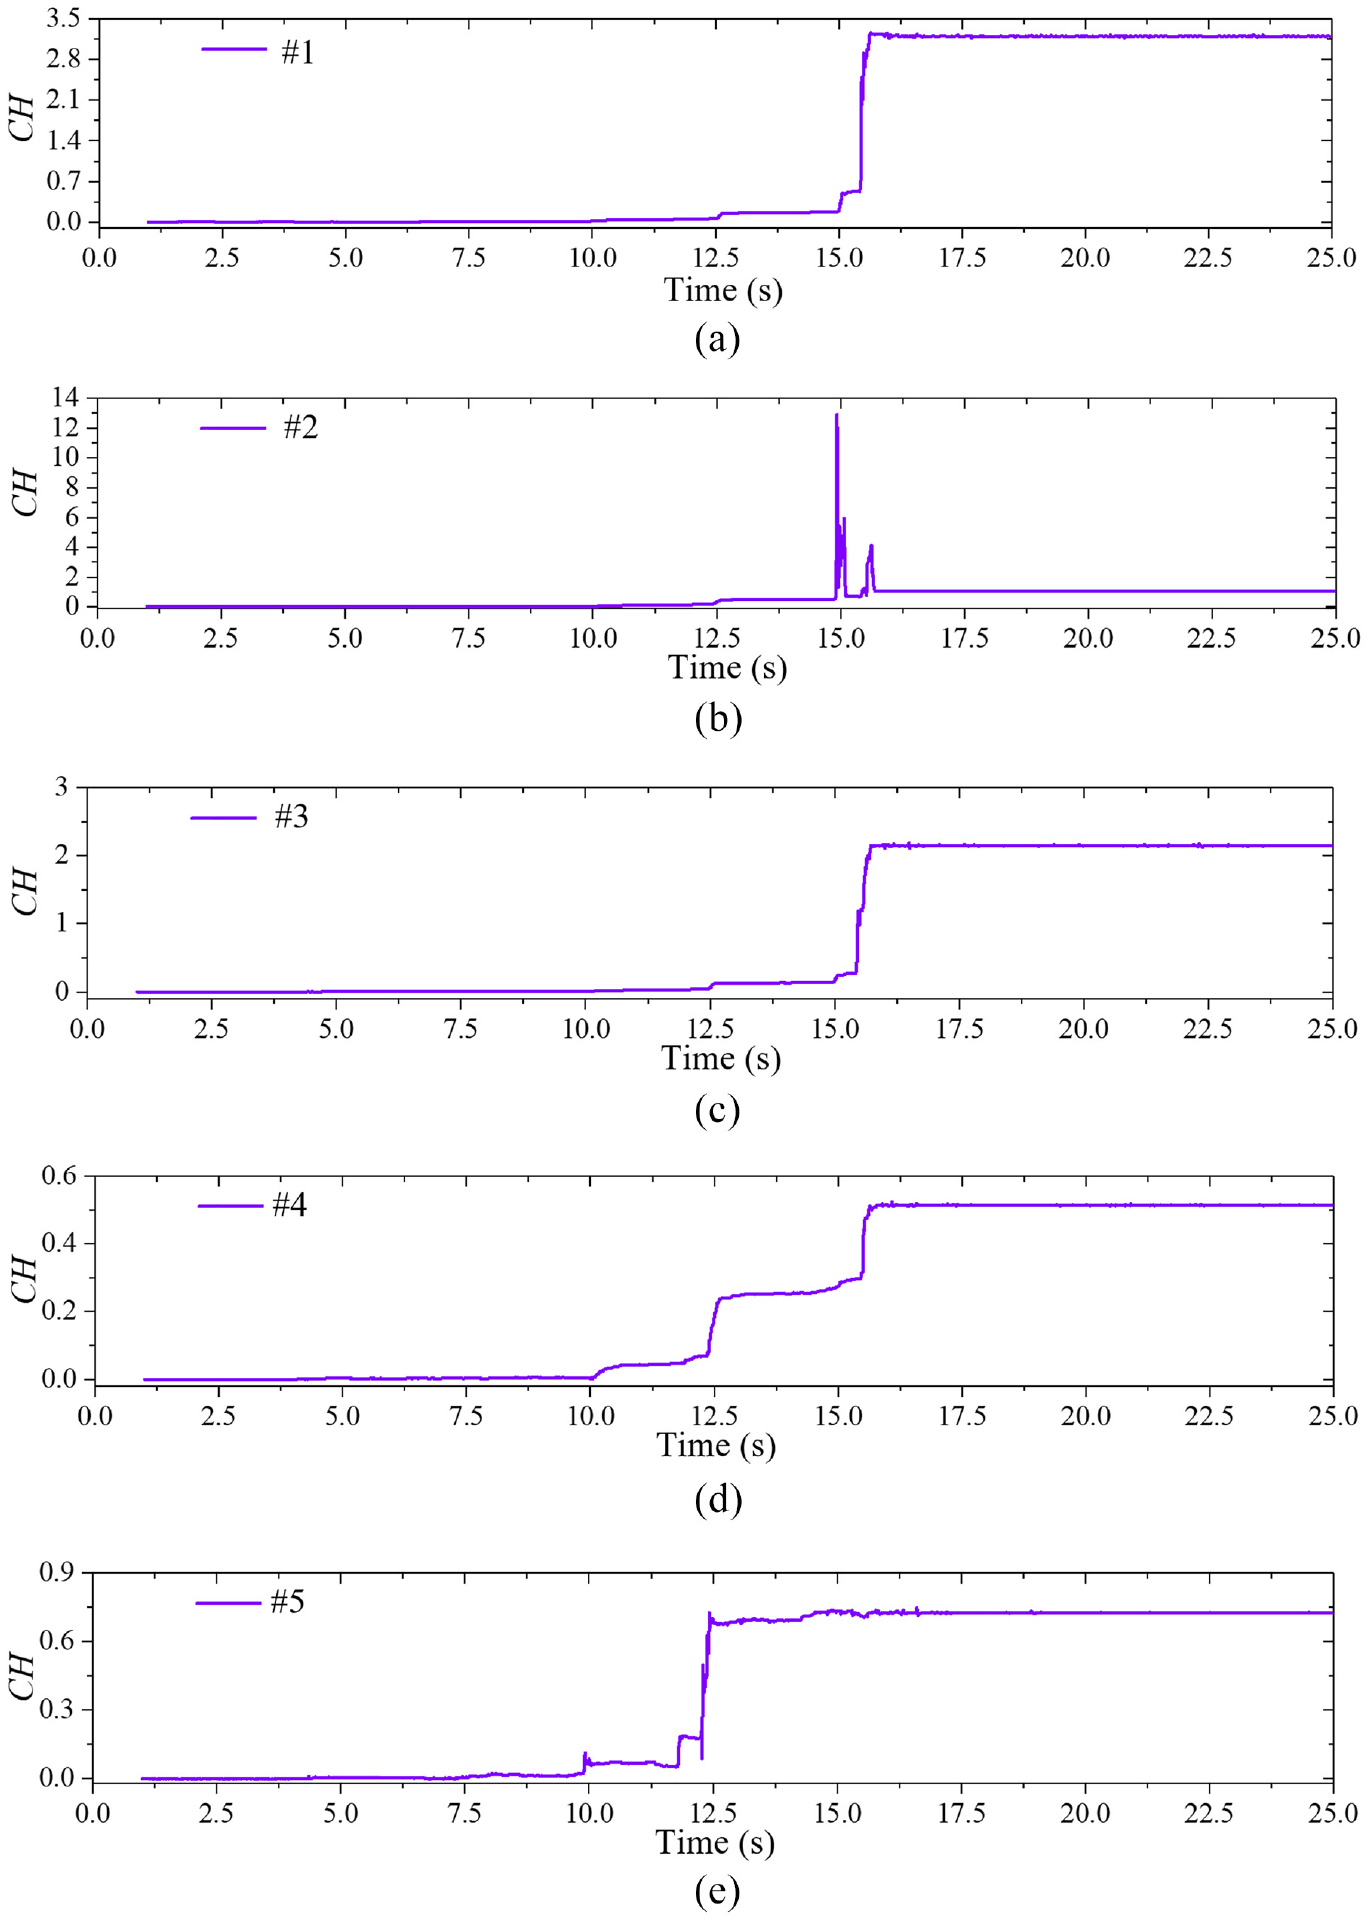
Parameter CH at the five measuring points: (a) measuring point #1, (b) measuring point #2, (c) measuring point #3,(d) measuring point #4, and (e) measuring point #5.
Analysis of the dynamic response with noise
To study the influence of noise interference on the proposed method in this study, measurement point #2 was selected for the analysis, and the noises with the signal to noise ratio (SNR) being
Figure 14 shows the identified predicted residual of measuring point #2 influenced by different levels of noise, and three times the model residual variance were 0.0075, 0.054, and 0.389. When the noise interference was relatively small, that is,
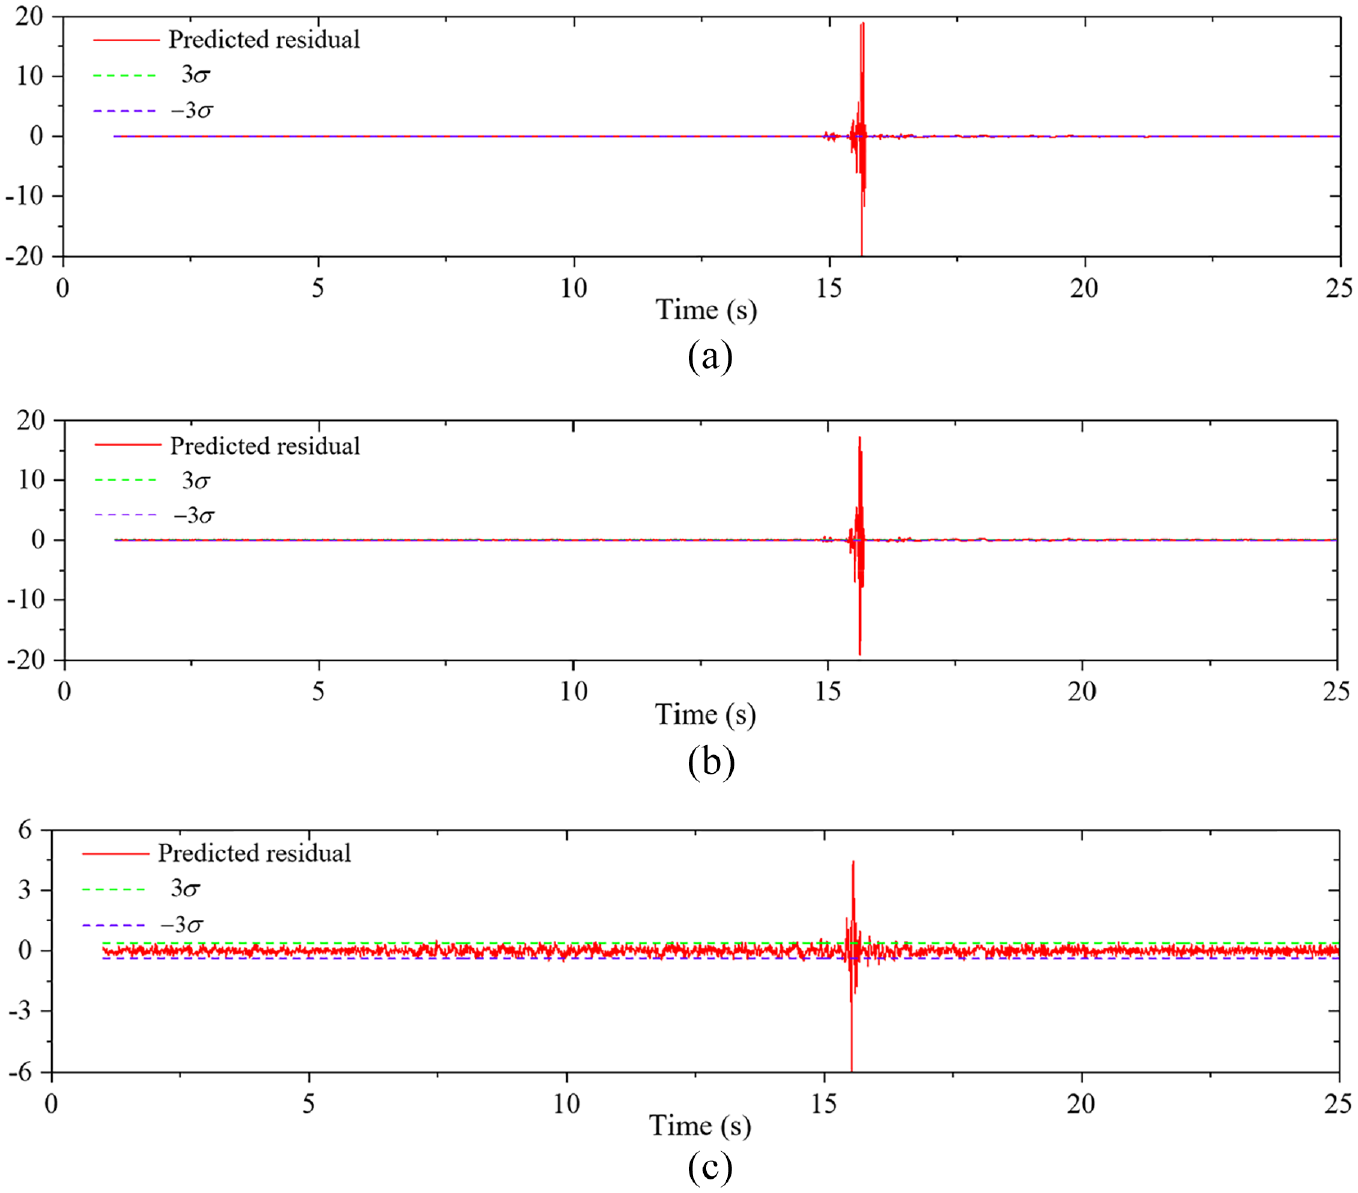
Predicted residual of measuring point #2 influenced by different levels of noise: (a)
Figure 15 shows parameter CH of measuring point #2 influenced by different levels of noise. By comparing with the identified CH of measuring point #2 without the inference of noise shown in Figure 12(b), it can be seen that the effect of parameter CH to identify the relative damage extent was influenced by the noise. When the noise interference was relatively small, that is,
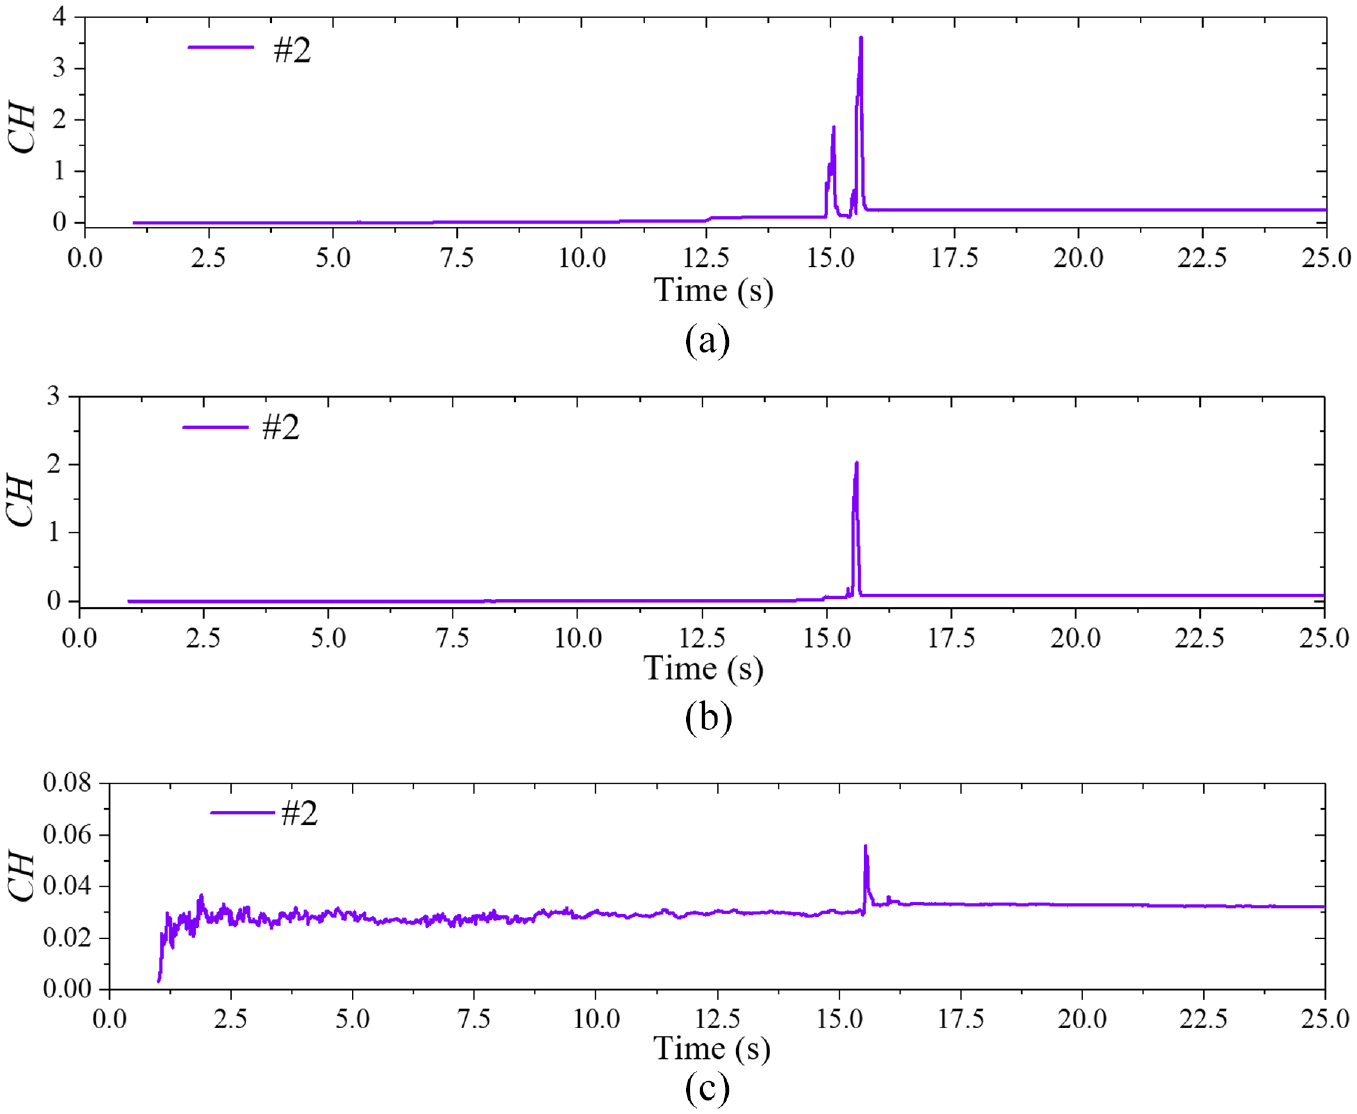
Damage index CH of measuring point #2 influenced by different levels of noise: (a)
Dynamic model experiment example of an arch dam
Arch dam model and arranged sensors
A dynamic arch dam model test was introduced to further verify the proposed method in this study. The model includes the dam body part, foundation part, dam abutment part, and bank slope part, in which the height of the dam body, the width of the dam crest, and the thickness of the dam crest and the dam base were 1.5, 1.0, 6, and 11 cm, respectively. Emulational concrete was adopted as the model material, which had a density of 3150–3200 kg/m3, a dynamic elasticity modulus of 1.05 GPa, and an average tensile strength of 68.7 kPa. The total mass of the arch dam model is 2.17 tons.
A 3-dimensional shaking table with six degrees of freedom was employed for the dynamic arch dam model test, which has a maximum load capacity of 6.0 tons. The platform size is 2.0 m × 2.8 m, and the working frequency of the shaking table ranges from 0.1 to 150 Hz. The maximum driving displacement and driving speed are ±50 mm and ±500 mm/s, respectively. The maximum driving accelerations in the X, Y, and Z directions are 1.2, 1.2, and 0.8 g, respectively.
DH187-type piezoelectric transducer accelerometers were used to monitor the acceleration of the arch dam model, which has a bandwidth of 10 kHz, a full scale range of ±100 g, and a sensitivity of 50.0 mV/g. The electric resistance strain gauge with the type BFH-120-80AA was used to monitor the dynamic strain of the arch dam model, which can measure up to the maximum frequency of 10 kHz. The strain gauge has a resistance of 120 Ω, a grid length of 80 mm, a gauge sensitivity factor of 2.0% ± 1%, and an ultimate strain of 20,000 μm/m. The accelerometers and strain gauges were arranged at different locations on the dam to monitor the dynamic response of the dam, as shown in Figure 16.
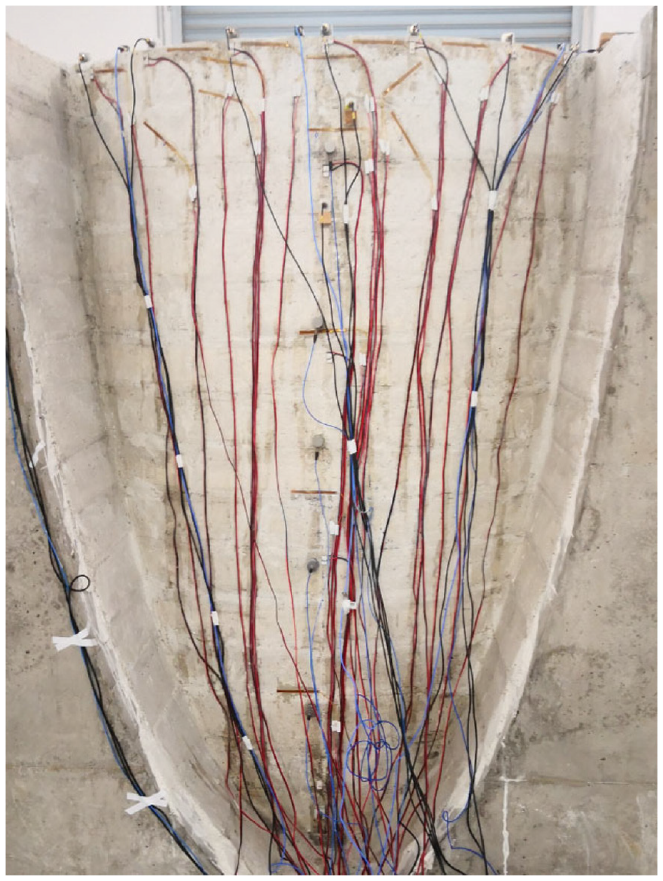
Real object of the arranged sensors.
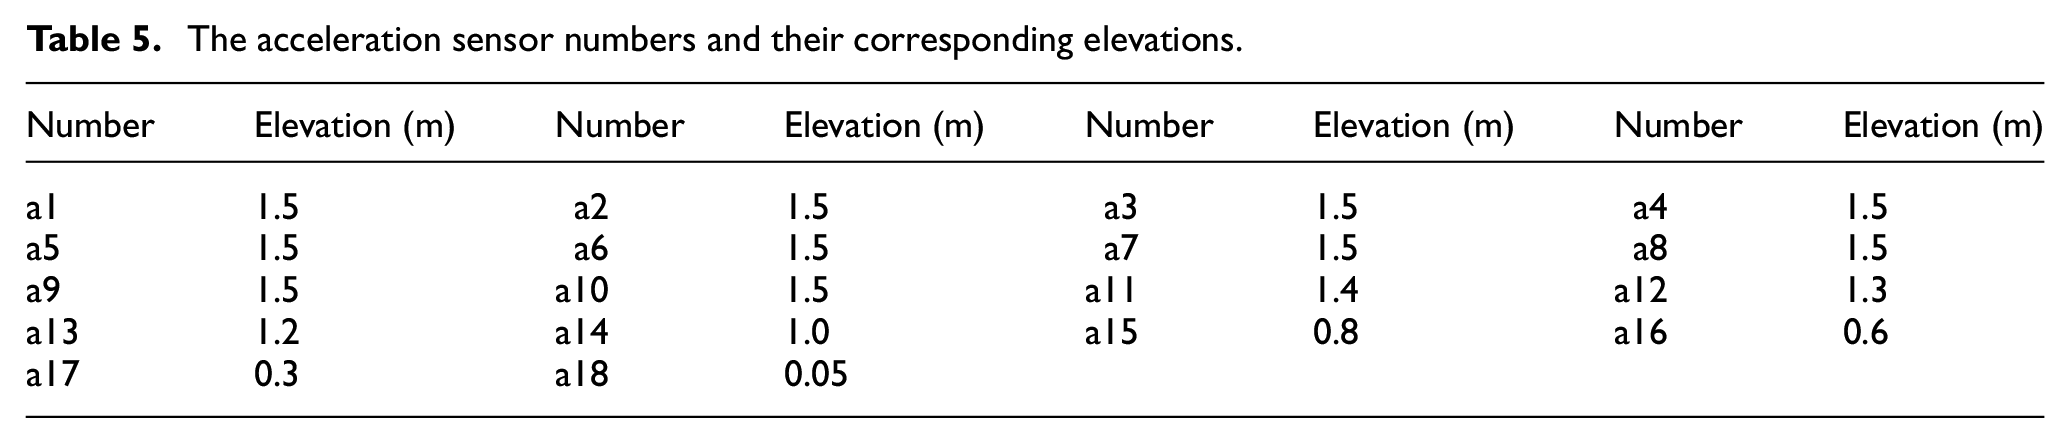
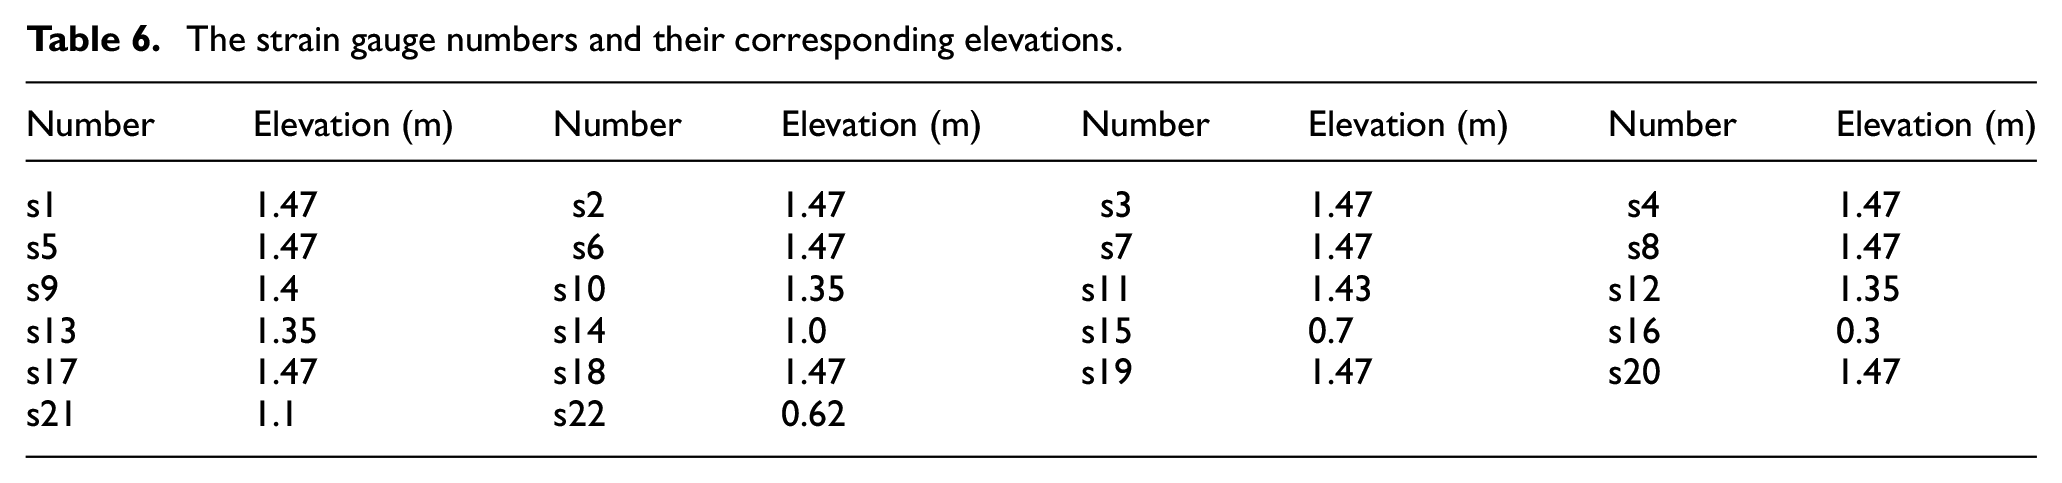
To clearly show the positions of the arranged sensors, a schematic diagram of the arranged sensors is shown in Figure 16, in which the sensors were numbered. The elevation of the dam base was recorded as 0 m, and the elevation of the dam crest was 1.5 m. Tables 5 and 6 show the serial number and location information of the sensors. In addition, an acceleration sensor was arranged on the shaking table, through which the acceleration of the table could be monitored. Multiple dynamic load conditions are designed, and a dynamic load condition was selected for analysis. In the selected condition, the dam is not damaged in the initial stage, and with the advancement of the dynamic load, structural damage begins to appear and gradually develops. Figure 17 shows the time history curve and Fourier spectra of the measured acceleration response of the shaking table, and the sampling frequency of the dynamic response is 256 Hz.
The acceleration sensor numbers and their corresponding elevations.
The strain gauge numbers and their corresponding elevations.
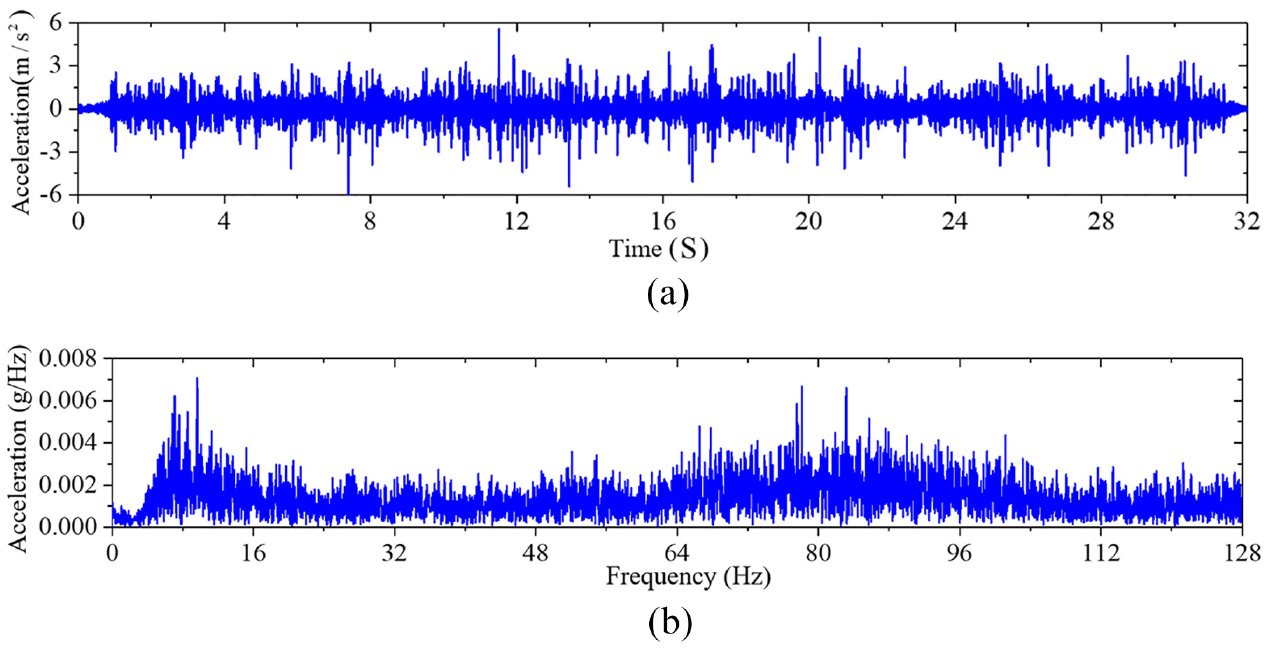
Time history curve and Fourier spectra of the measured platform acceleration: (a) time history curve and (b) Fourier spectra.
Analysis of the acceleration response and strain response on the arch dam model
To analyze the dynamic response of the arch dam model, measuring points a1 and a7 on the left and right dam abutments, a4 on the arch crown of the dam crest, a15 on the middle of the dam body, and a18 on the dam hell were selected, and the measured acceleration responses of the selected measuring points are shown in Figure 18. The locations of the selected measuring points are shown in Figure 19(a) and Table 5.
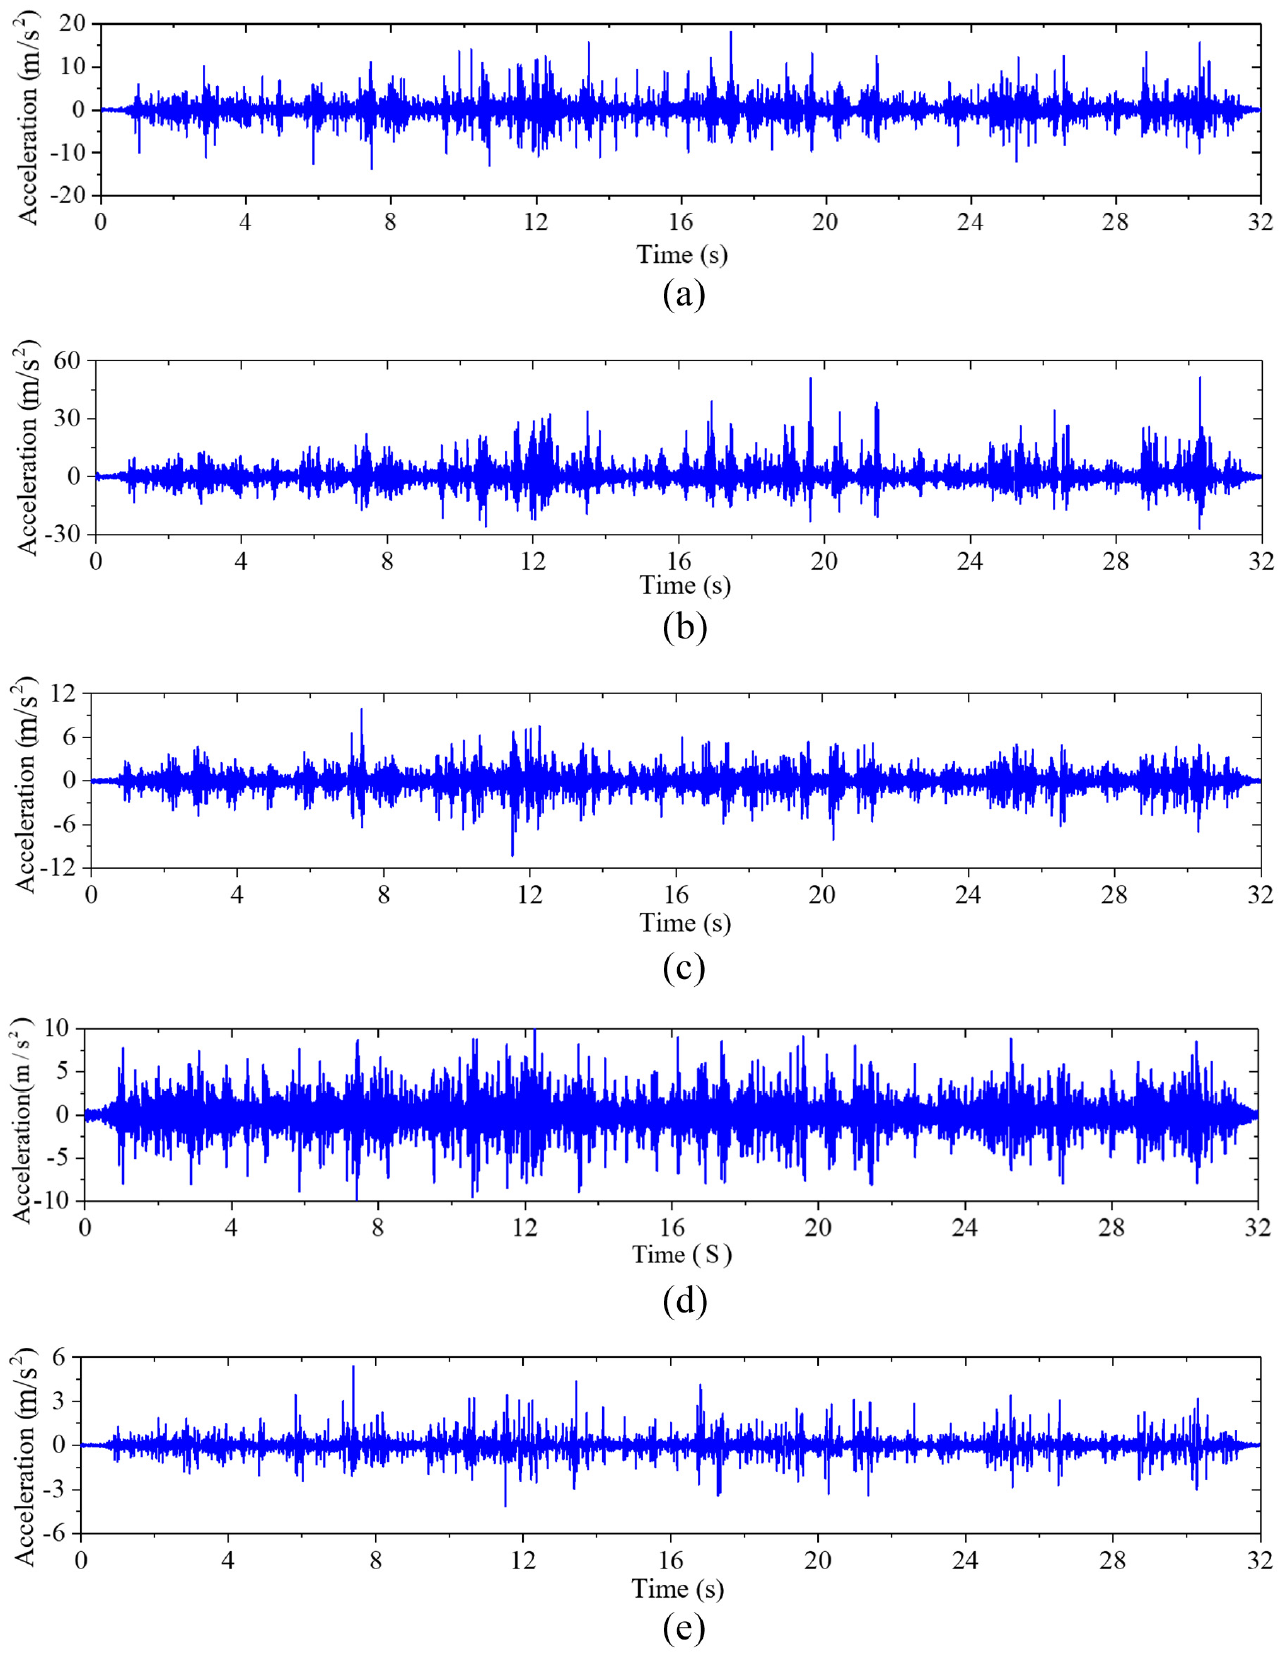
The acceleration response of the upstream measuring points of the gravity dam: (a) measuring point a1, (b) measuring point a4, (c) measuring point a7, (d) measuring point a15, and (e) measuring point a18.
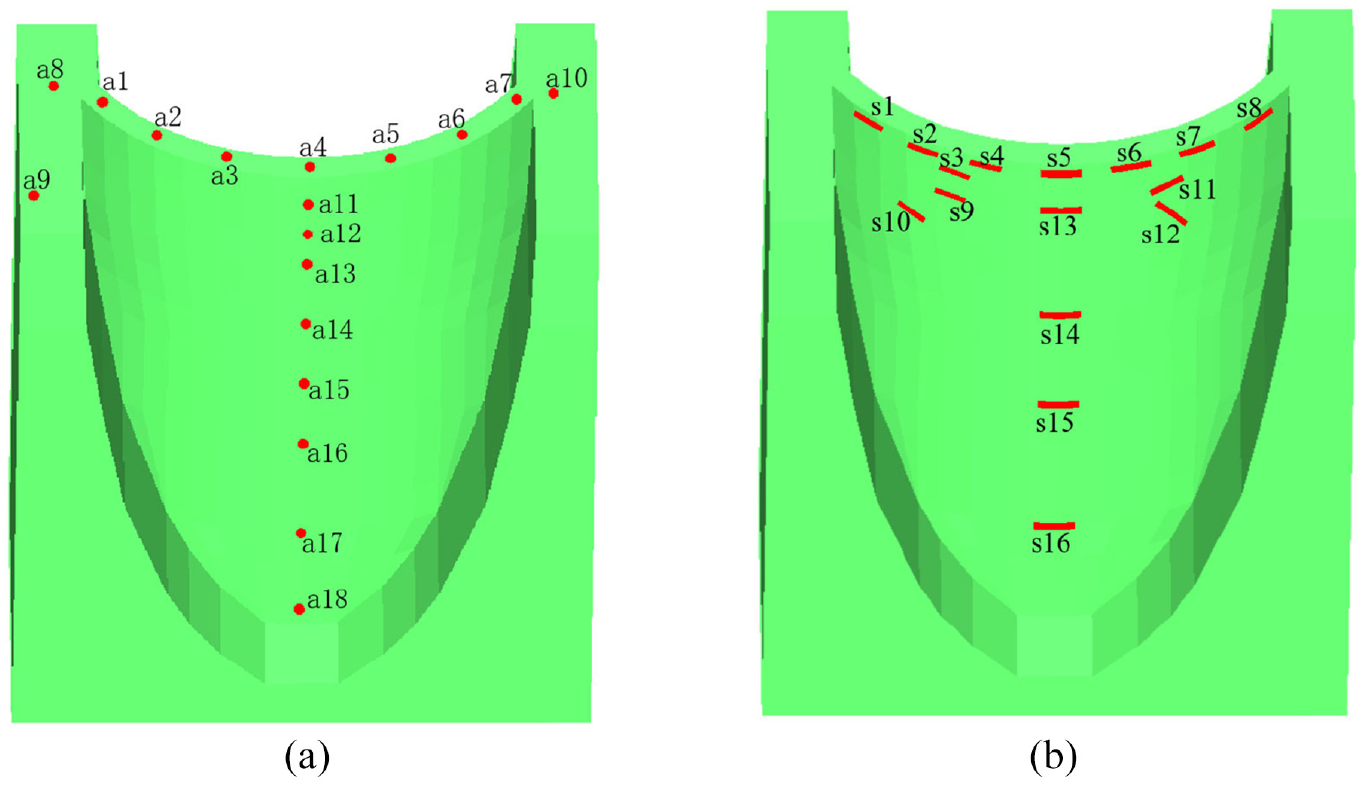
Schematic diagram and the arranged sensors: (a) acceleration sensors and (b) strain sensors.
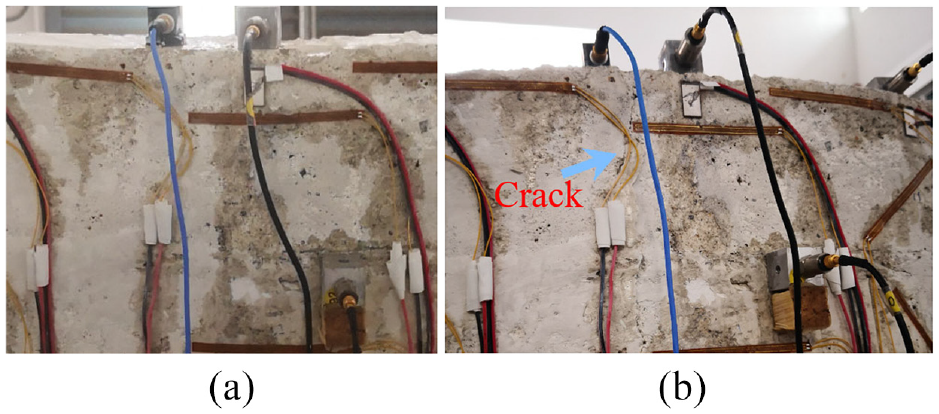
During the process of dynamic loading, cracks appeared and developed in the middle of the arch crown, while no damage occurred in the remaining parts of the arch dam model. Figure 20 shows the arch crown before the dynamic load and after the dynamic load. Obvious cracks can be seen in the middle of the arch crown.
Comparison of arch dam crowns before and after dynamic loading: (a) before the dynamic loading and (b) after the dynamic loading.
To further analyze the appearance time of the crack in the middle of the arch crown, strain measuring points s4 and s5 near the arch crown and measuring point s16 were selected for analysis, and the locations of the strain measuring points are shown in Figure 19(b) and Table 6. Figure 21 shows the measured strain of the two measuring points. The average strain in the initial stage was approximately 0, meaning the strain was the resumable elastic strain. Plastic strain with an average deviation from 0 appeared at measuring points s4 and s5 at time
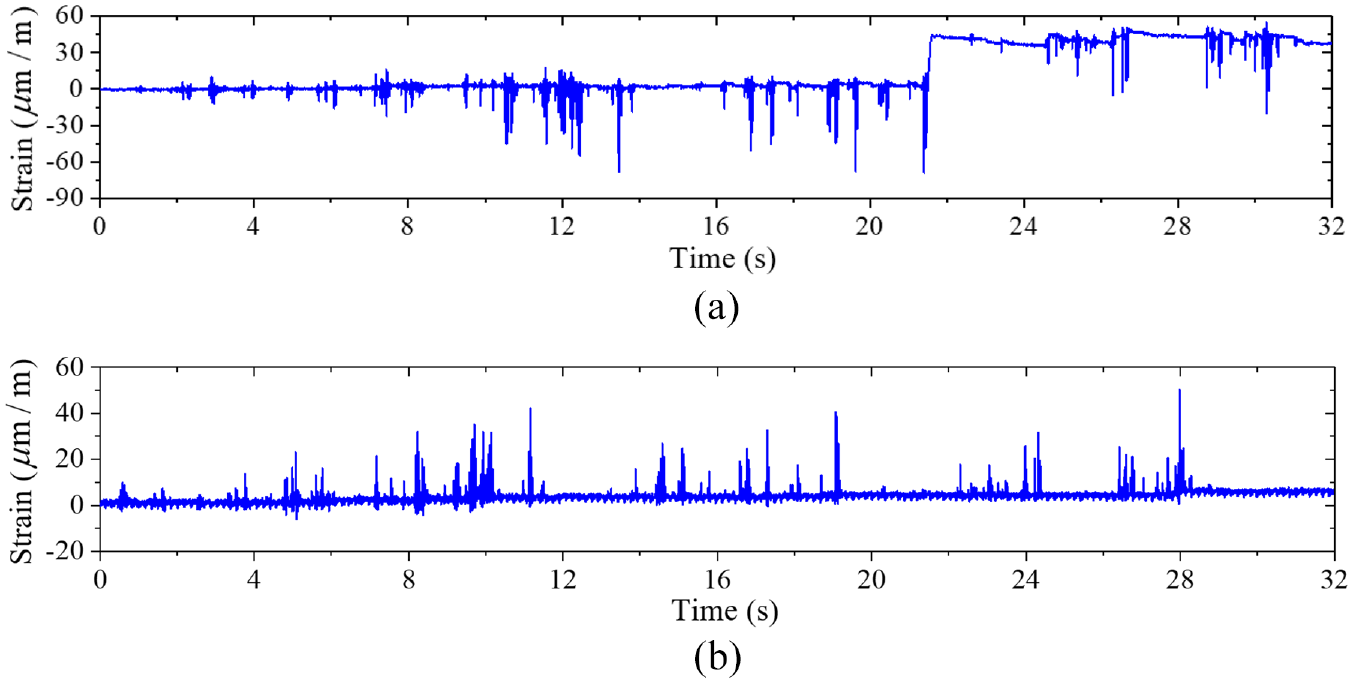
Measured strain in the upstream measuring points of the arch dam: (a) measuring point s4 and (b) measuring point s5.
Damage identification of the arch dam model
Similarly, the ARX model order should be determined first, and different model orders were selected to analyze the vibration response in the period of the first 2 s. The optimal ARX model order was finally obtained by using an iterative order determination method proposed by Entezami and Shariatmadar. 36 Table 7 shows the determined ARX model order for each measuring point.
ARX model order at different measuring points.
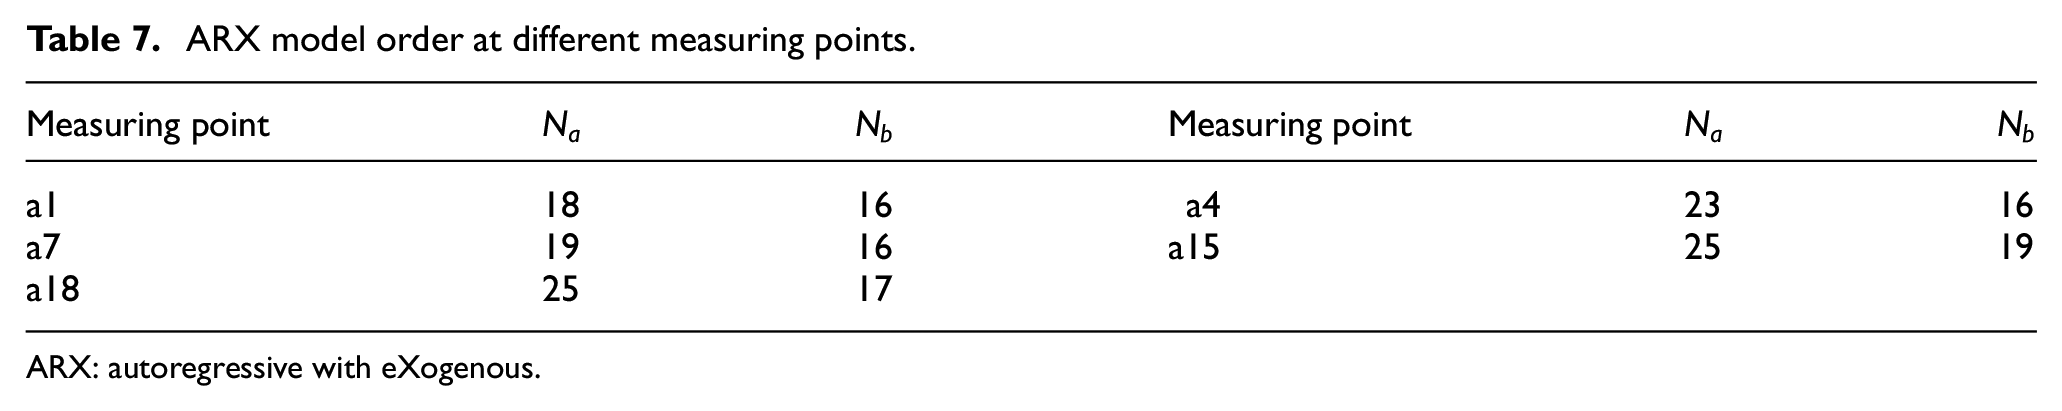
ARX: autoregressive with eXogenous.
Identify the presence of damage
After determining the model order for each measuring point, the proposed algorithm was used to identify the damage for each measuring point, and the initial analysis period was 0–1.0 s. Figure 22 shows the identified predicted residual of the five selected measuring points on the arch dam model, and the three times of the residual variance in the initial nondamage stage for the measuring points are 3.09, 2.94, 1.74, 1.99, and 2.51. The predicted residuals of measuring points a4 and a13 start to increase obviously after
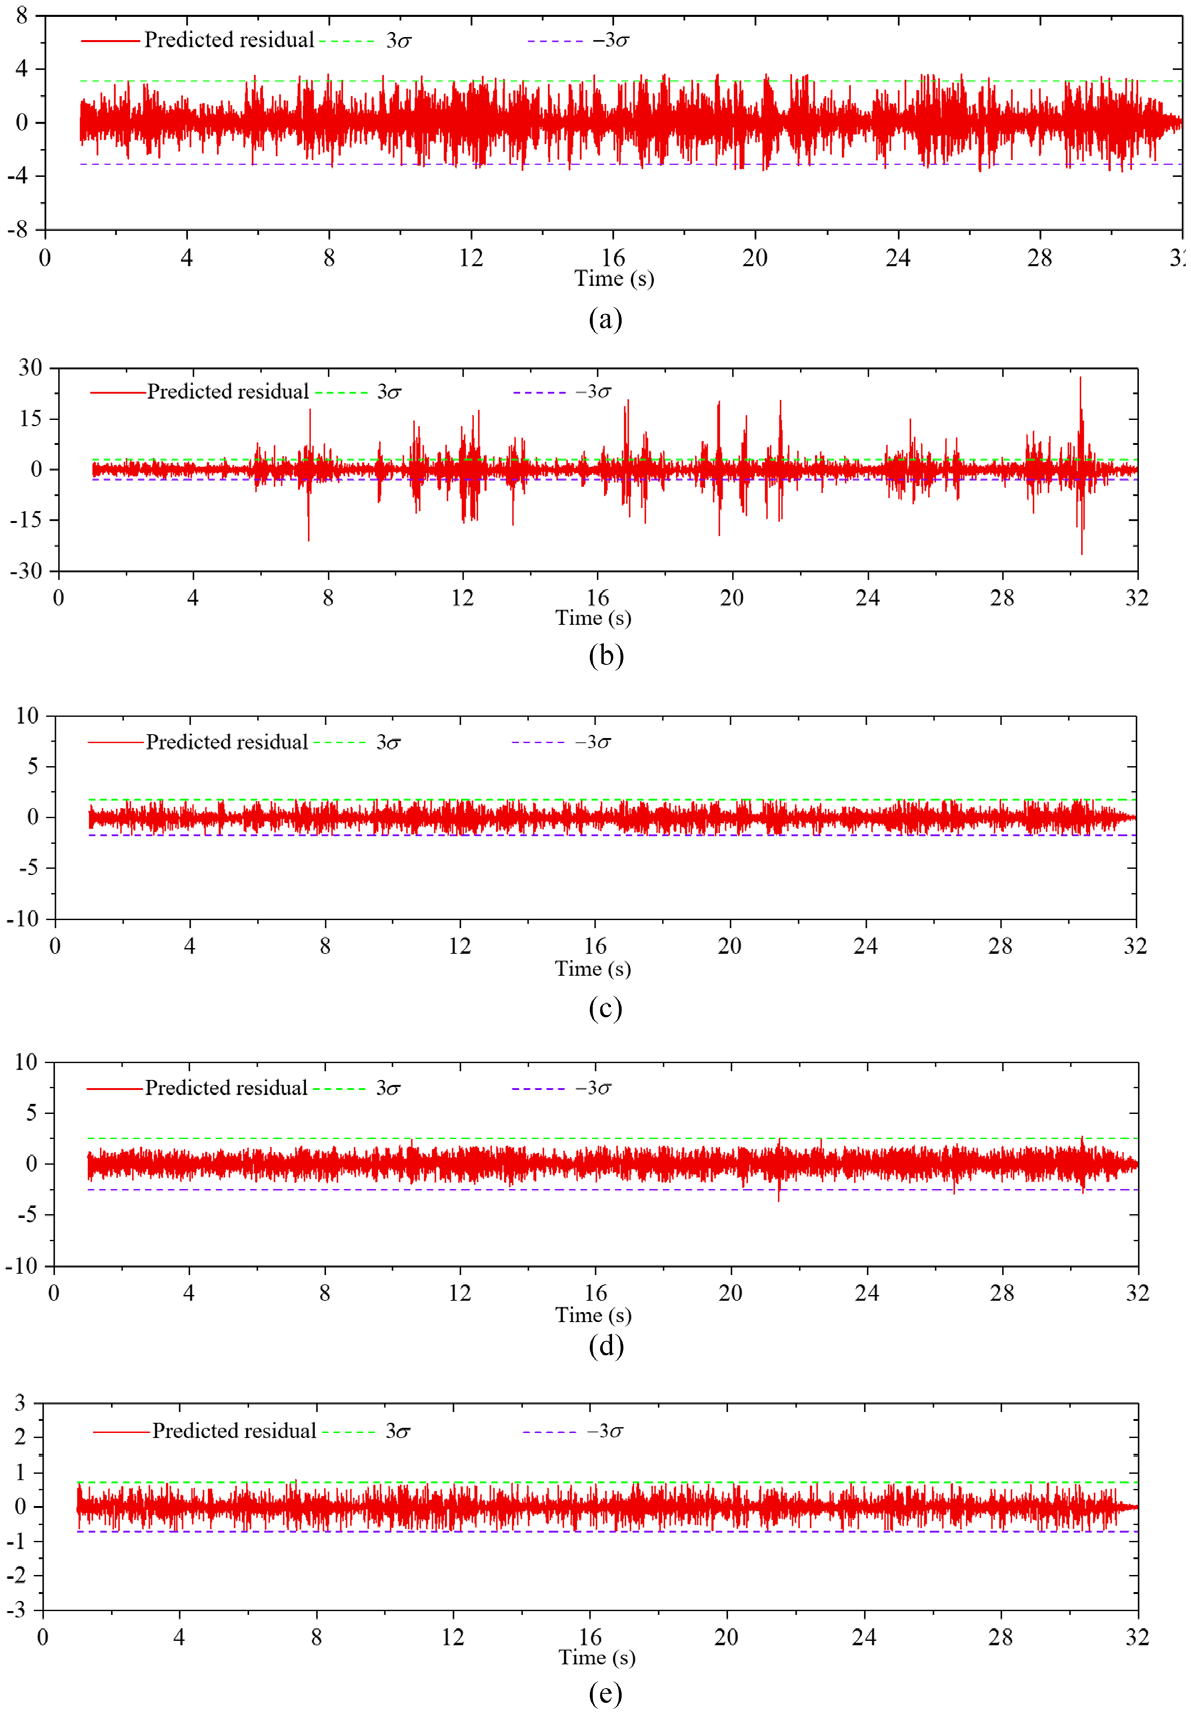
Predicted residual of the five measuring points on the arch dam model: (a) measuring point a1,
In addition, the damage index CH of measuring points a1, a7, a15, and a18 varied relatively little, while the damage index CH of measuring points a4 started to suddenly change to different degrees after
Identify the damage area
To identify the damage area location, the dam body was divided into five parts based on the positions of the five measuring points, as shown in Figure 23. For the calculation of parameters FR and DF according to Equations (29) and (30), the calculation duration was taken as 0.5 s for both damaged and undamaged conditions. The nondamage period was selected as t = 1.0–1.5 s, and five damaged periods were selected for analysis.
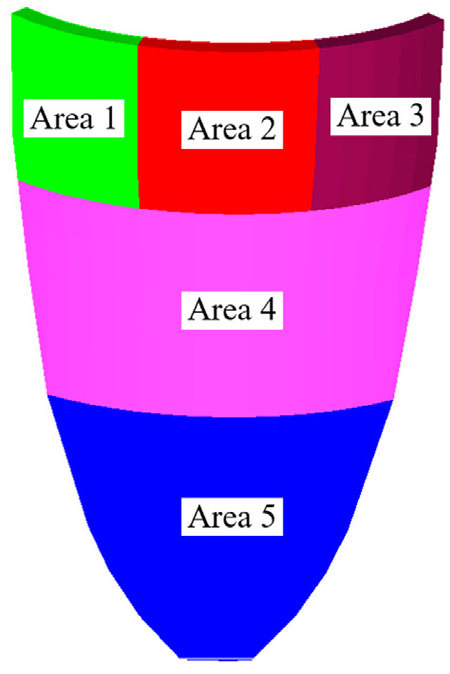
The divided five areas of the arch dam model.
Figure 24 shows parameter DF for the measuring points on the arch dam model. It can be seen that parameter DF of measuring point #2 was the largest in the five selected periods, so the damage position was identified in Area 2 of the arch dam model in these damaged periods. The identification result was consistent with the actual damage position shown in Figure 20(b).
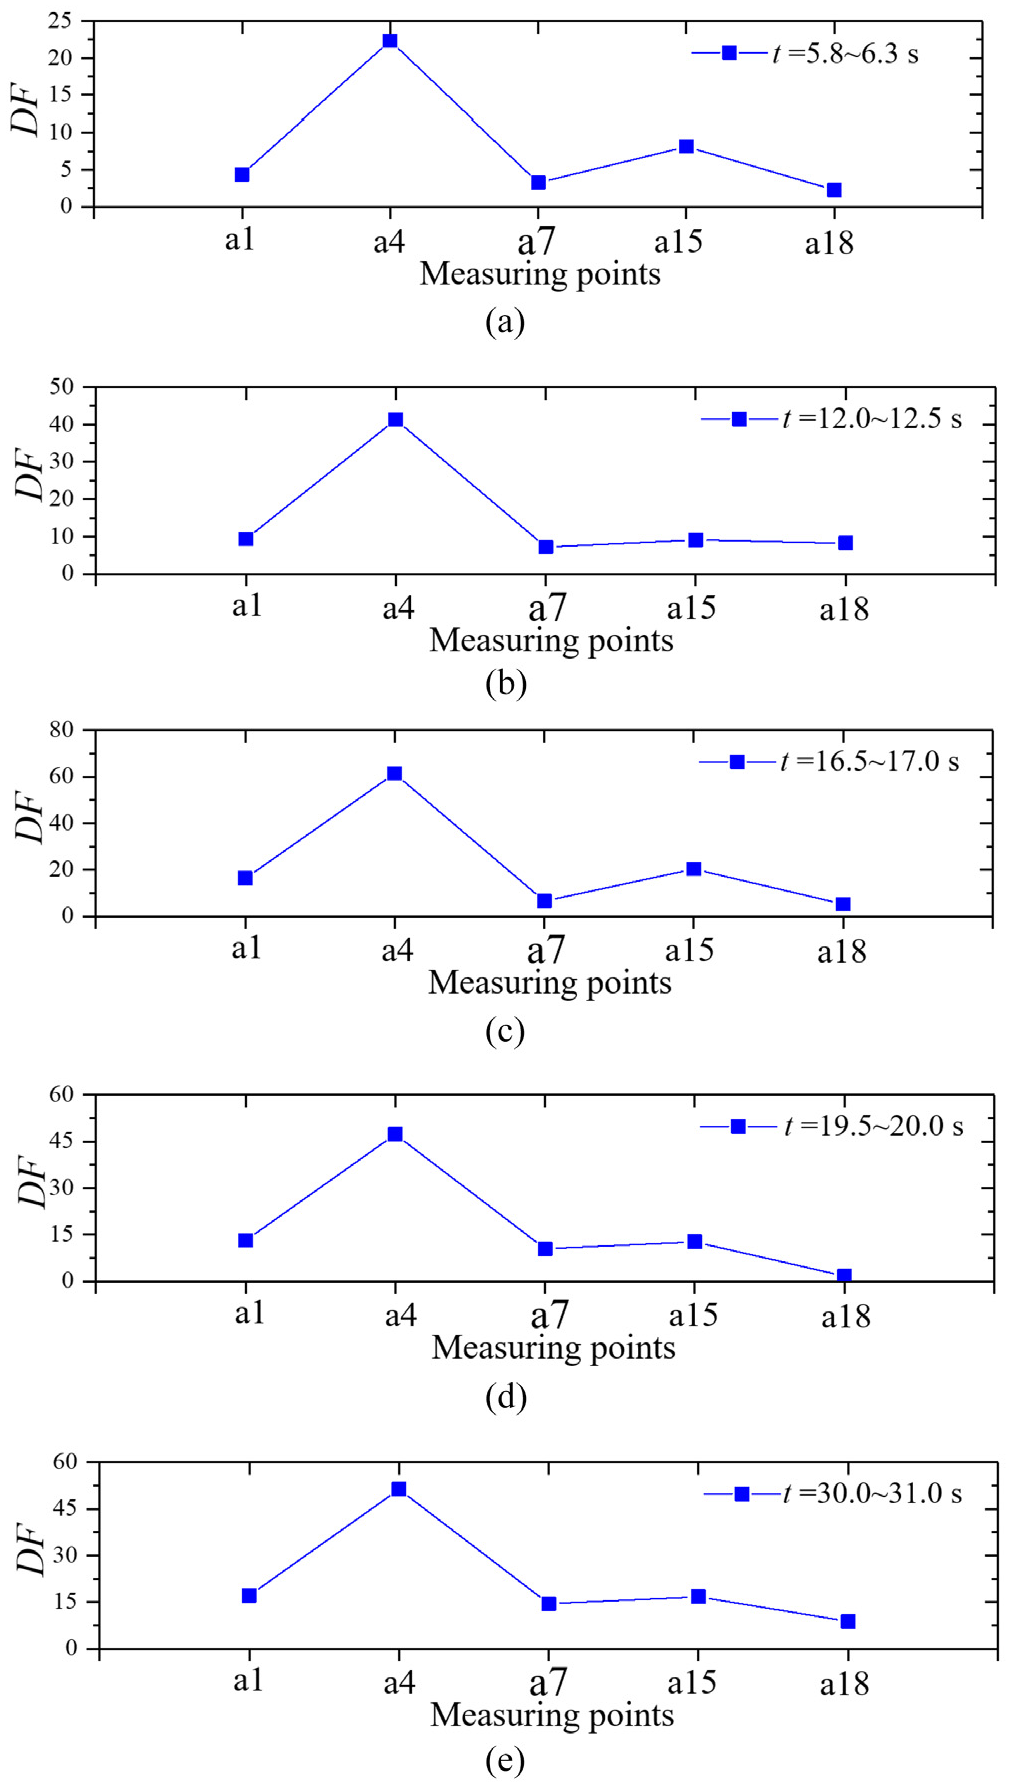
Parameter DF for the measuring points on the arch dam model: (a) t = 5.8–6.3 s, (b) t = 12.0–12.5 s,(c) t = 16.5–17.0 s, (d) t = 19.5–20.0 s, and (e) t = 30.0–31.0 s.
Identify the relative damage extent
Figure 25 shows parameter CH of the five measuring points. It can be seen that parameter CH of measuring point a4 increased when damage occurred or increased on the dam, while CH of other measuring points did not obviously change. The CH of measuring point a4 demonstrates that the damage extent increased after t = 5.8 s, which was consistent with the actual damage extent and development process of the dam body.
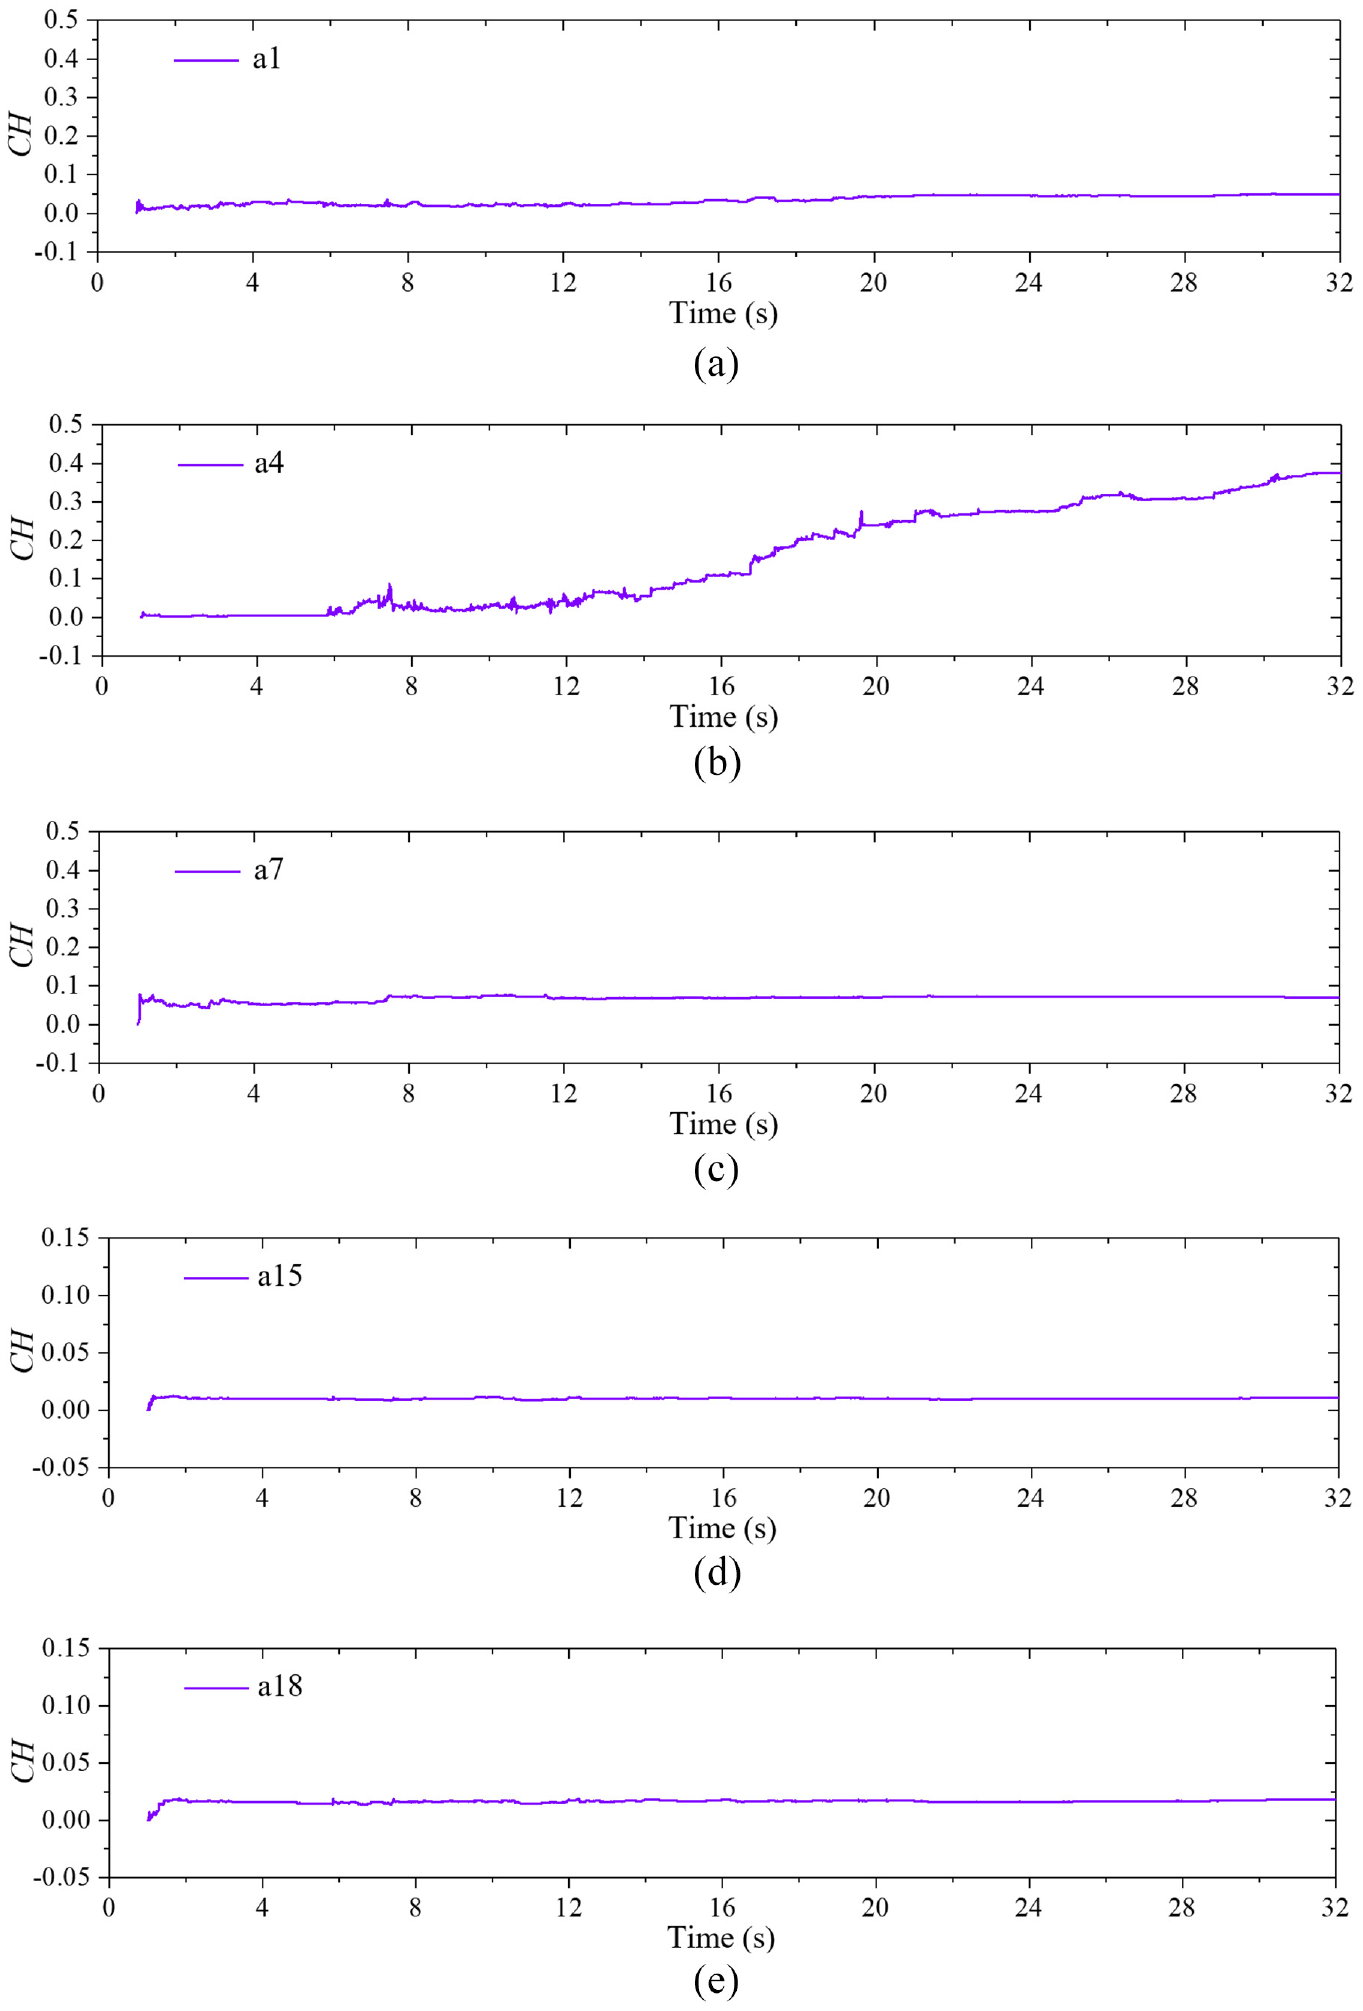
Parameter CH of the five measuring points: (a) measuring point a1, (b) measuring point a4, (c) measuring point a7, (d) measuring point a15, and (e) measuring point a18.
Conclusions
This paper presented a recursive TVARX approach for online structural damage state identification of concrete arch dams. The TVARX model was established using the vibration responses of the damaged concrete arch dams under seismic loading, and the recursive least-square method was used to identify the TVARX model parameters. To improve the tracking capability for the time-variable coefficients of the TVARX model, an adaptive adjustment algorithm of variable weighting factors was incorporated into the recursive least-squares method, in which the different influences of new response information and old response information on the time-varying structural damage state were considered. After establishing the recursive TVARX model with variable weighting factors using the dynamic responses of arch dams, three damage indexes were proposed to identify the structural damage state of concrete arch dams: (1) predicted model residual was proposed to identify the presence of damage on concrete arch dams; (2) a damage index named the FR and the DF were proposed to identify the damage area of concrete arch dams, in which the dam body was divided into different damage areas based on the positions of measuring points; and (3) a damage index CH based on the change in ARX model parameters was proposed to identify the relative damage degree of concrete arch dams.
To verify the proposed approach in this study, a numerical simulation example and a shaking table test were adopted:
In the numerical simulation example, a numerical finite element model of a certain concrete arch dam was built, and a concrete plastic damage constitutive model was used to simulate the damage development of the dam body under seismic loading. Then, the dynamic responses of the dam body under a designed dynamic input loading were obtained, and the structural damage state of the dam body was obtained by analyzing the damage factor DAMAGET. By analyzing the obtained dynamic responses of the dam body using the proposed recursive TVARX model with a variable weighting factor, the three damage indexes were extracted to identify the presence of the damage area and the relative damage extent of the arch dam, and the identification results were consistent with the actual simulated damage development of the concrete arch dam. In addition, the proposed method was used to analyze the dynamic responses of one typical measuring point with different levels of noise, and the identification result showed that minor damage can also be identified when the noise interference was small such as SNR = 60. When SNR = 20, minor damage can be hidden by the influence of noise, and the major damage can still be identified.
In the shaking table test example, a dynamic failure arch dam model was made by using emulational concrete, and acceleration sensors and strain sensors were arranged to monitor the dynamic response of the arch dam model under the designed seismic loading. During the process of dynamic loading, cracks appeared and developed in the middle of the arch crown, while no damage occurred in the remaining parts of the arch dam model. Then the acceleration responses of five selected measuring points in different positions and the strain of two measuring points near the middle of the arch crown were analyzed. By analyzing the acceleration responses of the five selected measuring points using the proposed approach in this study, three damage indexes were extracted to identify the presence of the damage area and the relative damage extent of the arch dam model, and the identification results were consistent with the actual simulated damage development of the arch dam model. Therefore, the proposed approach was proven to be effective in the two examples, which provides important proof to grasp the structural damage state of concrete arch dams under seismic loading.
Footnotes
Declaration of conflicting interests
The author(s) declared no potential conflicts of interest with respect to the research, authorship, and/or publication of this article.
Funding
The author(s) disclosed receipt of the following financial support for the research, authorship, and/or publication of this article: This work was supported by the Yangzhou Green Yang Jinfeng Project (No. 137012705) and the National Natural Science Foundation of China (Grant Nos. 52179128, 52079120, 51579085, 51739003, 51779215).