
Abstract
Spectral coherence (SCoh) consists of spectral and cyclic frequencies and exhibits unique merits in simultaneously revealing the resonance frequency band and the fault characteristic frequency (FCF) of bearing signals. Most SCoh-based methods only consider the spectral frequency information, while the cyclic frequency information is ignored. However, the fault information and interference components are difficult to distinguish when only the spectral frequency is considered. To address this challenge, a novel bidirectional weighted enhanced envelope spectrum (BWEES) analysis method is proposed in this paper. First, an improved spectral weighting method is developed, which is conducted in the spectral frequency direction to enhance the resonance frequency band that carries the fault information. An autocorrelation function is exploited to reveal the cyclic information hidden in noises and appropriate weights are assigned to the spectral frequencies according to the magnitudes of autocorrelation values. Second, a cyclic weighting function is designed, which is operated in the cyclic frequency direction to enhance the FCF and suppress noise interference. The cyclic frequency components with the highest magnitudes are selected as a basis to reconstruct the one-dimensional cyclic frequency map for assigning different weights. Finally, the two-dimensional weighted bivariable map is constructed and then converted into spectral coherence to reveal the fault features. The BWEES is tested by simulation signals and experimental data, and compared with four state-of-art methods. In particular, the kurtosis values of BWEES in four different cases are 7.637, 12.831, 15.269, and 80.269, which are higher than other methods. The Gini index values of BWEES in four different cases are 0.866, 0.812, 0.424, and 0.306, which are also the largest. The above numerical results show that BWEES can achieve better performance.
Highlights
A novel spectral coherence-based weighted envelope spectrum analysis method is proposed.
A weighting function is developed by exploiting the periodicity of spectral coherence along cyclic frequency.
Three case studies have been conducted to demonstrate the advantages of the method.
Introduction
As the fundamental component, rolling bearings are extensively employed in various industrial applications.1,2 However, they usually operate under harsh conditions such as heavy loads and high temperatures, so they are susceptible to failure. Once a fault occurs in a rolling bearing, the whole system may fail, resulting in time loss and increased economic cost. Therefore, the health monitoring and diagnosis of rolling bearings is essential and has become a significant topic in recent years.
A series of transient impulses will be generated in the vibration signal when a bearing has a fault, and each fault type is associated with a unique impulse repetition frequency, namely the fault characteristic frequency (FCF).3–7 Envelope analysis is an effective and popular method to reveal FCFs. For the method, an informative frequency band that contains fault information is usually first identified, and then the Hilbert transform as well as the Fourier transform is applied to the filtered signal to obtain the square envelope spectrum (SES). The key to envelope analysis is the selection of the most informative frequency band, and the most common tool is the fast kurtogram (FK), 8 in which the frequency band with the maximum kurtosis value is selected. However, if the signals contain impulsive noise with high amplitude, FK cannot obtain a reliable result. 9 Moshrefzadeh and Fasana 10 further developed an autogram by calculating the kurtosis of the unbiased autocorrelation of the square envelope, which is more robust to the impulsive noise. In addition, methods such as infogram11,12 and log-cycligram13,14 are also proposed to achieve frequency band identification.
Spectral correlation (SC) is another effective tool to reveal the modulation frequencies of rolling bearings.15–17 Compared with Hilbert analysis, SC is more robust to noise, and can directly reveal the cyclic frequency components in the vibration signals. In recent years, it has received more and more attention.18–20 The bearing vibration signals exhibit typical second-order cyclostationary characteristics. SC and its normalized version, namely spectral coherence (SCoh), can reveal the second-order cyclostationary of vibration signals by mapping the vibration signal into a bivariable representation composed of the spectral frequency and the cyclic frequency.21–23 Specifically, the spectral frequency reflects the inherent characteristics of the carrier, and the periodic hidden modulations within the signal are presented as cyclic frequency. 24 Randall et al. 25 claimed that the SES is equivalent to enhanced envelope spectrum (EES), which is obtained by integrating SCoh over the whole frequency band along the spectral frequency. EES has shown superior performance over the traditional SES. The improved envelope spectrum (IES) was proposed to obtain a clearer spectrum, 26 which is implemented by integrating the SCoh over the optimal frequency band that contains fault information. The core of IES is the selection of the optimal frequency band, which is the same as the Hilbert transform. Several frequency band selection methods have been developed for spectral coherence-based spectrum analysis, such as IES via feature optimization gram 27 and IES by alpha maximization criterion. 28 However, if the vibration signal has multiple resonance frequency bands, the IES can only acquire fault information from a specific frequency band, rather than all of them.
The idea of weighting was initially introduced in spectral coherence-based envelope spectra to relieve the difficulty of selecting the optimal frequency band. Zhang et al. 29 designed a new index to quantify the mean signal-to-noise ratio (SNR) of the envelope spectrum and then combined the index with the SCoh to construct the weighted envelope spectrum (WES). However, the FCF was necessary to be calculated in advance according to the fault location and rotating frequency. Lee 30 proposed the weighting enhanced envelope spectrum (WEES), in which the FCF was not required before calculation. However, not only the fault information is contained in the resonance frequency band but also in-band noise exists in the resonance frequency band. Therefore, when the resonance frequency band is strengthened, the in-band noise is also enhanced by WEES, leading to interference in the envelope spectrum analysis. In addition, the cyclic frequency is also presented in the two-dimensional map, so if a suitable method is proposed to weigh the cyclic frequency components, the fault features will further be enhanced.
In this paper, a bidirectional weighted enhanced envelope spectrum (BWEES) is proposed. First, an improved spectral weighting method is designed to strengthen the informative frequency bands, in which an autocorrelation function is exploited to unveil the hidden periodic components in a signal and then the magnitudes of autocorrelation values are applied as a basis to determine appropriate weights assigned to each spectral frequency. Second, a cyclic weighting function is developed to enhance the prominence of FCFs, in which the one-dimensional map of cyclic frequency is reconstructed based on the cyclic frequency components with the highest magnitudes for assigning different weights. Finally, a two-dimensional weighted bivariable matrix is constructed by combining the improved spectral weighting method and the cyclic weighting function, which is mapped to SCoh to highlight the fault features. Different from WES and WEES, only the FCF information in the resonance frequency band is enhanced by BWEES, and the in-band noise is not strengthened. Meanwhile, no prior knowledge of FCF is required, which expands the application range of the BWEES. Simulation signals and experiment data are analyzed to compare and validate the performance of BWEES and other state-of-art methods.
The framework of this article is organized as follows. In the section “Theory of spectral coherence,” a concise explanation is given for the concept of SC, Scoh, and SCoh-based envelope spectra. Section “Bidirectional weighted enhanced envelope spectrum” presents the BWEES in detail. Section “Simulation signal verification” evaluates the performance of the BWEES through simulation signals and compares it with other state-of-the-art methods. In the section “Experimental signal verification,” the BWEES is further demonstrated utilizing experimental data acquired from real bearing test rigs. The conclusions of this study are then presented in the section “Conclusion.”
Theory of spectral coherence
A vibration signal is represented as second-order cyclostationarity (CS2), if the second-order statistical moment of the signal, namely its covariance function, is periodic. 31 SC and SCoh play a crucial role in CS2, which can convert the signal waveform into a bivariable map composed of spectral frequency and cyclic frequency. Assume the vibration signal is x(t), and the instantaneous autocorrelation function of x(t) has the same periodicity as the raw signal, which is obtained as follows:

where E{·} is the average operator. Because the instantaneous autocorrelation function is periodic,
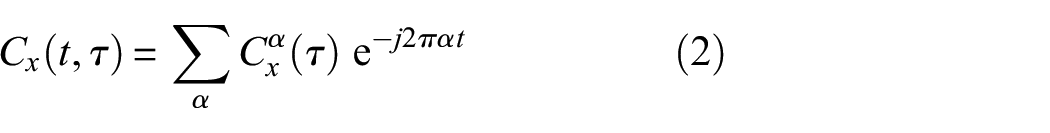
where α represents the cyclic frequency, τ stands for time-lag, and the coefficient
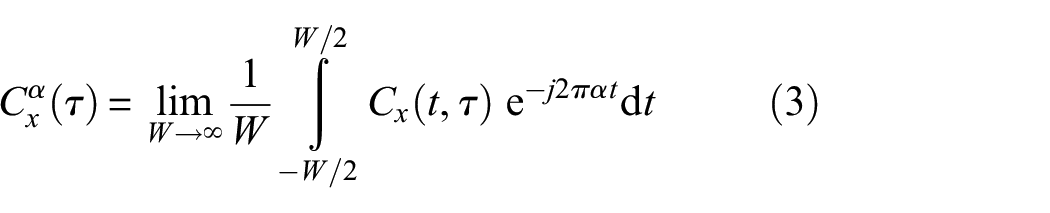
where W is the signal duration. The SC can be obtained by instantaneous autocorrelation function through double Fourier transforms of time t and time-lag τ. The SC is shown as follows:
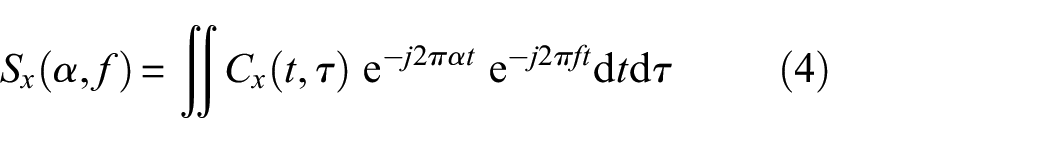
Therefore, the SC can also be shown as
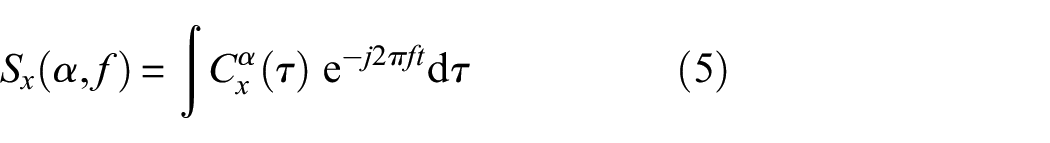
In Equation (4), SC is composed of spectral frequency and cyclic frequency. The cyclic frequency reflects the modulation information, namely FCF, and the inherent characteristics of the carrier, namely resonance frequency, are reflected by spectral frequency. For the cyclostationary signal satisfying the generalized cyclostationarity, SC can be represented as follows:
where
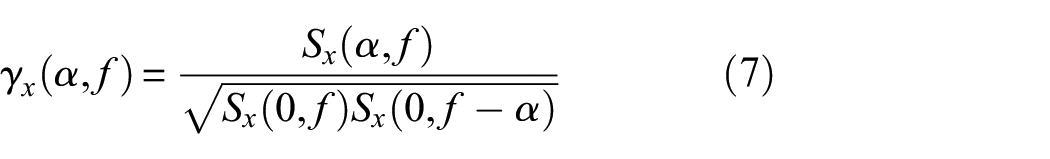
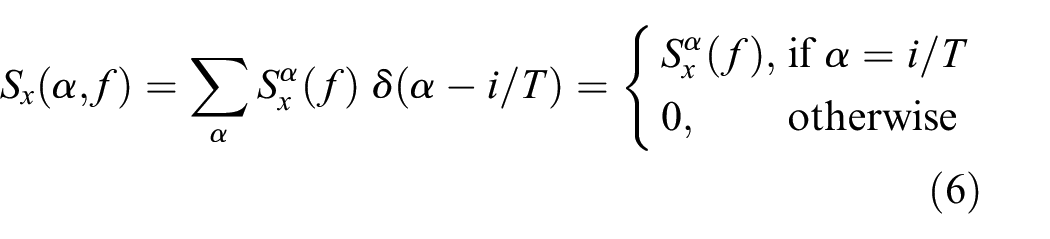
where Sx(0, f) presents the power spectral density. 32 Since it is difficult to obtain fault information by manually analyzing the two-dimensional images of SC and SCoh, SCoh-based envelope spectra are developed naturally, which are achieved by the whole band integration of SCoh. The obtained spectra, namely EES and IES, are commonly used tools in fault diagnosis.33,34 The EES is defined as follows:
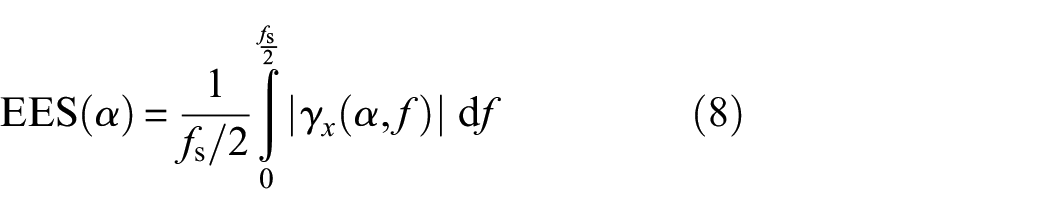
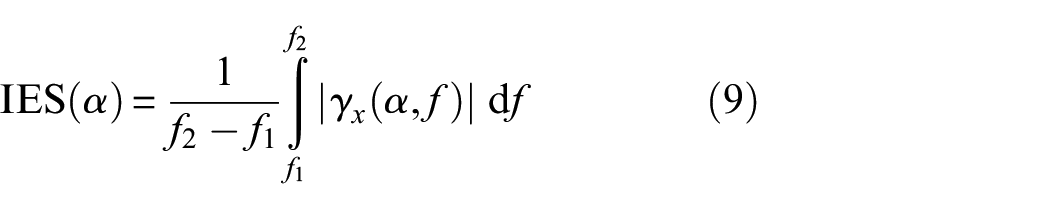
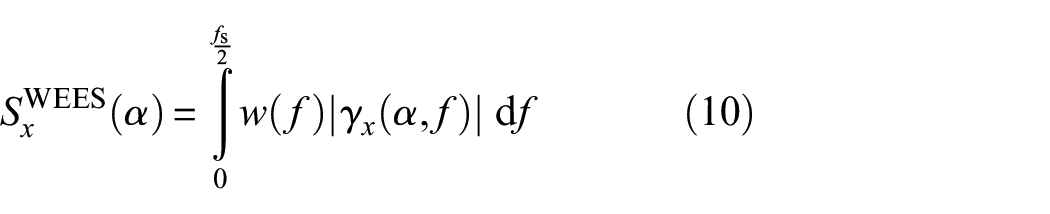
The difference between EES and IES lies in the range of integration. The range of integration for EES is from zero to Nyquist frequency (fs/2), while the range of integration for IES is the selected frequency band [f1, f2], which typically contains abundant fault information. The IES can be defined as follows:
Although the IES can better reflect the fault features, how to choose the appropriate informative frequency band is difficult. Therefore, Lee 30 proposed WEES to avoid the difficulty of selecting the optimal frequency band. The WEES enhances the proportion of the informative frequency band in the whole frequency band during integration by weighting the spectral frequency in SCoh, which is as follows:
However, under strong noise, the FCF and its harmonics cannot be accurately identified using the WEES.
Bidirectional weighted enhanced envelope spectrum
In this paper, the BWEES is proposed to extend the idea of weighting to the bearing signal analysis under heavy noise. The graphical abstract and flowchart are displayed in Figures 1 and 2, respectively. For the method in Lee,
30
as described in Equation (6), it is assumed that
where the weighting function bw (α, f) is designed to enhance the fault features by simultaneously considering the two variables of SCoh. In detail, the spectral frequency is weighted to highlight the resonance frequency band, while the amplitude of FCF and its harmonics is strengthened through weighting cyclic frequency.
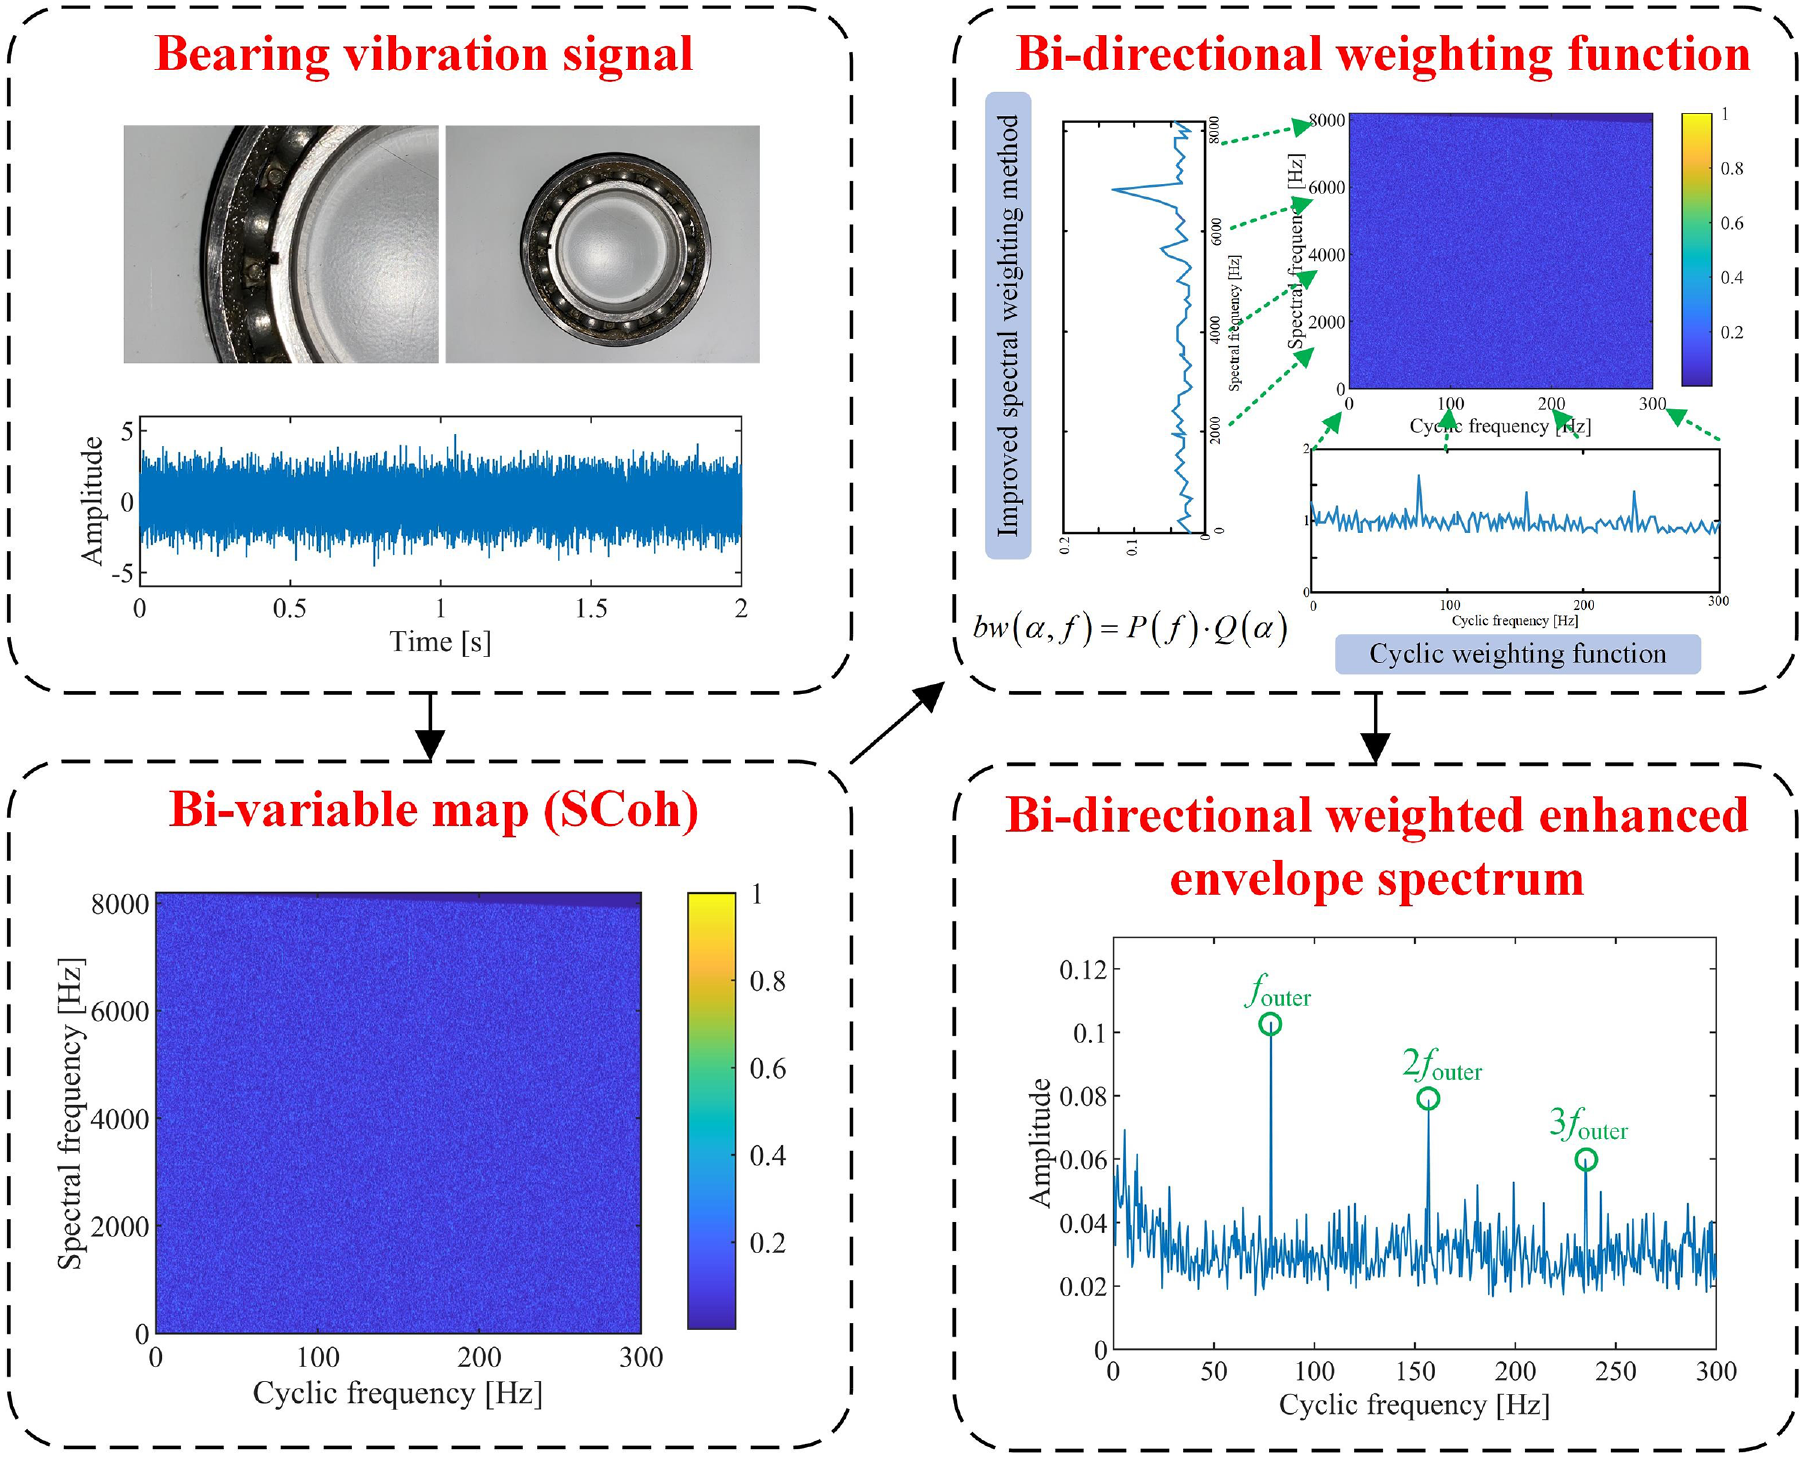
Graphical abstract.
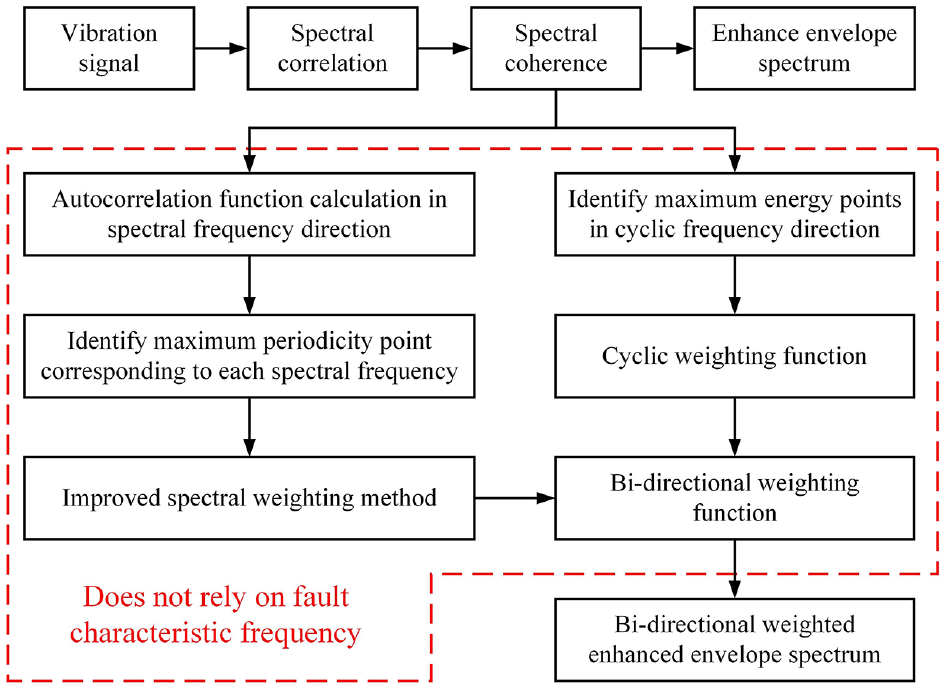
Flowchart of the proposed bidirectional weighted enhanced envelope spectrum.
Measuring the periodicity in the direction of cyclic frequency is a key step in this method. The autocorrelation of the periodic function has the same period as its original function, but the periodicity is highly enhanced, making the second-order statistic an appropriate tool to realize the design of the weighting function. The autocorrelation function of SCoh is as follows:

where η represents the cyclic frequency lag, and E{·} is the average operator.
The schematic diagram of autocorrelation function
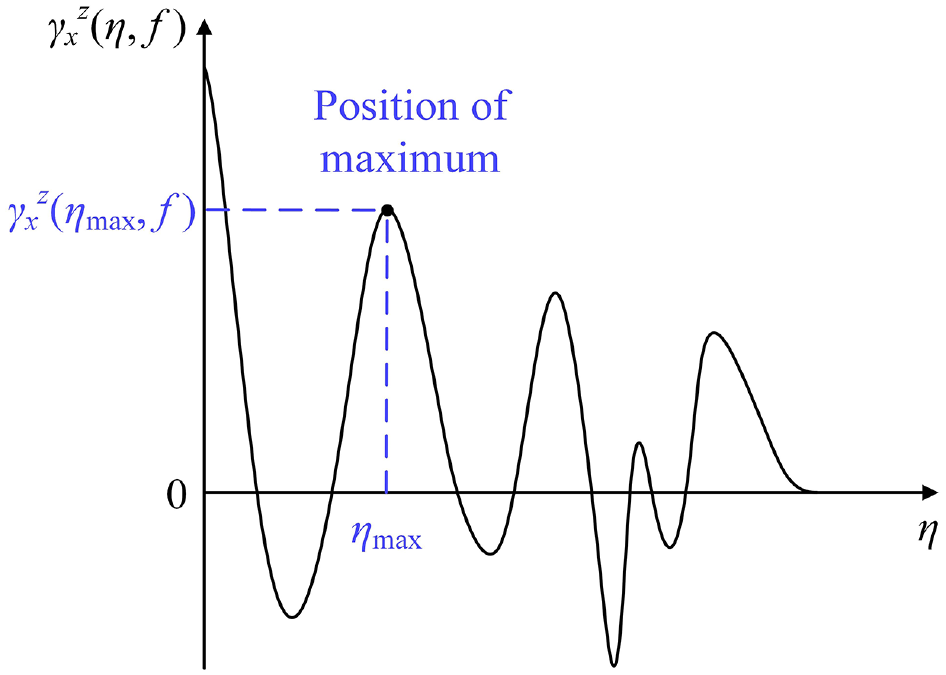
Schematic diagram of
Therefore, the value at α can be exploited to establish where the FCF is located in the envelope spectrum. The cyclic weighting function is as follows:
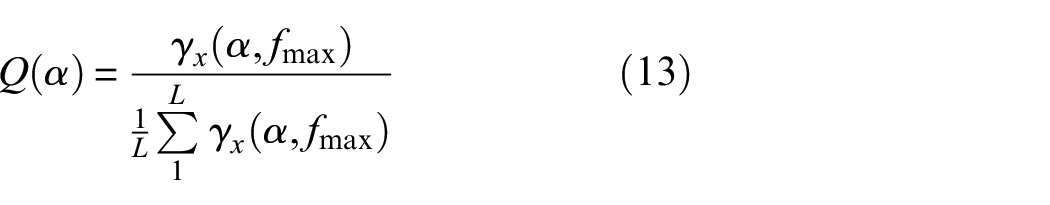
where
To enhance the resonance frequency band, the improved spectral weighting method is further developed, which is as follows:
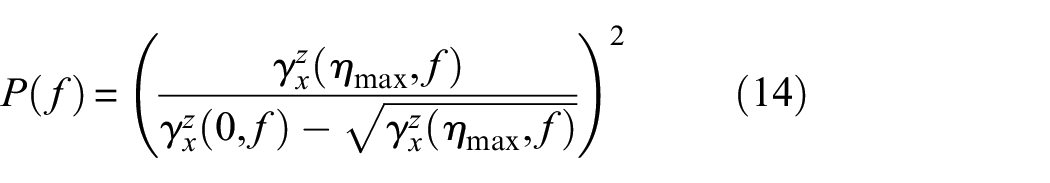
where
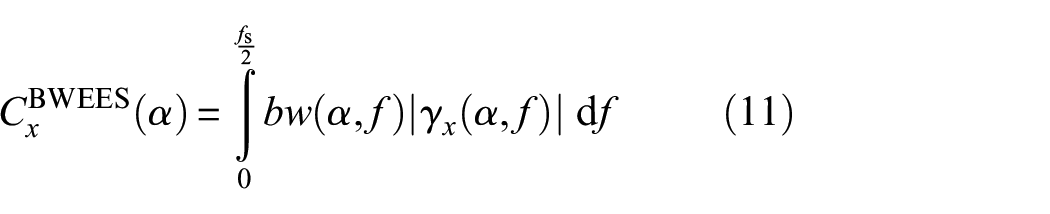
Finally, the bidirectional weighting function is presented as follows:
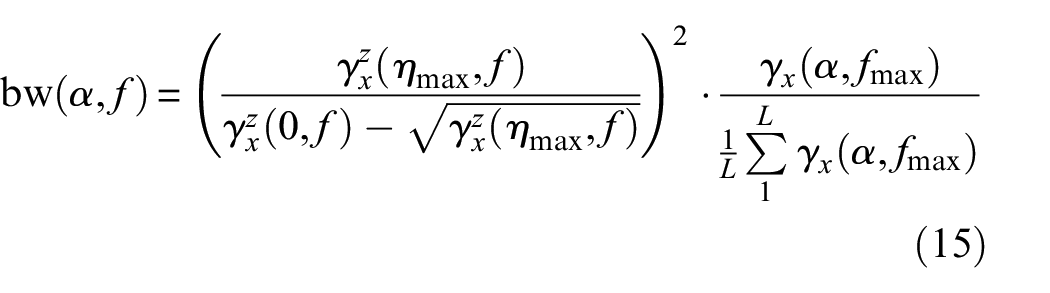
It is seen that the resonance frequency band and FCF are strengthened simultaneously by designing the improved spectral weighting method and the cyclic weighting function.
Simulation signal verification
Outer race fault bearing signal analysis
In this section, a numerical model is conducted to simulate bearing faults and validate the performance of BWEES. The detail of the numerical model is shown as follows 30 :
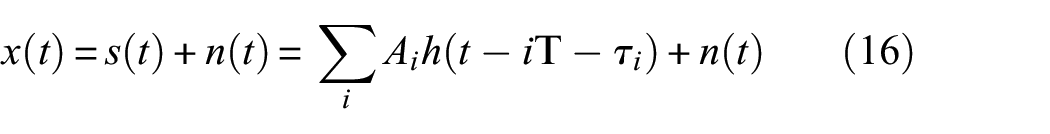


where s(t) simulates the periodic impulses of a fault, τi represents relative slip between different shocks, n(t) denotes Gaussian white noise, and Ai stands for the amplitude magnitude of the ith impact.
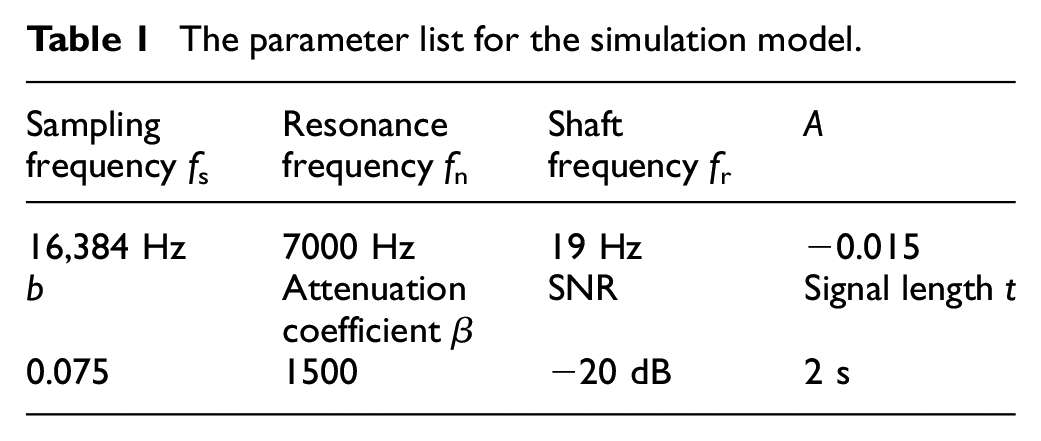
Table 1 displays the parameter values for the simulated signal, and the relative slip in the numerical model is set to 0. The FCF is calculated as 78 Hz in terms of the specific parameter values. To capture the three harmonics of FCF, the maximum cyclic frequency has been specified at 300 Hz.
The parameter list for the simulation model.
The signal waveform is presented in Figure 4(a), while its corresponding frequency spectrum is displayed in Figure 4(b). The resonance frequency band is almost submerged by noise in the spectrum. The SCoh is shown in Figure 5(a), in which no useful fault information can be revealed. As presented in Figure 5(b), only the second harmonic of FCF is identified in the EES.
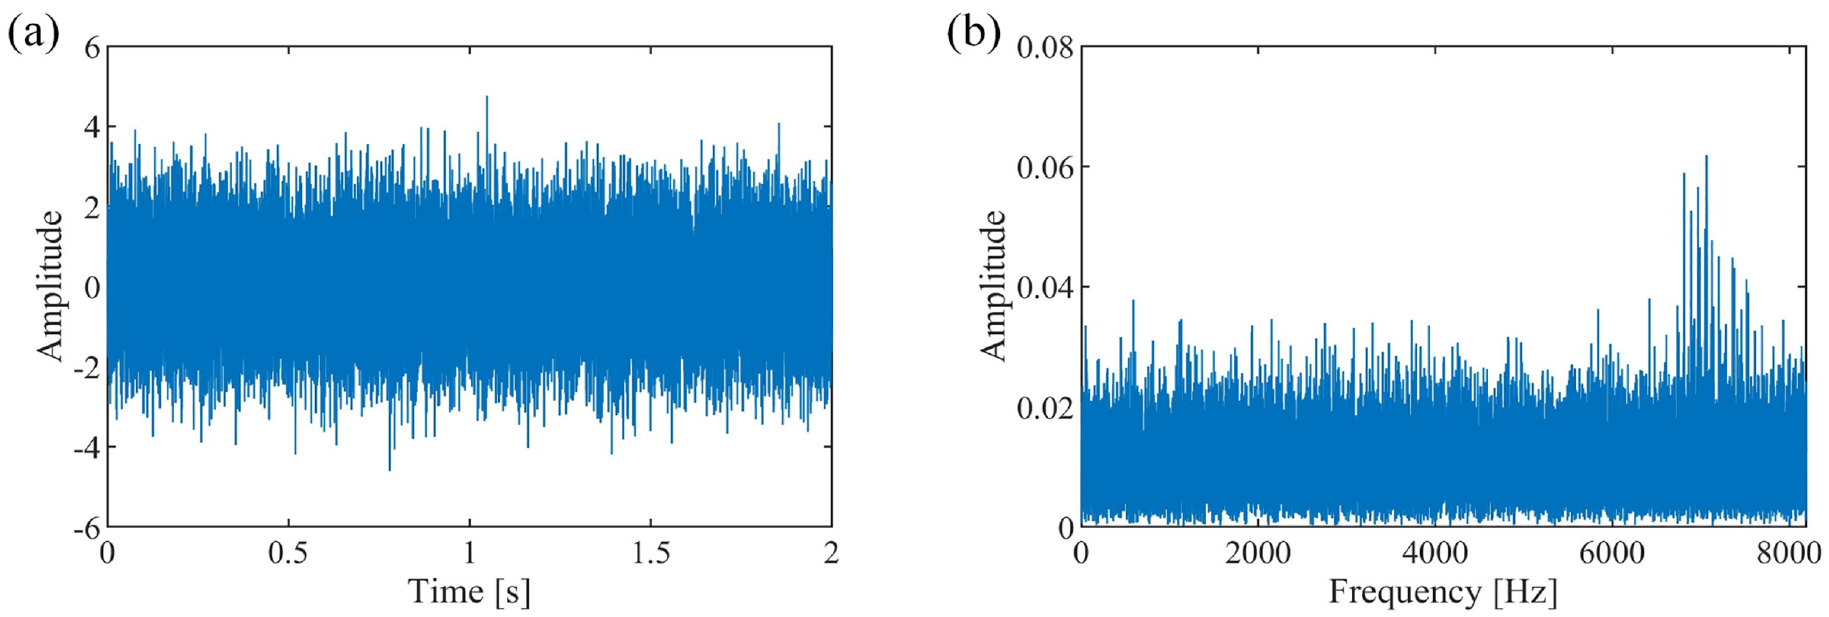
(a) Waveform and (b) the spectrum corresponding to (a).
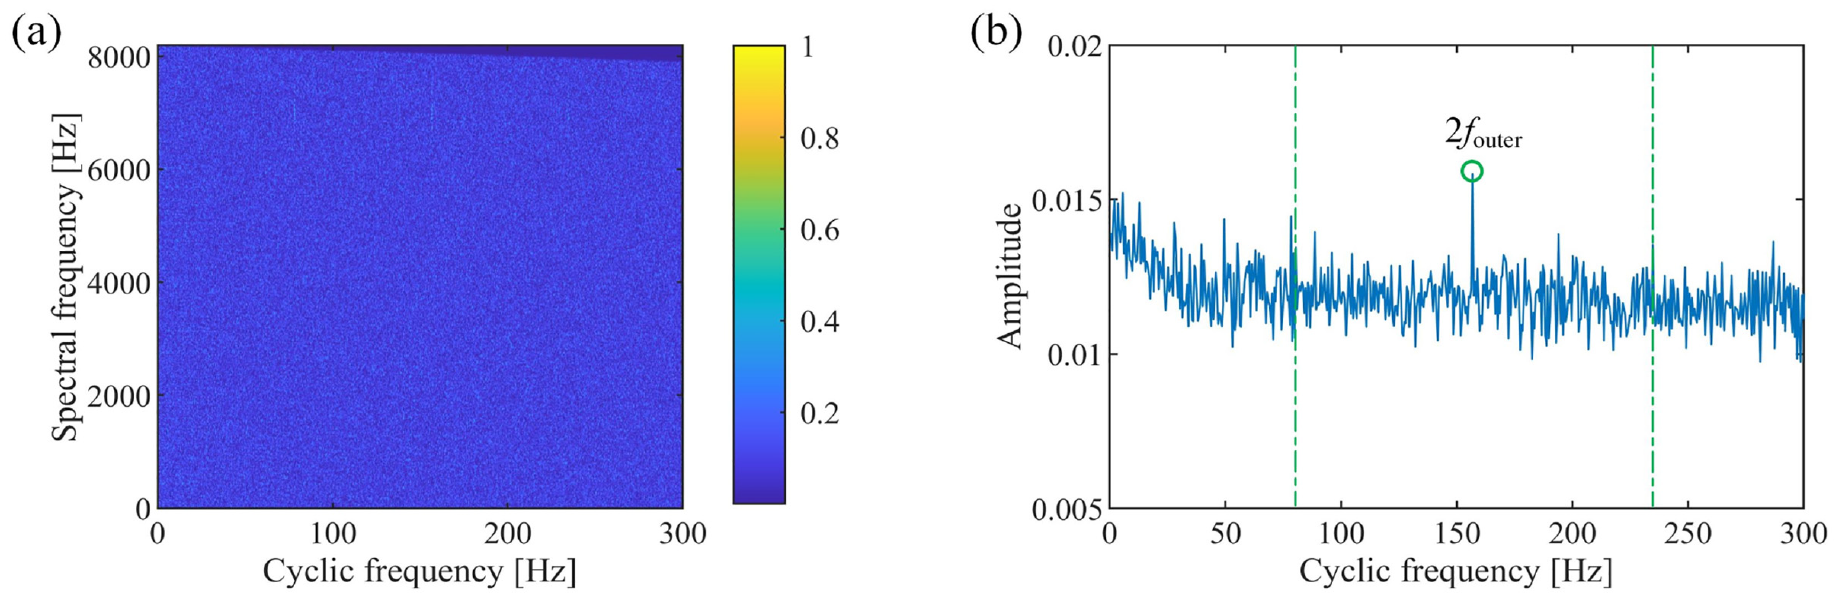
(a) SCoh and (b) EES achieved by integrating raw SCoh.
Figure 6(a) shows the Hilbert envelope spectrum (HES), in which the fault-related frequencies cannot be revealed. As depicted in Figure 6(b), the amplitude of FCF and its harmonics are small in WES, causing the fault-related spectral lines to be submerged in the surrounding spectral lines. The WEES is displayed in Figure 6(c), in which the FCF and its harmonics are not obvious. In the proposed BWEES, the fault-related spectral lines are more prominent, and the FCF can be clearly pinpointed in Figure 6(d), evidencing that the BWEES performs better than other methods.
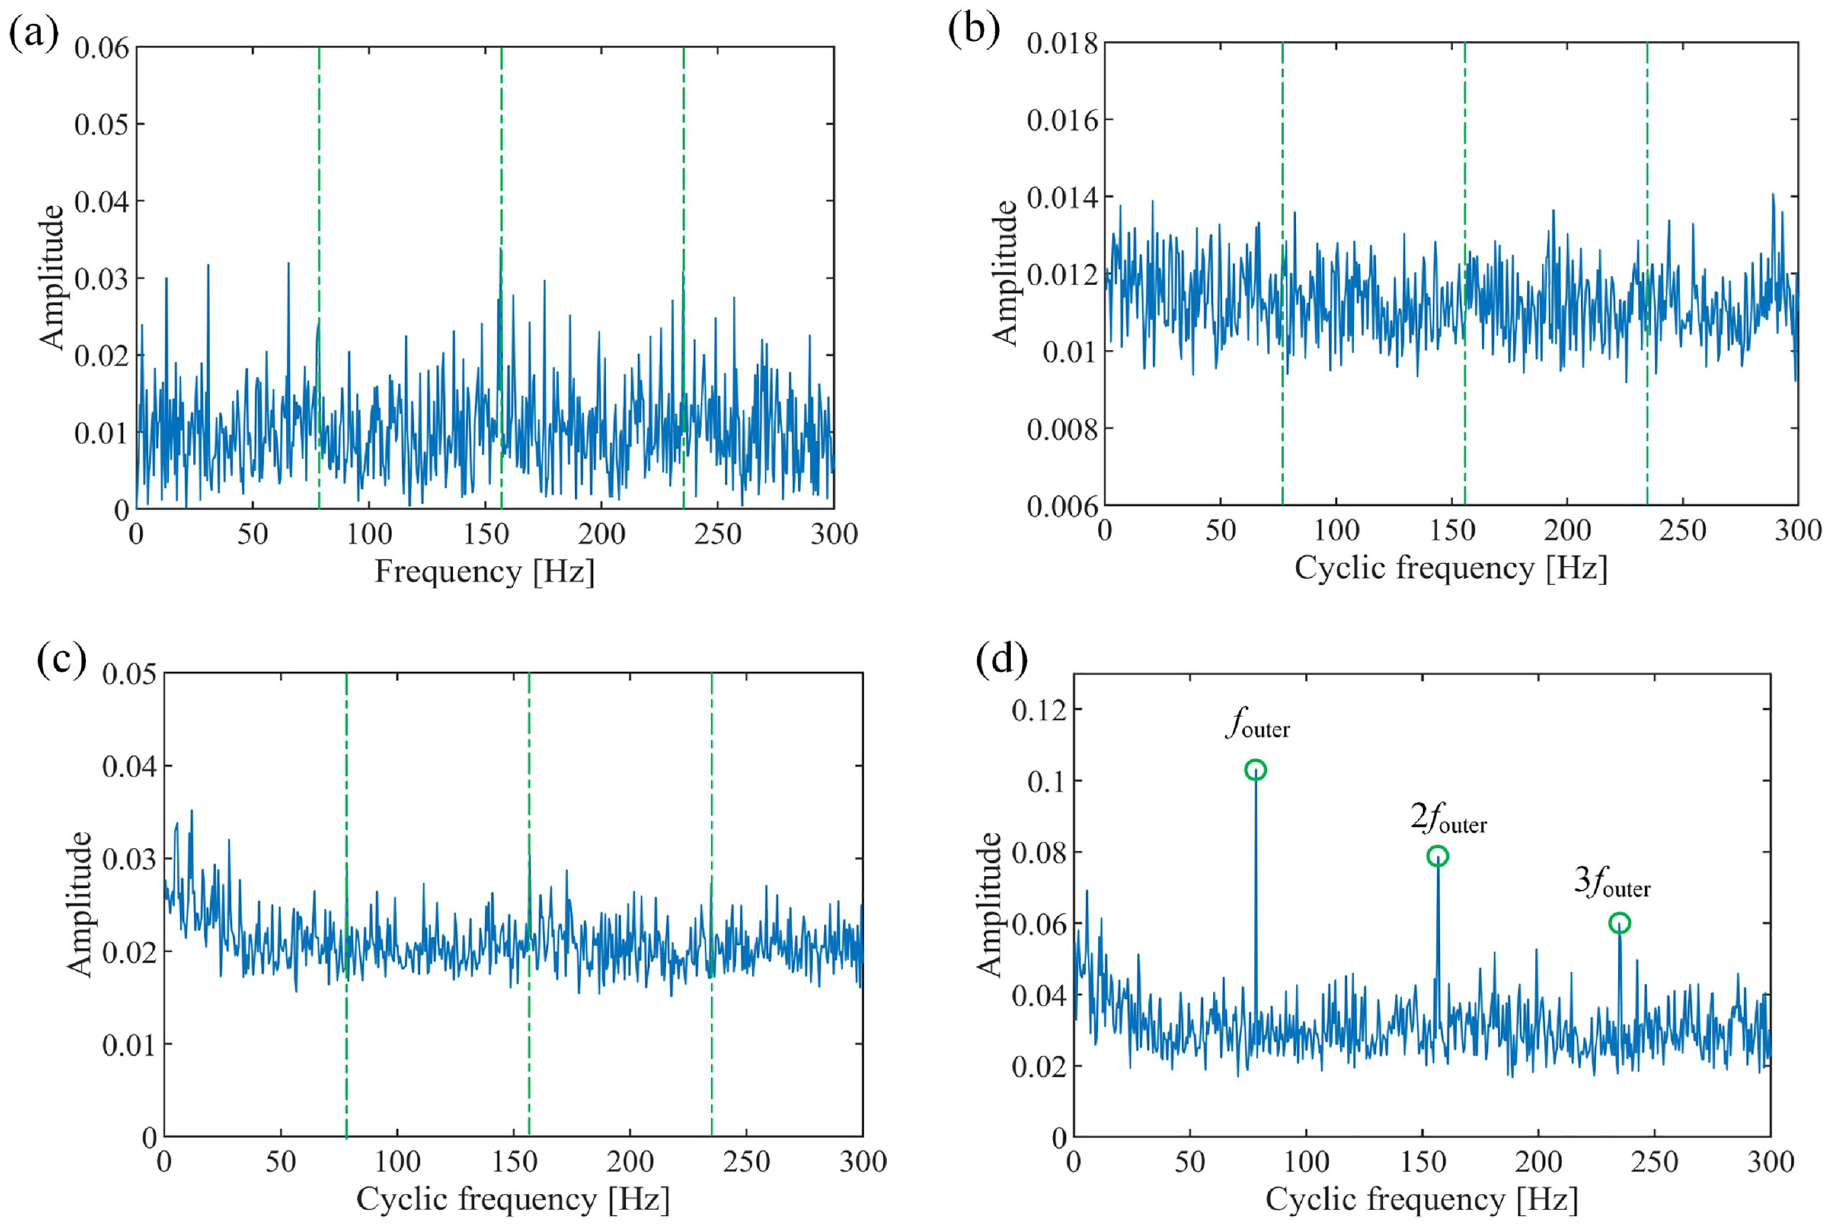
(a) HES, (b) WES, (c) WEES, and (d) the proposed BWEES.
Inner race fault bearing signal analysis
Compared with the simulation signal in the section “Outer race fault bearing signal analysis,” the amplitude modulation is added to the simulated signal of the inner race fault bearing to simulate the load variation of the fault location, in which the FCF is computed as 103 Hz.
The two-dimensional image of SCoh and its corresponding EES are displayed in Figure 7(a) and (b), respectively. The SCoh fails to reveal the periodic components caused by bearing fault, so the FCF is almost invisible in EES. Figure 8(a) to (d) shows HES, WES, WEES, and the proposed BWEES, respectively. It is found that the FCF and its harmonics interfere with the noise in Figure 8(a) and (b). Although the fundamental frequency is pinpointed in Figure 8(c), the second and third harmonics cannot be observed. Compared with the WEES, the peaks at FCF are easily identified in BWEES. This validates the advantage of the proposed BWEES.
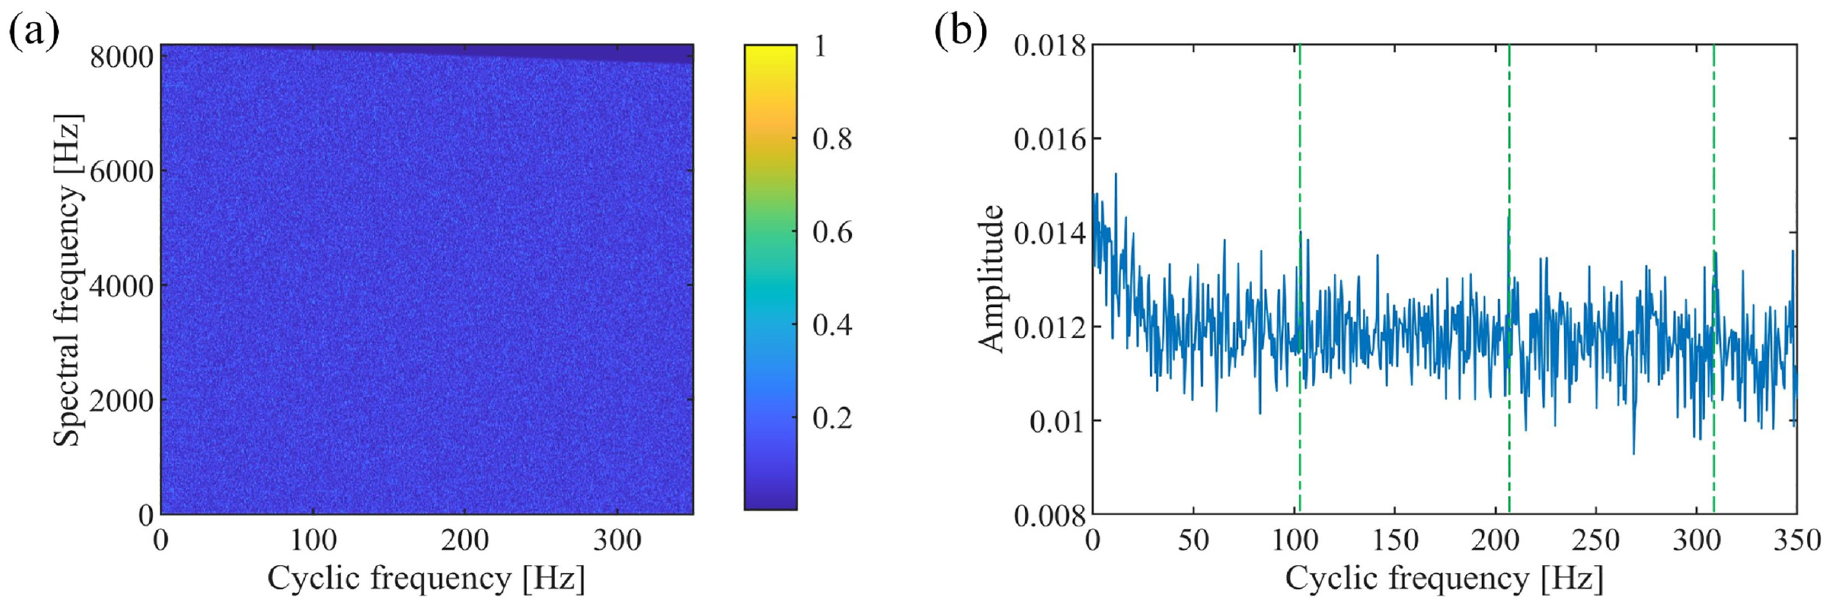
(a) SCoh and (b) EES achieved by integrating raw SCoh.
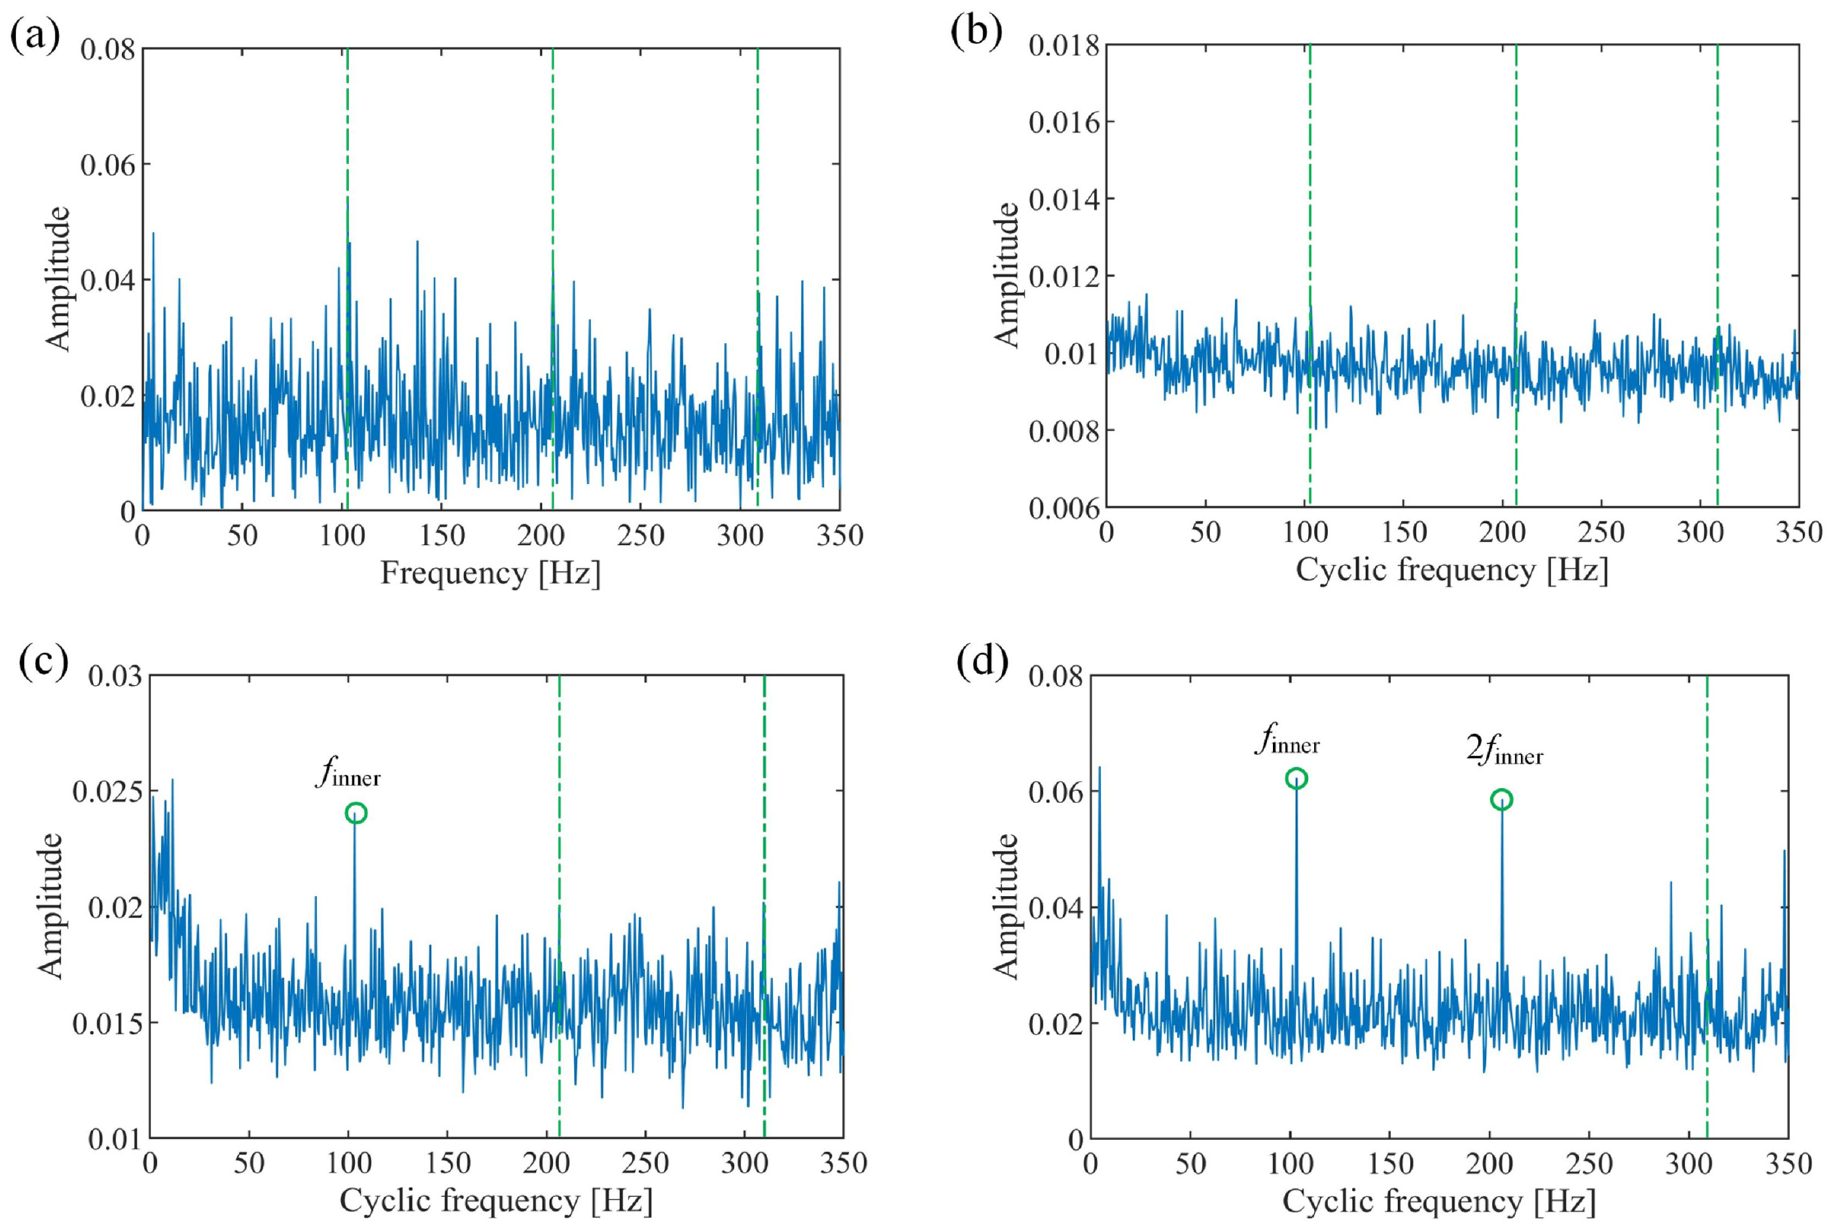
(a) HES, (b) WES, (c) WEES, and (d) the proposed BWEES.
Performance analysis
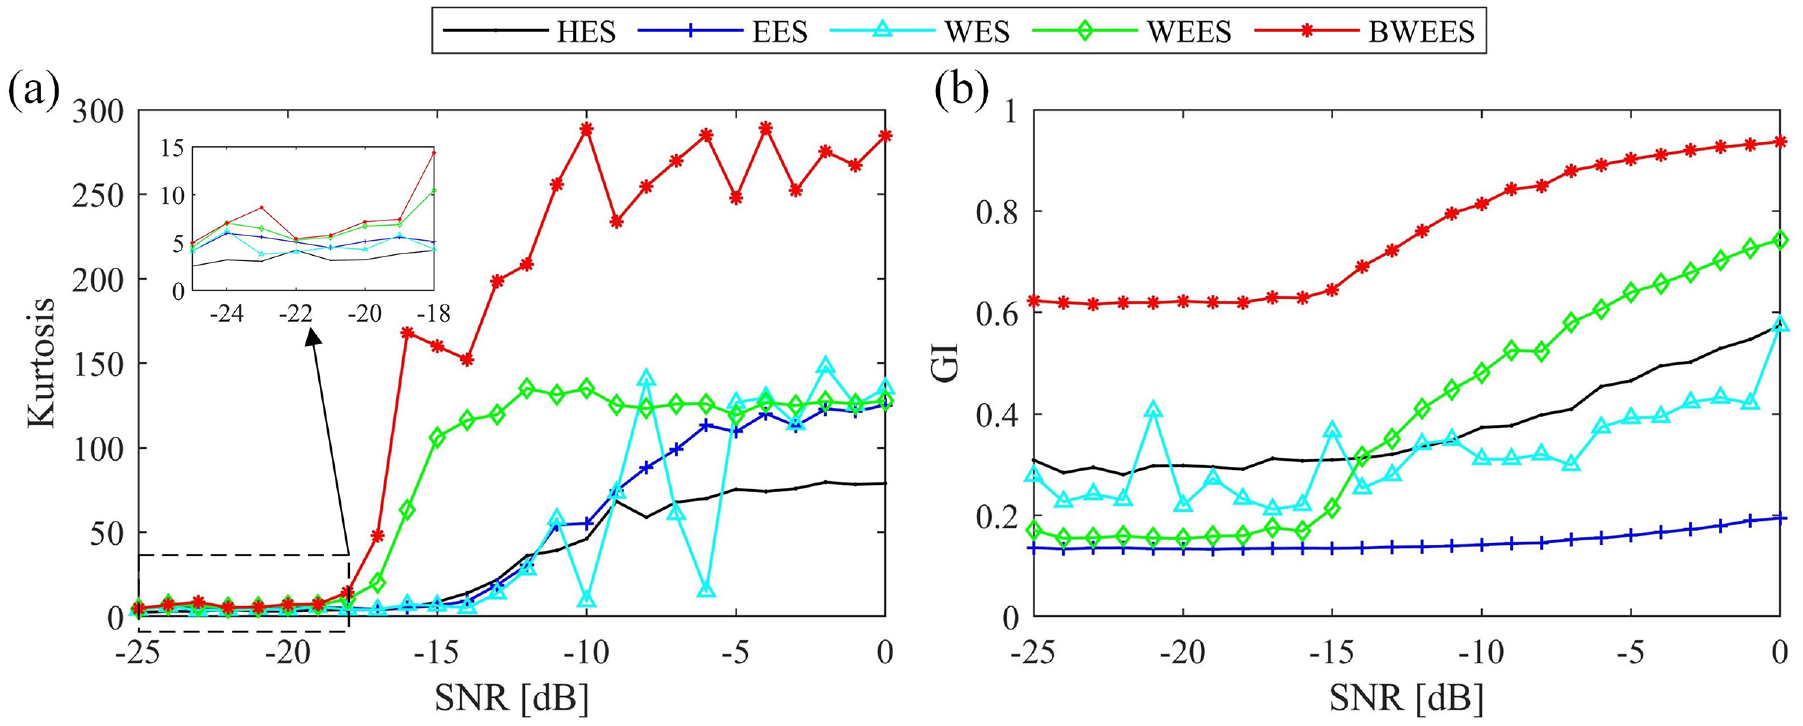
A quantitative performance evaluation is further conducted. The simulation signals in sections “Outer race fault bearing signal analysis” and “Inner race fault bearing signal analysis” are contaminated with different noise levels from 0 to −25 dB. For the outer race fault, the kurtosis and Gini index (GI) values obtained by four methods are displayed in Figure 9. Under all SNRs, the kurtosis and GI values of BWEES are larger than those of the other three methods. The index values of the inner race fault signal are presented in Figure 10, which is similar to the result in Figure 9. According to the above results, BWEES is capable of getting better results than other methods, although the amplitude of interference components in SCoh will increase with the enhancement of noise, thus affecting the proposed framework to identify fault components.
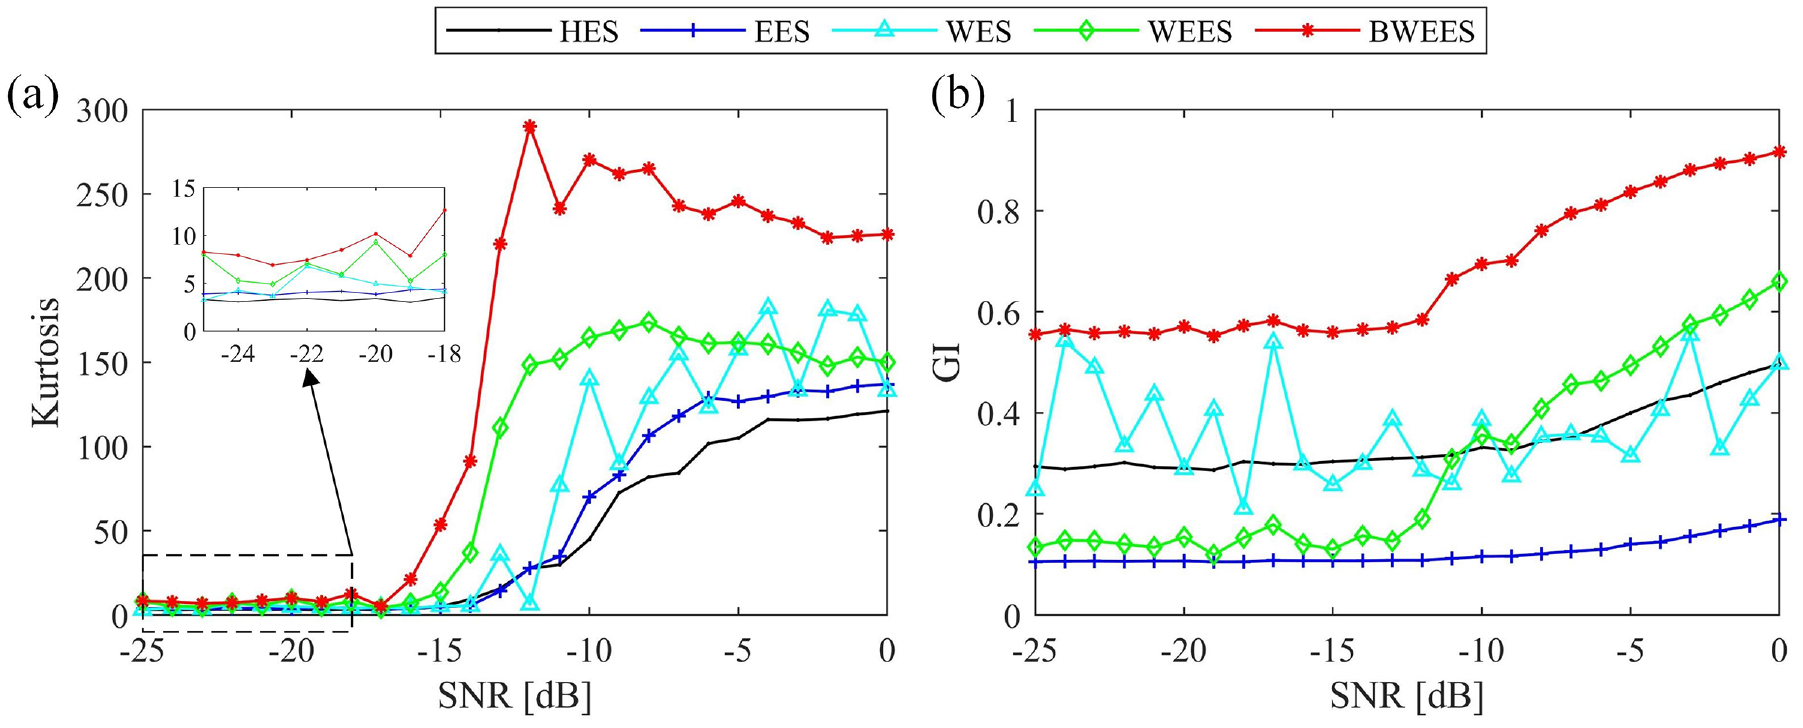
(a) Kurtosis and (b) Gini index of HES, EES, WES, WEES, and the proposed BWEES for outer race fault bearing simulation signal under difference SNRs.
(a) Kurtosis and (b) Gini index of HES, EES, WES, WEES, and the proposed BWEES for inner race fault bearing simulation signal under difference SNRs.
Experimental signal verification
In this section, four bearing experimental datasets from three different test rigs are exploited to further confirm the performance of BWEES. Moreover, the superiority of BWEES is demonstrated by comparing with HES, EES, WES, and WEES.
Case 1
The bearing fault data acquired from the Case Western Reserve University (CWRU) 35 are first exploited to confirm the performance of BWEES. The test rig primarily includes a 2 hp motor (1 hp = 746 W), a torque sensor, electronic control equipment, and a power meter. The type of monitored bearing utilized to support the motor shaft is SKF6205.
Outer race fault bearing signal analysis
An outer race fault-bearing vibration signal is analyzed in this subsection. The rotational frequency is 29.3 Hz, and an acceleration sensor mounted on the bearing seat is utilized to capture the signal with a sample rate of 12 kHz. The FCF is computed as 107 Hz and, to observe the harmonics of FCF, the maximum cyclic frequency has been specified at 400 Hz.
Figure 11(a) presents the signal waveform, which is contaminated by heavy noise with an SNR of −16 dB. As represented in Figure 10(b), the resonance frequency is not obvious in the spectrum. Figure 12(a) shows the SCoh, and the EES is displayed in Figure 11(b). There is no useful fault information in SCoh and EES.
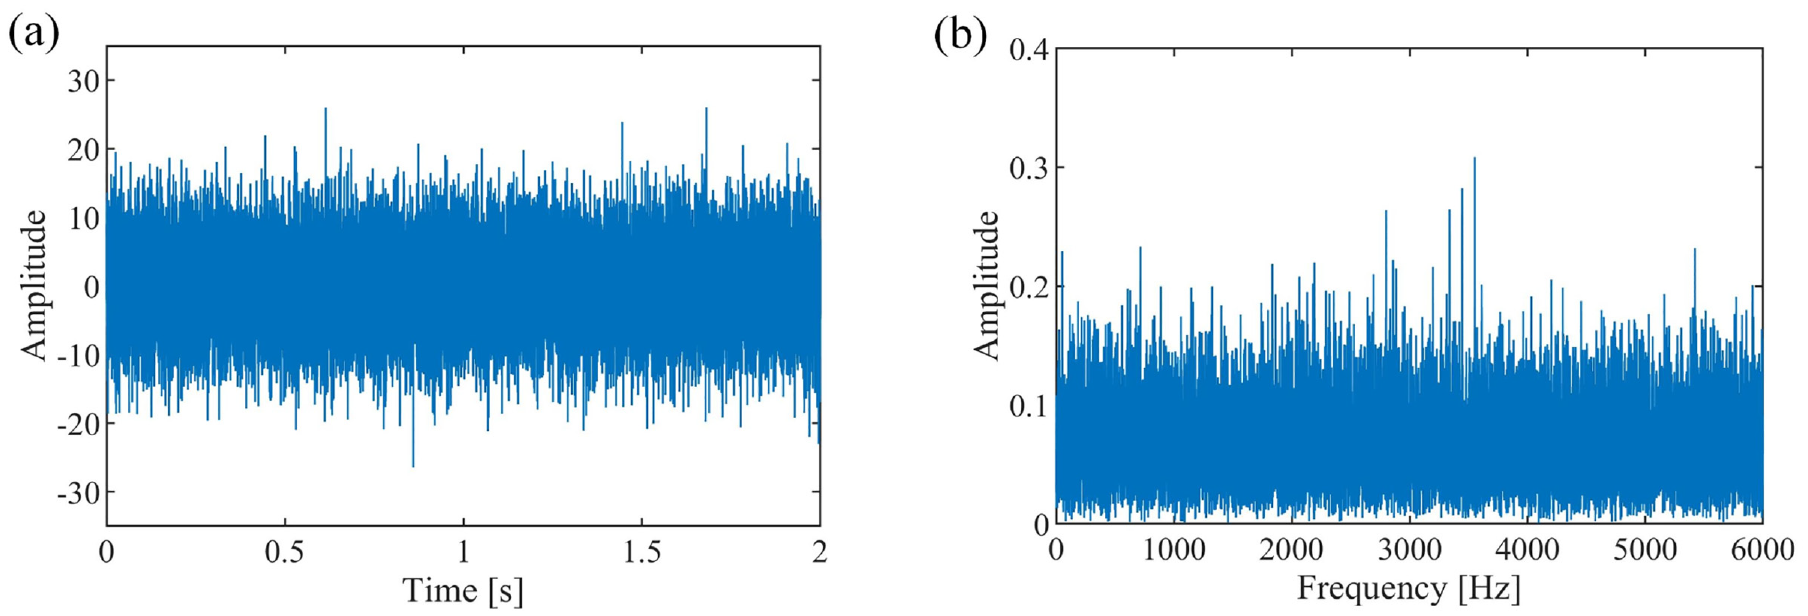
(a) Waveform and (b) spectrum corresponding to (a).
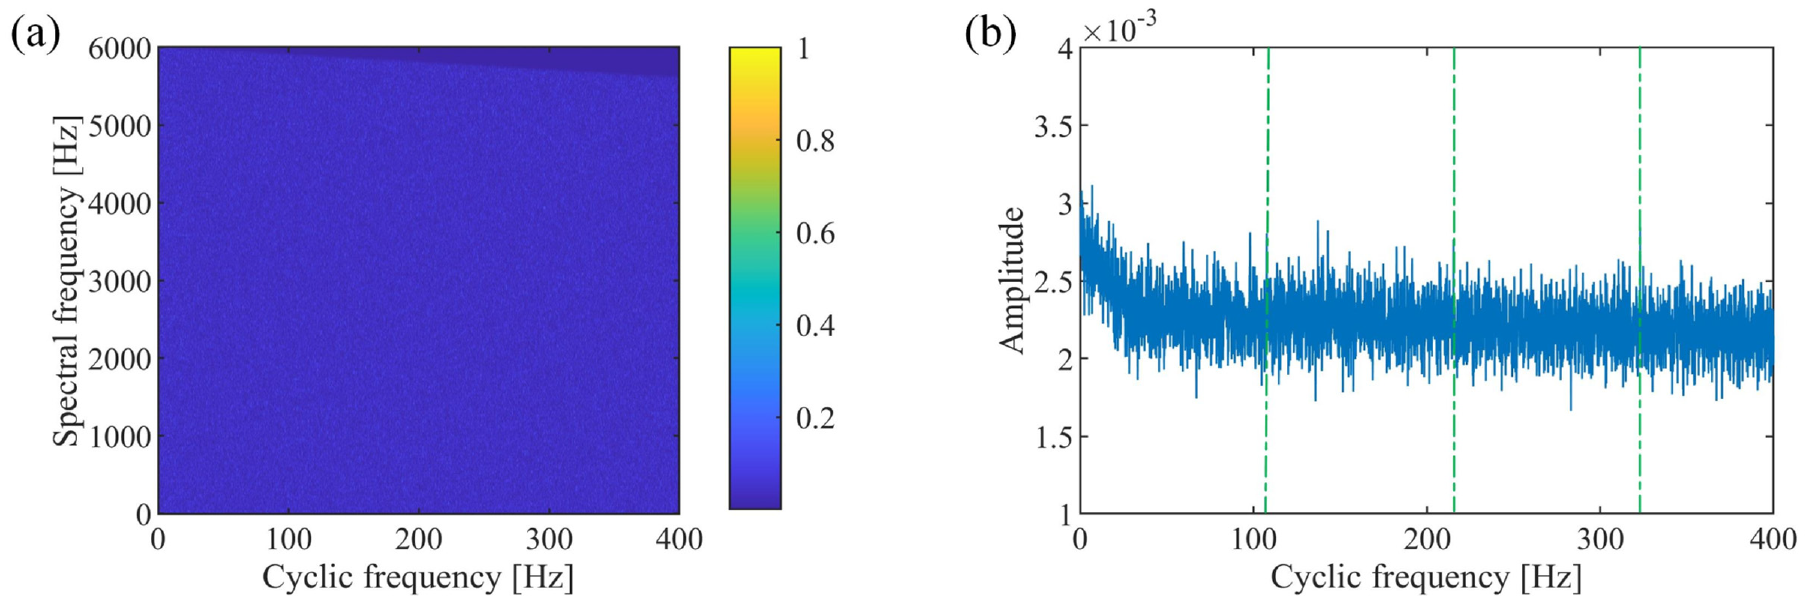
(a) SCoh and (b) EES achieved by integrating raw SCoh.
Figure 13(a) presents the HES, in which the fault-related frequencies are overwhelmed by noise. The WES and WEES are displayed in Figure 13(b) and (c), respectively. Although there are some prominent spectral lines in WES and WEES, the FCF cannot be identified. In Figure 13(d), three dominant peaks at the FCF and its harmonics are directly pinpointed in the BWEES, evidencing that the BWEES achieves better performance than other methods.
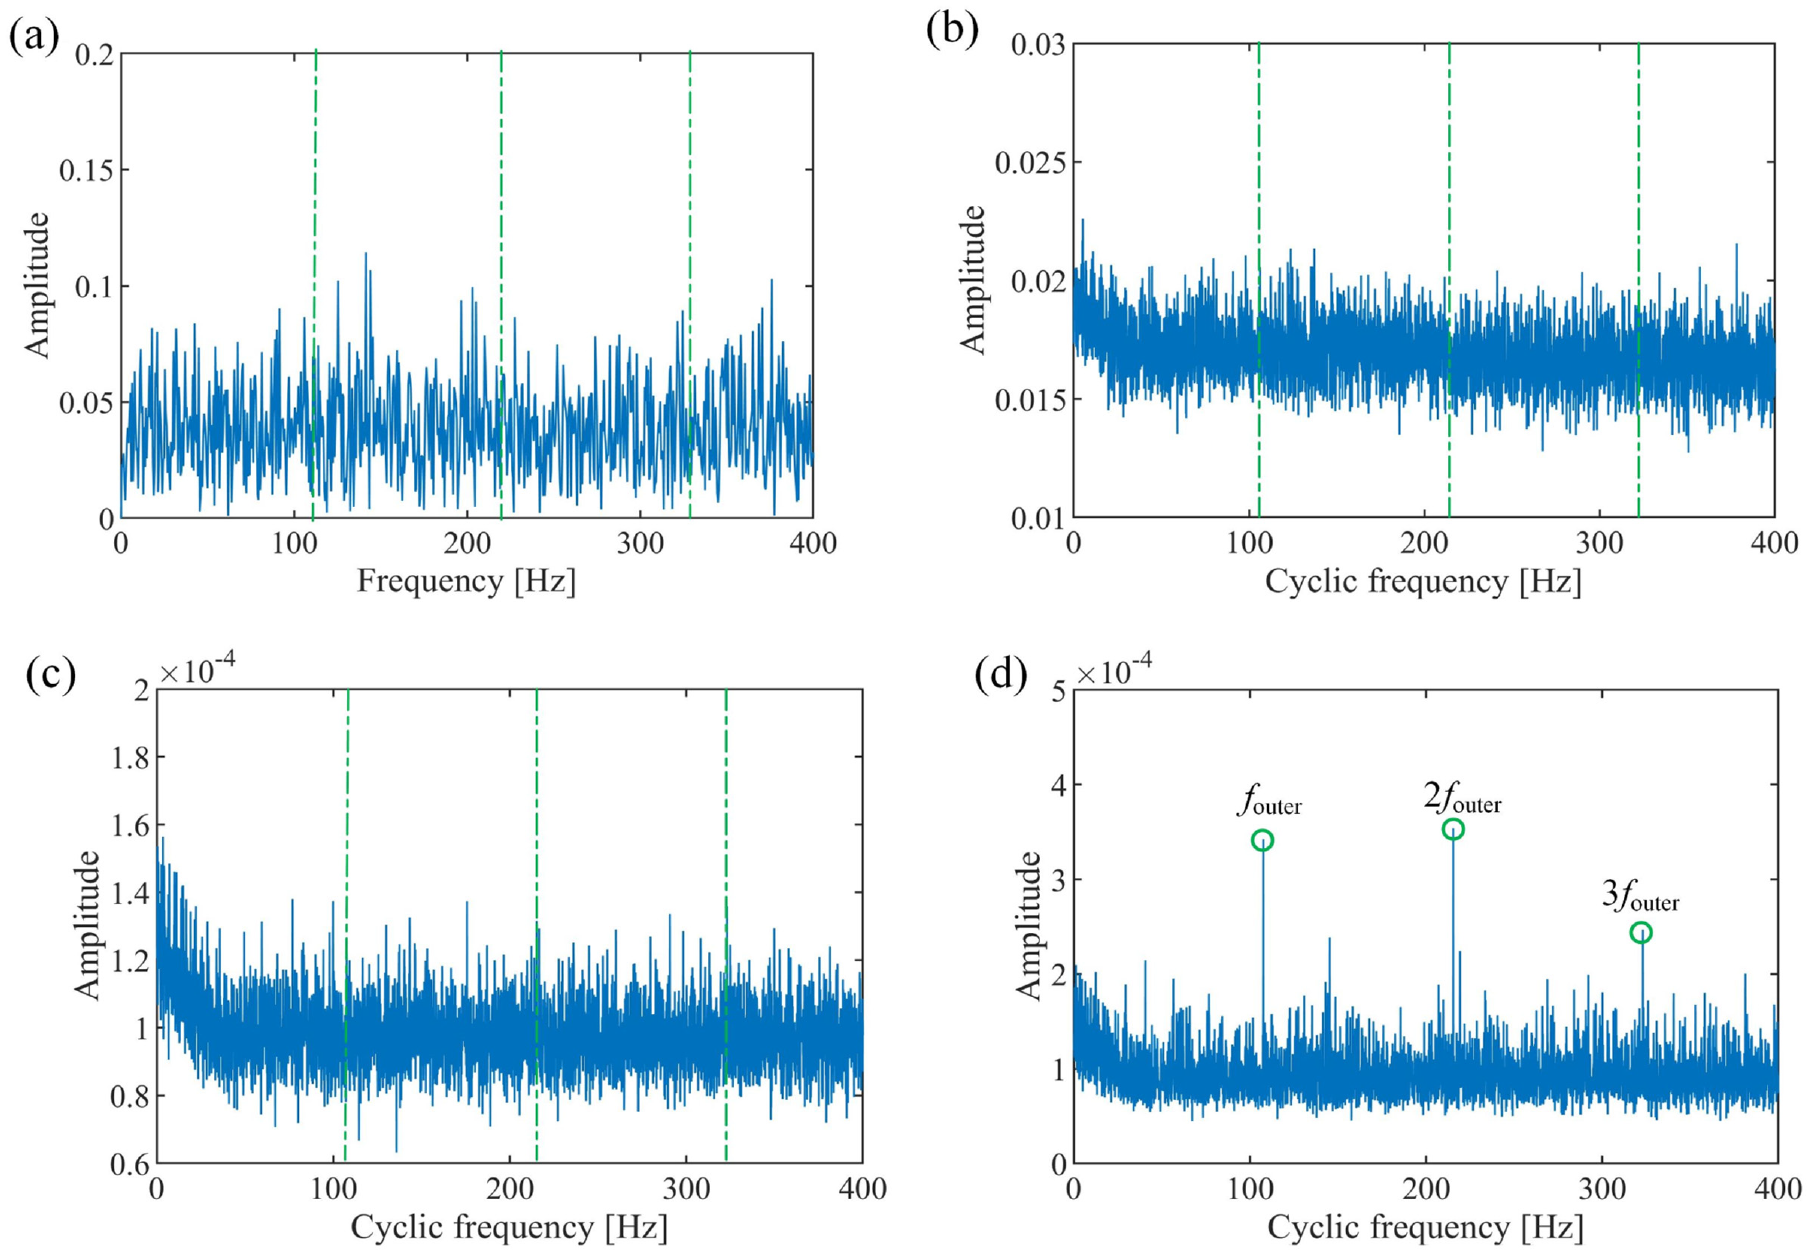
(a) HES, (b) WES, (c) WEES, and (d) the proposed BWEES.
Inner race fault bearing signal analysis
The inner race fault bearing vibration data are then analyzed, which is collected with a sampling rate of 12 kHz, while the rotational frequency of the shaft is approximately 30 Hz. The FCF is computed as 161 Hz and the maximum cyclic frequency is specified at 550 Hz.
The noise is also introduced to the data to illustrate the superiority of the BWEES under noise. Figure 14(a) shows the signal waveform. The spectrum is represented in Figure 14(b), where resonance frequency cannot be found. The SCoh and EES are presented in Figure 15(a) and (b), respectively. The periodic components induced by bearing fault cannot be identified in SCoh, while only the fundamental frequency can be revealed in EES. Figure 16(a) shows the HES, and Figure 16(b) presents the WES. In Figure 16(a) and (b), the fault-related frequencies are overwhelmed by noise. As represented in Figure 16(c), the fundamental frequency is revealed, but its harmonics cannot be identified in WEES. In the BWEES, three peaks corresponding to the FCF and its harmonic are clearly pinpointed in Figure 16(d). This confirms the advantage of the proposed BWEES.
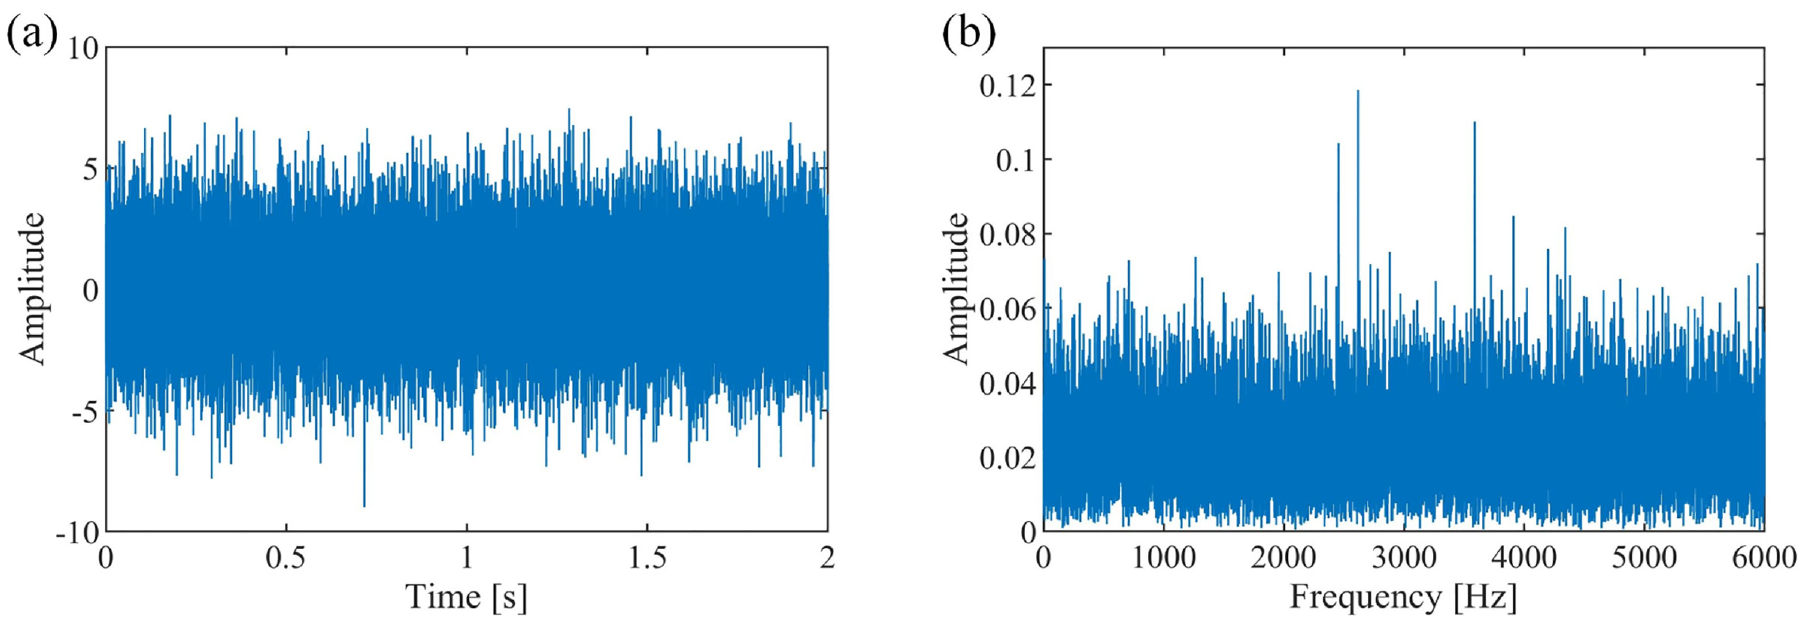
(a) Waveform and (b) spectrum corresponding to (a).
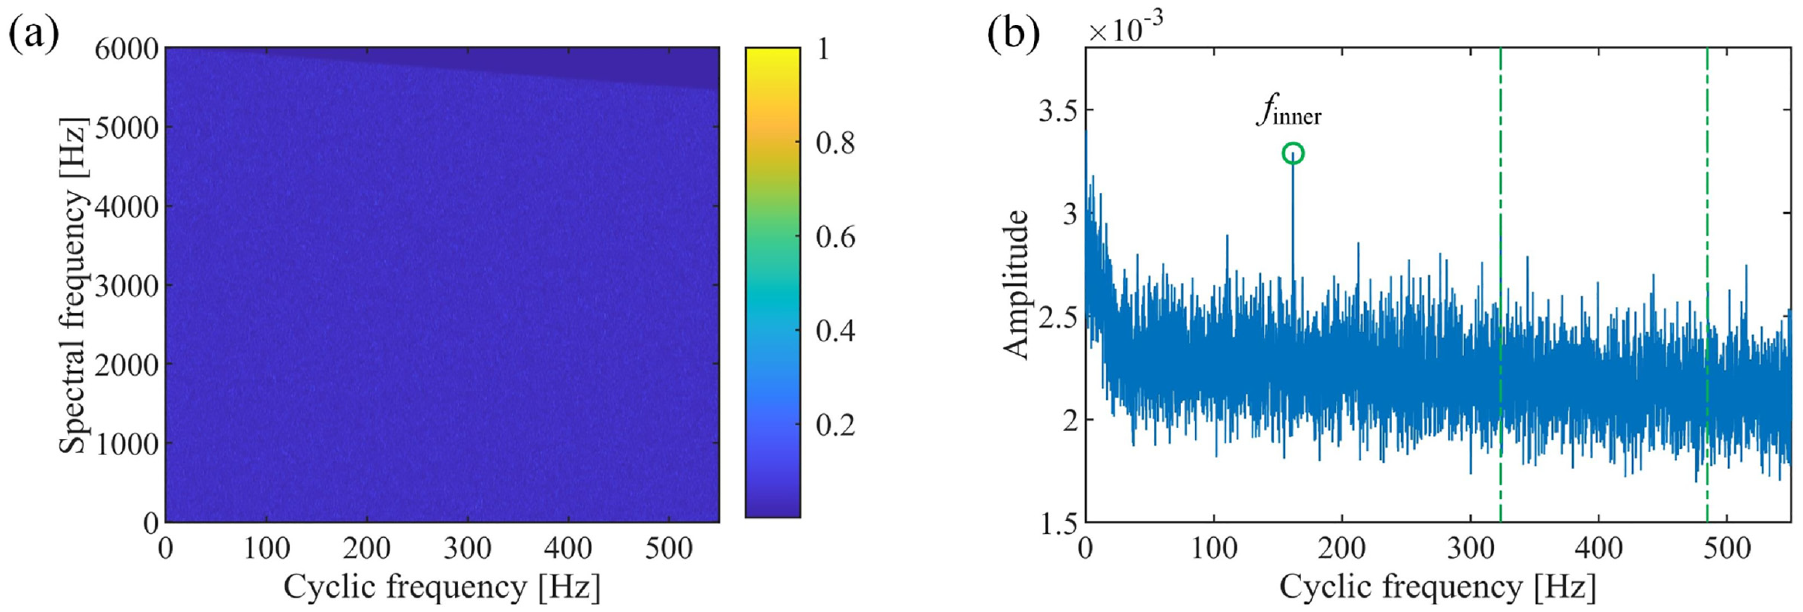
(a) SCoh and (b) EES achieved by integrating raw SCoh.
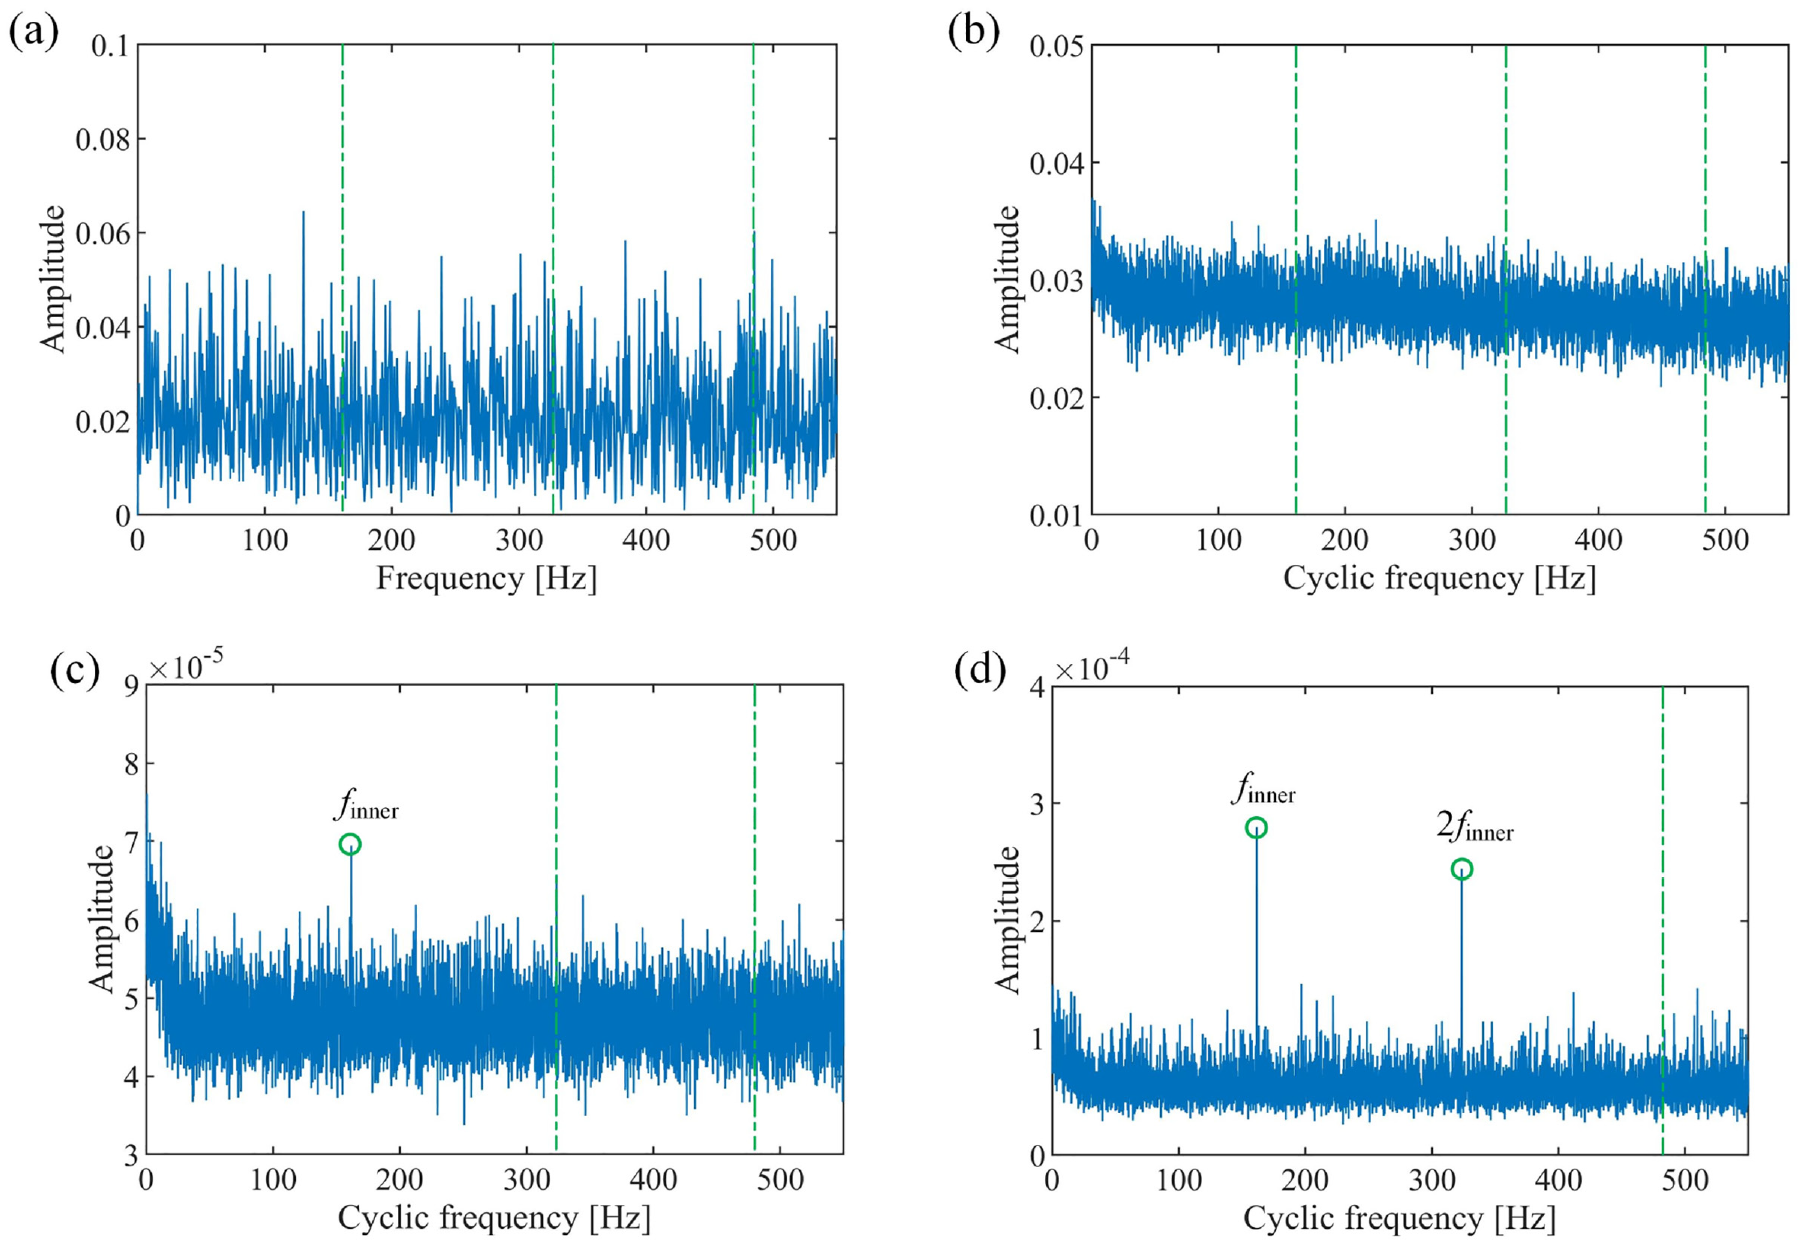
(a) HES, (b) WES, (c) WEES, and (d) the proposed BWEES.
Case 2
In this section, the experimental data obtained from the test rig of the Beijing University of Technology are analyzed. The specific components of this test rig are depicted in Figure 17. The rotational frequency is specified at 20 Hz, and an acceleration sensor is exploited to capture the vibration signal with a sampling frequency of 65.5 kHz. The SKF6010 bearing is utilized as the monitored faulty bearing, while its corresponding parameter values are represented in Table 2.
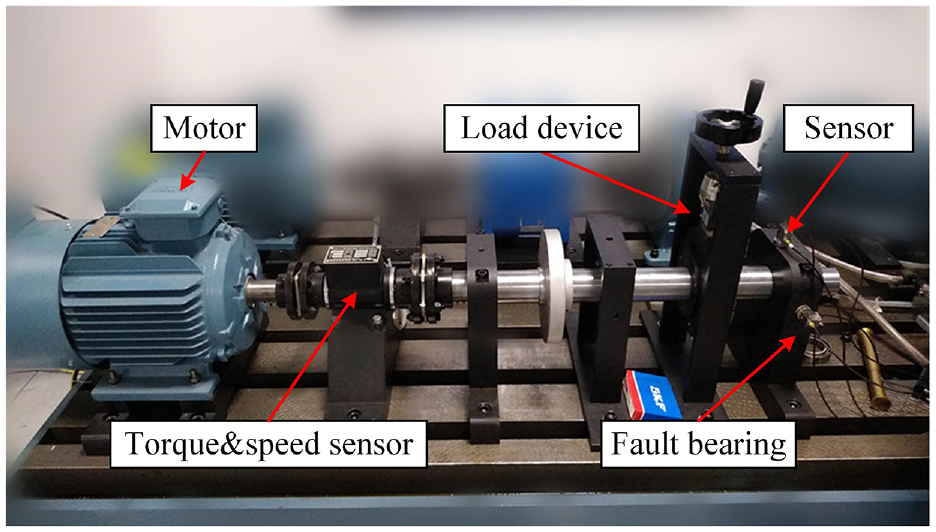
The rotating machinery vibration test rig.
Parameter list for bearing.
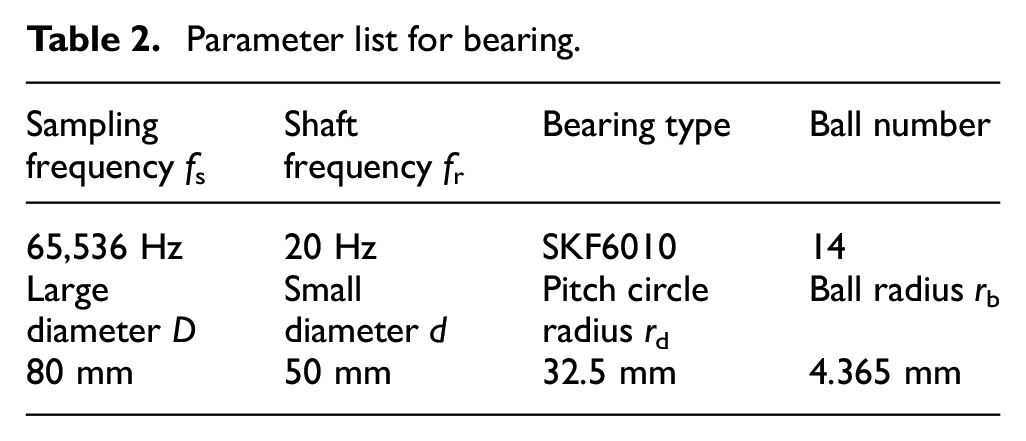
Figure18 shows the signal waveform and spectrum, while the SCoh and its corresponding EES are displayed in Figure 19. In Figure 18(b), no apparent resonance band is observed due to the heavy contamination of noise. There is no useful fault information in SCoh, and the fault-related frequencies are hardly pinpointed in EES. Figure 20(a) to (d) presents HES, WES, WEES, and the proposed BWEES, respectively. Meanwhile, the fault-related information cannot be revealed in Figure 20(a) to (c). In Figure 20(d), three fault-related peaks are clearly pinpointed at FCF and its harmonics from BWEES, indicating that the BWEES achieves the optimal spectrum.
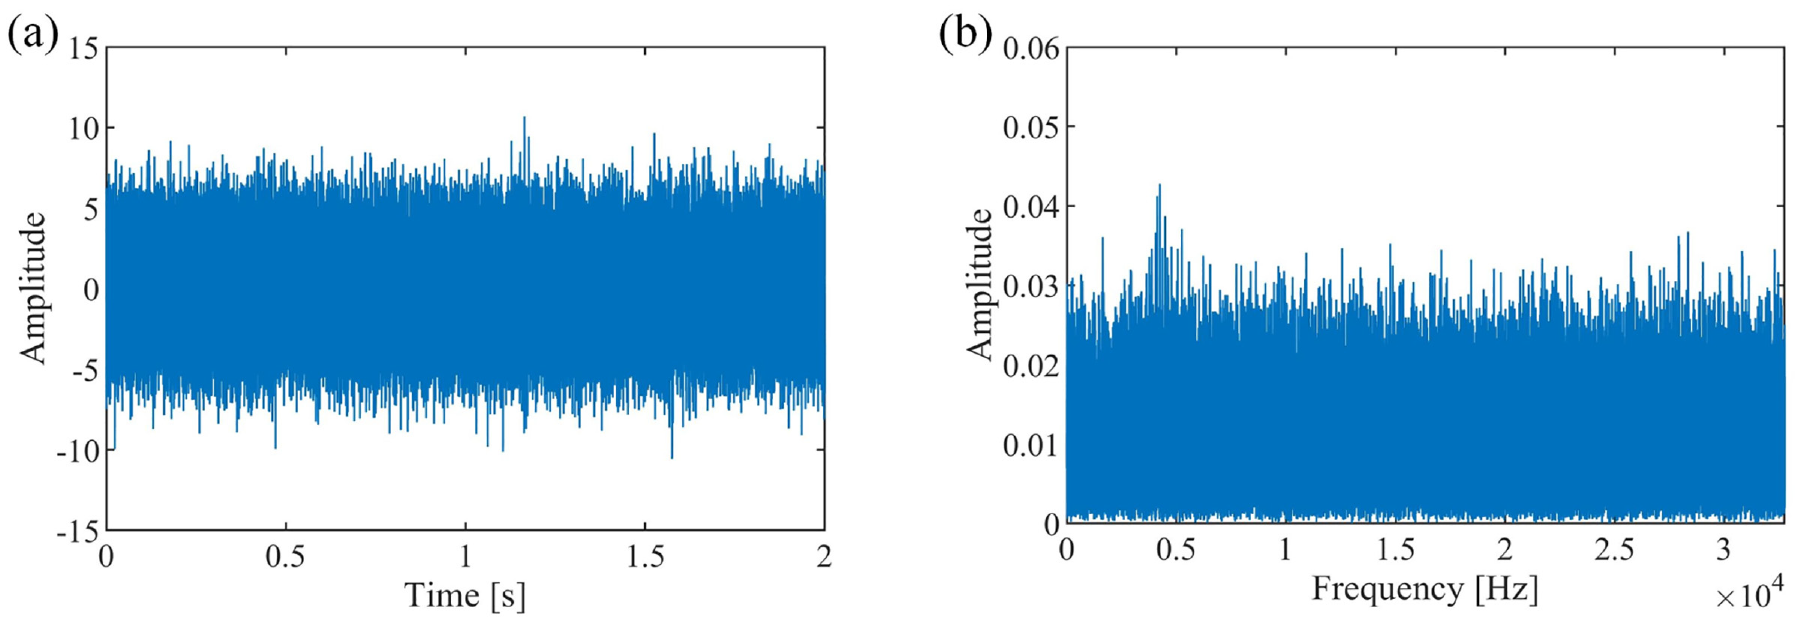
(a) Waveform and (b) spectrum corresponding to (a).
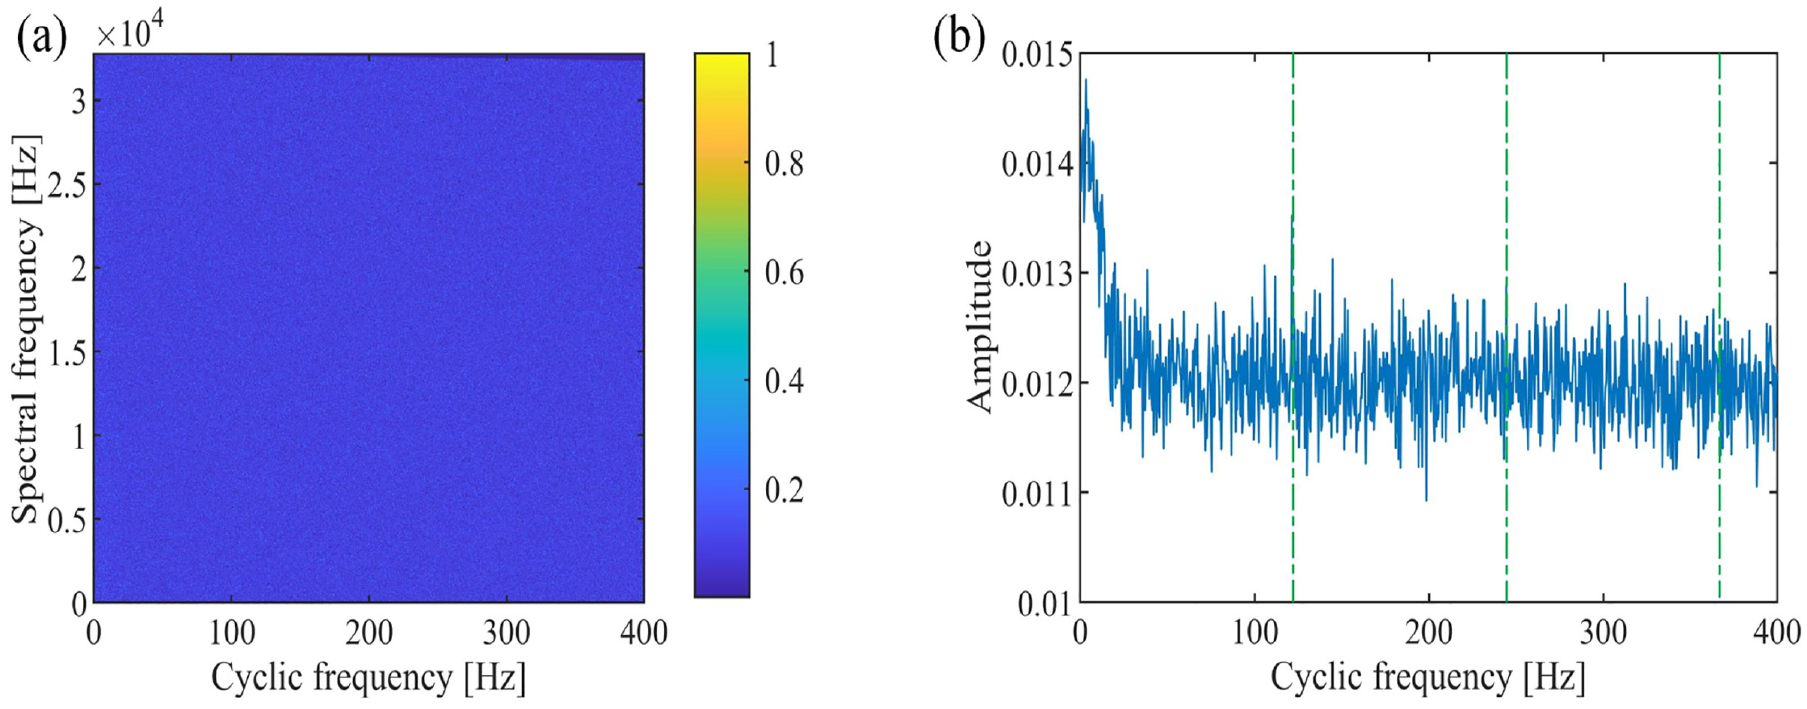
(a) SCoh and (b) EES achieved by integrating raw SCoh.
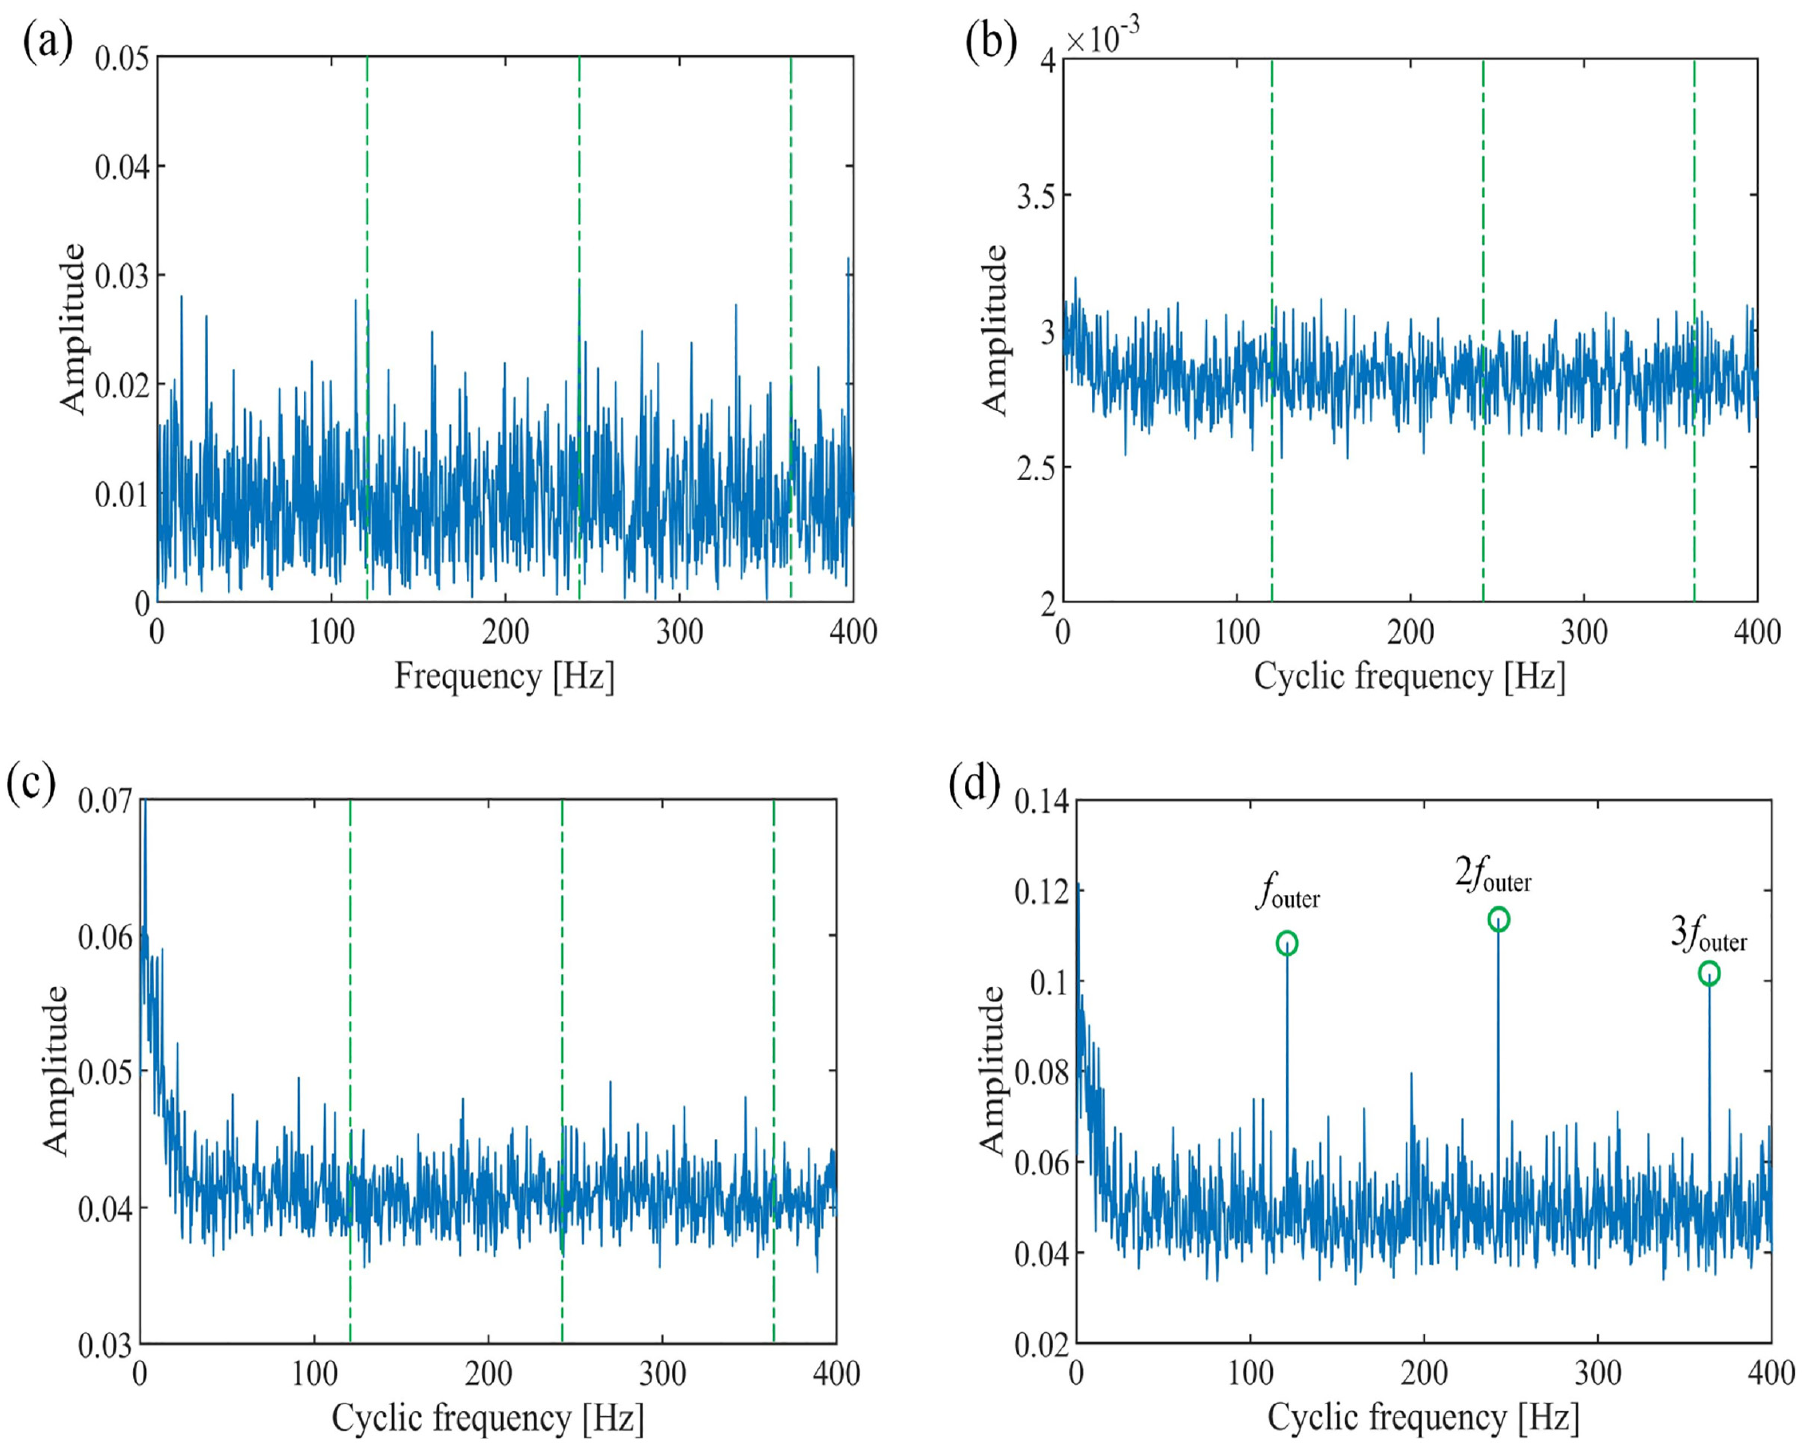
(a) HES, (b) WES, (c) WEES, and (d) the proposed BWEES.
Case 3
To better evaluate the proposed BWEES, the aircraft engine signal from the Safran contest has been introduced. 36 The kinematic details of the gearbox are illustrated in Figure 21. The bearing damage caused by an outer race fault occurs on shaft L5. The equipment is operated for 200 s and “Acc2” is installed near shaft L5 to collect the raw signal.
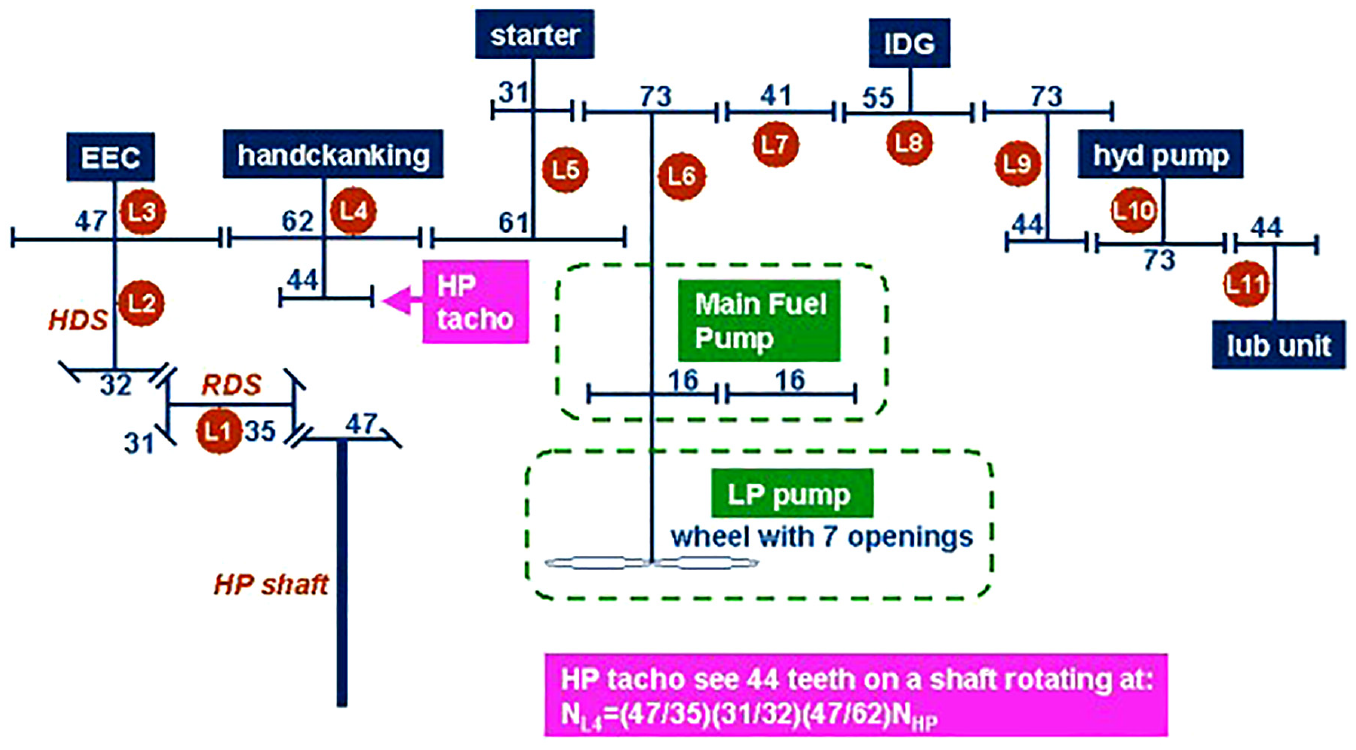
Kinematics of the gearbox. 35
Figure 22(a) presents the signal waveform, while Figure 22(b) displays its corresponding spectrum. It should be noted that, to verify the performance of the proposed method, heavy noise with an SNR of −6 dB is introduced to the signal. The repetitive fault impulses are invisible in Figure 22(a), while the resonance frequency cannot be accurately identified in Figure 22(b). Figure 23(a) and (b) shows the SCoh and EES, respectively. The SCoh fails to reveal the fault information, making it difficult to determine FCF in EES. In Figure 24(a), although the shaft frequency is identified, the fault-related frequencies are not pinpointed from the HES. Figure 24(b) and (c) displays the WES and WEES, in which no diagnostic information is available. In BWEES presented in Figure 24(d), not only the shaft frequency but also the fault-related information can obviously be revealed, indicating that the BWEES obtains a clearer spectrum than other methods.
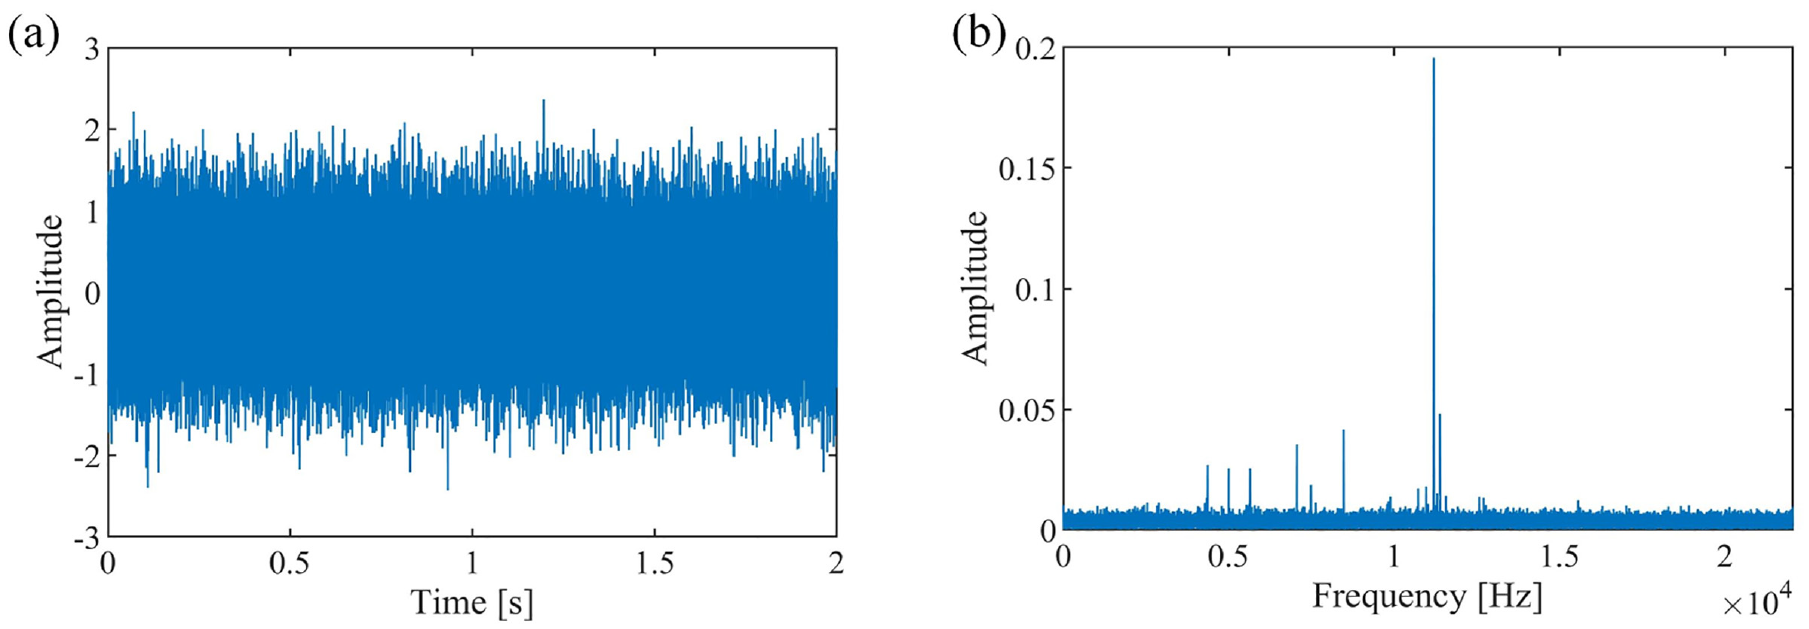
(a) Waveform and (b) spectrum corresponding to (a).
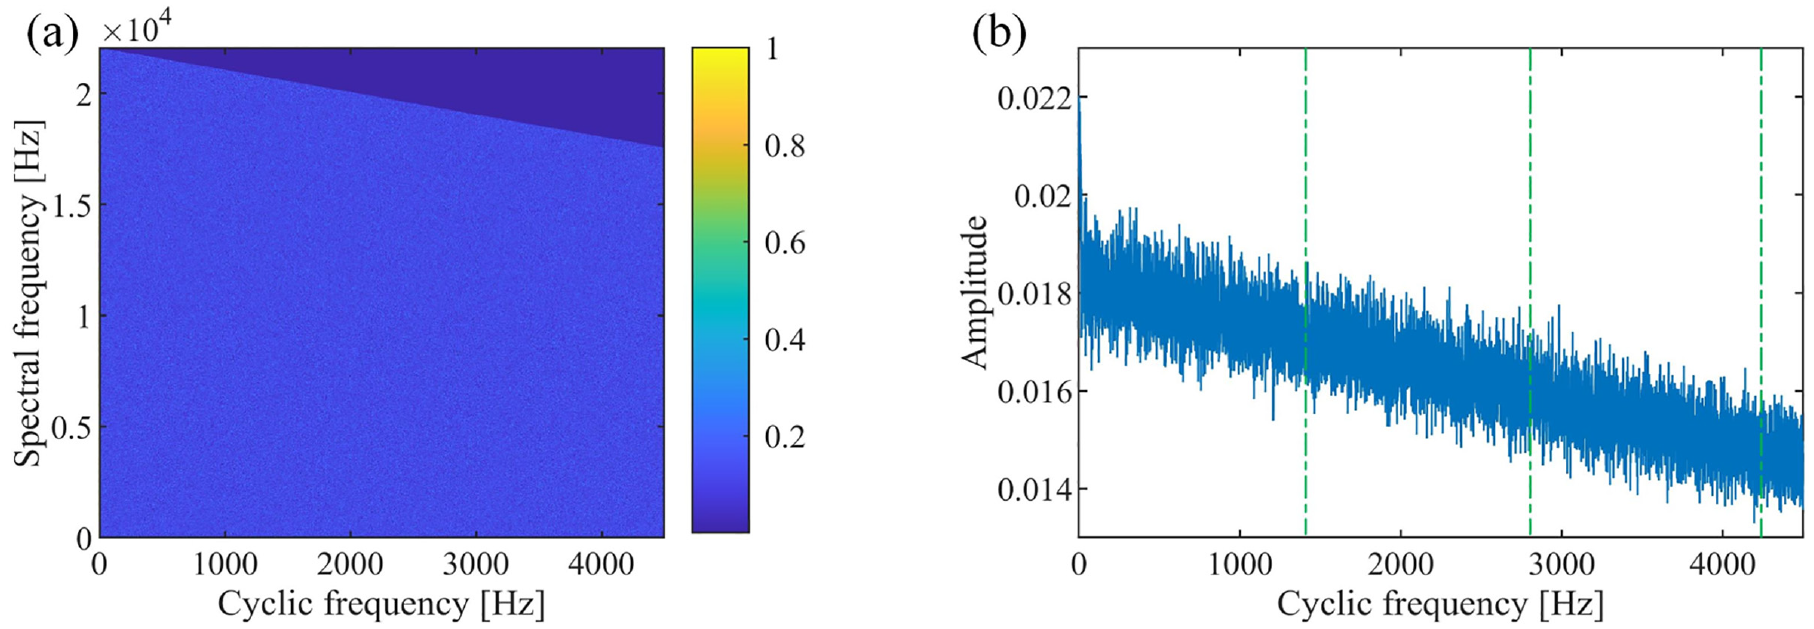
(a) SCoh and (b) EES achieved by integrating raw SCoh.
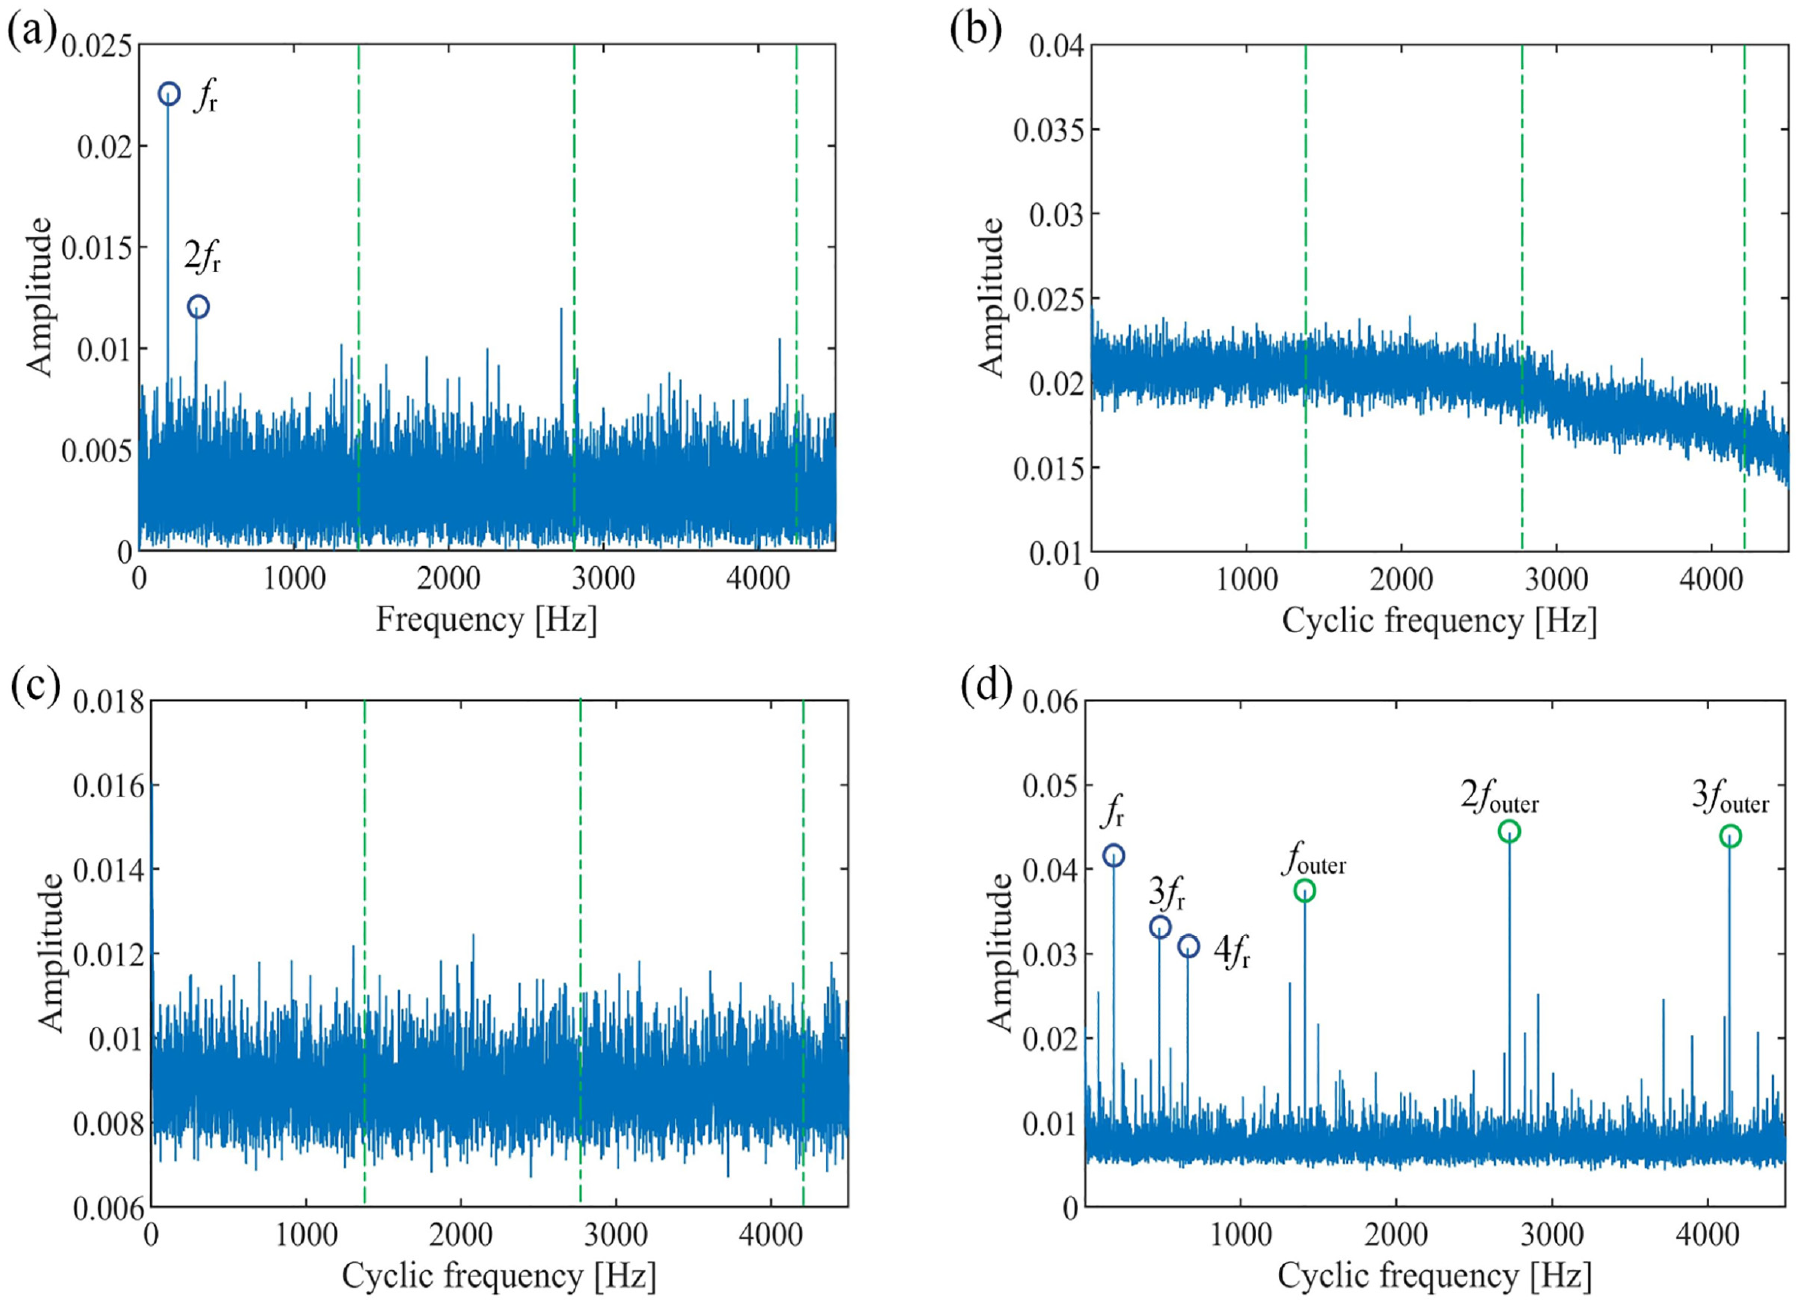
(a) HES, (b) WES, (c) WEES, and (d) the proposed BWEES.
Performance analysis
To assess the effectiveness of the proposed BWEES, HES, EES, WES, and WEES, kurtosis and GI indicators are also utilized as quantitative indicators in this section. Table 3 presents the kurtosis and GI values obtained by different methods. The comparison results indicate that the BWEES has the largest kurtosis value in the four groups of experiments, while the GI of BWEES is the largest. Based on the comparison outcomes displayed in Table 3, it is concluded that a clearer spectrum than other methods is obtained, and the fault features can be enhanced more effectively by BWEES.
Summary of kurtosis and GI values of diagnostic results on four bearing experimental datasets.
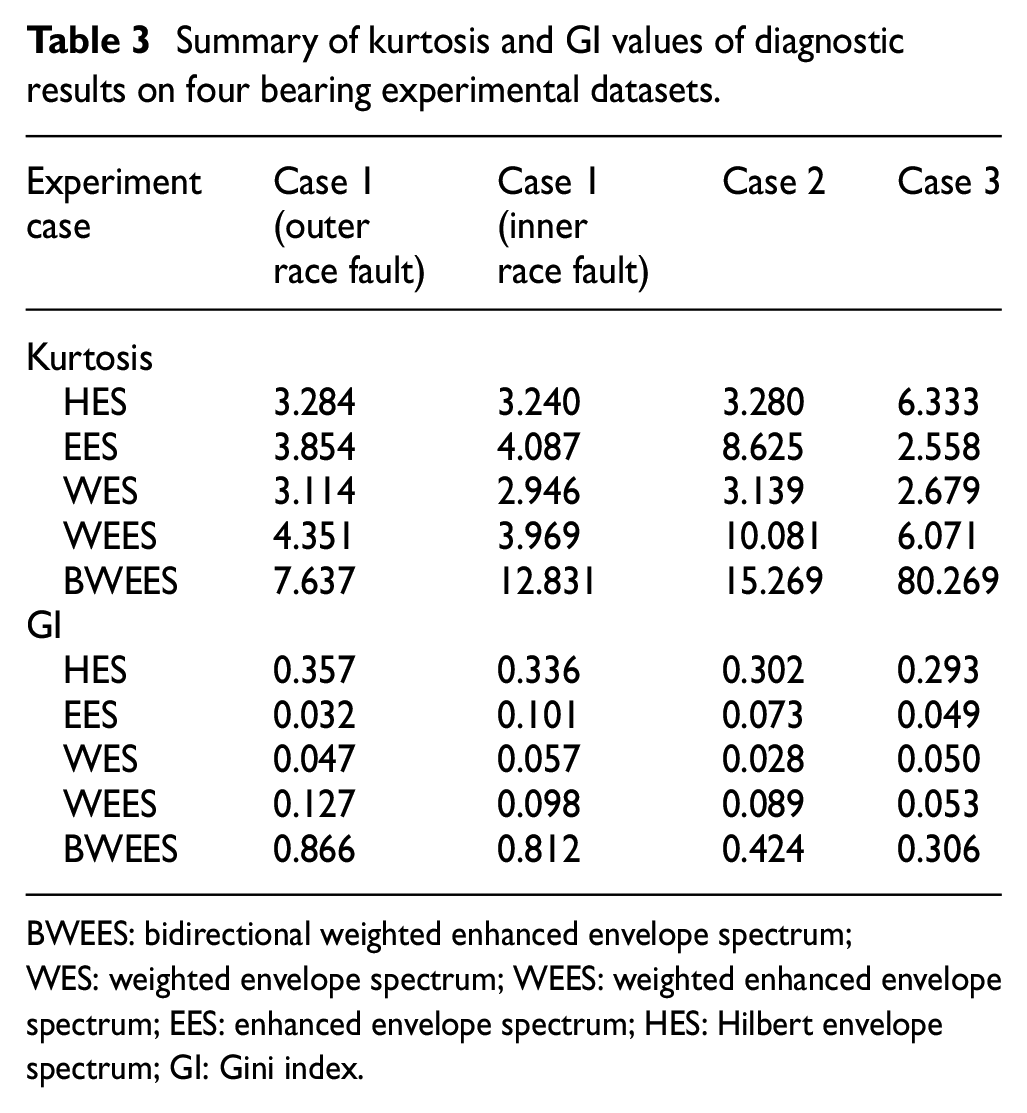
BWEES: bidirectional weighted enhanced envelope spectrum; WES: weighted envelope spectrum; WEES: weighted enhanced envelope spectrum; EES: enhanced envelope spectrum; HES: Hilbert envelope spectrum; GI: Gini index.
Conclusion
A novel SCoh-based WES analysis method is presented in this paper. The two-dimensional weighted bivariable map is constructed by taking into account both spectral frequency and cyclic frequency. In the spectral frequency direction, an improved spectral weighting method is developed to highlight the informative frequency bands, in which an autocorrelation function is exploited to reveal hidden cyclic information, and appropriate weights are assigned to the spectral frequencies based on the magnitudes of autocorrelation values. In the cyclic frequency direction, a cyclic weighting function is proposed to highlight the cyclic components directly. Through the proposed BWEES, the resonance frequency band and FCF as well as its harmonics are strengthened. The performance of BWEES is evidenced through simulation and experimental signals, and the results of BWEES and other state-of-the-art methods are compared using kurtosis and GI. Comparison analysis with HES, EES, WES, and WEES shows that the kurtosis (7.637, 12.831, 15.269, and 80.269) and GI (0.866, 0.812, 0.424, and 0.306) calculated by BWEES in four different cases are the largest, proving that BWEES can achieve the best performance.
In the future, the research will focus on the application of BWEES in bearing fault diagnosis under nonstationary conditions. In addition, the investigation of SCoh for planetary gearbox fault diagnosis will be considered as part of our future research.
Footnotes
Appendix
Declaration of conflicting interests
The author(s) declared no potential conflicts of interest with respect to the research, authorship, and/or publication of this article.
Funding
The author(s) disclosed receipt of the following financial support for the research, authorship, and/or publication of this article: This work was supported by the National Natural Science Foundation of China (grant numbers 52075008, 52305086, 52075030).