
Abstract
Rolling bearings being important components of mechanical equipment, the accurate fault diagnosis method of rolling bearings is of great importance to ensure production safety. Permutation entropy is a nonlinear measure of the irregularity of time series, which involves calculating permutation patterns, that is, defining permutations by comparing adjacent values of the time series. When using graph signal processing technology to analyze the vibration signal of rolling bearing, the natural visibility graph (NVG) can better reflect the dynamic characteristics of the vibration signal than path graph (PG). In this paper, the multiscale permutation entropy (MPE) is defined on NVG, and it is used to characterize the different fault characteristics of rolling bearings. The sand cat swarm optimization (SCSO) algorithm is employed to optimize the parameters of support vector machine (SVM); The MPEs of different faults of rolling bearing which defined on NVG are regarded as the fault feature set input into optimized SVM, and it is applied to characterize the different fault characteristics of rolling bearings, realizing fault diagnosis of rolling bearing. The proposed method is used to analyze the experimental data which contain both normal and faulty rolling bearings. The experiment results show that the proposed method can diagnose the bearing faults effectively. The MPE based on NVG is superior to MPE based on PG and MPE based on the vibration signal in distinguishing the different damage states of rolling bearings. The classification accuracy of optimized SVM based on SCSO algorithm is higher than other classical models. The effectiveness and feasibility of defining entropy on the graph signal and as the fault feature vectors for rolling bearing to realize fault diagnosis is validated. The results indicate that the proposed method can effectively detect bearing faults, and demonstrate its effectiveness and robustness for rolling bearing fault diagnosis.
Keywords
Introduction
With the advancement of modern science and technology, machines and equipment have become increasingly sophisticated, with larger, more integrated, intelligent, and complex mechanical structures. Rotating equipment such as rolling bearings and gears are considered to be the most critical components in industrial applications, and their reliability and stability are of utmost importance for the operating conditions of the machine. Any failure of these devices must be identified promptly to avoid downtime, increased production time, and catastrophic mechanical failure. Therefore, effective condition monitoring is essential for the proper operation of machinery.1–3
Compared with acoustic signals and infrared signals, vibration signals have the advantages of easy acquisition and less installation requirements. Using signal processing technology to analyze vibration signals can reflect the health state of machinery with high reliability. 4 Vibration analysis has been proved to be the mainstream method for condition monitoring of rotating machinery equipment such as rolling bearings and gears.5,6 Entropy metric as the nonlinear measures of irregularity in time series, such as hierarchical entropy, multi-scale entropy, energy entropy, cyclic correntropy and permutation entropy (PE), and its improved entropy metrics methods, can extract nonlinear fault features from vibration signals. Therefore, it is widely used in feature extraction and health indicator establishment of rolling bearing, gear and other rotating machinery equipment.7–11 In the nonlinear feature extraction methods based on entropy metrics, PE is favored for its simplicity, fast computation speed, and robustness to dynamic noise compared to other entropy methods. 12 PE only analyzes the time series on a single scale, ignoring useful information in other scales. To capture the long-term correlation in the fault vibration signal and improve the reliability of the feature vector, multi-scale permutation entropy (MPE) is introduced to feature extraction of rolling bearing fault diagnosis. 13 On the basis of MPE, researchers have proposed some improvement methods, such as generalized composite MPE, 14 composite multi-scale weighted PE, 15 to precisely extract the feature vectors for recognizing several bearing defects. The above research shows the effectiveness of entropy measurement method based on MPE in fault feature extraction of rolling bearings.
In recent years, with the development of spectrum theory, graph signal processing (GSP) has emerged. 16 The GSP extends the traditional signal processing technique to the signal indexed by the graph, that is, the graph signal, and defines the concepts of displacement, filtering, convolution, Fourier transform, spectrum decomposition and impulse response on the graph signal.17,18 Currently, there are several algorithms for mapping the time series to a natural visibility graph (NVG), horizontal visibility graph (HVG) and path graph (PG).19,20 On this basis, some GSP techniques such as graph Fourier Transform (GFT), 21 graph wavelet transform 22 and graph empirical mode decomposition 23 are also proposed. Thereafter, researchers have introduced GSP into the processing and analysis of mechanical equipment fault vibration signals, and achieved good results.24–27 Ou et al. 24 introduced GSP technology for the first time to realize rolling bearing fault diagnosis; they converted the rolling bearing fault vibration signal into PG and extracted the pulse component by using GFT. Gao et al. 25 proposed a novel fault diagnosis method based on weighted HVG and GFT; the experimental results demonstrate that the proposed fault diagnosis method for rolling bearings is effective. Also, in the field of pattern recognition, Gao et al.26,27 proposed a series of fault diagnosis methods for rolling bearings based on GSP. Firstly, they converted bearing vibration signal into HVG, and the vertex domain index is extracted as the single fault feature. Based on vertex domain index feature extraction and Mahalanobis distance clarification, the fault diagnosis of rolling bearing is realized. 26 Then, they constructed vibration datasets into a weighted K-nearest neighbor graph and used the Laplacian regularization classification method to diagnose rolling bearing faults. 27 The above research promotes the application of GSP technology in the field of rolling bearing fault diagnosis. Although research indicates that GSP technology has to achieve high precision results, and shows that it has great potential in the field of fault diagnosis, improving its application in fault diagnosis remains necessary.
As a classical classification method, support vector machine (SVM) is one of the most widely used methods in mechanical fault diagnosis. However, the parameters of penalty factor and the kernel function in SVMs play a decisive role in the final classification results, and an incorrect choice of parameters will directly affect the diagnostic accuracy and its generalization ability. 28 Therefore, it is necessary to use optimization algorithms to find the appropriate parameter values to improve the performance of the classifier. In recent years, researchers have established corresponding optimized SVMs based on swarm intelligent optimization algorithm, such as whale algorithm-support vector machine (WOA-SVM), 29 marine predators algorithm-support vector machine, (MPA-SVM), 30 and slime mould algorithm-support vector machine, (SMA-SVM). 31 The sand cat swarm optimization (SCSO) algorithm is a new meta-heuristic algorithm proposed in 2023, which avoids falling into local optima, has fewer parameters and operations, takes less time, and is easy to implement. 32 Therefore, the SCSO algorithm is suitable for parameter optimization of SVMs.
As mentioned above, combining the advantages of entropy metric and GSP technology in mechanical equipment fault diagnosis, this paper proposes the multi-scale permutation entropy based on natural visibility graph (NVG-MPE), and takes it as the fault feature vector for subsequent rolling bearing fault diagnosis. Meanwhile, to effectively realize the fault diagnosis of rolling bearings, SCSO-based support vector machine (SCSO-SVM) is proposed for automatic classification of different failure modes. Then a new fault diagnosis method for rolling bearing is proposed based on the NVG-MPE and SCSO-SVM. The experimental results verified the effectiveness of the proposed method in rolling bearing fault diagnosis.
The paper is organized as follow: First, the basic principles of NVG-MPE are introduced. Then, the SCSO-SVM is presented. Then, the process and main steps of rolling bearing fault diagnosis based on the proposed method are introduced. We verify the validity and reliability of the proposed method by experiment. Finally, there is the conclusion
The MPE of NVG
Natural visibility graph
Giving a time series
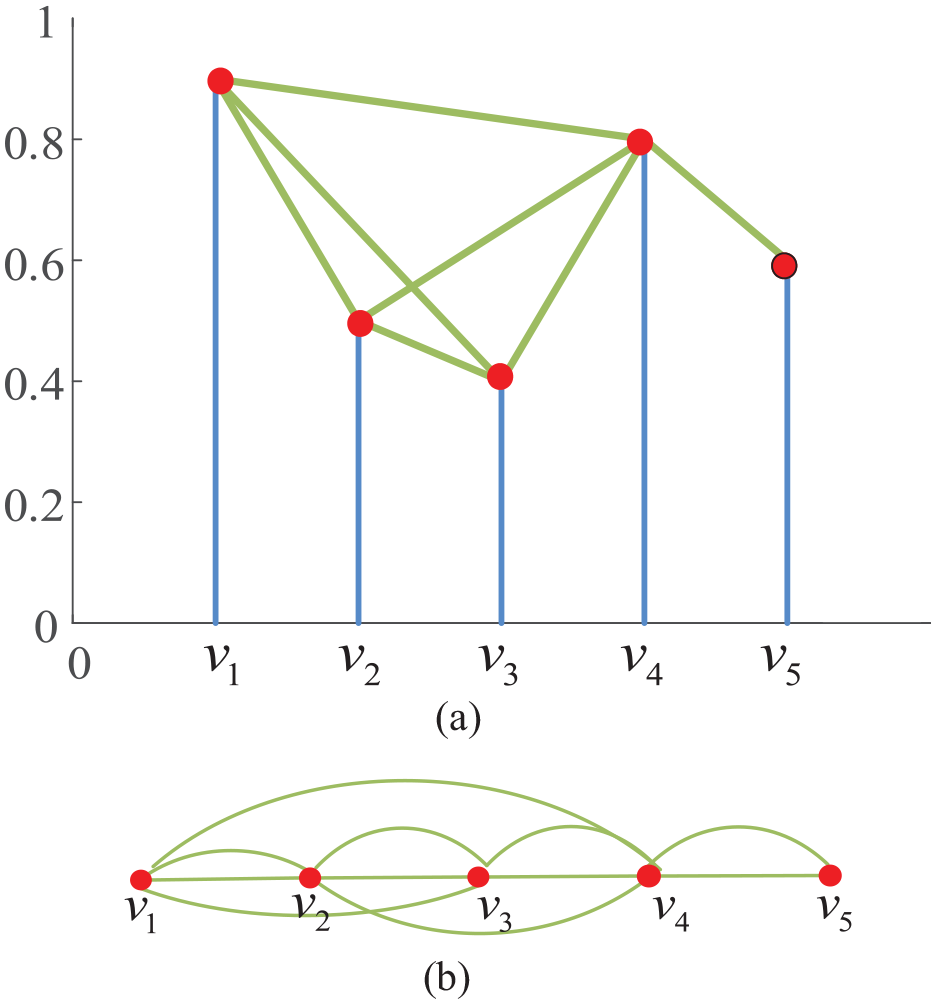
NVG and its representation (a) data height values (b) NVG.
Any two points in a discrete time series
A weighted visibility graph

Through the construction algorithm of NVG, a time series can be converted into a graph signal indexed by its NVG, the graph signal can be regard as a mapping from the set of vertices
The power
Given a graph
Given a vertex
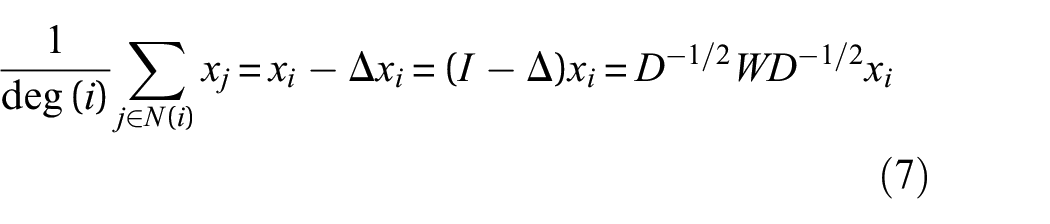
Among them:
The Laplacian matrix is defined as:

The normalized Laplacian matrix is defined using the adjacency matrix as:

where
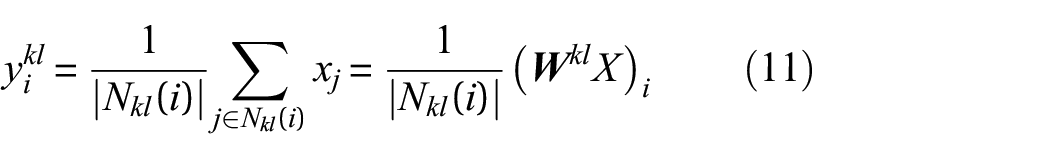
MPE for NVG signals
Based on the concept of adjacent vertices on a graph, the permutation entropy of a graph signal is proposed. 33 For the original time series, the embedding vector m = 2 for PE is constructed among the values on consecutive steps (t and t + l), and l is the delay time. 34
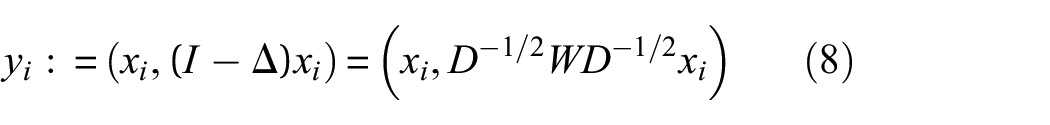
Given a graph signal
For each vertex
Supposing that
When embedding dimension
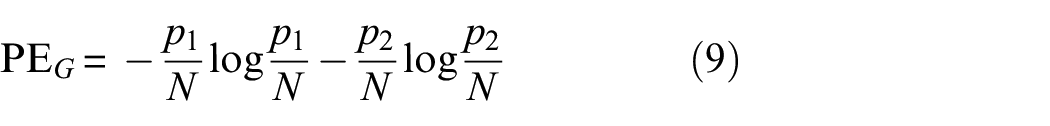
The vertices of the graph G are divided into two subsets according to the signal
The
for all the expressions of
where the
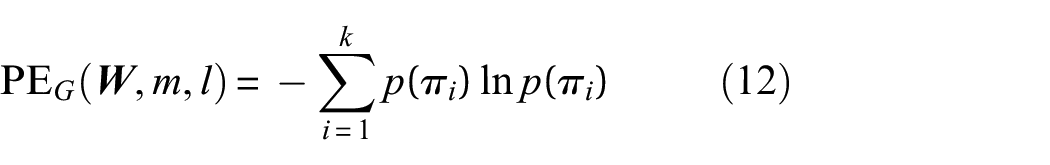
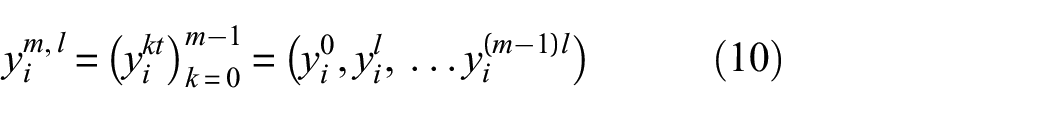
The MPE for graph signals
Consider a time series
where
The value of
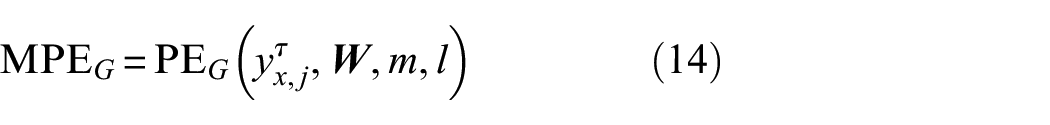
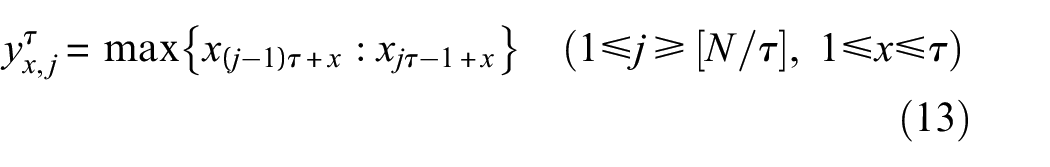
For the a time series
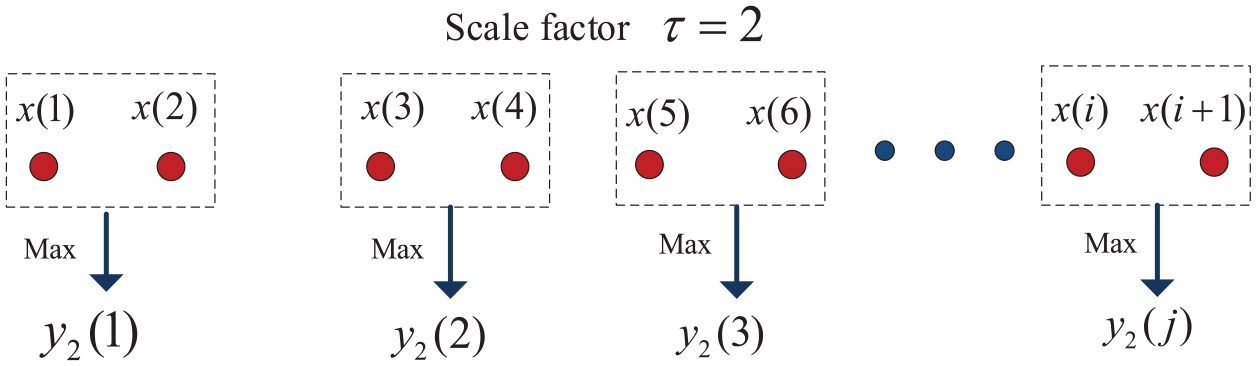
Maximum value coarse-granulation process.
The specific steps of the NVG-MPE algorithm are as follows:
(1) Setting the scale factor
(2) Constructing the NVG signals for
(3) Calculating the value of
SVM classification based on SCSO
SCSO algorithm
SCSO as a new meta-heuristic algorithm, the idea of the algorithm originated from the fact that sand cats can detect low frequencies below 2 KHz and have an incredible ability to dig for prey. Inspired by these two features, the algorithm consists of two main phases (search and attack). The algorithm controls the transition between exploration and exploitation stages in a balanced way, and obtains a better solution with fewer parameters and operations.
Letting the number of sand cat population be N, and the position of each sand cat is a feasible solution
At search phase, in i + 1 generation, the k-th sand cat position update strategy is as follows:
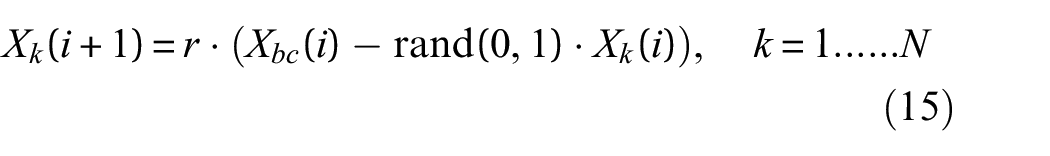
Among them,
At the predation stage, the distance between the optimal position
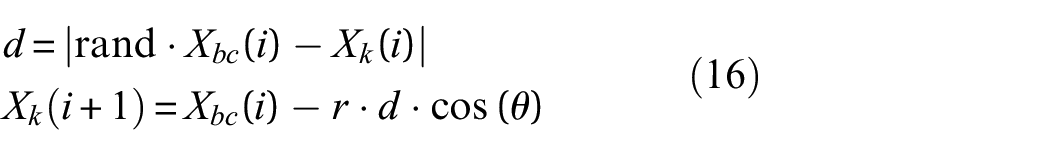
where d is the random distance and
The main parameter that controls the transition between the search phase and the predation phase is R, which allows the SCSO to seamlessly switch between the two phases. When
Support vector machine
Suppose the training sample set

Solving the optimal classification hyperplane is to find the optimal value of w and b, so it can be summarized as the following quadratic programming problem:
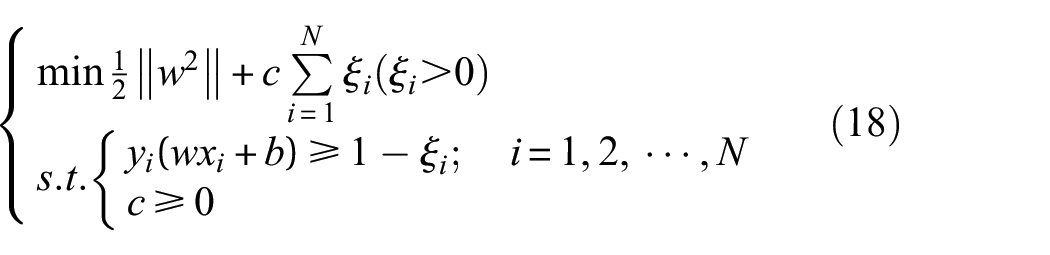
where
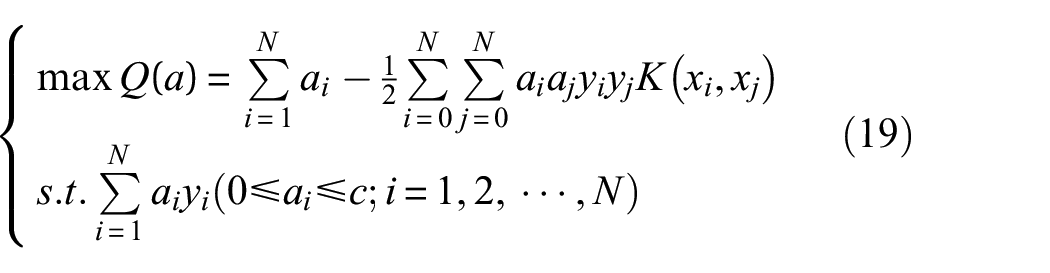
where
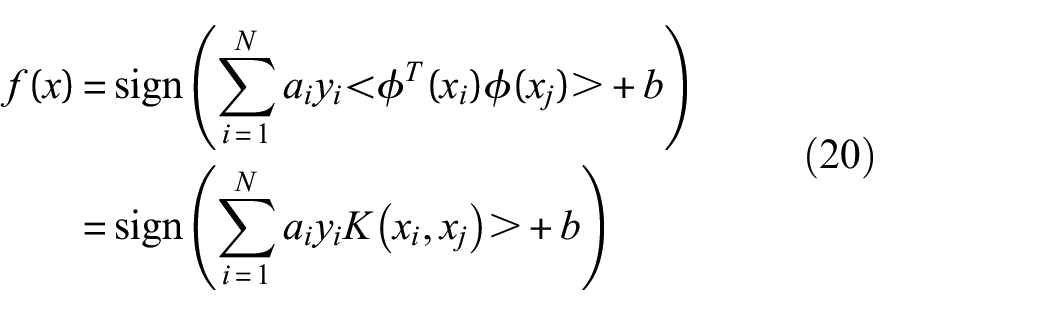
In this paper, RBF radial basis function is selected as the kernel function of SVM, and its expression is as follows:
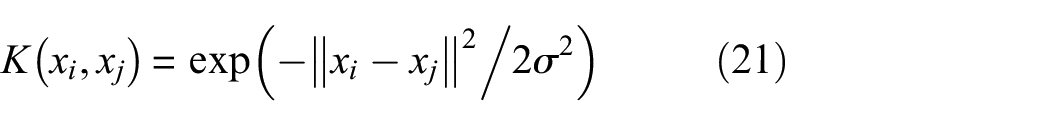
where
The penalty parameter c and kernel parameter
Sand cat swarm optimization-support vector machine
In view of the advantages of SCSO and SVM, this paper proposes a new SCSO-SVM classifier, the flow chart of SCSO-SVM is shown in the Figure 3, and the steps are described as follows:
(1) Initializing parameters. The data set is divided into training set and test set. Initializing the parameters of SCSO. The number of populations is set to 20 and the maximum number of iterations is set to 50. Since the two parameters c and
(2) Calculating the fitness value of each sand cat. To evaluate the quality of each sand cat, the average error recognition rate of the training sample is defined as a fitness function. Therefore, the parameter optimization problem of SVM is expressed as the minimization problem of fitness function.
(3) Updating the position of each sand cat. The sand cat with the best fitness value in the current iteration is selected and treat its location as the optimal position
(4) Determining the iteration stop condition. If the maximum number of iterations is reached, the loop is terminated and the best target position (
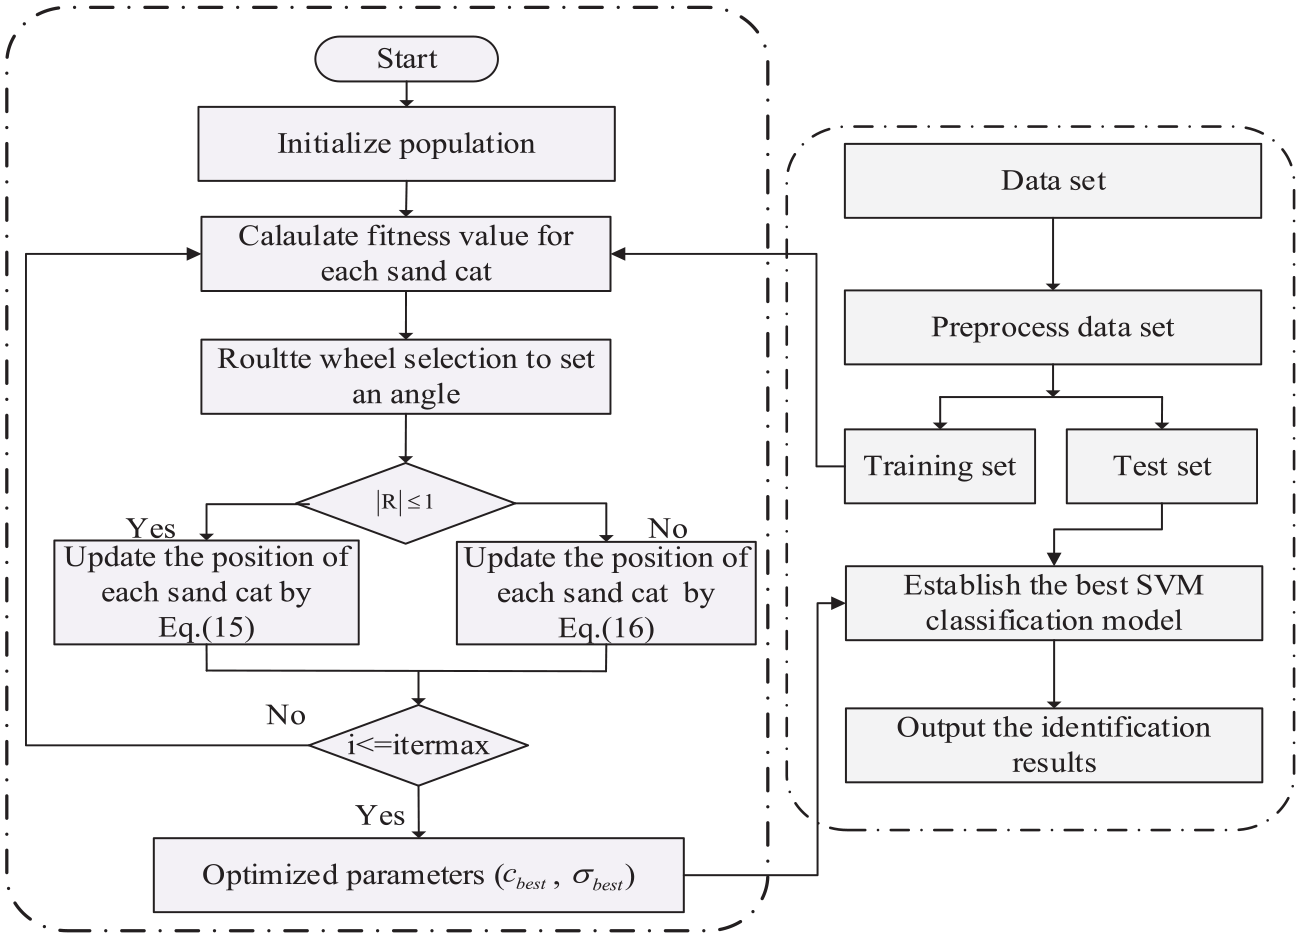
The flowchart of SCSO-SVM.
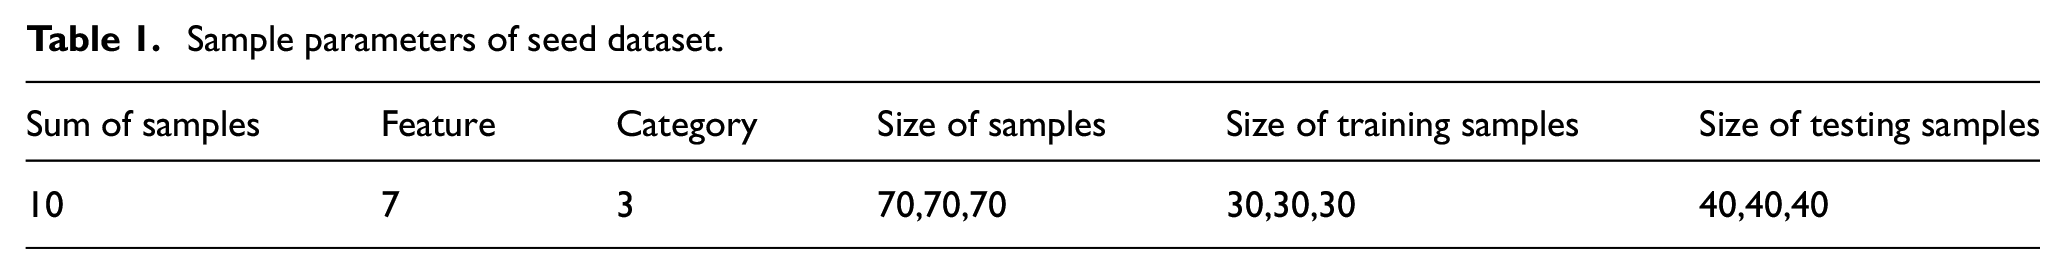
To verify the performance of SCSO-SVM, in the UCI database, 35 is used in this experiment. The SCSO-SVM is compared with the existing WOA-SVM, MPA-SVM and SMA-SVM. The detailed parameters of the UCI database are shown in Table 1. The population and Max_iter of the four optimization algorithms are set to 20 and 50 respectively, and the remaining parameters are set as shown in the Table 2.
Sample parameters of seed dataset.
Optimize algorithm parameter settings.
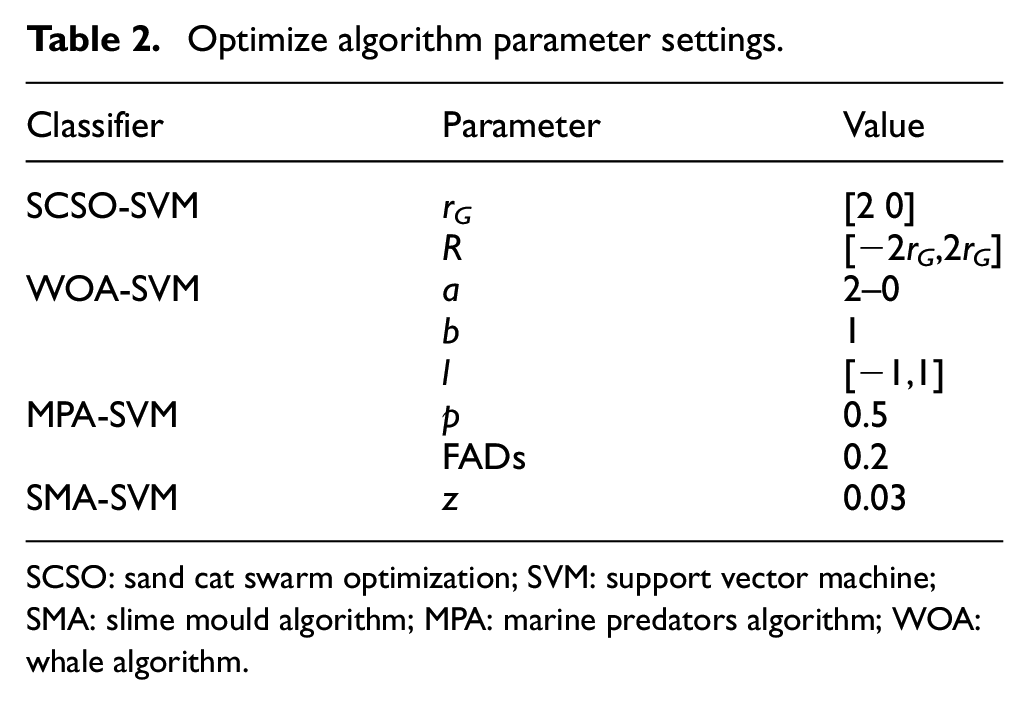
SCSO: sand cat swarm optimization; SVM: support vector machine; SMA: slime mould algorithm; MPA: marine predators algorithm; WOA: whale algorithm.
Figure 4 show the average fitness value curves of four optimization-based SVM classifiers, it can be observed that the final average fitness value of SCSO-SVM is lower than he final average fitness values of WOA-SVM, MPA-SVM, and SMA-SVM, obviously. At the 16th iteration, the fitness value of SCSO-SVM dropped to the minimum value and the convergence speed is the fastest. These results demonstrate the effectiveness and superiority of SCSO-SVM over other optimized SVM.
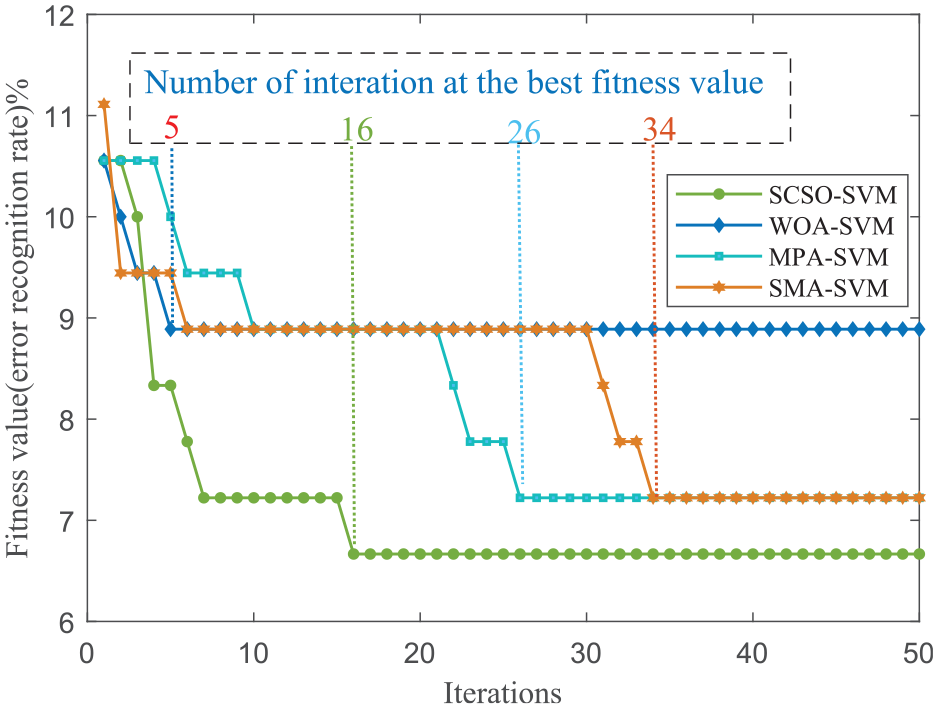
The average fitness value curves of four optimization-based SVM classifiers.
SCSO algorithm has fewer number of parameters and operators, making it easier to implement than other meta-heuristic algorithms. This is due to the adaptive strategy employed by the SCSO algorithm, which enables it to find the optimal solution with fewer parameters and operations, while avoiding local optimal traps. These characteristics make the SCSO algorithm is a promising approach for solving optimization problems in various fields.
Fault diagnosis process
Based on the advantages of NVG,
(1) Signal acquisition: the vibration signal of rolling bearing under different working conditions is collected by the acceleration sensor.
(2) Feature extraction: the vibration signal of rolling bearing is converted into NVG signal by the graph construction algorithm, the
(3) Pattern recognition: the fault feature set is randomly divided into a training set and a test set. The training samples are input into the SCSO-SVM classifier to build the best SVM classification model. The test samples are input into the SVM classification model for the type identification.
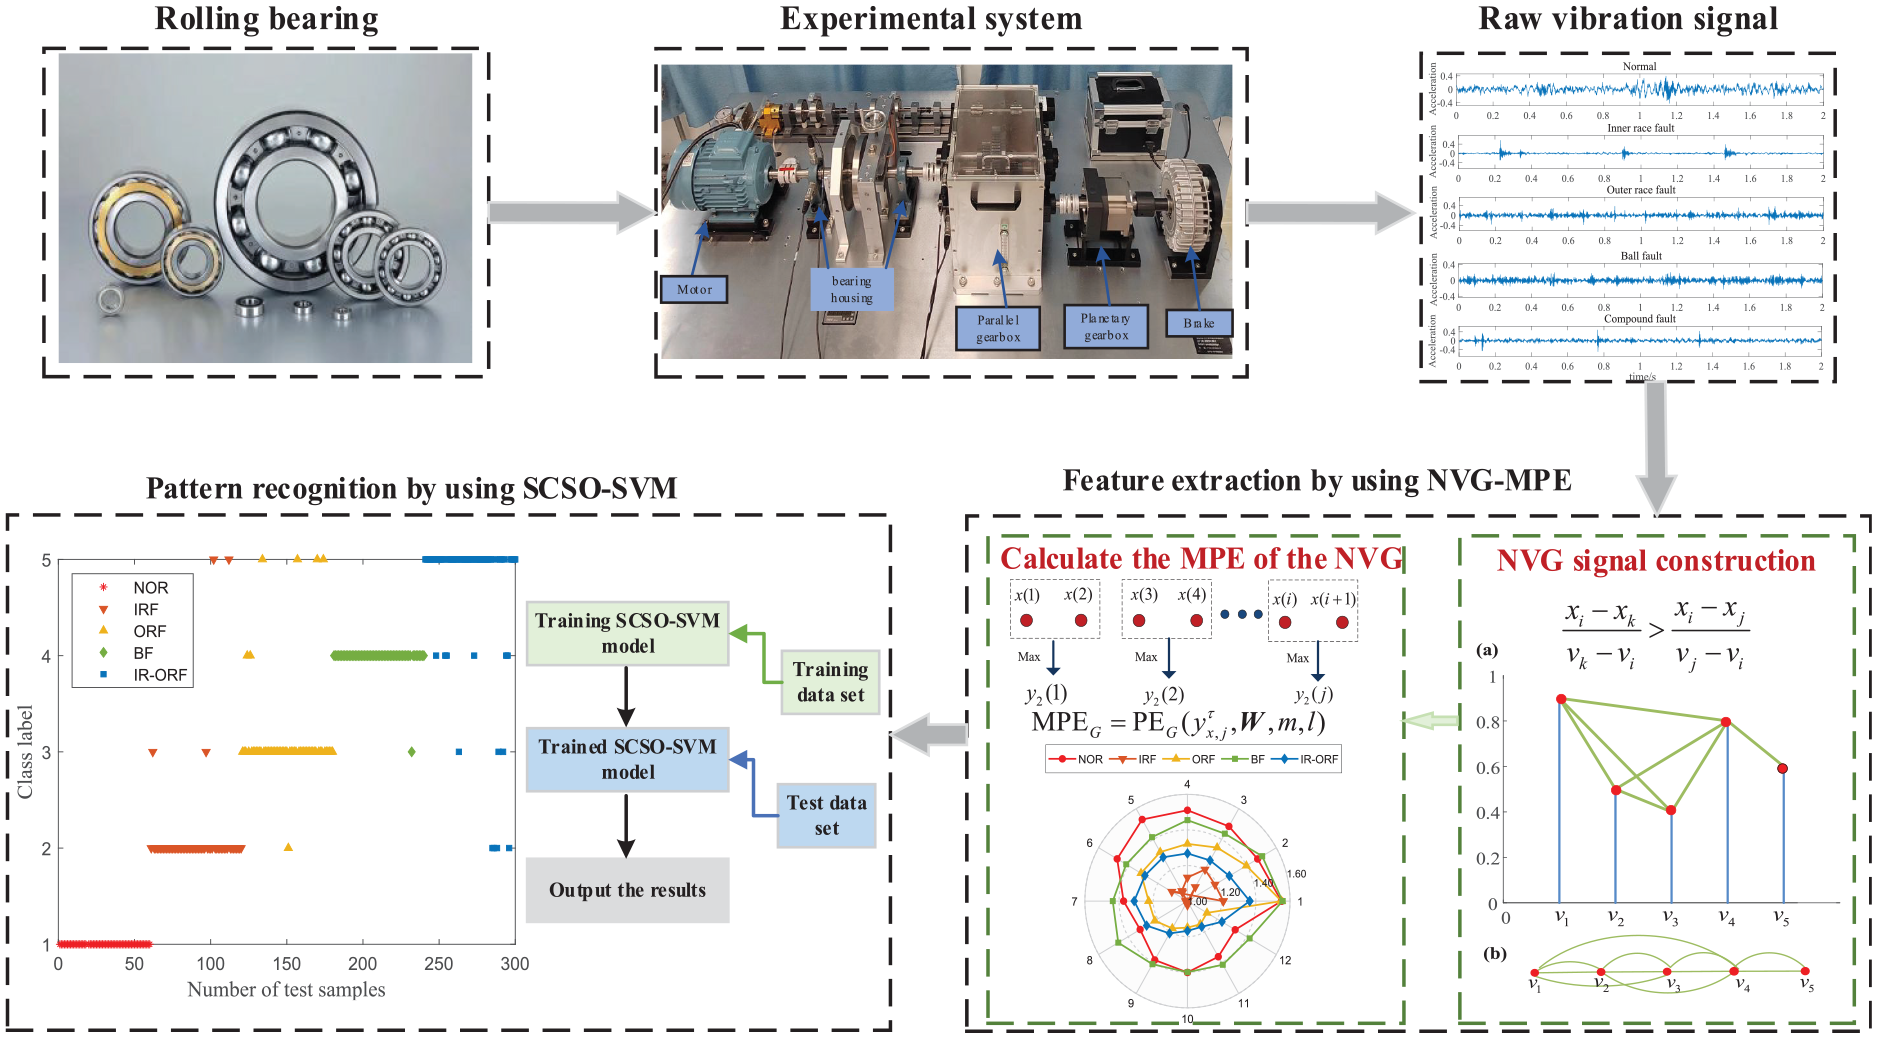
Flow chart of rolling bearing fault diagnosis.
Experimental analysis
Experiment 1
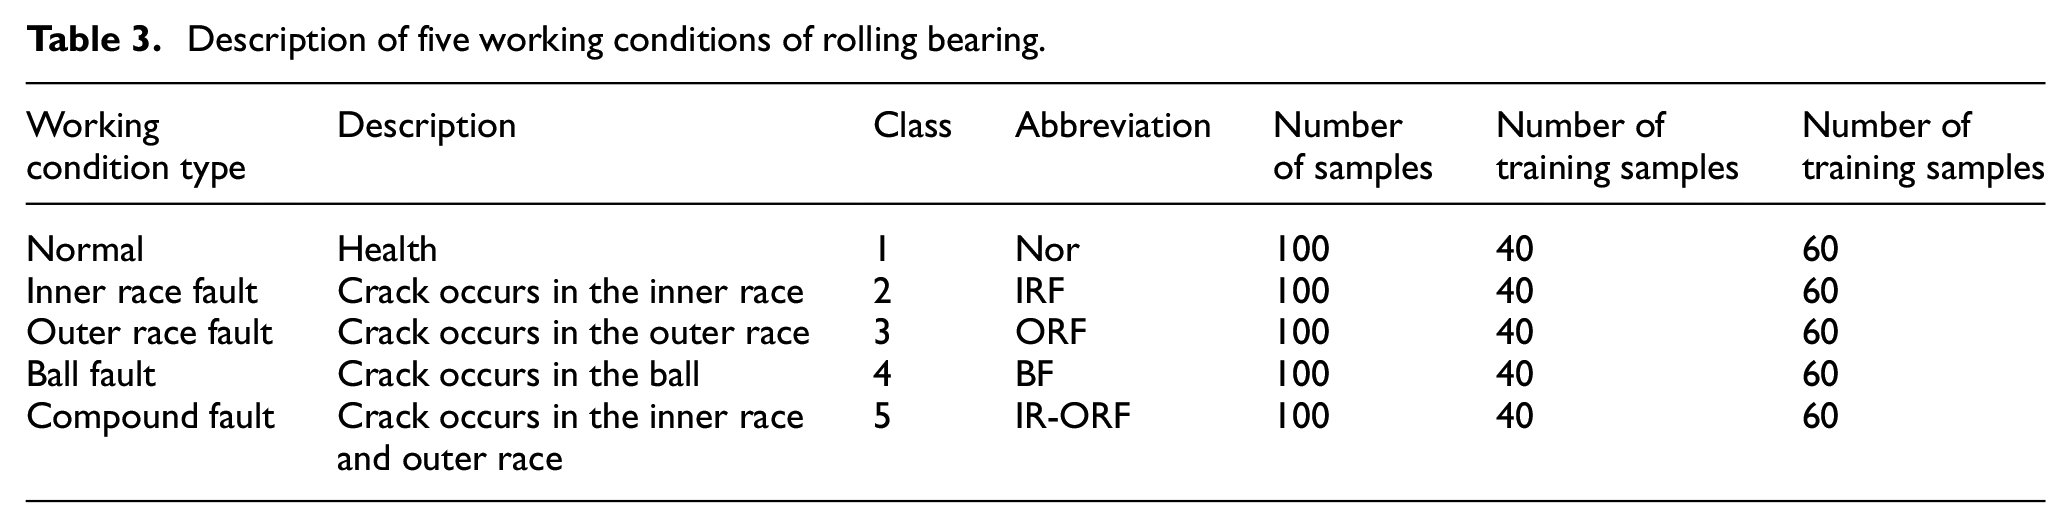
To demonstrate the versatility and superiority of the proposed method, the proposed method is applied to the fault diagnosis of rolling bearing. An experimental platform is applied to collect the vibration signal of rolling bearing, which is shown in Figure 6. The test stand is composed of motor, bearing house, gearbox, etc. The datasets are derived from fault injection tests of UCPH206 rolling bearings at a sampling frequency of 10 KHz. Therefore, the data set under five working conditions of rolling bearings are collected, including four fault conditions and a normal operation condition, as described in Table 3. In addition, the time domain waveform of five working conditions of rolling bearing are given in Figure 7.
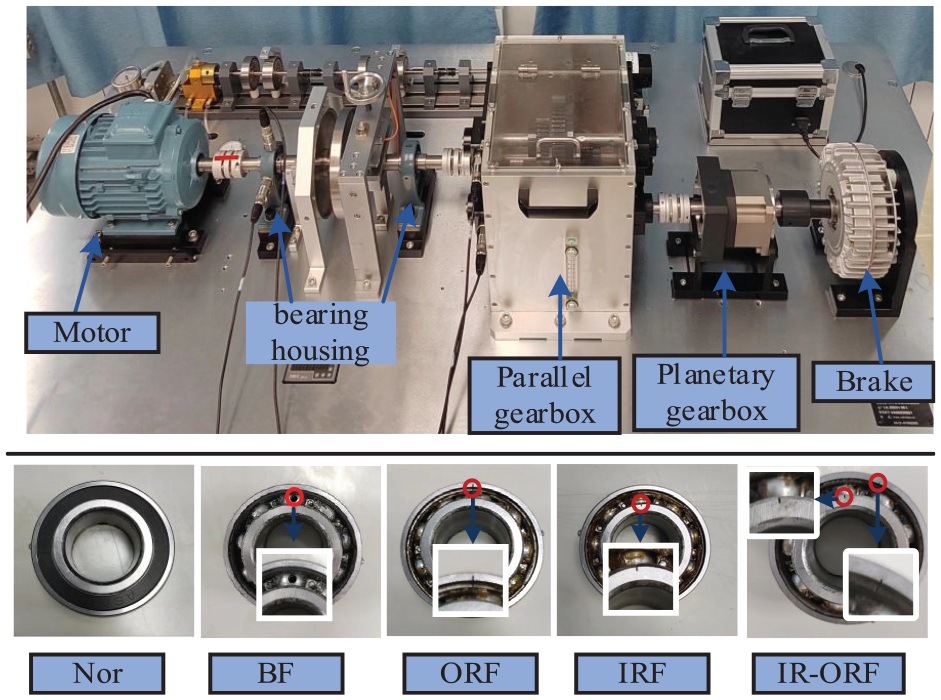
The experimental platform.
Description of five working conditions of rolling bearing.
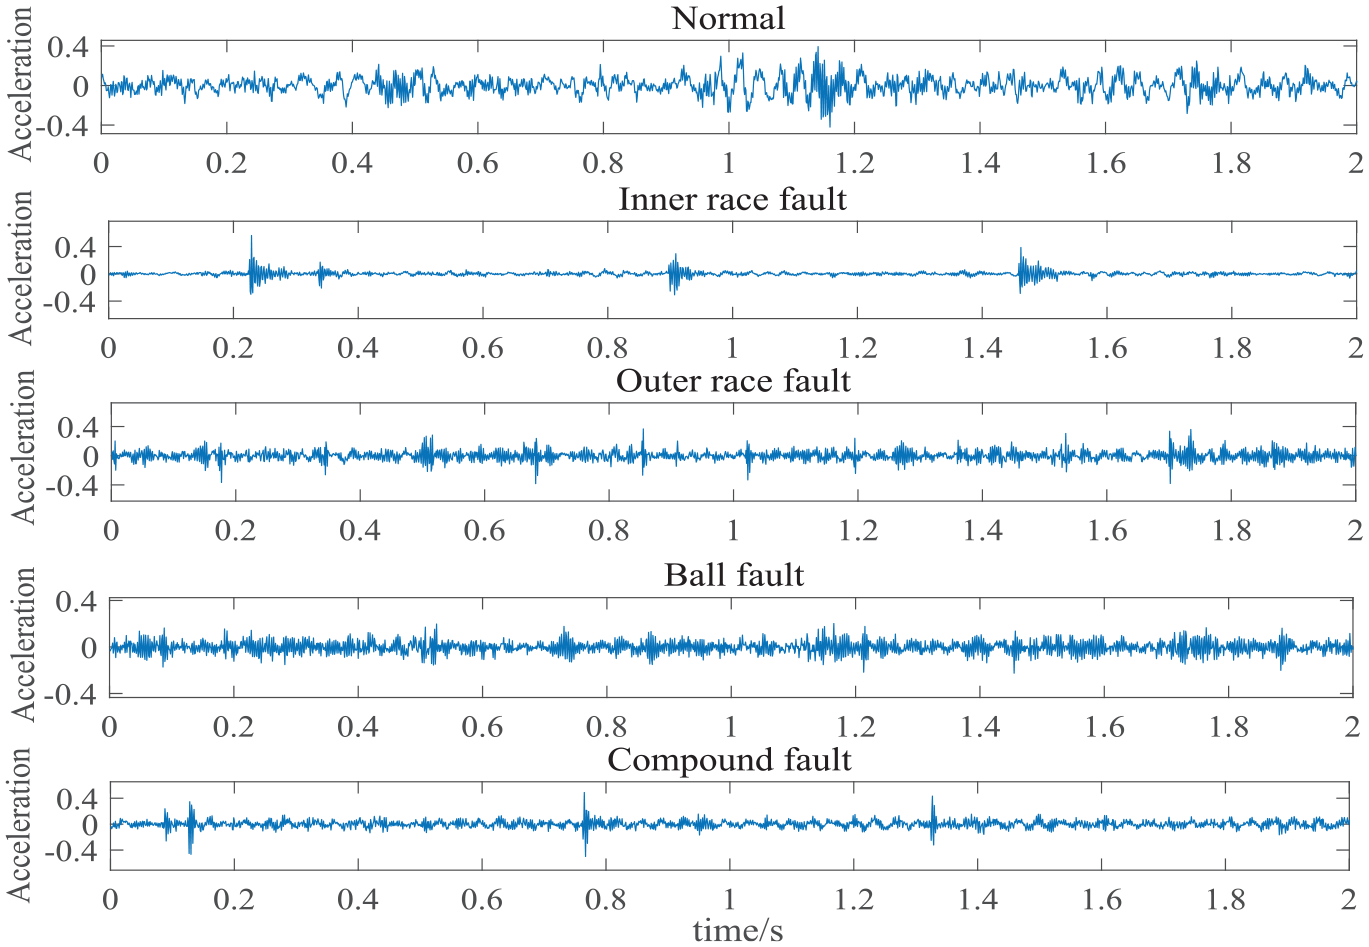
Time domain curves of different bearing operating conditions.
For vibration signals in each state, 100 samples are collected, with 1024 data points for each sample. The samples in each state are divided into 40 training sample sets and 60 test sample sets. The data sets used are described in Table 3. The proposed method is used to analyze the above data. When the fault feature set is constructed, the embedding vector
The vibration signals of rolling bearing in Figure 7 are converted into NVG signal. The
To verify the validity of the sample information represented by
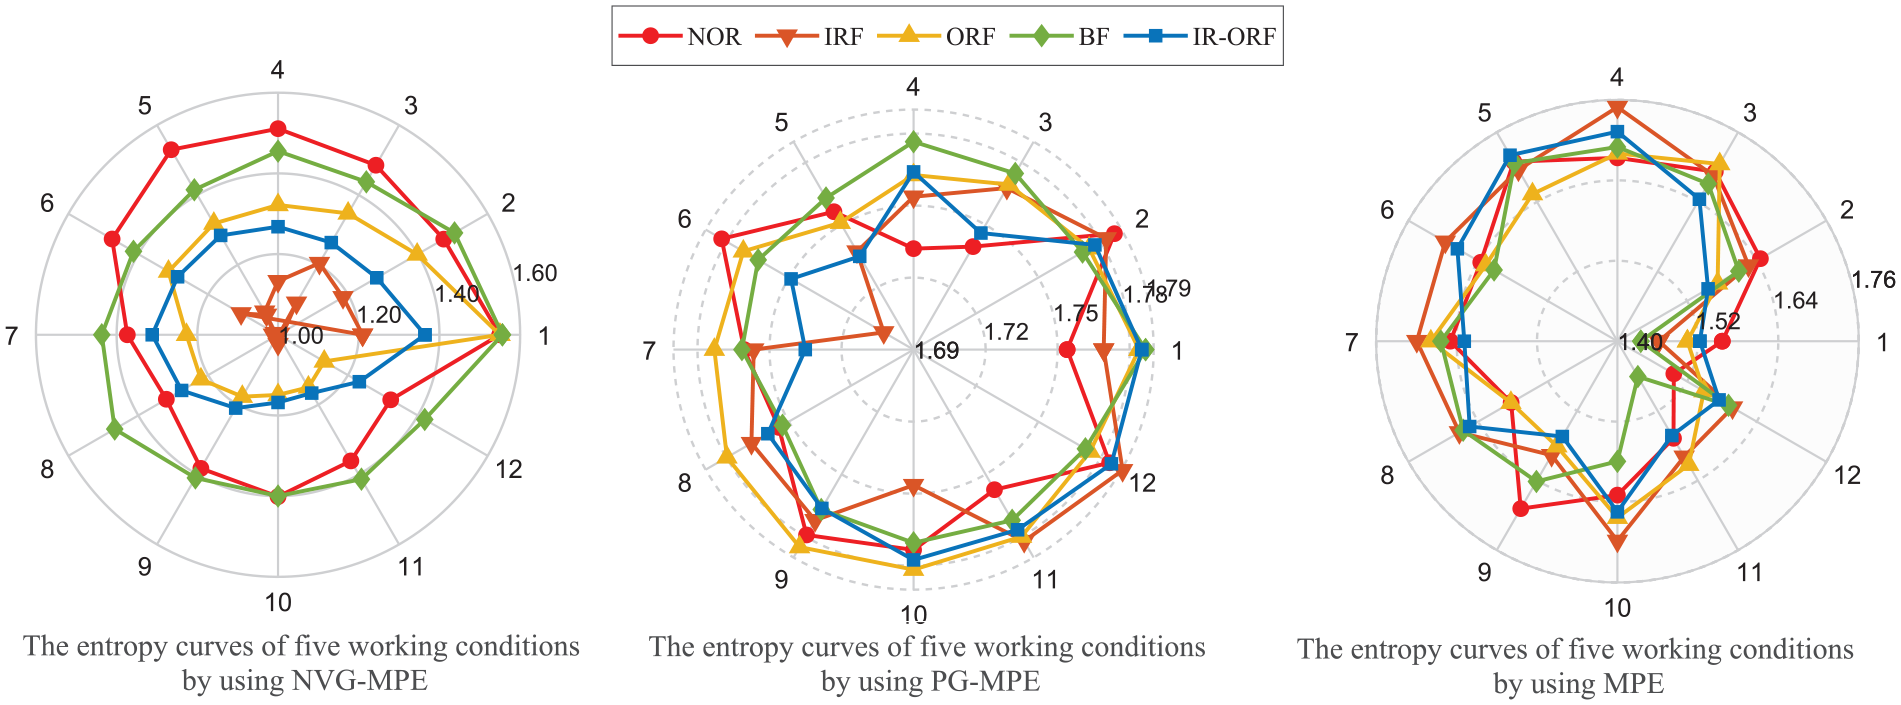
The entropy curves of five working conditions by using NVG-MPE, PG-MPE and MPE.
The standard deviation and mean entropy values of the NVG-MPE, PG-MPE and MPE for 100 groups with different states are shown in Figure 9. It is noted that, for each working condition, the standard deviation values of NVG-MPE are lower than PG-MPE and MPE at each of the scales. The mean entropy curves extracted using these three methods are different, and the mean entropy curves of NVG-MPE are smoother. These phenomena show that the graph signal is more effective than the vibration signal in representing the dynamics of mechanical vibration signals, the MPE defined on graph signal can improve the stability of the entropy calculation.
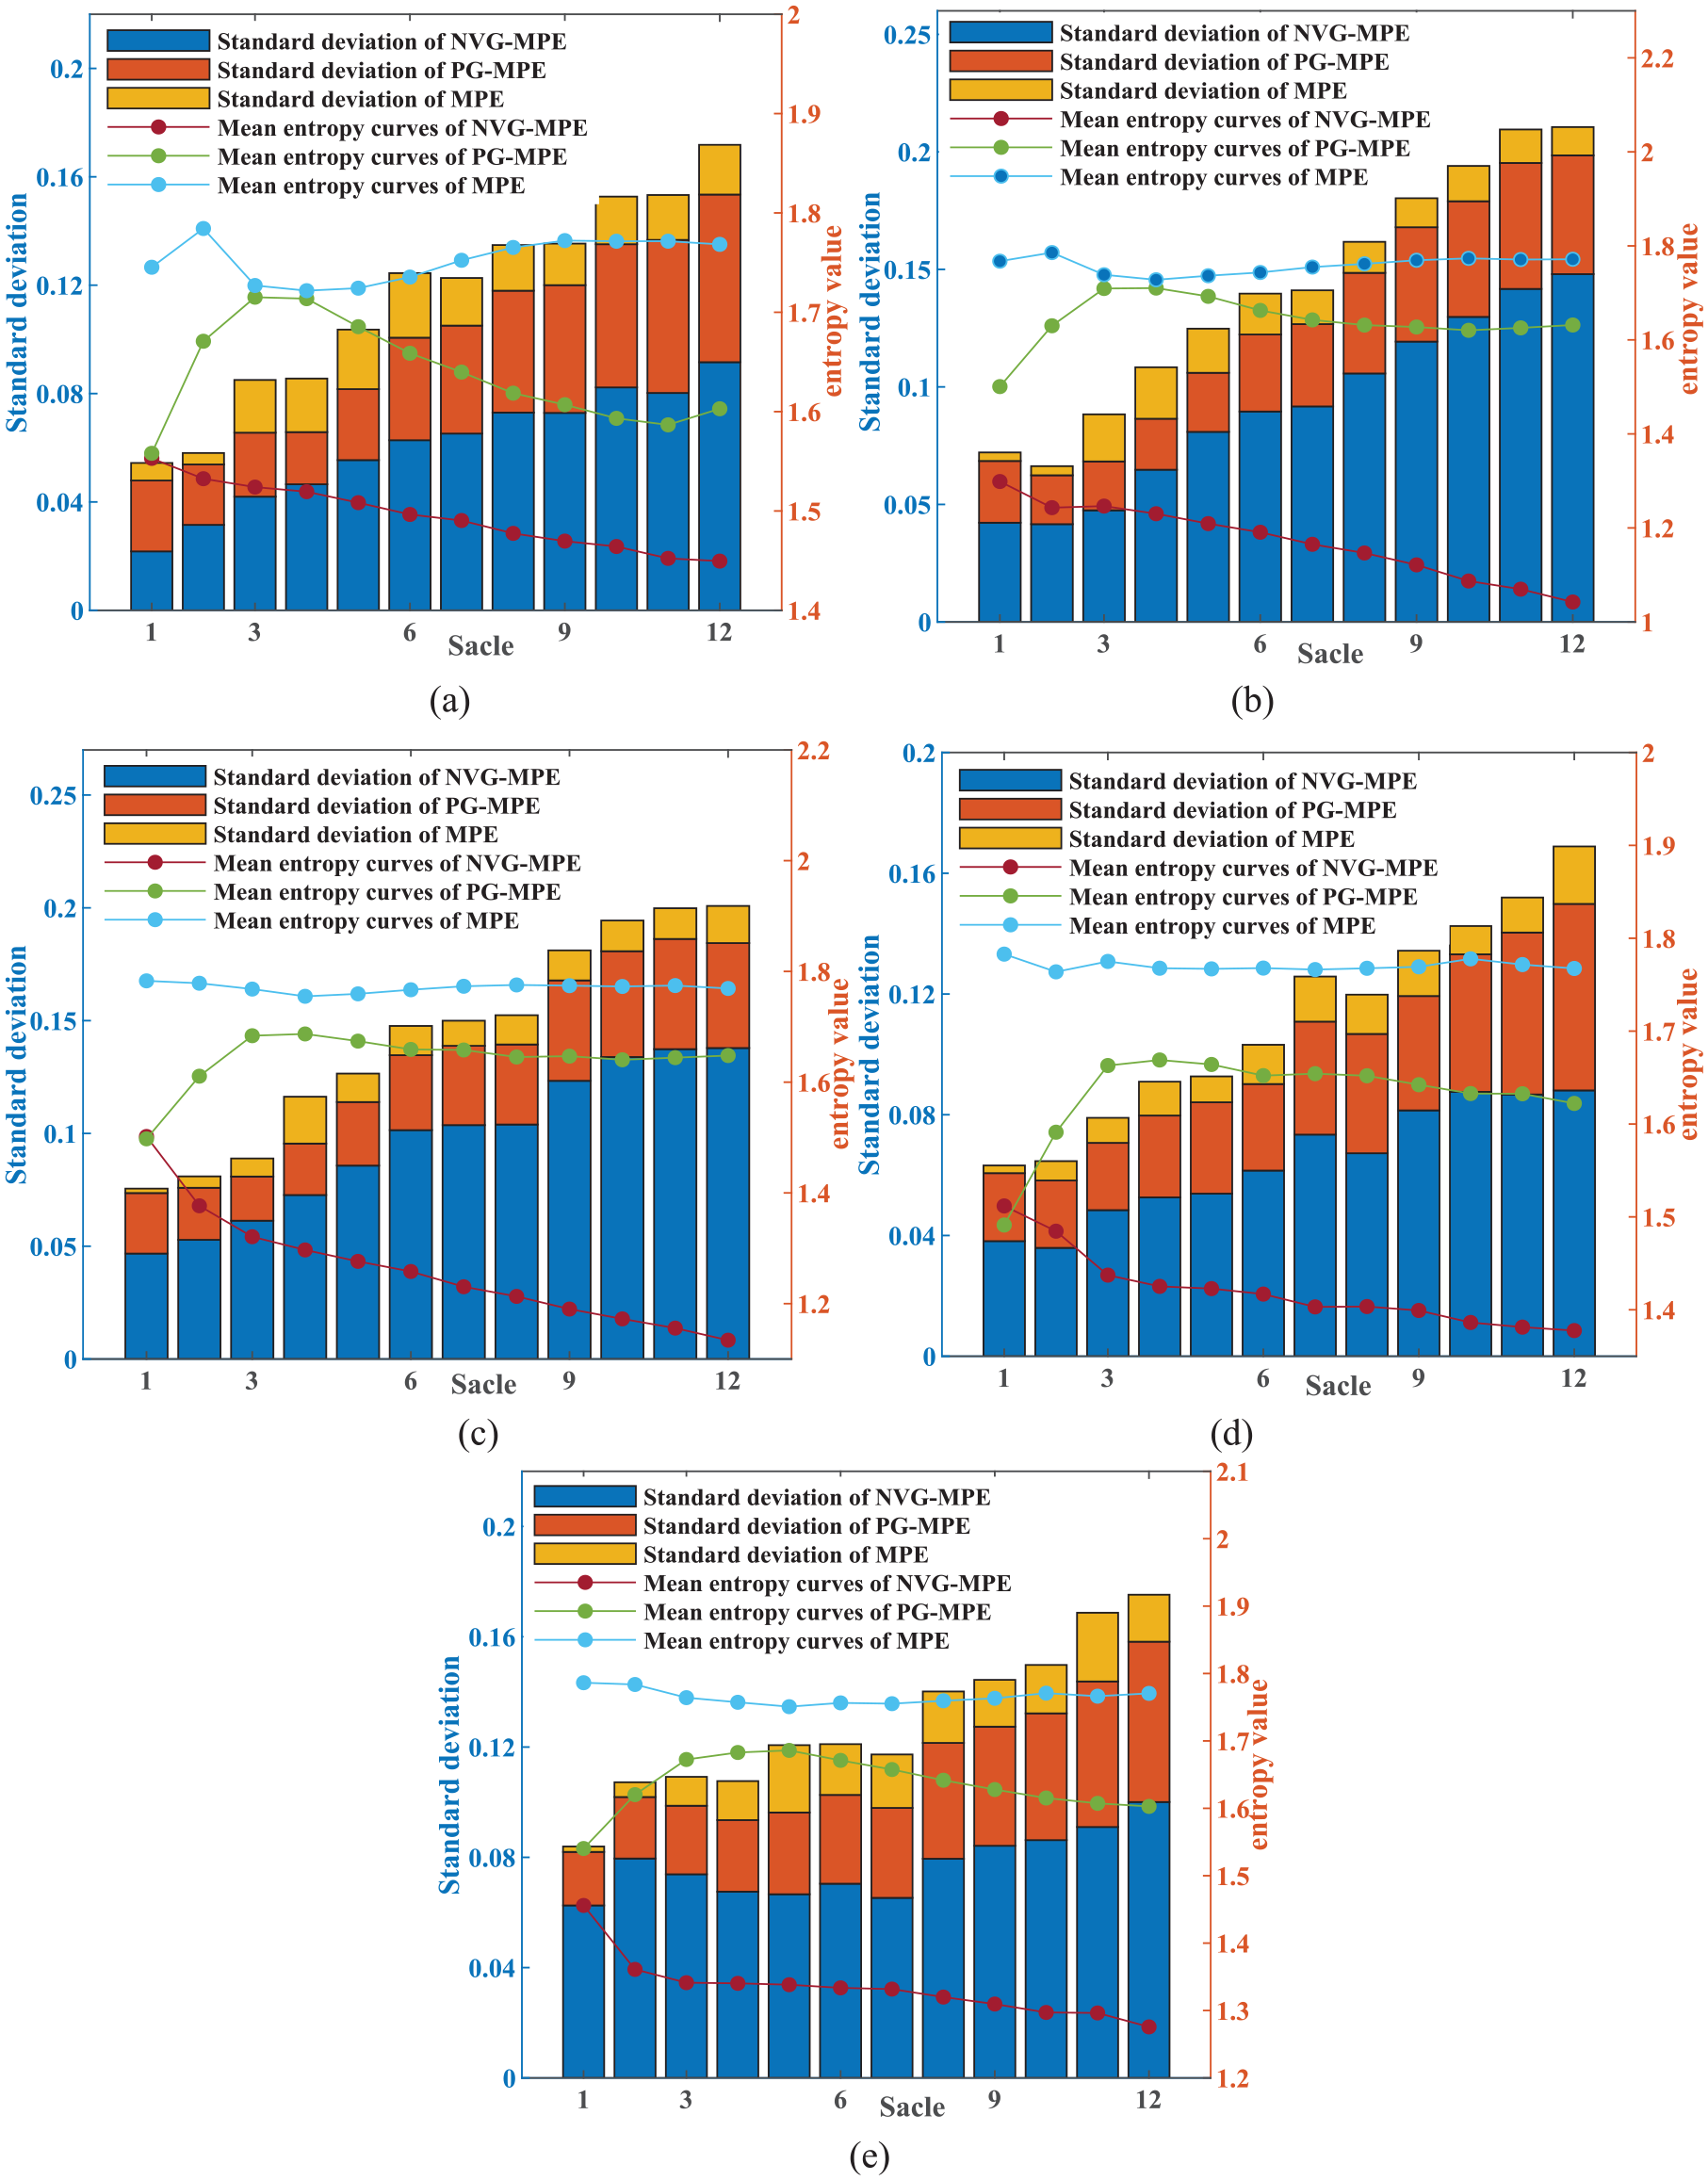
NVG-MPE, PG-MPE and MPE analysis results: (a) NOR, (b) IRF, (c) ORF, (d) BF, and (e) IR-ORF.
Figure 10 shows the feature visualization of three feature method. In Figure 10(a), it can be seen that the samples belonging to the same health condition are more clustered, and the samples in different conditions are separated, a few IR samples are close to BF samples. On the contrary, the samples in Figures 10(b) and (c) under different working conditions have certain overlap, indicating the better cluster ability of NVG-MPE compared with PG-MPE and PE. NVG-MPE achieves the best feature separability among the three entropy methods, NVG-MPE using NVG signal can better reflect the dynamic characteristics of the vibration signal than PG signal and vibration signal to improve the statistical reliability for PE of time series.
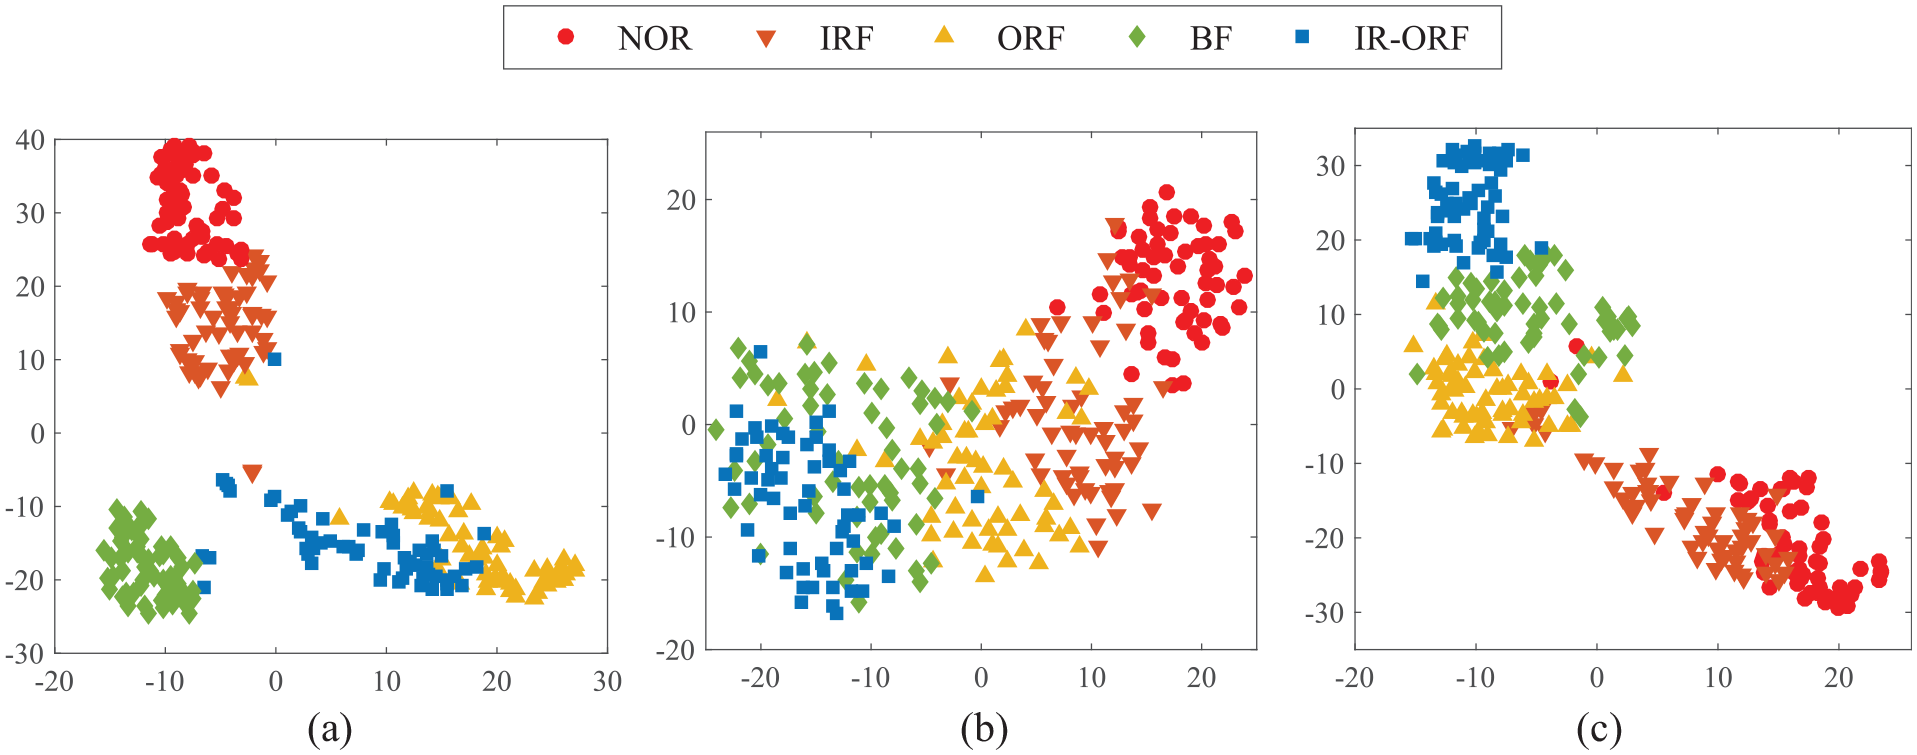
Feature visualization of experimental signals of T-SNE: (a) NVG-MPE, (b) PG-MPE, and (c) MPE. T-SNE, t-distributedstochastic neighbor embedding.
NVG-MPE: multi-scale permutation entropy based on natural visibility graph; PG: path graph; MPE: multiscale permutation entropy.Next, the feature set based on NVG-MPE, PG-MPE and MPE are input into SCSO-SVM to realize fault classification, respectively. The parameters of SCSO-SVM classifier are given in Table 2. To verify the robustness of the algorithm, 10 experiments are conducted. Figure 11 shows the output of test samples using three feature extraction methods and SCSO-SVM in one of the experiments. As can be observed in Figure 11(a), a few samples of IR-ORF and ORF are misassigned to other type, consistent with the results of feature visualization analysis in Figure 10(a). However, it can be seen from Figure 11(b) and (c) that there are many faults that are misidentified. Moreover, it can be noted that the average diagnostic accuracy by using feature sets of NVG-MPE is 91.23%, while the average classification accuracy of PG-MPE, MPE are 81.33% and 75.3%, respectively. The results demonstrate that the value of NVG-MPE is superior to PG-MPE and MPE in characterizing the characteristics of rolling bearing vibration signals.
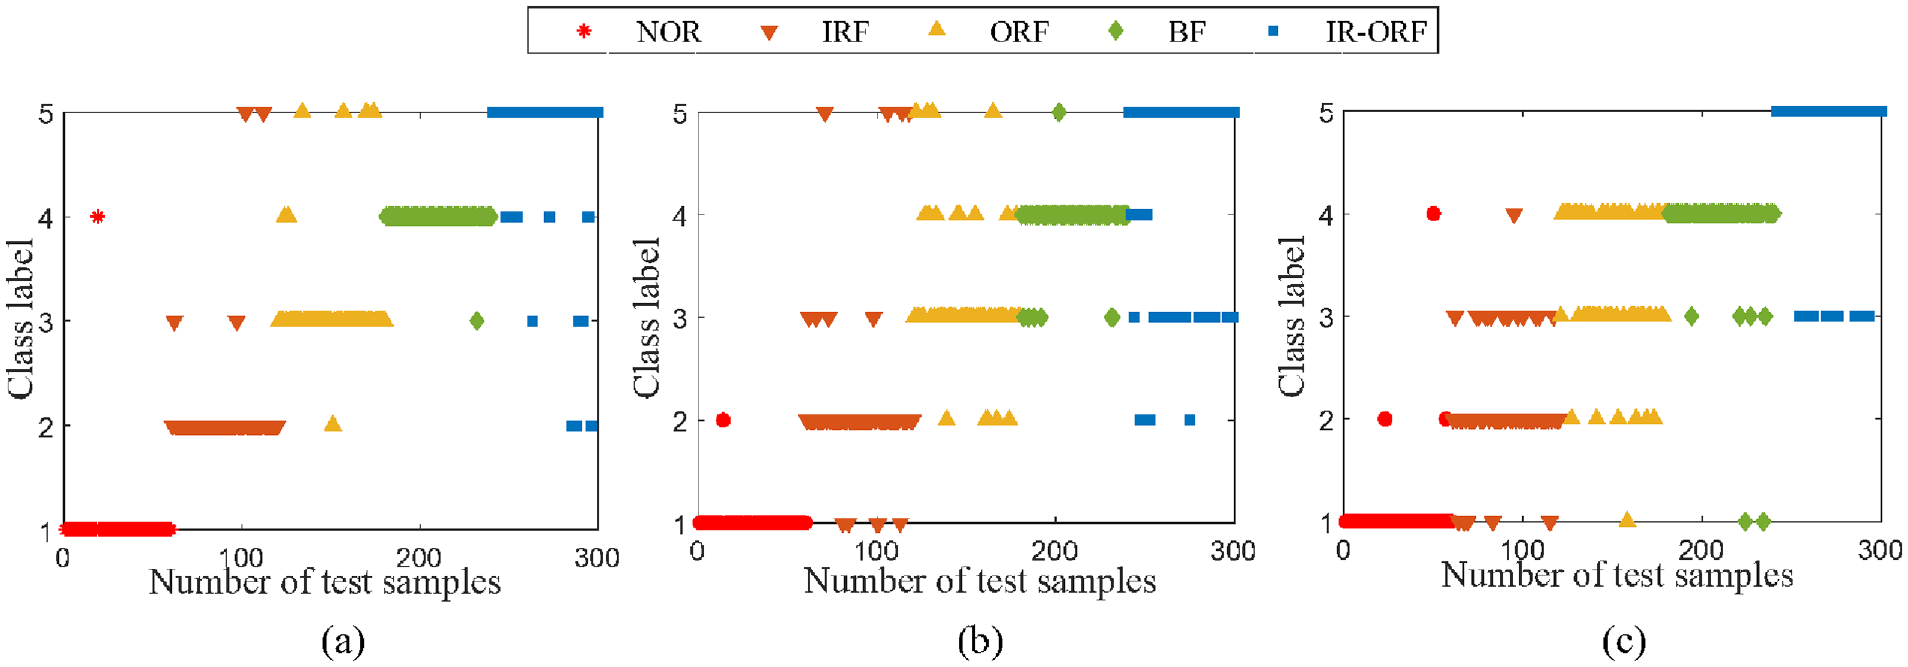
The outputs of test samples of the proposed method using SCSO-SVM: (a) NVG-MPE, (b) PG-MPE and (c) MPE.
NVG-MPE: multi-scale permutation entropy based on natural visibility graph; PG: path graph; MPE: multiscale permutation entropy; SCSO: sand cat swarm optimization; SVM: support vector machine.To evaluate the classification performance of SCSO-SVM, the classification results are compared with the diagnostic results of several typical classifiers (WOA-SVM, MPA-SVM, SMA-SVM, SVM), the parameters of these classifiers are given in Table 2. In the comparison experiment, each model is run 10 times to get 10 classification results, and the diagnostic results of these models are shown in Table 4. Figure 12 shows the box plot of the classification accuracies obtained by the different feature extraction method and the different classifiers. In Figure 12 and Table 4, we can see that the average diagnostic accuracy of SCSO-SVM is 91.23%, while the average classification accuracy of WOA-SVM, MPA-SVM, SMA-SVM and SVM are 90.6%, 91.0%, 90.23% and 87.6%, respectively. Compared with the other three models, the proposed SCSO-SVM diagnosis model can achieve better performance. Therefore, the optimization effect of the SCSO method is better than that of the SMA, MPA, and WOA methods, and the SCSO-SVM method is more suitable for rolling bearing fault diagnosis.
Ten classification results of different classification methods.
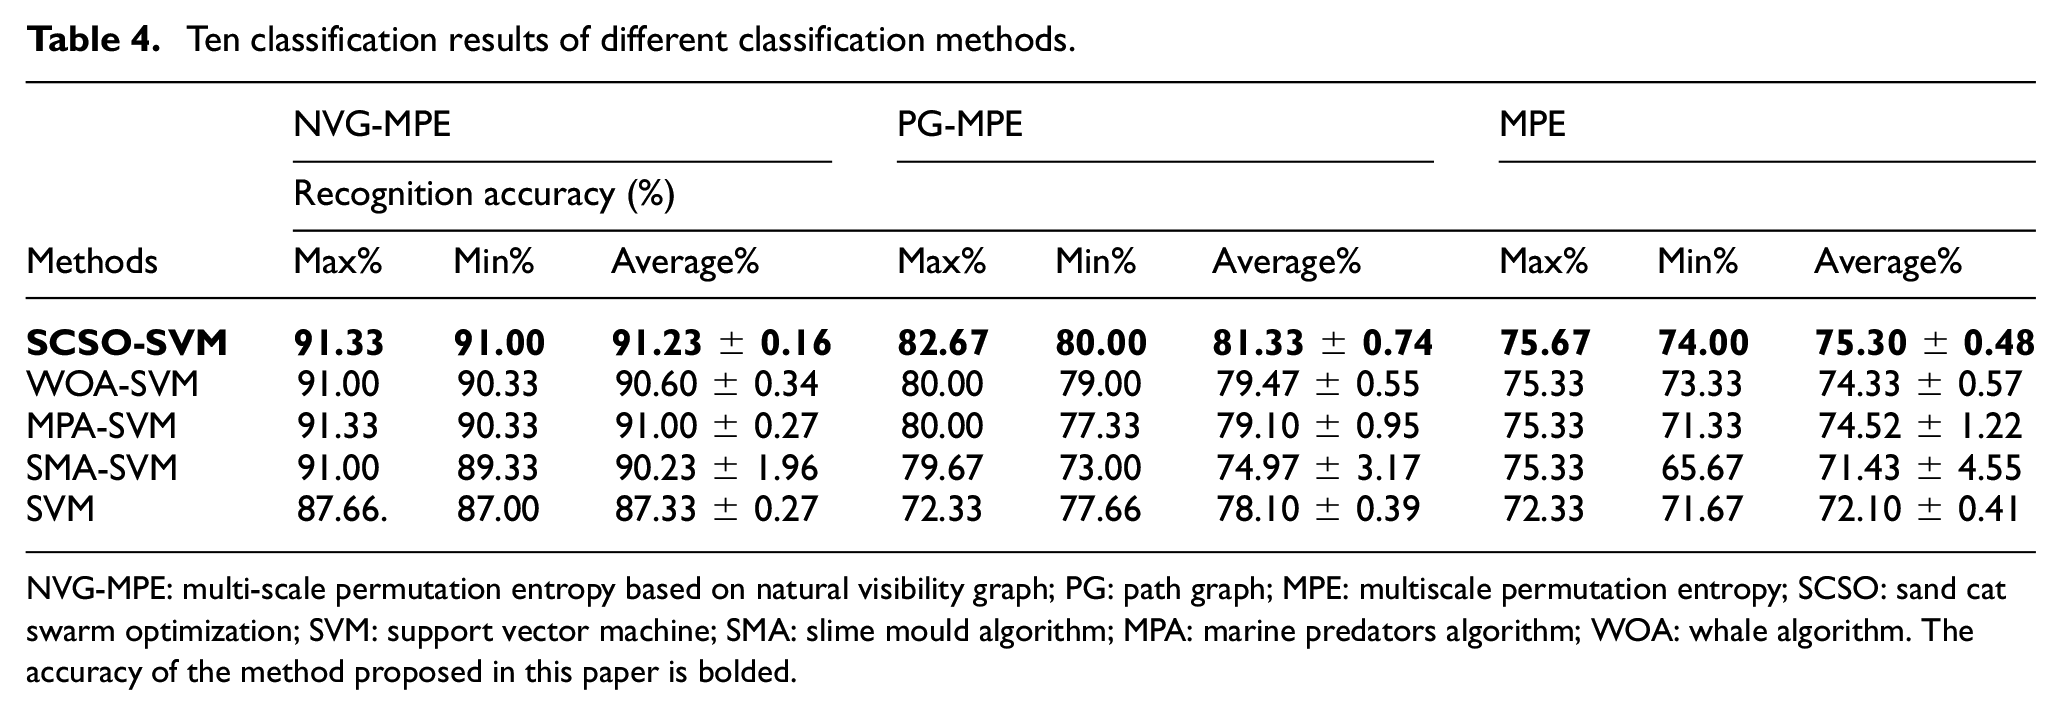
NVG-MPE: multi-scale permutation entropy based on natural visibility graph; PG: path graph; MPE: multiscale permutation entropy; SCSO: sand cat swarm optimization; SVM: support vector machine; SMA: slime mould algorithm; MPA: marine predators algorithm; WOA: whale algorithm. The accuracy of the method proposed in this paper is bolded.
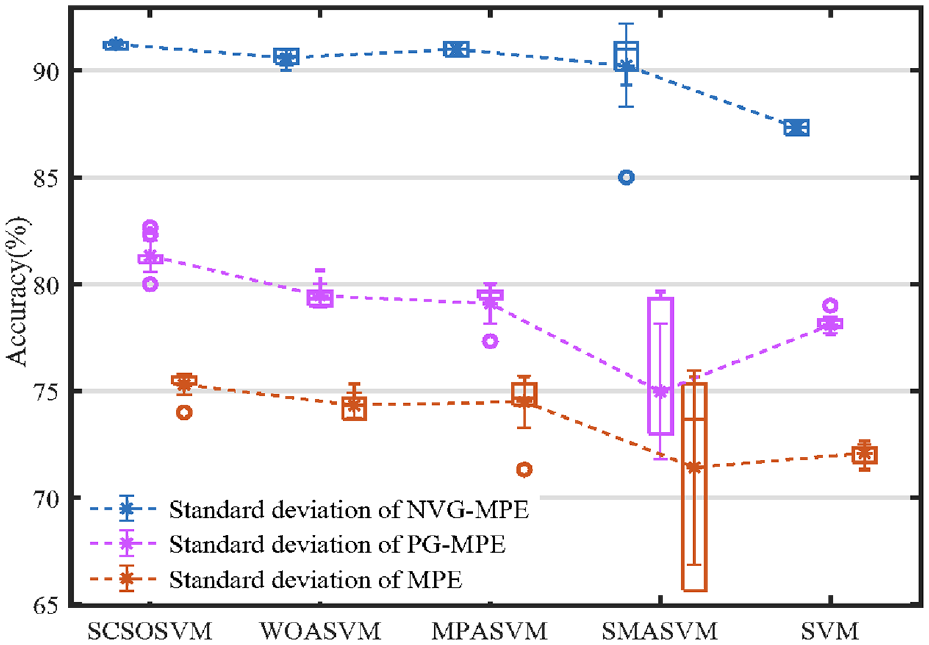
The classification accuracies obtained by different feature extraction method and different classifiers.
The above experimental results of rolling bearing fault diagnosis fully prove the superiority of the proposed fault diagnosis method based on NVG-MPE and SCSO-SVM, and verify that the feature extraction effect of NVG-MPE is significantly better than that of PG-MPE and MPE. In fault pattern recognition, the analysis results show that the pattern recognition effect of SCSO-SVM is obviously better than that of WOA-SVM, MPA-SVM, SMA-SVM and SVM classifiers.
Conclusion
In this paper, a novel fault diagnosis method of rolling bearing based on NVG,
(1)
(2) NVG-MPE is applied to compress feature sets of rolling bearing, the experiment result indicates that, compared to the other feature extraction method, NVG-MPE can easily identify the fault types, and improving the recognition accuracy.
(3) Given the advantages of SCSO and SVM, the SCSO-SVM is presented for fault diagnosis of rolling bearing. Experimental analysis shows that the fault diagnosis method based on SCSO-SVM classifier is superior to some existing optimization based SVM classifiers and SVM classifier.
The results show that by converting the vibration signal into graph signal and defining the entropy value on the graph signal, which can effectively characterize the characteristics of the vibration signal, and the proposed method is suitable for the fault diagnosis of rolling bearings. In the field of GSP, there are many kinds of graph signal conversion methods. In the future, we will explore the performance of the MPE of different graph signals in condition monitoring of a system and the effectiveness of the proposed method under variable conditions.
Footnotes
Declaration of conflicting interests
The author(s) declared no potential conflicts of interest with respect to the research, authorship, and/or publication of this article.
Funding
The author(s) disclosed receipt of the following financial support for the research, authorship, and/or publication of this article: The work was supported by the Natural Science Foundation of Xinjiang Uygur Autonomous Region (Grant No. 2022D01C89, 2022D01E33 and 2022D01C367), the National Science Foundation of China (No. 52065064).