
Abstract
Variational mode extraction (VME), a novel signal decomposition method based on a frequency-domain filter in essence, has recently become a potential tool in fault diagnosis. However, the original VME algorithm is not provided with full self-adaptation, and its performance in the extraction of fault features is subject to predefining the initial parameters, including initial center frequency (ICF) and balance parameter. To address these issues, a spectral feature informed variational model (SFIVM) algorithm is constructed to overcome the defects of parameters setting and efficiently realize the fault diagnosis without prior knowledge. Specifically, a spectral feature detector inspired by the convergence property of ICF is first developed to reveal the spectral features, including the detected center frequencies and boundary frequencies. Then, a balance parameter estimation formula is designed to adaptively determine the target balance parameter by taking advantage of the above spectral features. Finally, a highly efficient decomposition model is proposed to extract the fault-related mode from the vibration signal, where iterative optimization is unnecessary. The effectiveness of the proposed SFIVM method is verified by one simulated and two experimental cases. Moreover, its superiority and high efficiency are demonstrated by comparing it with some advanced and classical fault diagnosis methods.
Keywords
Introduction
With the integration, modularization, and intellectualization of industrial scenarios, machinery develops rapidly in automation, accuracy, and system scale. Rolling bearing, as a key component of machinery, significantly impacts the health status of the entire mechanical equipment.1–3 Nevertheless, some damages inevitably occur on the rolling bearing because of the extreme working environment. Eventually, a small bearing fault may cause the failure of machinery and even catastrophic accidents. Therefore, early defect diagnosis for rolling bearings is important.
The diagnostic methods based on vibration signal analysis have gained praiseworthy attention and achieved exceptional performance in application to bearing fault diagnosis.2,4,5 In recent years, several vibration-based diagnostic technologies, including time–frequency representation, 6 spectral kurtosis, 7 blind deconvolutions, 8 sparse representation, 9 stochastic resonance, 10 empirical mode decomposition (EMD), 11 local mean decompositions, 12 wavelet transform,13,14 short-time Fourier transform, 15 and variational mode decomposition (VMD)16,17 have been well developed. Wherein VMD is preferred by researchers for its advantages of a complete mathematical framework, strong robustness to noise and the alleviation of mode mixing. Nevertheless, the presetting of initial parameters, including the number of decomposed modes, balance parameter, and initial center frequency (ICF), seriously influences the performance of VMD. Therefore, many researchers proposed some advanced techniques to improve the VMD algorithm. Jiang et al. 18 proposed an adaptive and efficient VMD to adaptively determine the number of decomposed modes and the ICF by researching the convergent tendency phenomenon in the VMD model. Ni et al. 19 developed a fault information-guided VMD method to extract the fault features, which estimated the number of potential modes by a statistical model based on the fault information. Moreover, an evaluation indicator called the ratio of fault characteristic amplitude is designed to determine the optimal balance parameter. Li et al. 20 proposed an empirical VMD method based on a binary tree model. The proposed method decomposed the original signal into two modes and optimized the balance parameter by a new index called refined composite multiscale dispersion entropy. Huang et al. 21 employed the scale-space representation to obtain the initial parameters of the VMD. Wang et al. 22 developed a multi-objective particle swarm optimization algorithm to select the optimal initial parameters, including ICF, the number of decomposed modes, and the balance parameter. Li et al. 23 tried to solve the problem of parameter selection in VMD by applying the Fourier spectrum segmentation algorithm and Gini index.
Given that the relationship between the fault-related mode and residual signal was not taken into account in VMD model, Nazari and Sakhaei. 24 recently proposed a variational mode extraction (VME) method to extract a specific mode from the composite signal. The mathematical framework of VME is similar to VMD. Unlikely, VME directly decomposes the raw composite signal into the desired mode and the residual signal. Furthermore, the desired mode is extracted by iteratively searching for the optimal solution of the variational model. With the advantages of a complete mathematical framework, the strong robustness to noise, and the alleviation of mode mixing, VME does not need to preset the number of decomposed modes. Moreover, VME has higher convergence speed and computational efficiency compared with VMD. Unfortunately, the performance of VME in fault diagnosis is still troubled by the predefining of the ICF and balance parameter. The inappropriate setting of ICF may fail to extract the desired mode, and the improper balance parameter will cause a mismatch of fault information. Therefore, predefining the ICF and balance parameter becomes a complex problem in the VME algorithm.
Many scholars have made great efforts to improve the VME algorithm. The advanced methods for enhancing the performance of VME are divided into three categories. The first is to utilize an intelligent optimization algorithm to select initial parameters. For example, Zhong et al. 25 employed the particle swarm optimization algorithm to determine ICF and balance parameter, where an index integrated by correlation coefficient, L-kurtosis, and information entropy is applied as the fitness function. Pang et al. 26 developed the ensemble impulsiveness and cyclostationarity as the fitness function of the particle swarm optimization algorithm to obtain the ICF and balance parameter. Wang et al. 27 utilized the whale optimization algorithm to optimize the balance parameter and proposed a comprehensive evaluation indicator fluctuation spectrum to determine the ICF. However, these intelligent optimization algorithms will seriously increase the computational burden along with the local optimum issue. The second strategy is to combine the idea of iterative decomposition framework. Nazari and Sakhaei 28 introduced a successive variational mode decomposition (SVMD) method to continuously optimize the ICF and balance parameter in each iteration process. Pang et al. 29 developed a recursive VME method. During each iteration process, the dominant frequency of the residual signal is determined as ICF, and an empirical formula with the ICF is used to select the balance parameter. Nevertheless, this kind of improved method tends to yield many redundant components, which results in low decomposition efficiency. In addition, over-decomposition and under-decomposition are common dilemmas they confront with. Besides, the third strategy to select the initial parameters in VME is guided by evaluation indicators. Pang et al. 30 used the continuous envelope correlation to separate the spectrum of the original signal and determined the frequency boundary based on scale-space division, which is committed to the selection of ICF. Moreover, the balance parameter is optimized by envelope spectral kurtosis. Guo et al. 31 obtained ICF through short-time Fourier transform and utilized an indicator, namely, the standard deviation of differential values of envelope maxima positions, to optimize the balance parameter. Liu et al. 32 proposed an adaptive window fusion strategy based on a log-cycligram and correlation coefficient to address the problem of determining the ICF and balance parameter. Although the above methods provide a feasible solution for the problem of parameter selection in original VME, these improved methods guided by the advanced indicators might cause the under-decomposition or over-decomposition with the fault-related mode. Moreover, the improved methods based on evaluation indicators have low computational efficiency. In summary, the VME algorithm still needs to be enhanced by exploring more advanced strategies.
To improve the performance of VME, this study develops a spectral feature informed variational model (SFIVM) algorithm to extract the fault-related mode without prior knowledge effectively and efficiently. The proposed method is capable of full self-adaptation and eliminates the awkward situation that the initial parameters, including ICF and balance parameter require to be preset in original VME. The several contributions of this article are as follows:
The convergence properties are excavated by researching the iterative trajectories of ICF in original VME. Then, inspired by the convergence properties, a novel spectral feature detector (SFD) is constructed to traverse the spectrum of the raw signal and adaptively obtain spectral features, including detected center frequencies and boundary frequencies.
The semi-bandwidth of the desired mode can be determined by the absolute value of the difference between the detected center frequency and boundary frequency of the corresponding mode. Moreover, a balance parameter estimation formula guided by spectral features is designed to determine optimal balance parameter efficiently.
With full self-adaptation, a novel SFIVM method integrated with the SFD and balance parameter estimation formula is proposed to extract the fault-related mode from the raw signal. Its effectiveness and superiority compared with five classical and advanced methods have been demonstrated by a simulated case and two experimental cases.
The rest of this article is organized as follows: section “The theoretical framework and analysis” briefly introduces the content of the original VME. Section “Proposed SFIVM method” describes the detailed principle of the proposed SFIVM method, including the foundation of SFD, the derivation of the balance parameter estimation formula, and the fault diagnosis procedure. Section “Performance verification of SFIVM” conducts a simulated case and two experimental cases to demonstrate the effectiveness and superiority of the proposed SFIVM method compared with five classical and advanced methods. Section “Discussion” presents some discussions. Section “Conclusion” provides the conclusion.
The theoretical framework and analysis
Review of VME
VME, as an extension of VMD, has a similar mathematical framework.
24
Uniquely, the raw signal
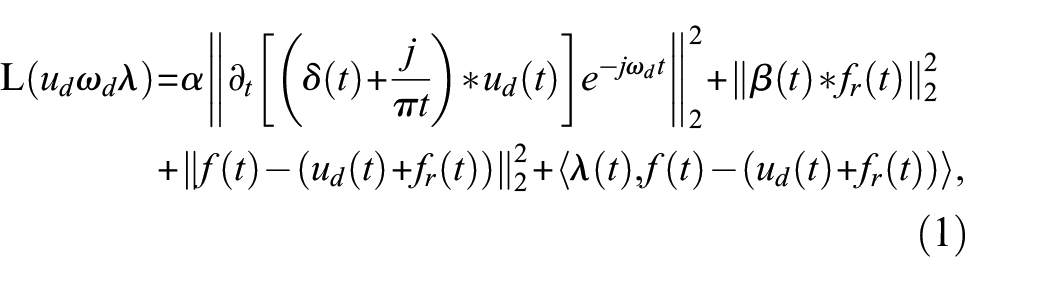
where
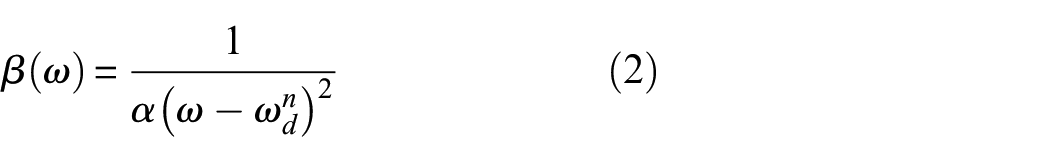
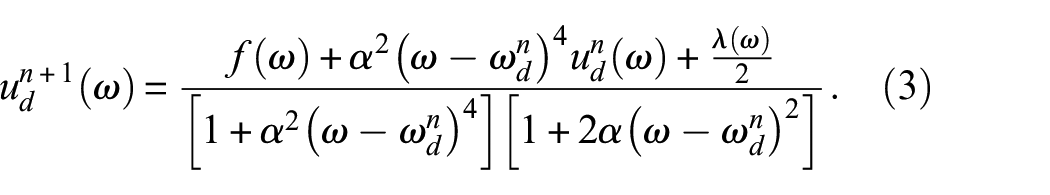
Universally, the alternating direction method of multipliers is utilized to solve the optimization problem. Then, the desired mode is updated iteratively, as shown in Equation (3):
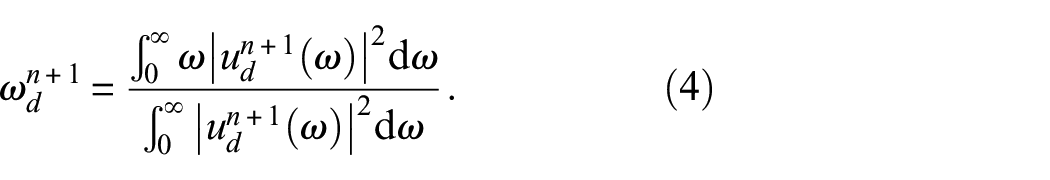
Moreover, the CF of the desired mode is obtained as shown in Equation (4):
The Lagrangian multiplier is updated by Equation (5):
where
The iteration process will cease when the convergence condition in Equation (6) is satisfied.
where
Parameter analysis of VME
Based on the introduction to the VME principle in section “Review of VME,” the initial parameters, including ICF and balance parameter, play an important role in effectively extracting the desired mode. In order to clearly show the influence of two initial parameters on the extraction of bearing fault feature in VME, a simulated bearing faulty signal composed of fault-induced impulses and noise is constructed as follows:
where

The influence of ICF on VME is investigated by inputting different initial center frequencies with a fixed balance parameter. The balance parameter is set as 1000, and the different initial center frequencies are set to 0, 1000, 2000, 3000, 4000, and 5000 Hz. The iterative results for different initial center frequencies in VME are shown in Figure 1. Only
The iterative results for different initial center frequencies.
The envelope spectra of all modes with different initial center frequencies: (a)
The influence of balance parameter
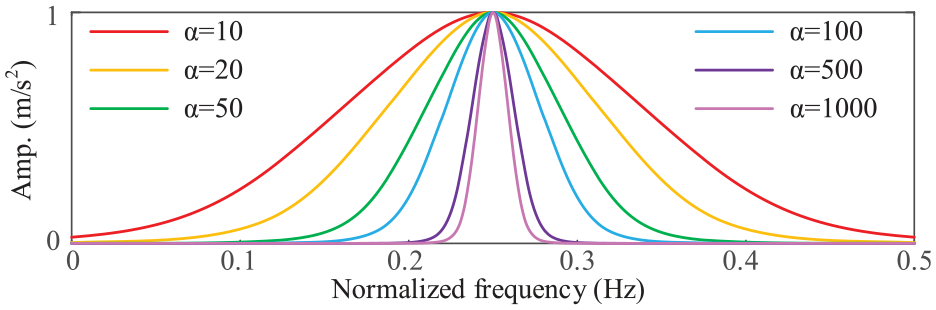
The filters with different balance parameters.
The envelope spectra of all modes with different balance parameters: (a)
In summary, the performance of VME is subject to the predefining of the initial parameters, including ICF and balance parameter. The incorrect setting of ICF will fail to extract the fault feature. Besides, the inappropriate balance parameter will cause the mismatch of fault information of extracted mode. Specifically, the smaller balance parameter will cause the mode extracted by VME to contain more noise and interference components, while the larger balance parameter will cause loss of fault information. Therefore, the priority for fault diagnosis in VME is to overcome the defect of improper setting of ICF and balance parameter.
Proposed SFIVM method
To address the problem of parameter selection in original VME, a novel SFIVM method is proposed to extract the fault-related mode efficiently without prior knowledge in this section.
Spectral feature detector
The signal spectrum usually contains much information, which may provide directions for solving the parameter selection problem. According to the analysis of iteration process of ICF in section “Parameter analysis of VME,” it can be found that the ICF in VME model is capable of converging to the actual frequency. Besides, the different convergence tendency phenomena can be observed on both sides of the real frequency. Inspired by the convergence tendency phenomenon, an SFD is developed to reveal the spectral structure and obtain the spectral features, deeply digging into spectral characteristic information.
First, the VME model is simplified to explore the spectral structure better. Given that
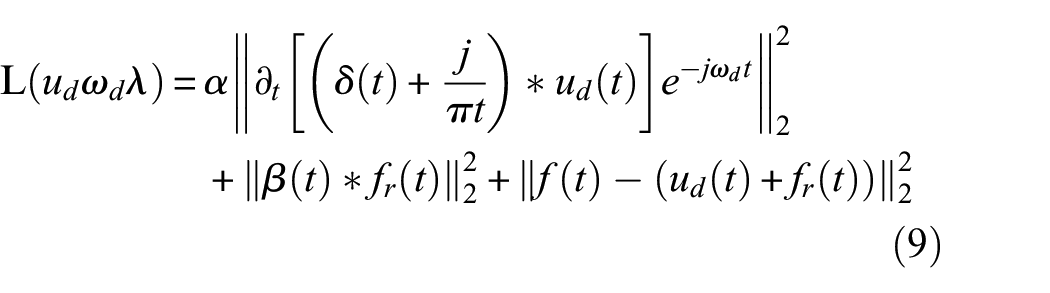
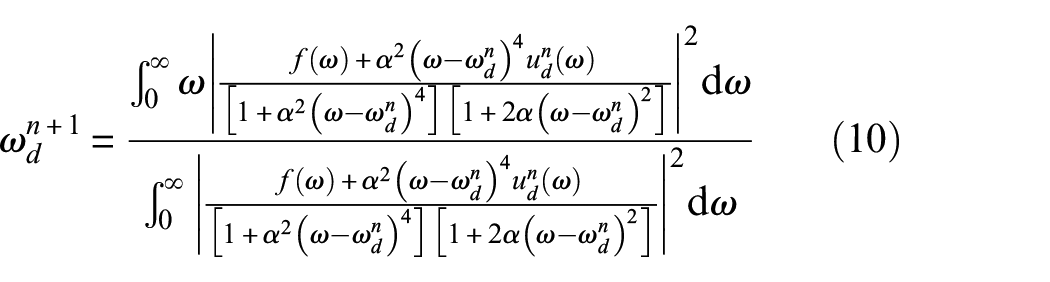
Consequently, the iteration formula of CF is obtained, as shown in Equation (10).
Then, a simulated example consisting of three harmonics is presented to reveal the spectral structure through the iteration process of ICF. The simulated signal is constructed as follows:
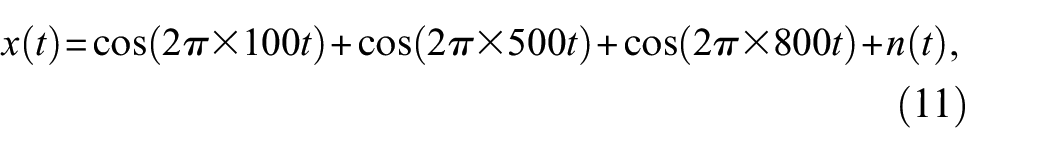
where
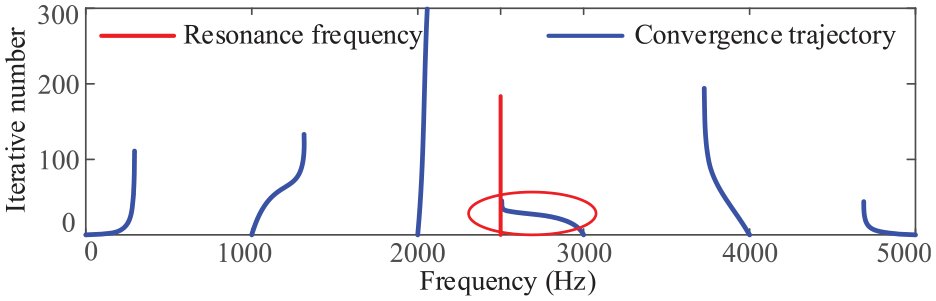
Each transition of the convergence tendency indicates spectral features during the iteration process of ICFs. The detected CF is defined when the convergence tendency changes from a monotonous increment to a monotonous decrement. Conversely, the transition point is the boundary frequency of the desired mode.
The bandwidth of the desired mode can be determined by utilizing spectral features. In detail, the semi-bandwidth can be obtained by the absolute value of the difference between the detected CF and boundary frequency of the corresponding mode, which further obtains the bandwidth of the desired mode.
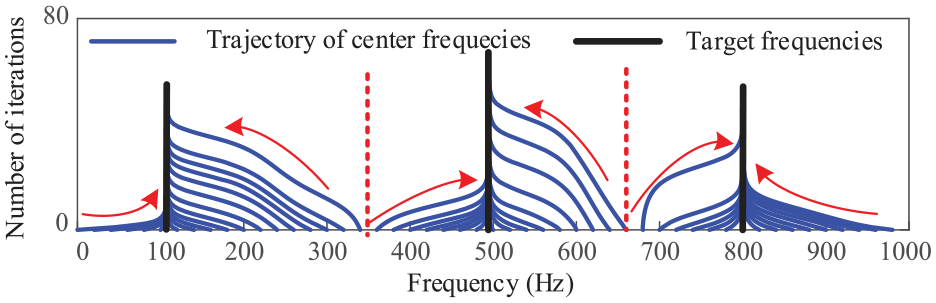
Convergence trajectory of ICFs.
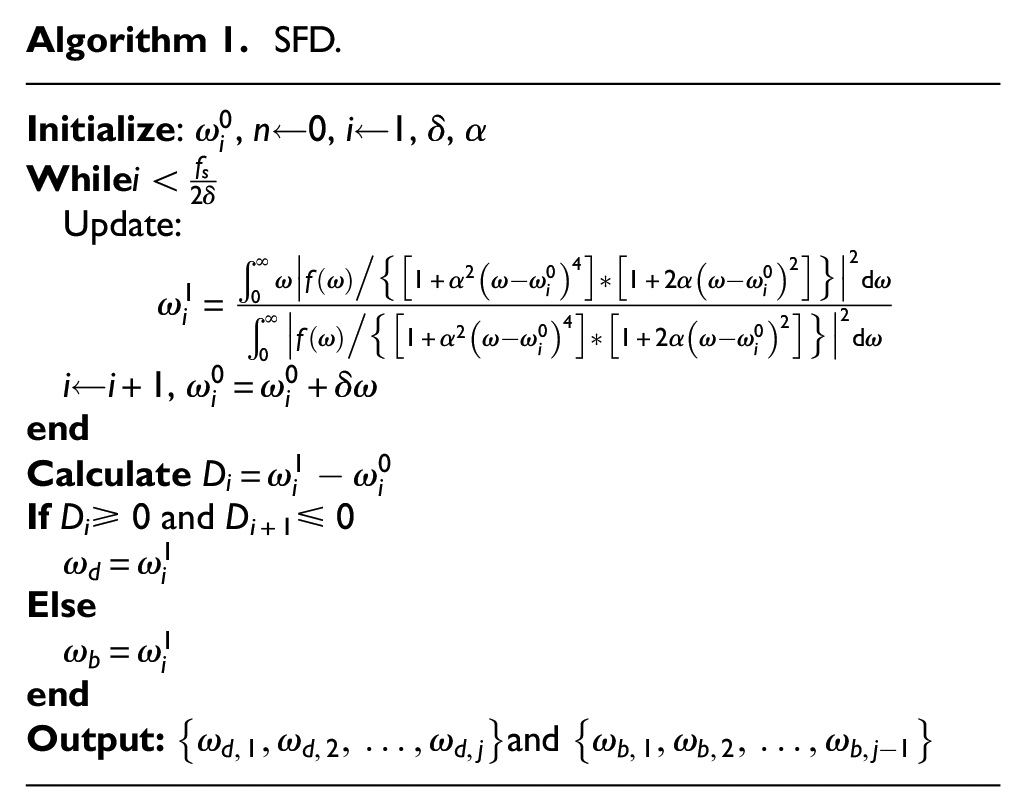
With the guidance of the above analysis, a novel SFD is established for detecting the spectral features hidden in the raw signal. The complete procedure is summarized in Algorithm 1.
SFD.
Subsequently, the semi-bandwidth of the desired mode can be obtained by utilizing the detected center frequencies and boundary frequencies. The spectral structure of the Fourier spectrum of the desired mode buried in the raw vibration signal is an approximately symmetric spectrum. Nevertheless, the boundary frequencies on different sides of the detected CF are unsymmetrically distributed due to the influence of the noise. Therefore, to guarantee stronger robustness of the desired mode, the semi-bandwidth obtained by the spectral features is calculated in Equation (12).

Given that the initial balance parameter needs to be preset before executing the SFD algorithm, the influence of different balance parameters on detecting the spectral features is detailed analyzed in the discussion section “Conclusion.” We found that the balance parameters corresponding to semi-bandwidth of the desired mode gradually decreased and tended to smooth with the increase of the initial balance parameter, as shown in section “Discussion.” Therefore, the SFD is stable when the balance parameter increases to a value. Without loss of generality, initial balance parameter used in the SFD algorithm is set to be 1000 in the simulated case and two experimental cases in this study.
Balance parameter estimation formula
The balance parameter also plays a vital role in the VME algorithm. Some correlations are usually found between the bandwidth of the desired mode and the balance parameter. The balance parameter is a critical factor in controlling the bandwidth of the desired mode, and the bandwidth is an external manifestation of the effect of the balance parameter. In this subsection, the quantitative relationship between the bandwidth of the desired mode and the balance parameter is analytically derived, which offers a theory instruction to optimize the balance parameter efficiently. Then, a balance parameter estimation formula is developed to determine the optimal balance parameter efficiently by utilizing spectral features. The specific content of the balance parameter estimation formula is given as follows.
When the iteration number N is large enough,
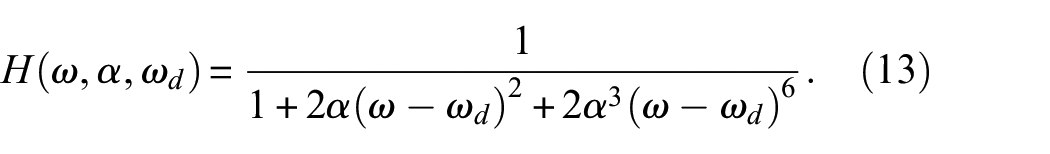
Subsequently, the bandwidth is evaluated by introducing the −3 dB cut-off criterion, and Equation (13) can be converted to Equation (14).

As a result, the solution of Equation (14) can be expressed as follows:
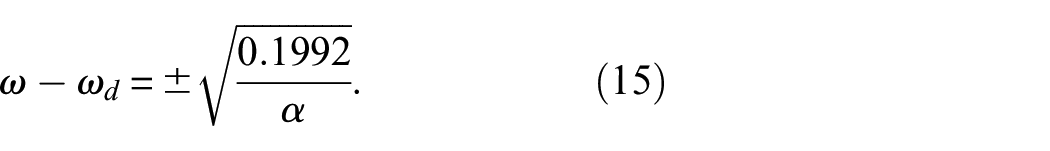
The expression of bandwidth is
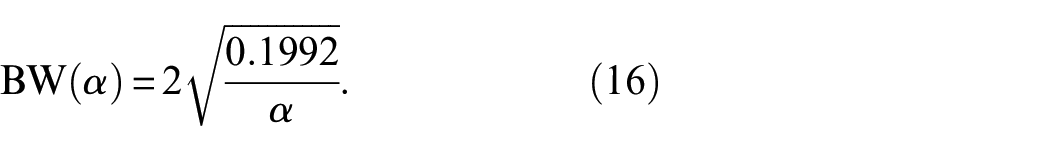
In general, normalized frequency is quoted to represent
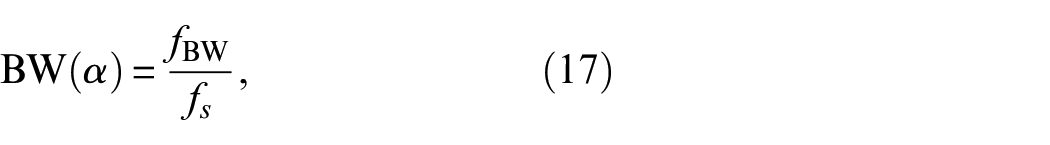
where
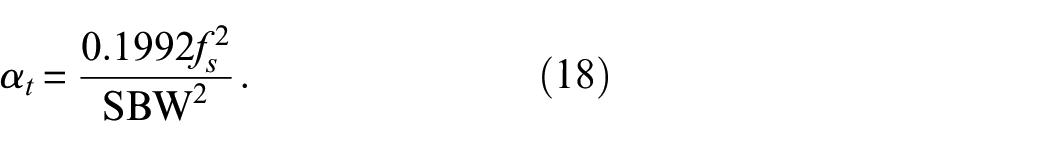
Equation (18) provides a proper strategy to determine the target balance parameter of the VME model.
SFIVM and its application in fault diagnosis of rotating machinery
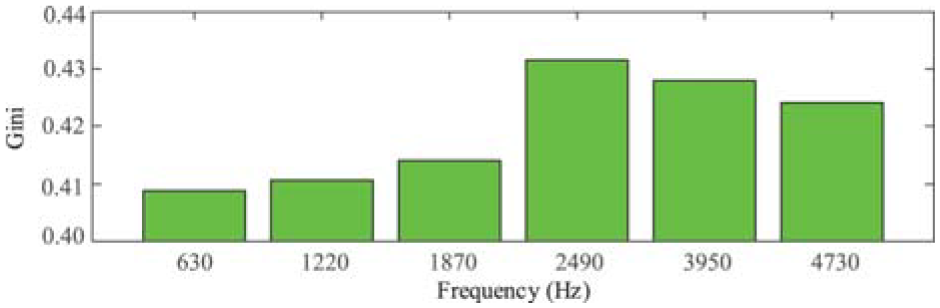
In this subsection, a novel SFIVM method is constituted by the SFD and balance parameter estimation formula. Specifically, when multiple detected center frequencies are obtained by executing the SFD algorithm, the target center frequency (TCF) of the fault-related mode is determined with the guidance of the Gini index.33,34 The Gini index, expressed in Equation (19), has been widely accepted as an effective indicator for identifying fault information.

where N represents the length of the signal and the vector
The larger the Gini index, the more fault information is evidenced in extracted mode. Therefore, the detected CF of the mode with the maximum value of Gini is TCF. Then, the semi-bandwidth of the desired mode can be gained by Equation (12). As a result, the target balance parameter is obtained by balance parameter estimation formula. Given that the TCF and target balance parameters have been determined in the previous procedure, iterative optimization is not necessary during mode extraction. Thus, a highly efficient decomposition model is proposed with the guidance of the TCF and target balance parameter, which is shown in Equation (20).
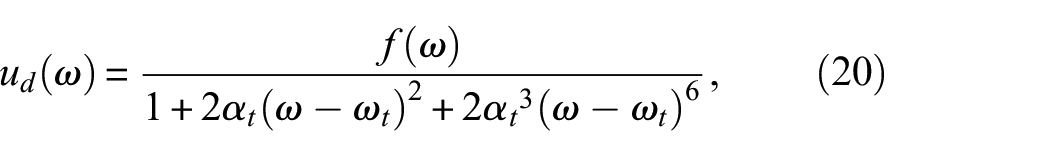
where
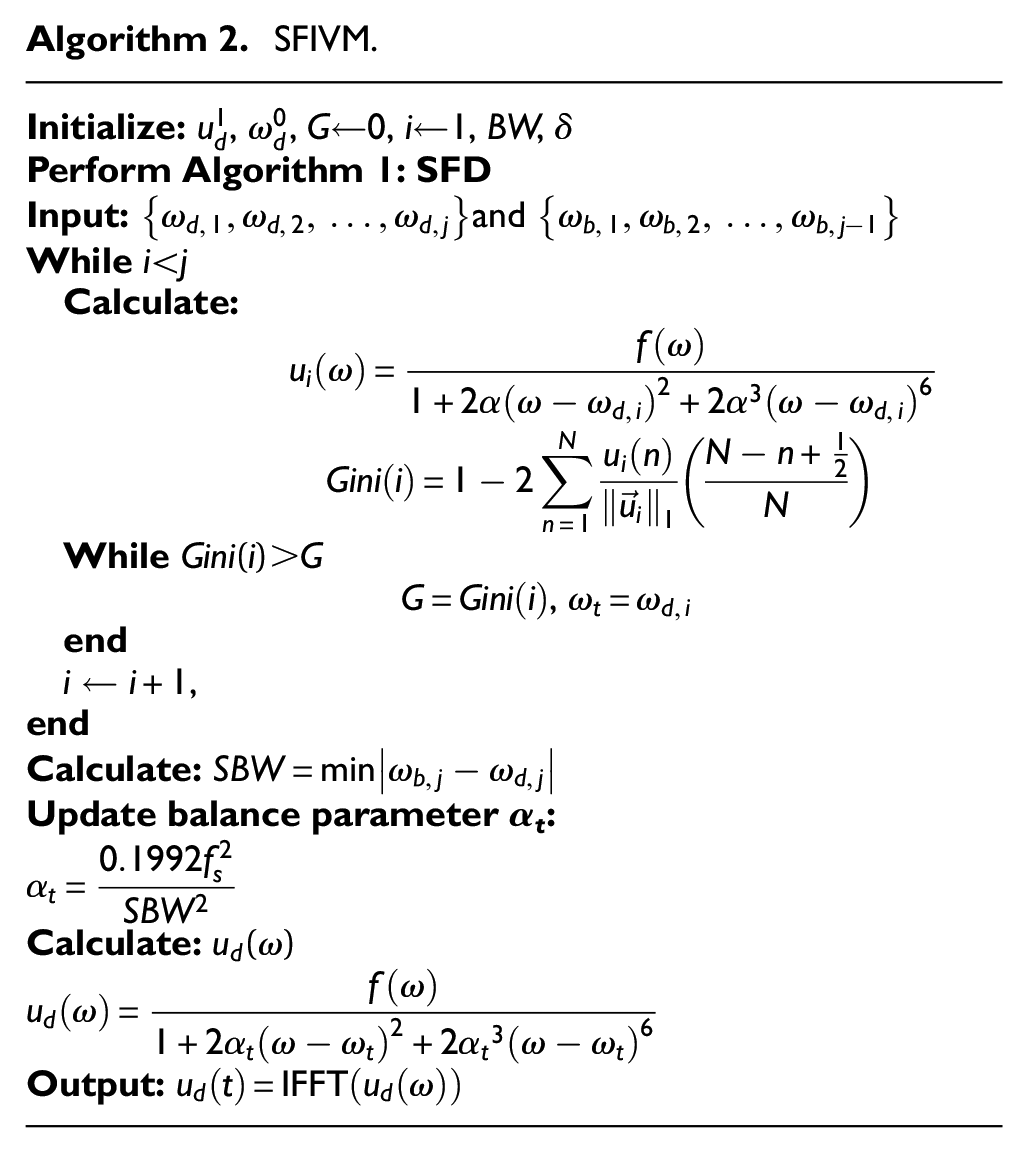
In summary, SFIVM is established in Algorithm 2. Besides the flowchart for fault diagnosis is shown in Figure 6.
SFIVM.
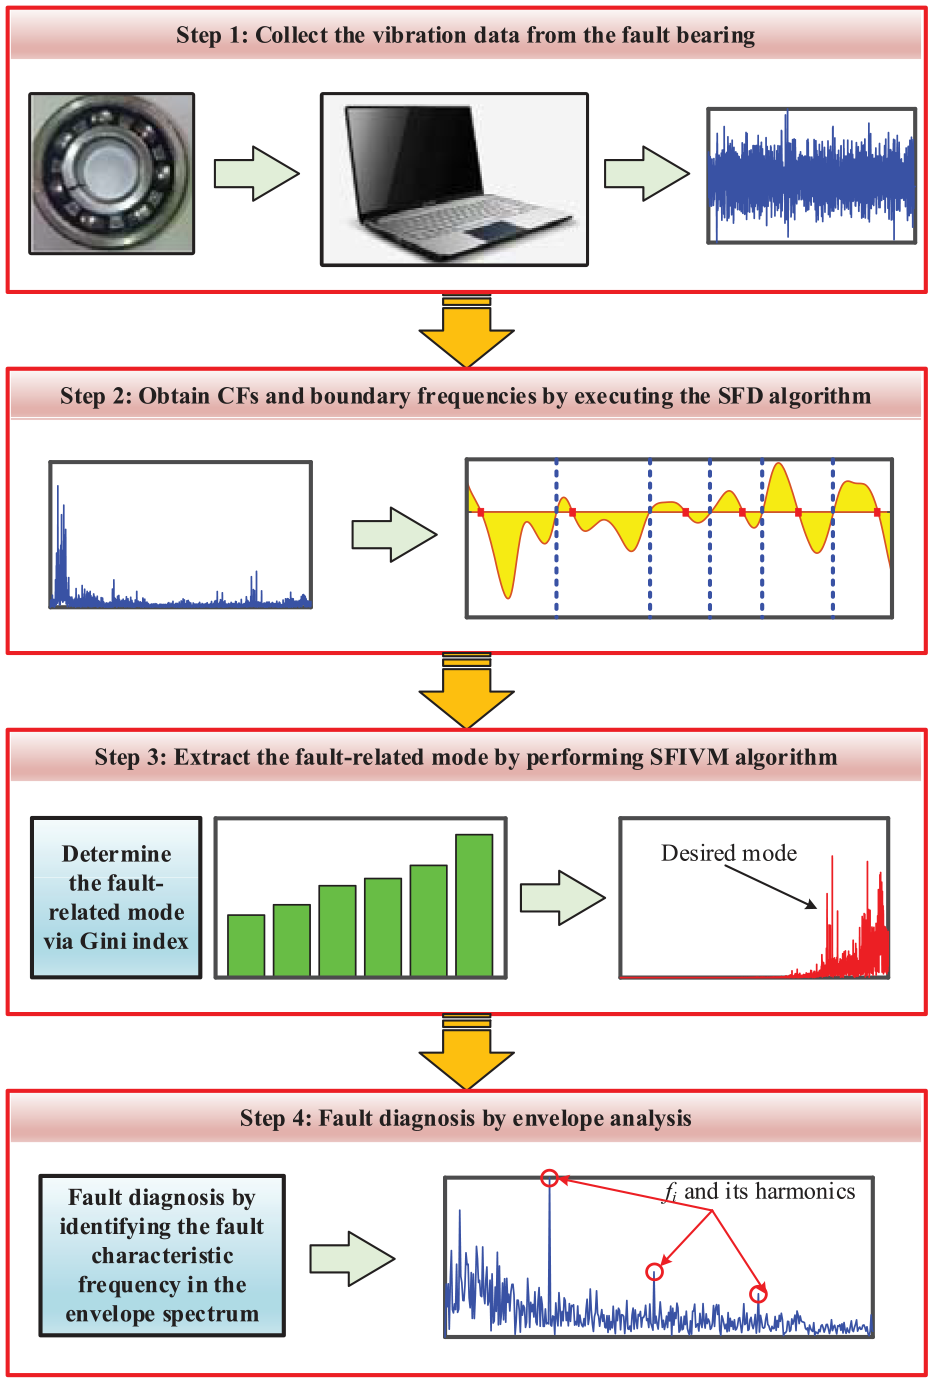
Steps of SFIVM method for bearing fault diagnosis.
Performance verification of SFIVM
Case 1: Simulation verification
In this subsection, the simulated bearing faulty signal constructed in Equation (21) 35 is utilized to verify the effectiveness and superiority of the proposed SFIVM method.
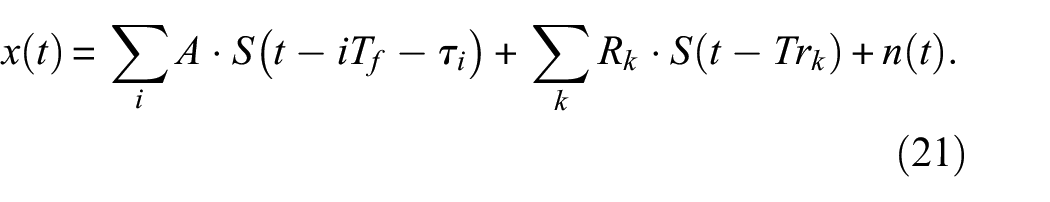
The simulated signal

where
The specific value of the parameter of three parts in the simulated signal.
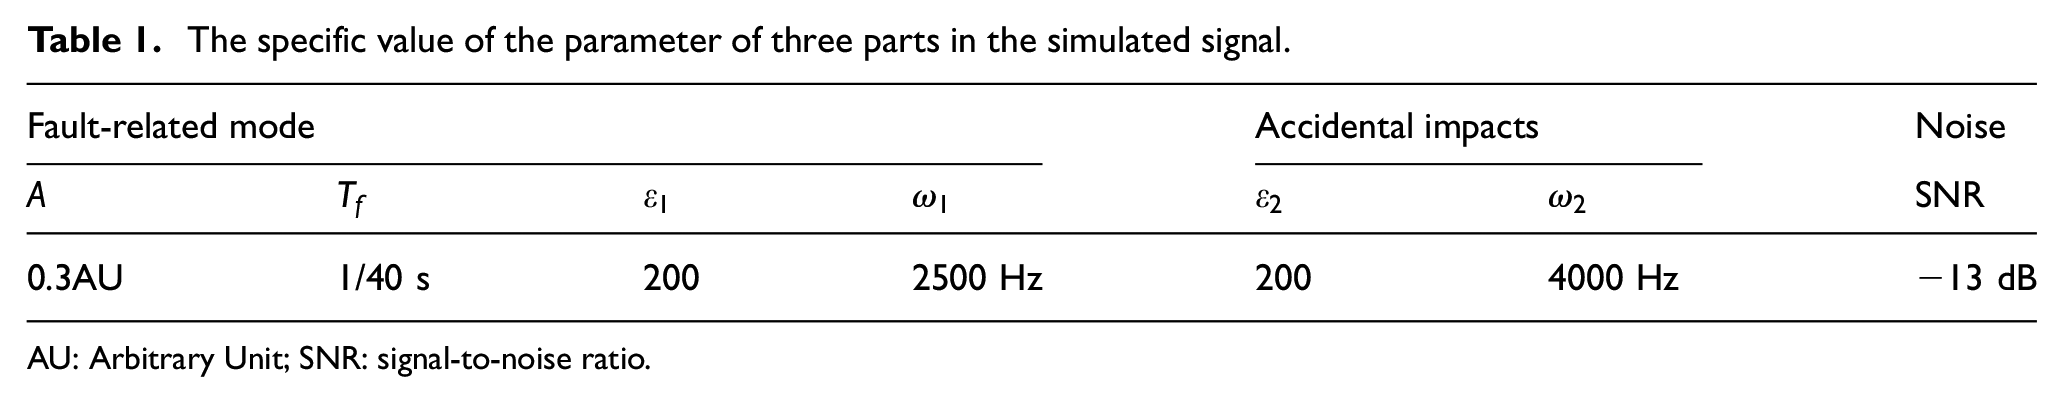
AU: Arbitrary Unit; SNR: signal-to-noise ratio.
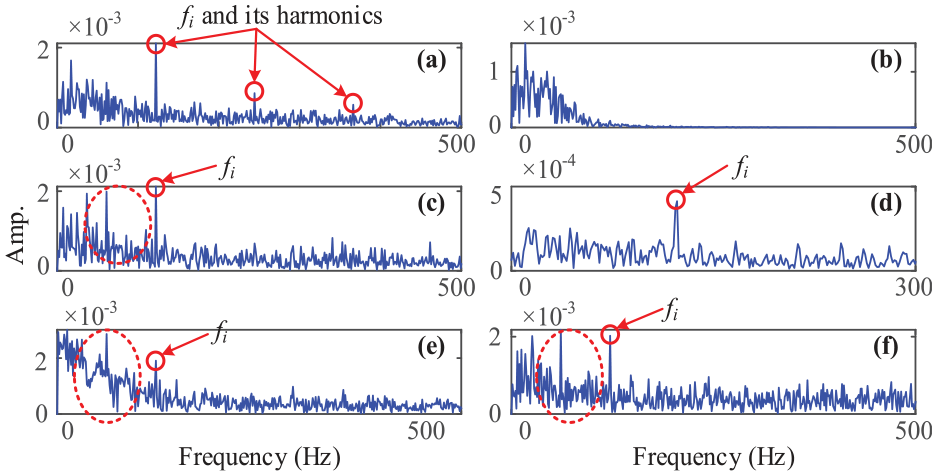
Figure 7(a) to (c) display the time waveform, Fourier spectrum, and envelope spectrum of the simulated signal. The fault-related mode is buried in the raw signal, and the fault-related features cannot be visualized directly. Subsequently, the proposed SFIVM method is applied to analyze the simulated signal. Figure 8 displays the spectral structure of several modes detected by SFD. The red solid squares represent the TCFs, and the blue dashed lines denote the boundary frequencies. The detection results indicate that the SFD realizes the separation of various modes from the raw signal without prior knowledge. Figure 9 exhibits the values of the Gini index corresponding to modes with detected center frequencies. The fourth mode possesses the highest value of the Gini index. As a result, the fourth mode is the fault-related mode. Figures 10(a) and 11(a) display the Fourier spectrum and envelope spectrum of fault-related modes extracted by the proposed method. Figure 10(a) shows that the resonance band is successfully located, and the fault-related mode is decoupled by the proposed SFIVM method. Moreover, the obvious peaks of
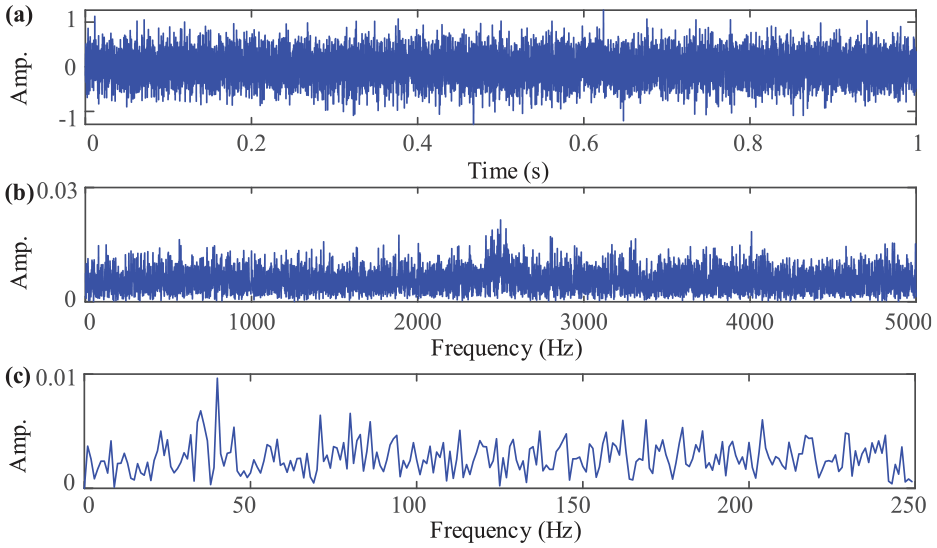
Simulated signal: (a) time waveform, (b) Fourier spectrum, and (c) envelope spectrum.
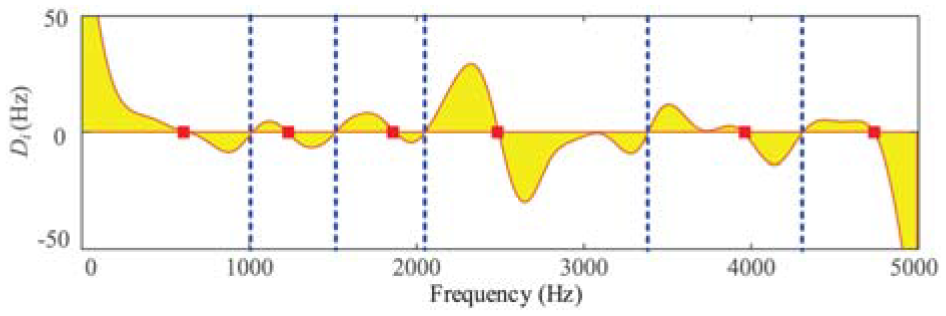
Spectral structure diagram of the simulated signal.
The value of Gini corresponding to modes with detected center frequencies in Case 1.
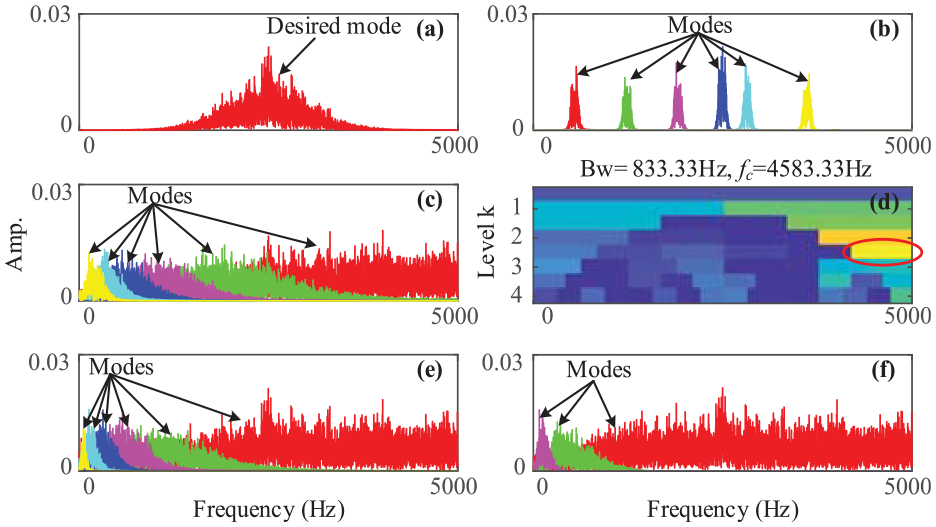
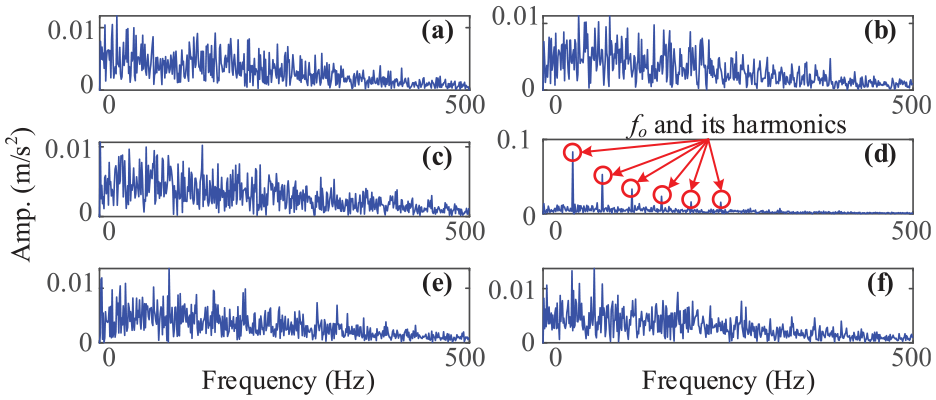
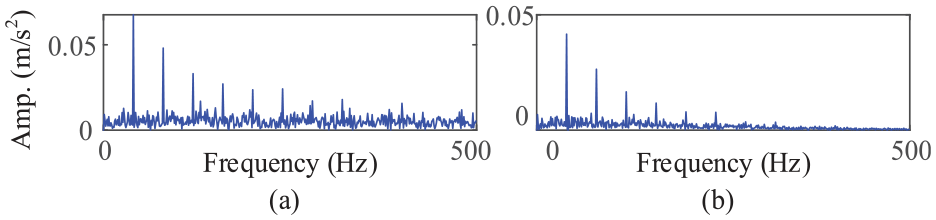
Fourier spectra and Kurtogram of simulated signal decoupled by (a) Proposed method, (b) SVMD, (c) EMD, (d) fast Kurtogram, (e) REMD, and (f) RLMD.
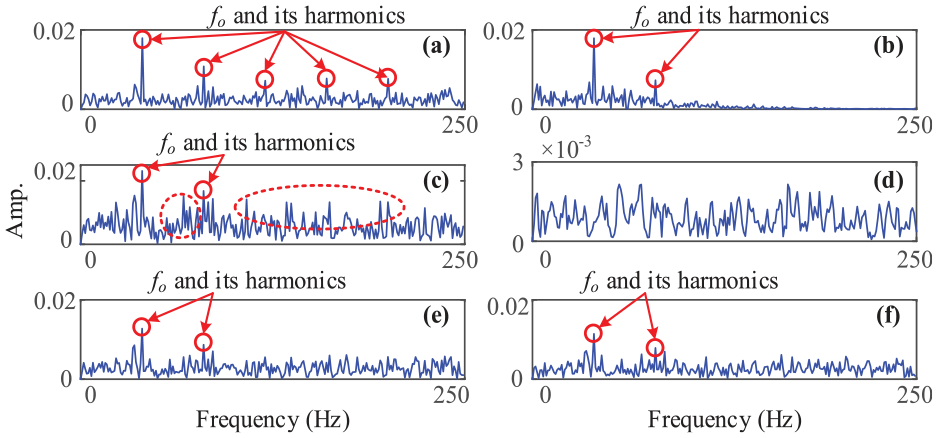
Envelope spectra of the fault-related mode in Case 1 obtained by (a) Proposed method, (b) SVMD, (c) EMD, (d) fast Kurtogram, (e) REMD, and (f) RLMD.
For comparison, a series of classical and advanced technologies, including SVMD, EMD, fast Kurtogram,
36
robust empirical mode decomposition (REMD),
37
and robust local mean decomposition (RLMD)
38
methods are utilized to analyze the simulated signal, whose initial parameters are set by default. Figure 10(b) to (f) exhibit the Fourier spectra and Kurtogram obtained by different methods, where different colors depict different modes. The envelope spectra of the fault-related mode are shown in Figure 11(b) to (f) to display the analysis results of these methods on simulated signals better. The SVMD method decomposes the simulated signal into eight modes. Seven extraneous modes are extracted except for the fault-related mode, resulting in mode redundancy and inefficiency. As shown in Figure 11(b), only two harmonics can be observed due to the small bandwidth of the fault-related mode, which can be discovered in Figure 10(b). According to the analysis results of the EMD method, it can be observed that there is a serious mode mixing phenomenon in Figure 10(c). Moreover,
Case 2: Experimental verifications on a rolling element faulty bearing
The effectiveness of the proposed SFIVM method is demonstrated by analyzing a high-speed train axle-box bearing faulty signal.39–41 The bearing faulty signal is collected through two accelerometer sensors, which are installed on the axle box. The rotating speed of the shaft is 1691 rpm. The rolling element defect with a depth of 0.6 mm and a width of 0.2 mm was implanted manually on the analytical bearing. Figure 12 displays the experimental test bed and a faulty rolling element. The parameters of the tested bearing are listed in Table 2. The outer-race faulty frequency
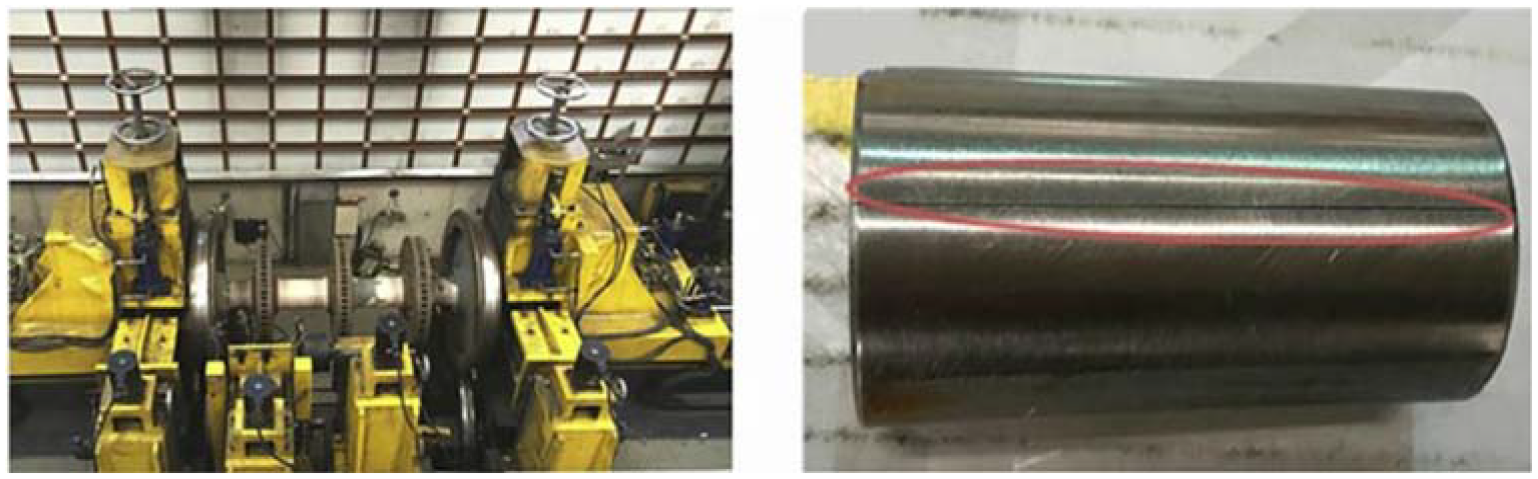
Bearing parameters and fault characteristic frequency.
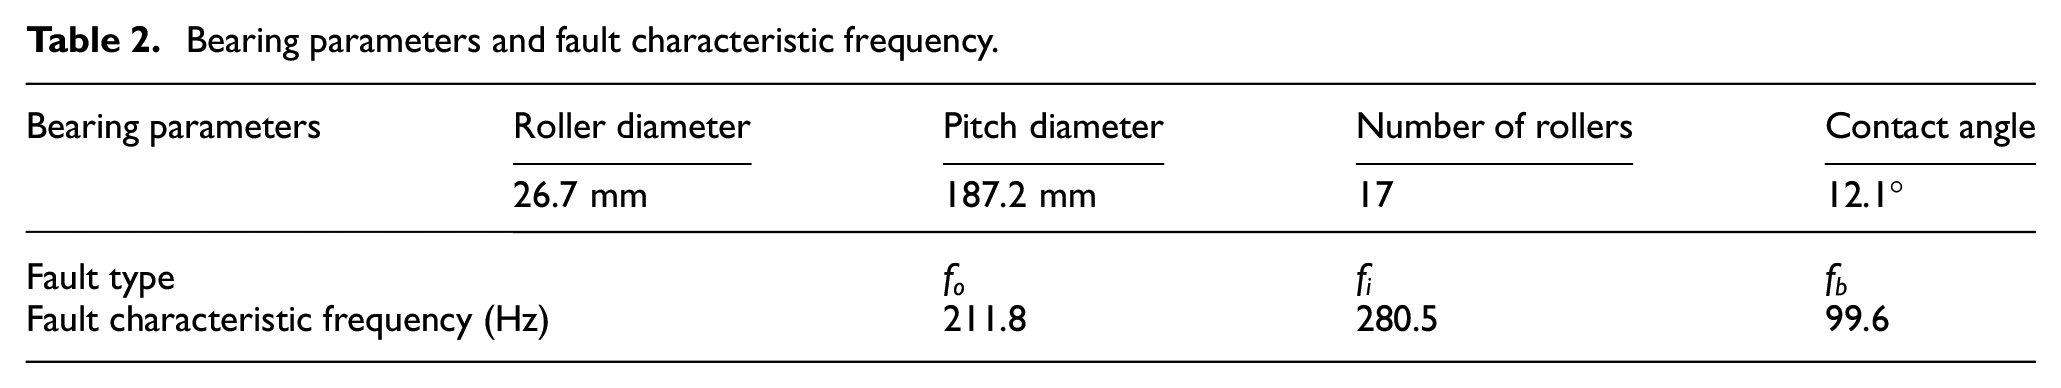
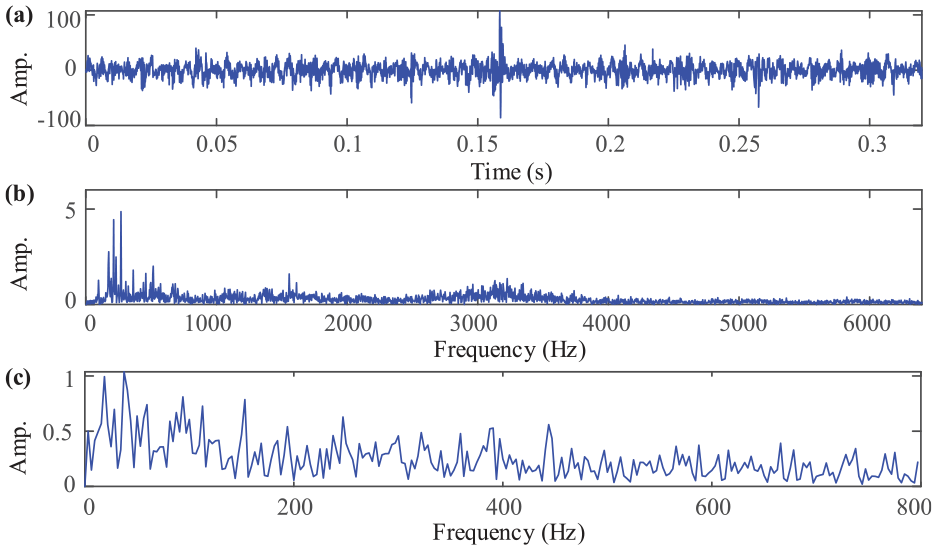
Bearing signal with rolling element fault: (a) time waveform, (b) Fourier spectrum, and (c) envelope spectrum.
The faulty signal is analyzed by the proposed SFIVM method. As shown in Figure 14, the spectral structure of potential modes can be revealed by the SFD algorithm. Similarly, the detected center frequencies and the boundary frequencies are marked by the red solid squares and the blue dashed lines, respectively. The SFD algorithm separates the raw signal into five modes. Figure 15 shows the values of the Gini index of five modes. The fifth mode is the fault-related mode because its value of the Gini index is the highest. Figures 16(a) and 17(a) display the Fourier spectrum and envelope spectrum of the fault-related mode, respectively. As shown in Figure 17(a), the fault characteristic frequency
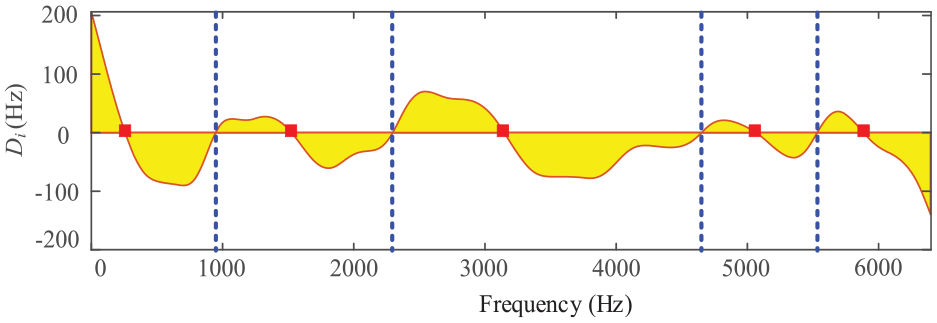
Spectral structure diagram of bearing signal with rolling element fault.
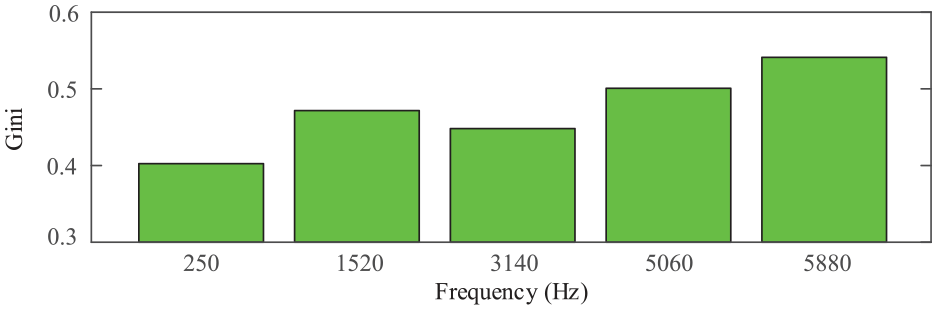
The value of Gini corresponding to modes with detected center frequencies in Case 2.
Fourier spectra and Kutrogram of bearing signal with rolling element fault decoupled by (a) Proposed method, (b) SVMD, (c) EMD, (d) fast Kurtogram, (e) REMD, and (f) RLMD.
Envelope spectra of fault-related mode in Case 2 obtained by (a) Proposed method, (b) SVMD, (c) EMD, (d) fast Kurtogram, (e) REMD, and (f) RLMD.
For comparison purposes, the SVMD, EMD, fast Kurtogram, REMD, and RLMD methods are applied to process the faulty signal. The Fourier spectra and Kurtogram obtained by five comparative methods are shown in Figure 16(b) to (f). Moreover, the envelope spectra of the fault-related mode extracted by comparative methods are displayed in Figure 17(b) to (f). The bearing signal with rolling element fault is decoupled into seven modes by the SVMD method. The fault-related mode is underdecomposition. There is no sign of fault characteristic frequency in Figure 17(b). The analysis results indicate that the SVMD method fails to extract fault features. Furthermore, the EMD method is deeply troubled by the mode mixing problem in Figure 16(c). Meanwhile, the fault features cannot be displayed in Figure 17(c). Besides, the bandwidth and CF of the optimal frequency band obtained by analyzing the faulty signal with the fast Kurtogram method are 400 and 1800 Hz, which are completely inconsistent with the detection results of the proposed SFIVM method. The fault characteristic frequency cannot be observed from the envelope spectrum. Moreover, the REMD method shows the failure performance of extracting the fault features due to no sign of fault-related information in Figure 17(e). The Fourier spectrum of modes obtained by the RLMD method and the envelope spectrum of the fault-related mode are shown in Figures 16(f) and 17(f), respectively. As displayed in Figure 16(f), the first mode obtained by the RLMD method covers the vast frequency band. Thus, the fault-related mode is under-decomposition, and no signs of fault features can be observed in the envelope spectrum. In summary, the above analysis results confirm that the performance of these comparing methods is inferior to the proposed SFIVM method in extracting bearing fault features.
Case 3: Experimental verifications on an inner-race faulty bearing
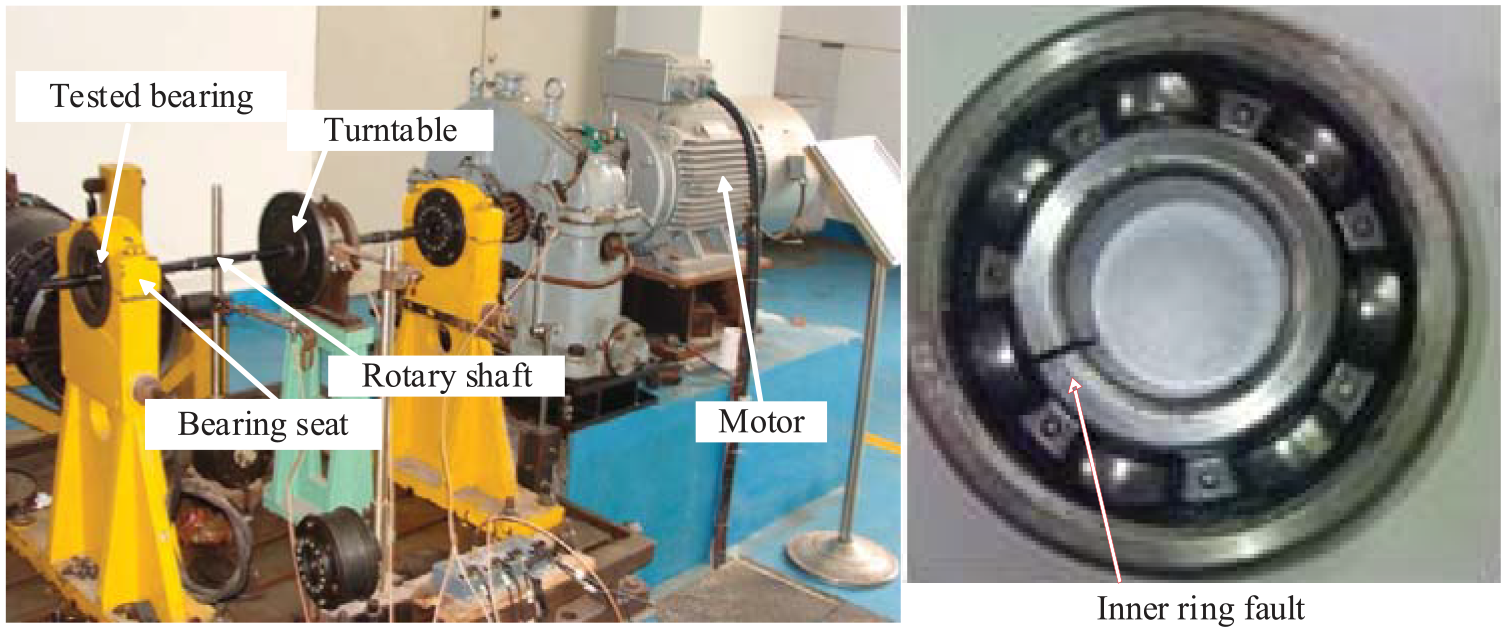
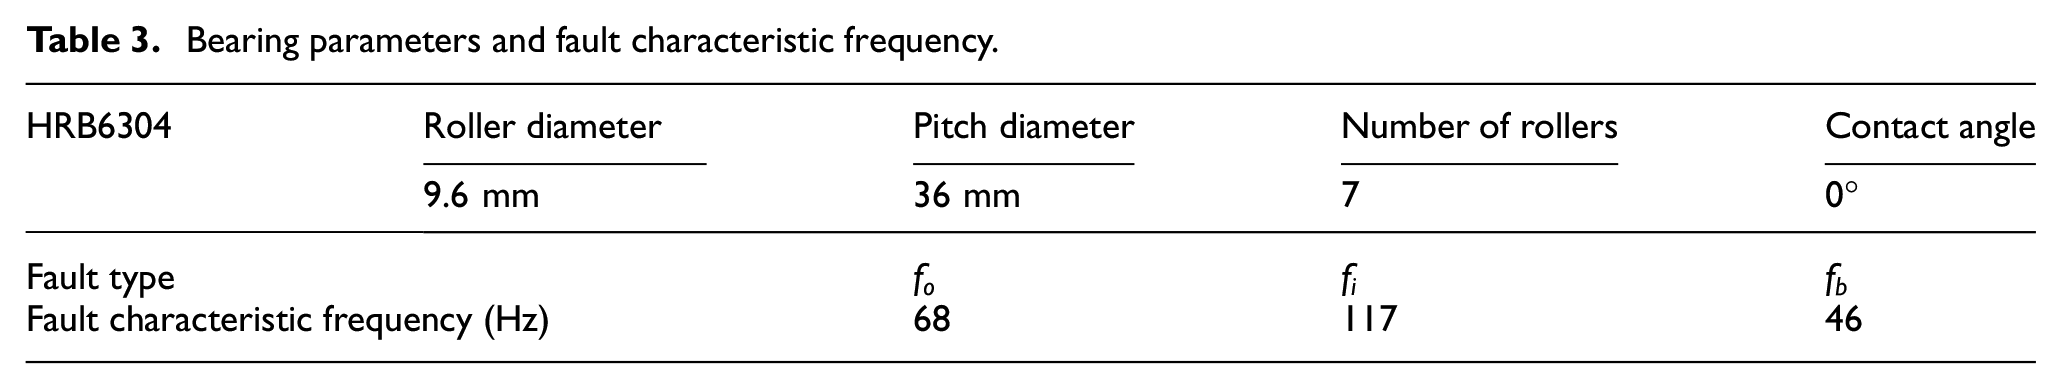
In this case, the bearing signal with an inner-race fault is analyzed to demonstrate the effectiveness of the proposed SFIVM method. The faulty signal is collected in a rotor rolling bearing test bed, which is designed and manufactured by Shenyang Aeroengine Design and Research Institute.43,44 As shown in Figure 18, the test bed is mainly comprised of a mounting stand, a base platform, a motor, a turn table, and a gear drive system. The tested bearing is the HRB6304 bearing. The rotating speed of the shaft is 1583 rpm. Moreover, the geometric parameters of the tested bearing and three types of fault characteristic frequency are listed in Table 3. The sampling frequency is 10 kHz, and the sampling time is 0.8192 s. Figure 19(a) to (c) displays the time waveform, Fourier spectrum, and envelope spectrum of the bearing signal with inner-race fault. The fault-related features are hardly identified from the raw signal.
Bearing parameters and fault characteristic frequency.
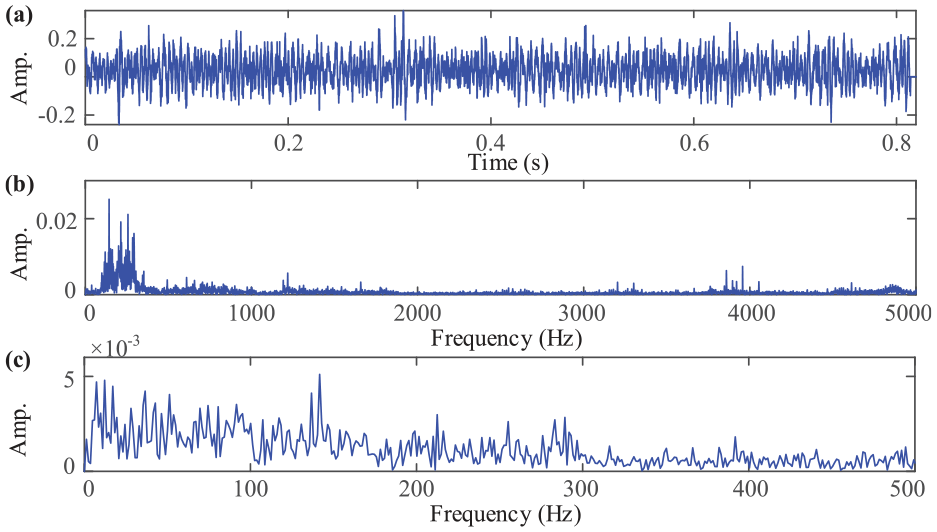
Bearing signal with inner-race fault: (a) time waveform, (b) Fourier spectrum, and (c) envelope spectrum.
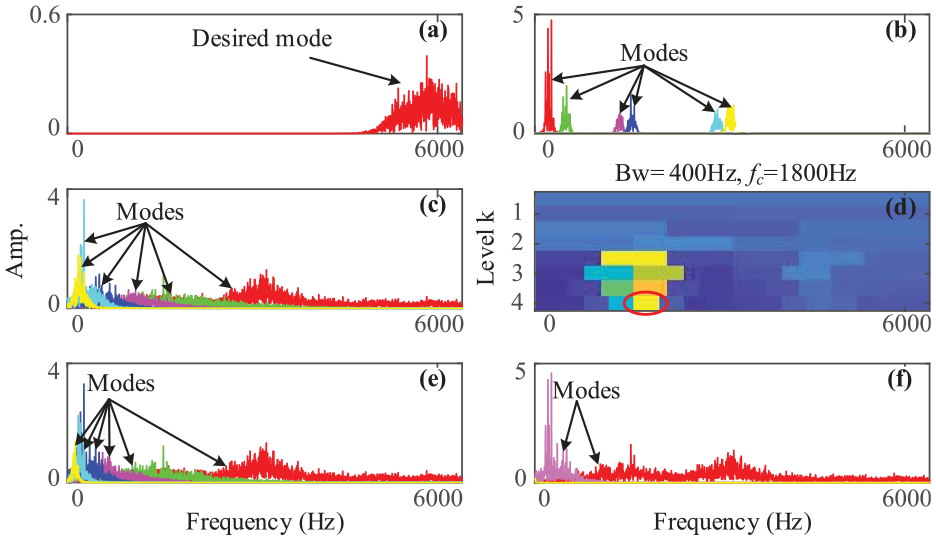
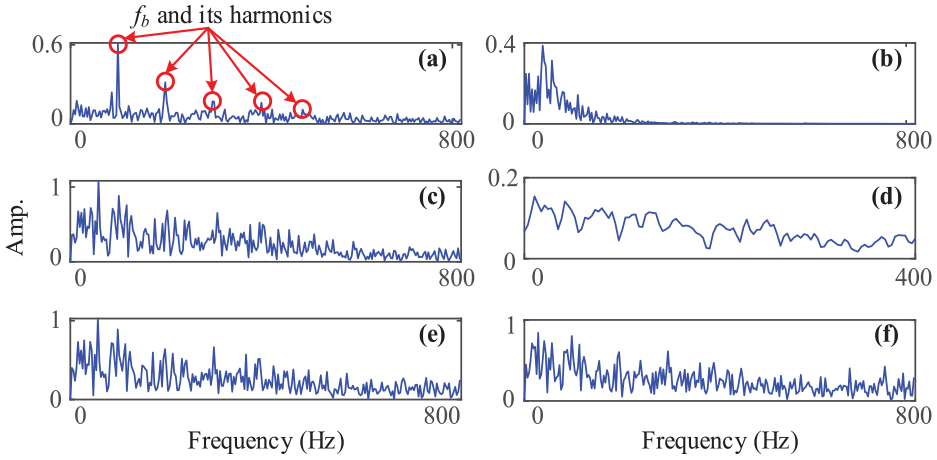
Subsequently, the proposed SFIVM method is used to analyze the bearing signal with inner-race fault. The spectral structure of potential modes is revealed by the SFD algorithm in Figure 20. The SFD algorithm separates the experimental signal into six modes. As shown in Figure 21, the fault-related mode corresponding to the highest value of Gini index is the sixth mode. Figures 22(a) and 23(a) exhibit the Fourier spectrum and envelope spectrum of the fault-related mode, respectively. As displayed in Figure 23(a), the fault characteristic frequency
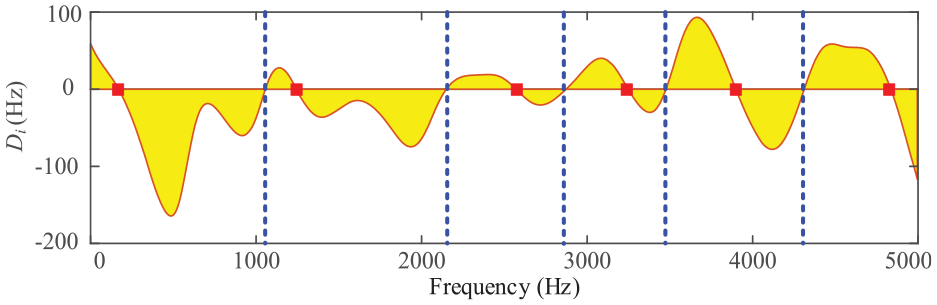
Spectral structure diagram of bearing signal with inner-race fault.
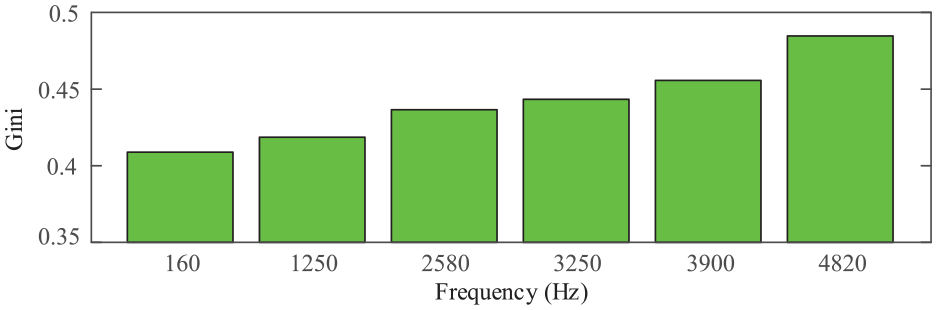
The value of Gini corresponding to modes with detected center frequencies in Case 3.
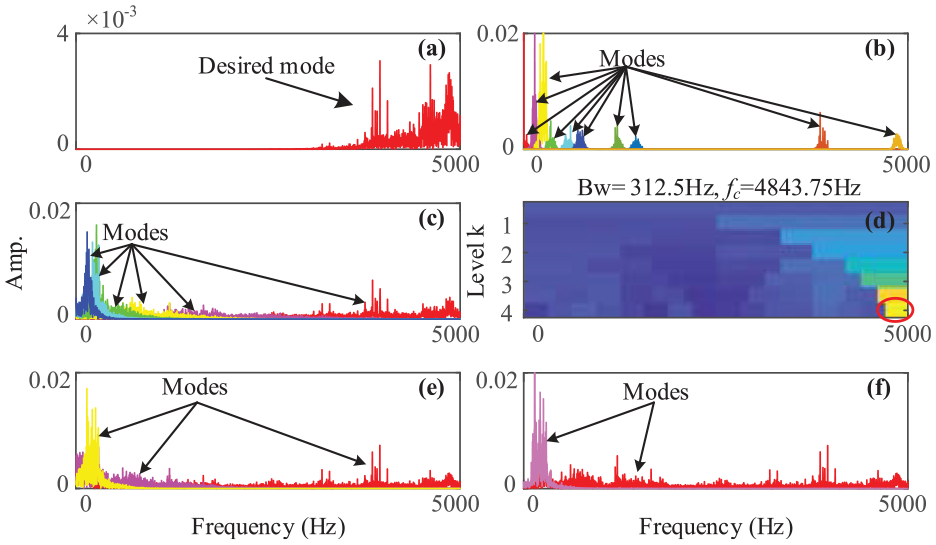
Fourier spectra and Kutrogram of bearing signal with inner-race fault decoupled by (a) Proposed method, (b) SVMD, (c) EMD, (d) fast Kurtogram, (e) REMD, and (f) RLMD.
Envelope spectra of the fault-related mode in Case 3 obtained by (a) Proposed method, (b) SVMD, (c) EMD, (d) fast Kurtogram, (e) REMD, and (f) RLMD.
For comparison, the five technologies, including SVMD, EMD, fast Kurtogram, REMD, and RLMD methods, are utilized to analyze the bearing signal with inner-race fault. Figure 22(b) to (f) show the Fourier spectra and Kutrogram obtained by five comparative methods. Meanwhile, the envelope spectra of the fault-related mode are displayed in Figure 23(b) to (f). The SVMD method obtains 10 modes by decomposing the experimental signal. The fault-related information cannot be observed in the envelope spectrum. The analysis results of the EMD method are shown in Figures 22(c) and 23(c). As shown in Figure 23(c), only
Discussion
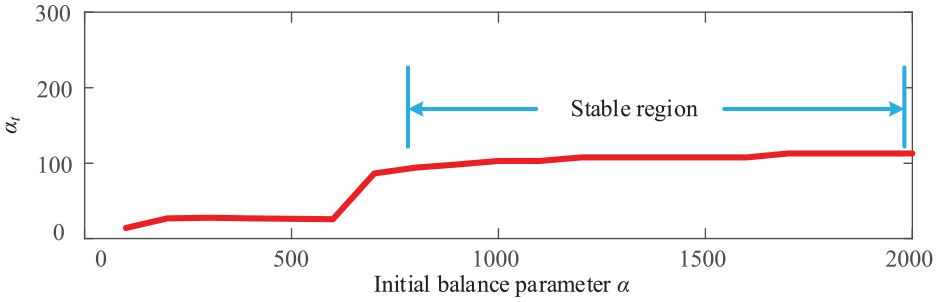
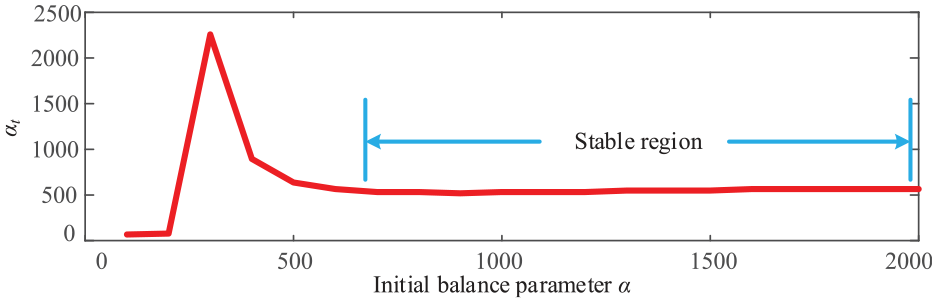
In this section, the stability of the SFD algorithm mentioned in section “Spectral feature detector” will be verified with three cases used in this paper. The relationship between the initial balance parameter in the SFD algorithm and the target balance parameter for three cases is investigated by using the balance parameter estimation formula. The curves of the relationship between initial balance parameter and target balance parameter in three cases are displayed in Figures 24 to 26. The curves indicate that target balance parameter gradually converges to smooth as the initial balance parameter increases. The reason is that the bandwidth of the desired mode determined by spectral features is always constant or fluctuates within a small range when the value of the initial balance parameter increases. Therefore, the stability of the SFD algorithm is verified, and it is rational that the initial balance parameter is determined to be 1000 in this study.
The relationship between initial balance parameter and target balance parameter in Case 1.
The relationship between initial balance parameter and target balance parameter in Case 2.
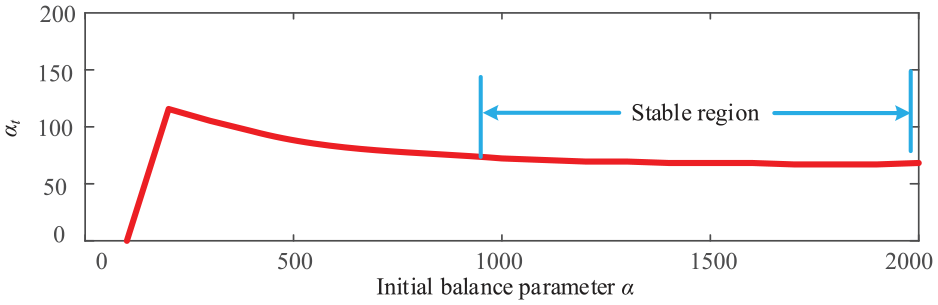
The relationship between initial balance parameter and target balance parameter in Case 3.
Moreover, the running time of all methods used in three cases is computed to validate the efficiency of the proposed SFIVM method. All methods are performed on the uniform running environment, namely, MATLAB R2020a (Mathworks Inc., MA, USA) platform on a Windows 10 system with 3.40 GHz Intel Core, i5-7500 CPU, and 16.0 GB RAM. Table 4 lists the running time of the proposed method, SVMD, EMD, fast Kurtogram, REMD, and RLMD. The results indicate that the proposed method has the same order as the fast Kurtogram, REMD, and RLMD. The proposed method takes less time than the SVMD and EMD. To sum up, the proposed SFIVM method has high efficiency.
The running time of all methods in simulated and two experimental cases.
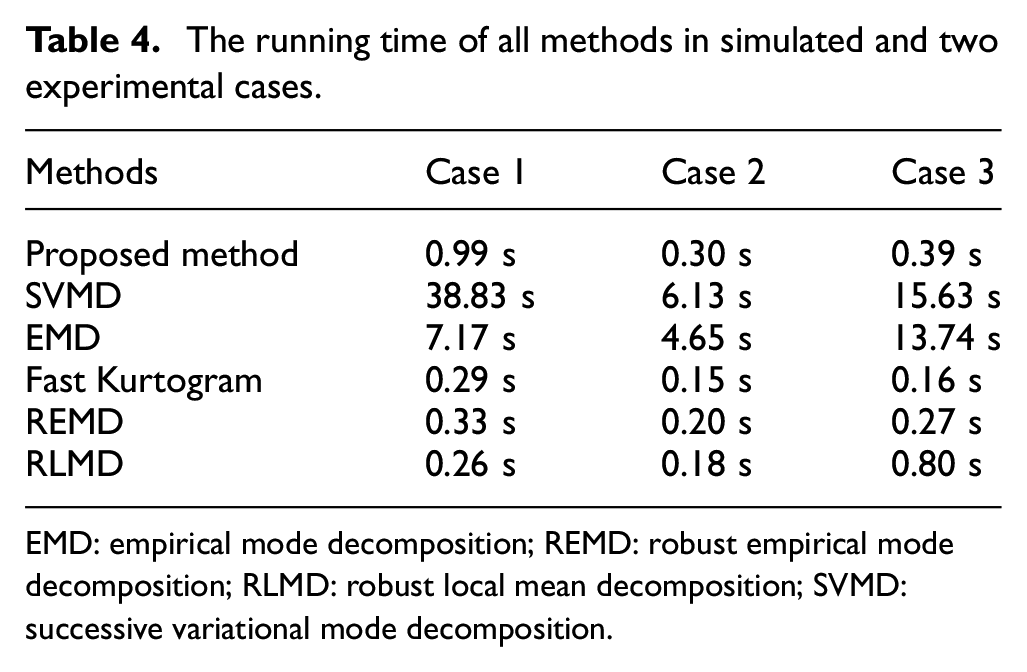
EMD: empirical mode decomposition; REMD: robust empirical mode decomposition; RLMD: robust local mean decomposition; SVMD: successive variational mode decomposition.
Conclusion
This study proposes an SFIVM method with full self-adaptation to realize the bearing fault diagnosis, which overcomes the limitations that the performance of the original VME is subject to the predefining of initial parameters. The proposed SFIVM method can effectively and efficiently extract the fault-related mode from the raw signal without prior knowledge. Specifically, the SFD algorithm is constructed to obtain spectral features, including detected center frequencies and boundary frequencies. Then, a balance parameter estimation formula is designed to adaptively determine the optimal balance parameter guided by spectral features. Finally, the SFIVM method for bearing fault diagnosis is proposed to extract fault features. The performance of the proposed SFIVM method is demonstrated to be effective by a simulated and two experimental cases. Furthermore, the comparing results with some classical and advanced methods indicate that the proposed SFIVM method is superior and efficient. In industrial scenarios, there are some benefits offered by the proposed SFIVM method with full self-adaptation. For example, by autonomously adjusting its parameters based on the characteristics of analysis signal, the proposed SFIVM method removes the need for manual tuning. Besides, when the analysis signal is complicated, setting initial parameters manually may lead to improper parameters and failure of fault diagnosis. Therefore, the proposed SFIVM method can improve the accuracy of fault diagnosis. In addition, the fault diagnosis system developed based on the proposed SFIVM method with full adaptation will become more intelligent, automated, and efficient.
Although the proposed SFIVM is effective for the bearing fault diagnosis in this paper, some issues need to be further explored in our future study. In practical engineering, the bearings may contain multi-faults.45–48 When employing the proposed SFIVM to decouple more complex signals, it is feasible to analyze some modes with high values of Gini index to improve the practicality in compound faults diagnosis. Simultaneously, investigating more precise evaluation index of fault information can improve the accuracy of fault diagnosis. These methodological improvements are essential to extend the practical application of SFIVM to diagnose compound faults or multi-faults.
Footnotes
Declaration of conflicting interests
The author(s) declared no potential conflicts of interest with respect to the research, authorship, and/or publication of this article.
Funding
The author(s) disclosed receipt of the following financial support for the research, authorship, and/or publication of this article: This research presented in this paper is funded by the National Natural Science Foundation of China (Grant Nos. 52172406, 52275157), China Postdoctoral Science Foundation (Grant Nos. 2022T150552, 2021M702752), which are highly appreciated by the authors.