
Abstract
Due to the complexity of the spatial surface of the twisted blade of the aero-engine, there are occlusions and shadows between the blades, resulting in visual blind spots. This causes the loss of certain information in the deformation measurement of twisted blade. A deformation measurement method of rotating twisted blades based on multi-vision overlapping area feature registration is proposed. It aims to solve the problem of limited field of view (FOV) in the deformation measurement of twisted blade, and overcome the problems of small measurement range and difficult measurement of traditional contact sensor method in the rotating state of the blade. First, a calibration and image-matching method based on multi-vision digital image correlation method is proposed. Under the premise of ensuring the simultaneous calibration of multi-vision camera stereo calibration, the matching of image detection points on the twisted blade surface is realized. Second, a three-dimensional reconstruction method based on the feature registration of the overlapping area of the FOV is proposed. It is used to solve the problem that the traditional image stitching method is prone to mismatching and to provide complete point cloud information for the deformation field calculation. Finally, the strain of each point is solved by piecewise point-by-point fitting of the local subdomains of the discrete displacement data, which suppresses the amplification of noise and improves the accuracy of blade strain calculation. In this paper, the deformation measurement experiment is carried out for the rotating twisted blade (up to 6000 rpm). The experimental results show that the proposed method can achieve a displacement measurement accuracy of 5 μm and the strain measurement accuracy of 50 με. This method can provide an important guarantee for the accurate evaluation and safe operation of the key performance parameters of the engine.
Keywords
Introduction
As the aviation industry advances, the demand for blades has grown as well.1–4 In high-speed and complex operational scenarios, aero-engine blades experience intricate 3D deformations due to the influence of centrifugal forces,5,6 leading to problems such as vibrations, noise, and other related faults. According to statistics, 20% of engine failures are caused by blade rubbing.7–9 This necessitates heightened efficiency in blade monitoring, addressing the demands of on-site measurements. This holds significant importance in ensuring engine safety and bolstering influence in the aviation sector.10–12 Presently, the measurement of blade deformation during rotation is hindered by the intricate nature of blade deformation in dynamic states and the challenges associated with sensor placement. Furthermore, complex rotating twisted blade surfaces frequently give rise to occlusion and shadowing phenomena, constricting the measurement field of view (FOV) and yielding imprecise results. Consequently, resolving the intricate trade-off between measurement accuracy and range is a pressing challenge. This challenge arises within the domain of complex blade deformation analysis.
Recent advancements in vision-based measurement technologies have provided innovative solutions to engineering challenges, particularly in high-precision and noncontact measurement scenarios. Hu et al. 13 developed a 3D vision-based robot for structural crack detection, demonstrating broader applications in structural health monitoring. Tang et al.14,15 introduced a novel visual crack width measurement technique using backbone double-scale features, significantly enhancing detection precision. In addition, the integration of digital image correlation (DIC) with binocular vision yields 3D-DIC measurement methods, offering distinct benefits for quantifying 3D object surface deformations.16–19 Leveraging noncontact, non-destructive techniques, and high precision, 3D-DIC has gained extensive traction in practical engineering applications.20–22 Particularly within the domain of structural material health monitoring and non-destructive evaluation, 3D-DIC technology finds application in tracking the deformation response of specimens during testing.23–25 In the deformation measurement of rotating machinery, Sousa et al.26,27 measured the displacement and strain fields of RC helicopter rotor blades under dynamic loads caused by rotation at 680 rpm by laser-triggered 3D-DIC technology. Dong et al. 28 realizes the pressure and deformation measurement of the ALIGN TREX 450L helicopter with a speed of 1800 rpm by integrating the single-life pressure sensitive paint (PSP) method with 3D-DIC. It mainly emphasizes the application of the DIC speckle pattern PSP architecture. The challenge regarding alignment between the world coordinate system and helicopter’s rotational axis is not solved. Tania et al. 29 employed 3D-DIC for fan blade deformation measurement, and the blade under test reached a maximum continuous thrust of 4650 rpm. Throughout the measurement procedure, the stereo camera system remained stationary on the ground, situated in front of the left engine. Critical time lag is adjusted according to the engine speed, and the ground test of fan blade deformation is finally completed. In literature,30,31 3D-DIC technology is applied to the health diagnosis of wind turbine blades and marine propeller blades respectively, and the dynamic measurement is realized. Ye et al. 32 employed 3D-DIC technology for displacement and strain field measurements on rotating fan blades. Findings indicate method stability, with a proposed matching strategy exhibiting a correction accuracy of ±0.0075 pixels. For aero-engine large twist angle fan blades, the deformation measurement using the above binocular DIC method has the problem of limited FOV, and the method still has limitations.
Orteu 33 introduced the pioneering multi-camera DIC system. One camera in the system is designated as the main camera, and together with other cameras, it forms a set of 3D-DIC subsystems, which can be utilized for comprehensive topography and displacement measurements across the entire field. However, the FOV of the main camera within the system dictates the overall FOV, which not only improves the measurement accuracy but also limits the effective measurement area. Leblanc et al. 34 proposed to complete the deformation measurement of large blades of wind turbines by moving a 3D-DIC measuring system. The deformation field of each shooting area is calculated separately, and finally, the full surface measurement of the blade is completed through data splicing. However, the limitation of this method is that it can only perform static measurements. Genovese et al. 35 employed one camera with rotating mechanism to simulate a multi-camera measuring system, enabling high-precision measurements of a cylinder’s 360° deformation. Multi-view images were acquired by systematically repositioning the one camera at specific angular locations using a slewing bearing, which requires stringent control of the rotation angle. From 2015 to 2017, Malesa and Malowani et al.36–38 proposed two camera placement methods with and without field overlap between multi-cameras in view of the field limitation problem in the detection of large industrial facilities by binocular DIC system. Chen et al.39,40 utilized multi-camera DIC to investigate dynamic response at temperatures as high as 1200°C, but there was at least 50% overlap between adjacent cameras, requiring a large number of cameras. Chen and Dai et al.41,42 investigated a multi-camera DIC system, built the eight-camera full-cycle dynamic deformation measurement system, and carried out the compression test on the Basalt Fiber Reinforced Polymer (BFRP) material wrapped concrete column. In addition, the team built a four-camera measurement system, completed the measurement of the three-dimensional topography of the complex oral impression surface, obtained a more complete three-dimensional topography, and solved the problem of self-occlusion and shadow inside the alveolar.
Complex spatially twisted blade profiles are the development trend of aero-engine fan blades. Due to the occlusion of the blade surface and the limitation of the FOV, the detection of blade surface deformation is not comprehensive, which makes the evaluation of key performance parameters of aero-engine and the design optimization of blade parameters inaccurate. Currently, in the deformation measurement of rotating twisted aero-engine blades, single-camera systems or traditional strain gauge methods fail to provide comprehensive coverage, limiting the ability to capture the entire deformation profile of the blades during high-speed rotation. This limitation is particularly problematic for twisted blades experiencing complex strain distributions, as incomplete deformation data hinders accurate performance assessment. The lack of comprehensive understanding of blade deformation under operational stresses makes accurate behavior prediction challenging, potentially leading to suboptimal performance since engineers may not fully understand the strain limits and failure points of the blades. Therefore, it is crucial to develop advanced measurement techniques that overcome the FOV limitations to provide a comprehensive understanding of blade deformation. This paper proposes a rotating twisted blade deformation measurement method based on multi-vision overlapping area feature registration to solve the problem of limited FOV. And overcome the limited measuring points and sensor limitations of traditional contact sensor methods in the rotating state. High-precision full-field deformation measurement of the blade surface is achieved. The innovations of this paper include the following three aspects:
A calibration and image-matching method based on the multi-vision DIC is proposed. The goal is to address the issues with the tedious process of traditional camera calibration under multi-vision. The method ensures the simultaneity of multi-camera stereo calibration and achieves high-precision matching of twisted blade surface images.
A three-dimensional reconstruction method based on feature registration in overlapping areas is proposed. It aims to solve the problem of mismatching in traditional image-splicing methods. This method provides complete point cloud data for calculating the three-dimensional deformation field on twisted blades’ surfaces.
By sequentially performing piecewise point-by-point fitting on the local subdomains of the discrete displacement data, the strain at each point on the blade surface is solved. This approach helps in suppressing noise amplification and enhancing the accuracy of twisted blade strain calculation.
Measurement method
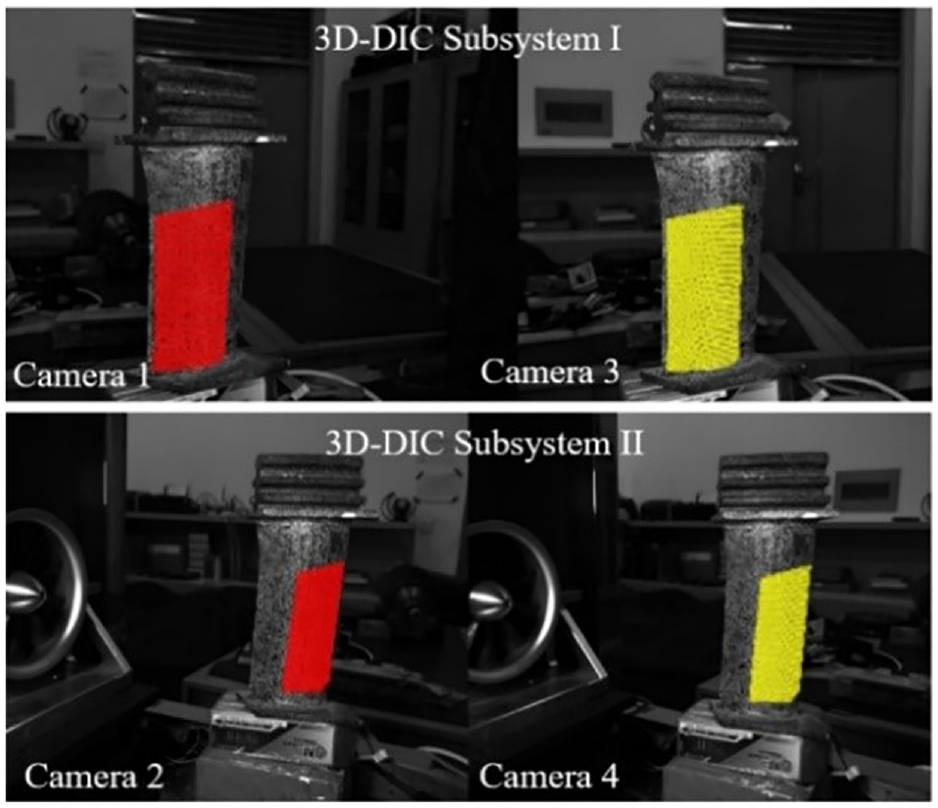
The deformation measurement system comprises four cameras. The system includes two 3D-DIC subsystems, each of which is composed of two cameras. Each subsystem simultaneously photographs the rotating twisted blade surface from different angles and measures the measured blade surface locally. Several cameras are controlled via the hardware trigger device to synchronously collect the image of the target object. These images are then combined with DIC technology and feature registration to perform 3D reconstruction of these detection points within the specified region. Further calculation can obtain the surface deformation information of the object to be measured. Figure 1 shows the multi-vision DIC rotating twisted blade deformation measurement system.
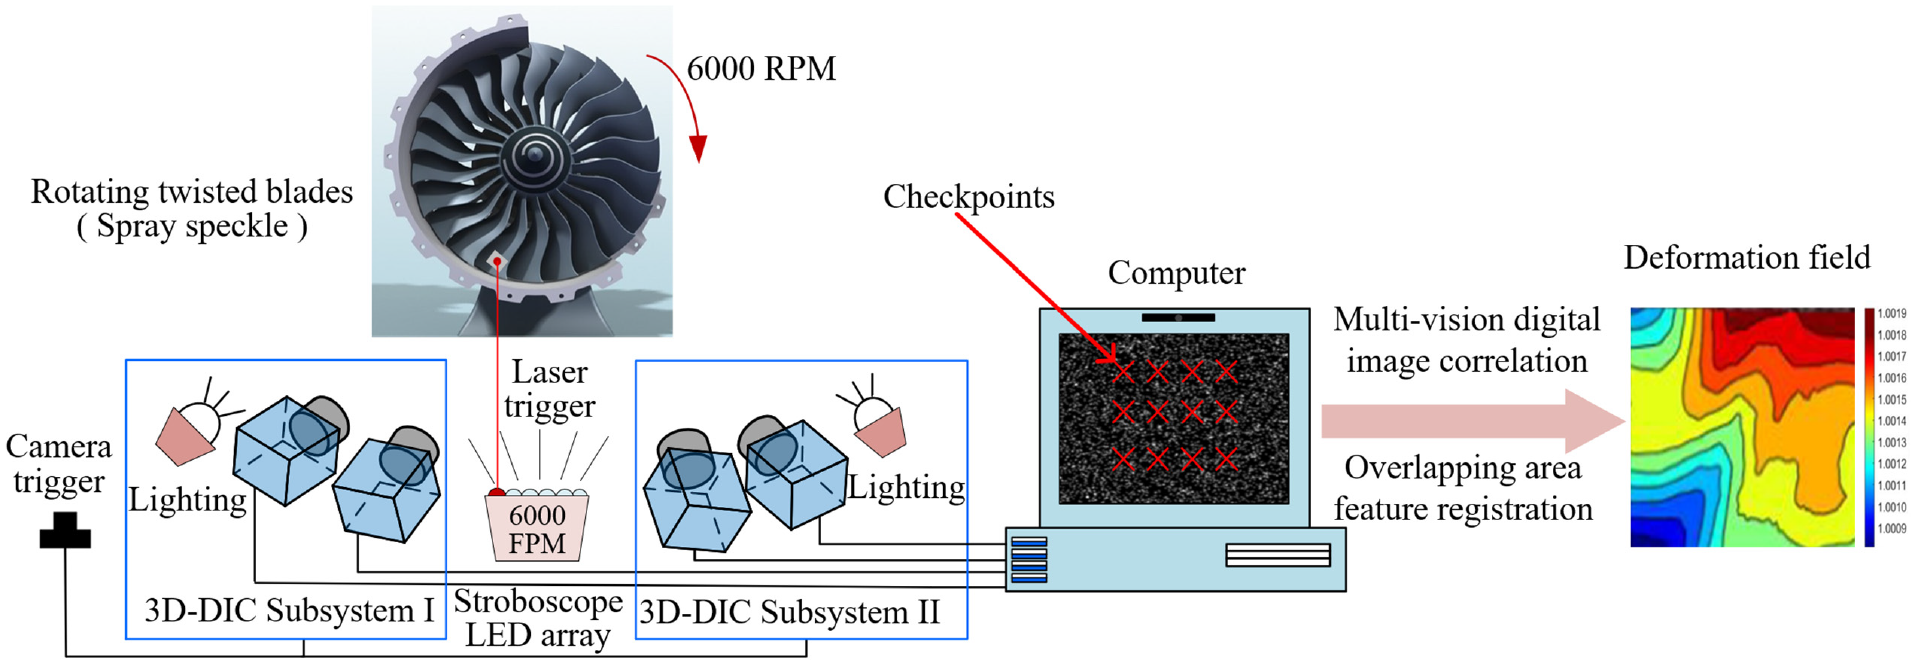
Multi-vision digital image correlation rotating twisted blade deformation measurement system.
Multi-vision DIC method
The flow chart of the multi-vision DIC method is shown in Figure 2, which includes simultaneous calibration of multiple cameras and high-precision matching of twisted blade speckle images. Among these, system calibration is the prerequisite for image matching. The traditional Zhang Zhengyou method can only calibrate two cameras at the same time, and the calibration process for multi-camera is cumbersome. This paper considers the pose relationship between each camera and the world coordinate system and calculates its corresponding translation matrix so that multiple cameras are unified into a measurement system as a whole. This method can achieve simultaneous calibration among multiple cameras and simplify the calibration process. The process of image matching before and after deformation is performed using the DIC method. Based on the initial value of the least squares detection point search, sub-pixel iteration is performed to obtain the accurate value. At the same time, a reliable point guidance-parallel matching strategy is introduced to achieve high-precision matching.
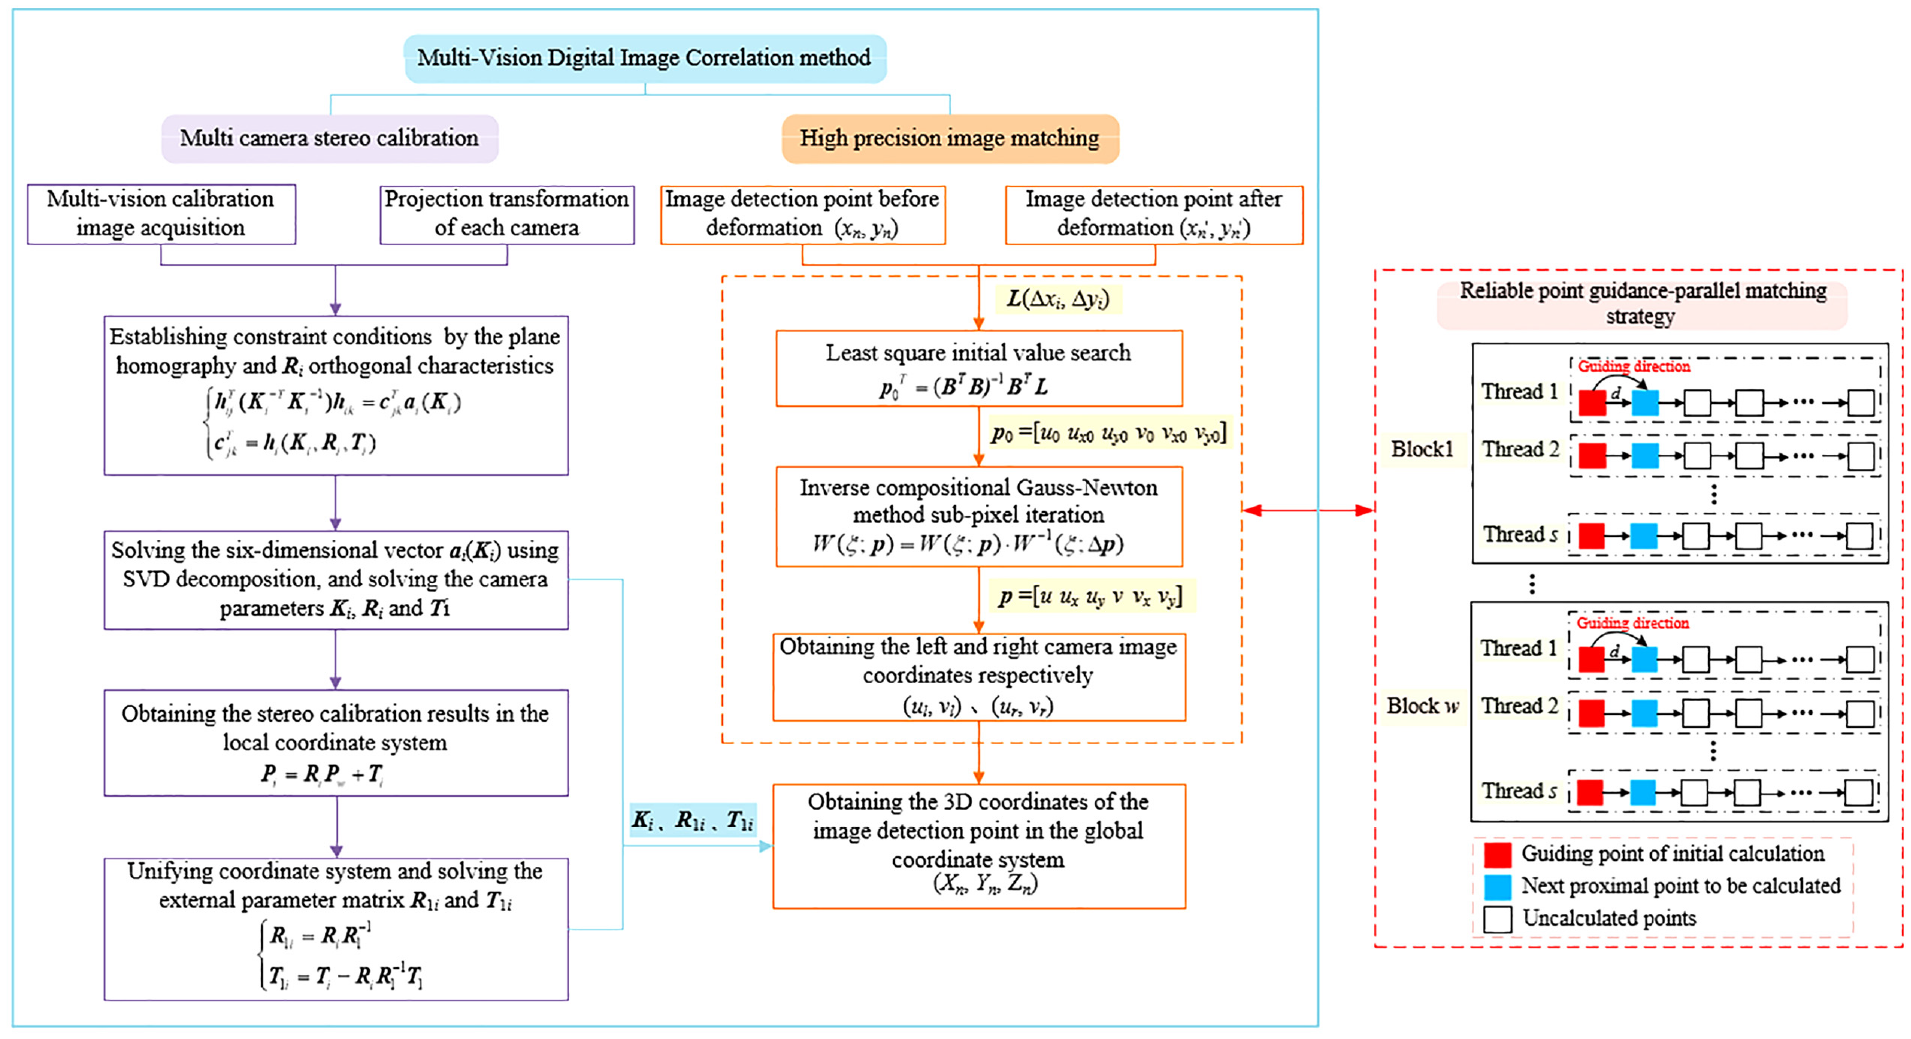
The flow chart of the multi-vision digital image correlation method.
As shown in the red dotted box on the far right side of Figure 2. The basic principle of the reliable point guidance-parallel matching strategy is to obtain the precise value (u, v) of the first guidance point (redpoint) based on sub-pixel iteration. Next, use the information of this point in the deformation subregion as the next neighbor reliable initial value estimates (u0, v0) of the point (blue point). Then, transmits reliable initial value estimates to surrounding points in turn. In addition, it divides the detection points on each blade image into w blocks, and each block contains s threads. Parallel matching of image detection points. Both block and thread execute the matching process according to the GPU parallel operation mode, while each thread executes according to the CPU serial mode guided by reliable points. In this way, only the least squares initial value calculation is needed for the first guidance point of each thread. At the same time, according to the displacement guidance strategy, the occurrence of mismatching points can be greatly reduced.
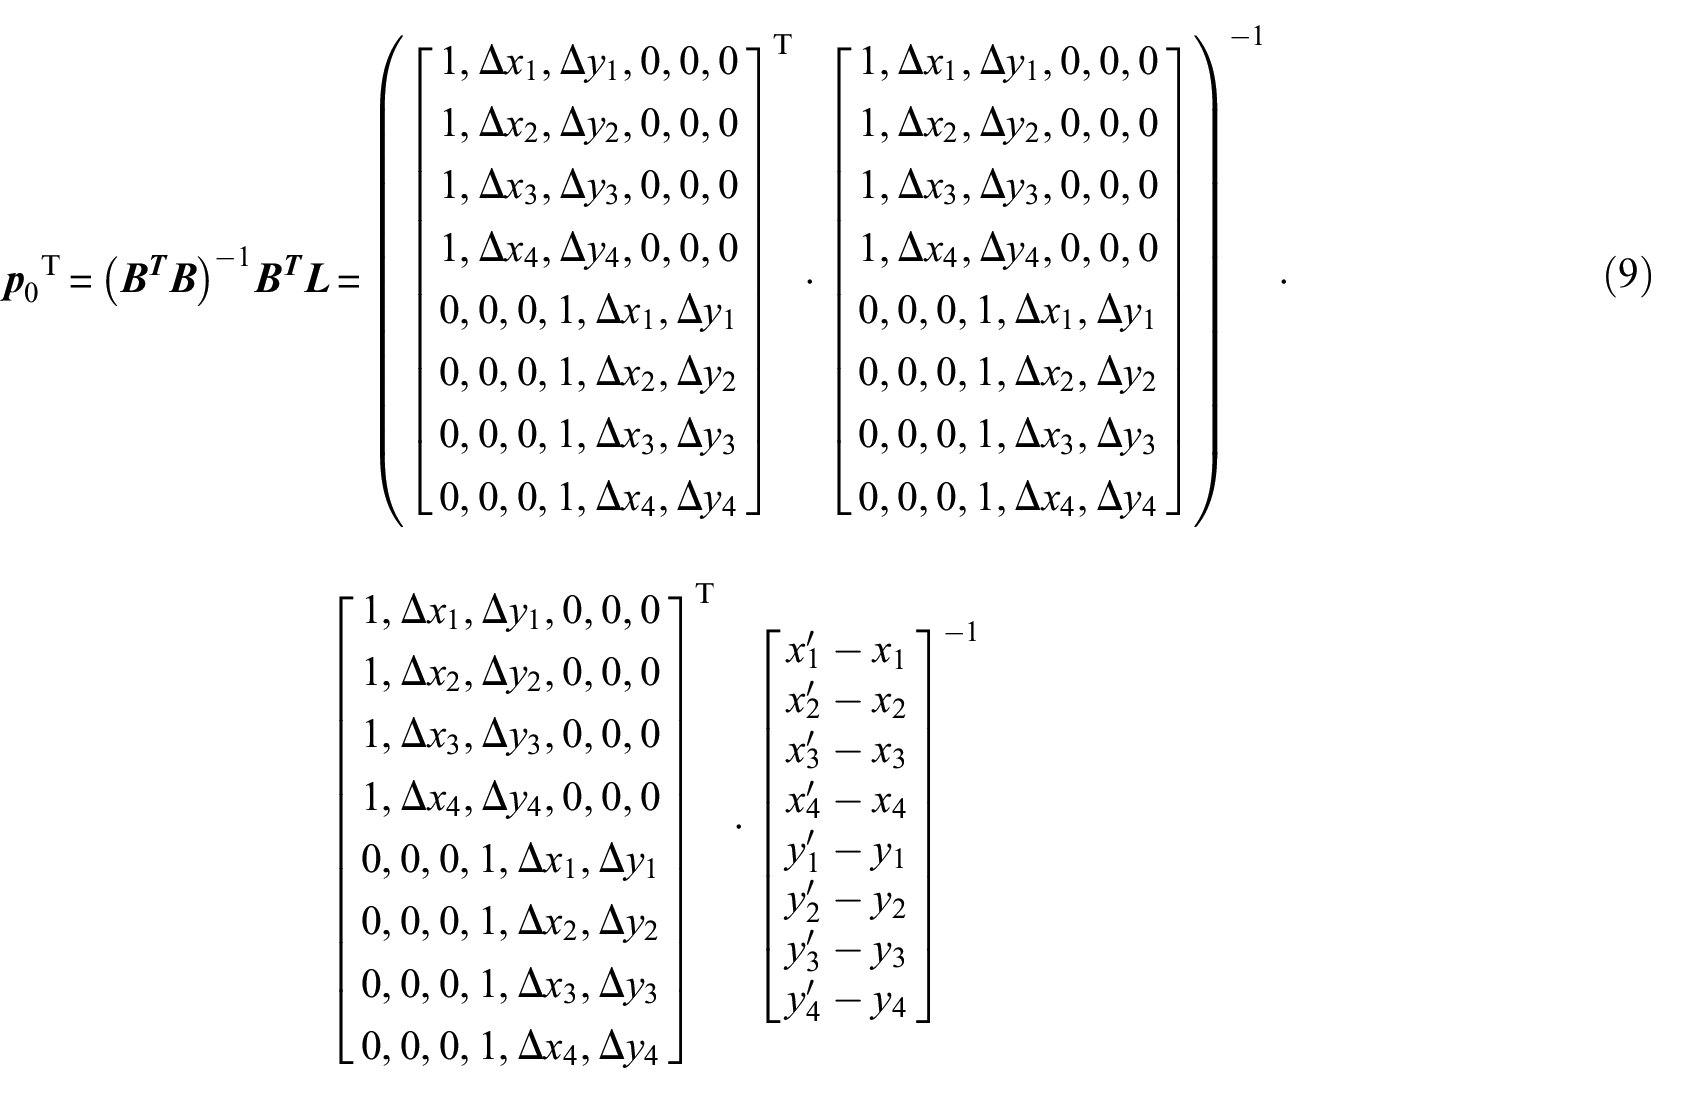
Multi-camera stereo calibration
Taking into account

Establish the first camera’s coordinate system as the global frame and calculate

The solution of
Establish constraint equations such as Equation (4) based on plane homography and the orthogonal characteristics of the rotation matrix
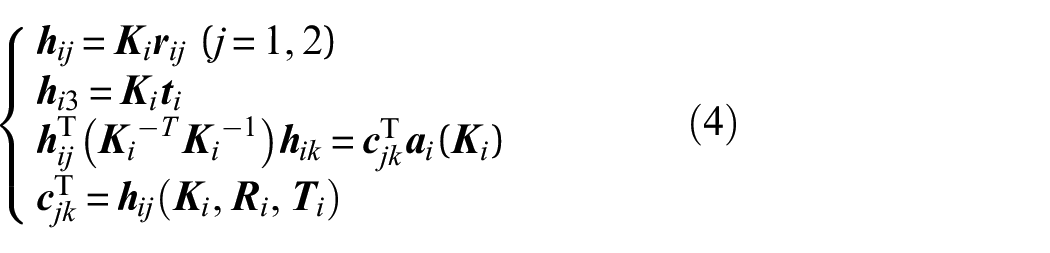
Among them,

The six-dimensional vector
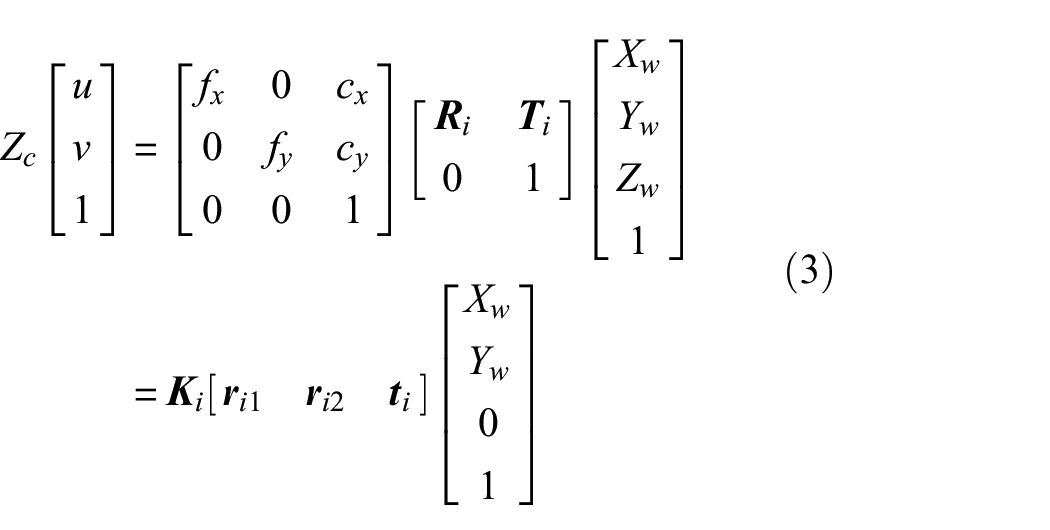
According to Equation (2), the external parameter matrix
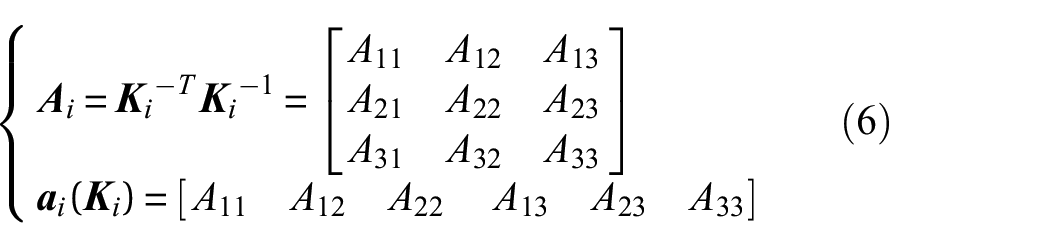
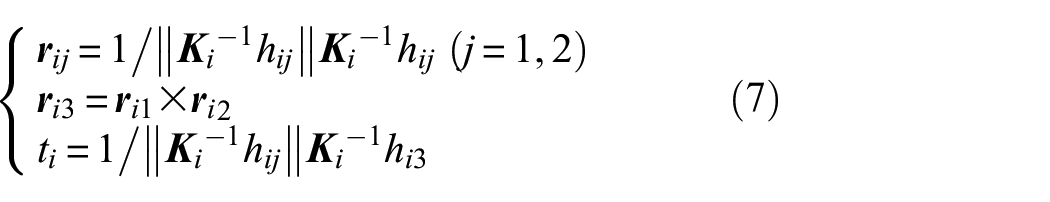
Multi-camera stereo calibration quality is assessed through global reprojection error and the outcomes of 3D reconstruction. The root mean square error value rRMSE of all camera reprojection errors is defined as the global reprojection error. The global reprojection error calculation is as follows:
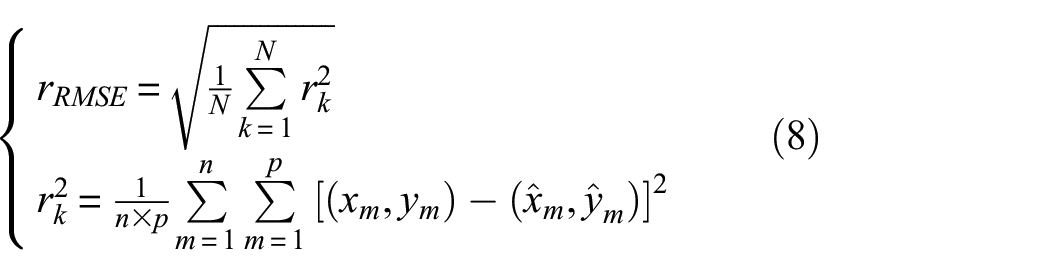
In this context, where N represents the count of cameras, n denotes the number of pictures captured by each camera, p signifies the number of corners per picture,
Figure 3 illustrates the schematic representation of the stereo calibration’s calibration quality outcomes. Figure 3(a) is the average reprojection error of each camera, which is below 0.04 pixels. This level of error is typically used to assess the precision and stability of camera calibration, impacting the accuracy of subsequent displacement measurements. Figure 3(b) is the 3D reconstruction error of 15 checkerboard corners. The mean error of 3D reconstruction of 15 checkerboard images is 0.04 mm. Therefore, the calibration method presented in this study streamlines the calibration procedure, enhancing calibration efficiency while upholding calibration quality.
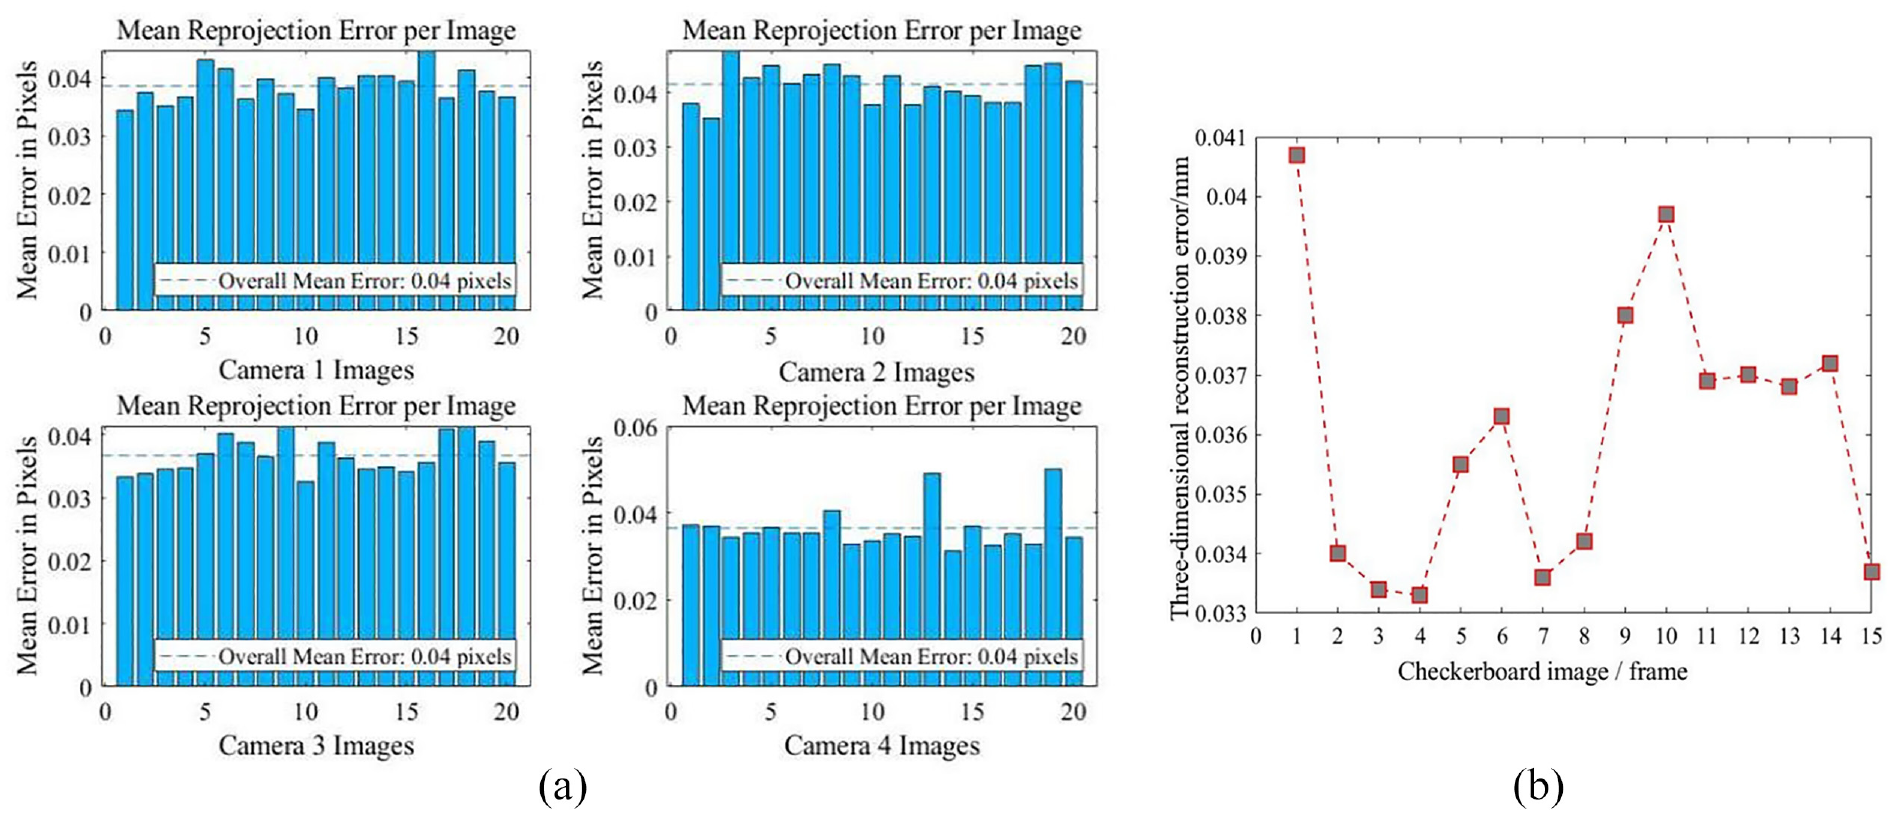
Schematic representation of the stereo calibration’s calibration quality outcomes: (a) the average reprojection error of each camera and (b) 3D reconstruction error of 15 checkerboard corners.
High-precision image matching
High-precision matching of image detection points before and after rotating twisted blade deformation is achieved by DIC and reliable point guidance-parallel matching strategy, as shown in the orange part of the flow chart in Figure 2. The form of the first-order deformation can be represented by the vector
The sub-pixel iterative algorithm based on matching initial values is a nonlinear local iterative optimization algorithm. Its convergence depends to a large extent on the accuracy of the initial value (u0,v0) of the detection point. Only when the initial guess is reasonably close to the true value can it be ensured. The algorithm converges correctly and quickly. Therefore, this paper introduces a reliable point guidance-parallel matching strategy based on the Inverse compositional Gauss-Newton (ICGN)
43
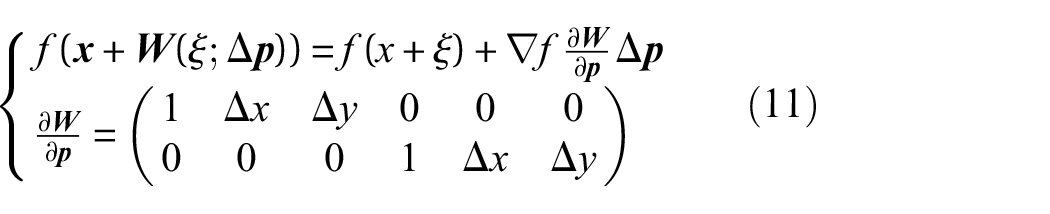
algorithm. Zero-mean Normalized Sum of Squared Difference (ZNSSD) correlation function is used to determine the similarity between images in ICGN. During each iteration, the independent variable increment Δ
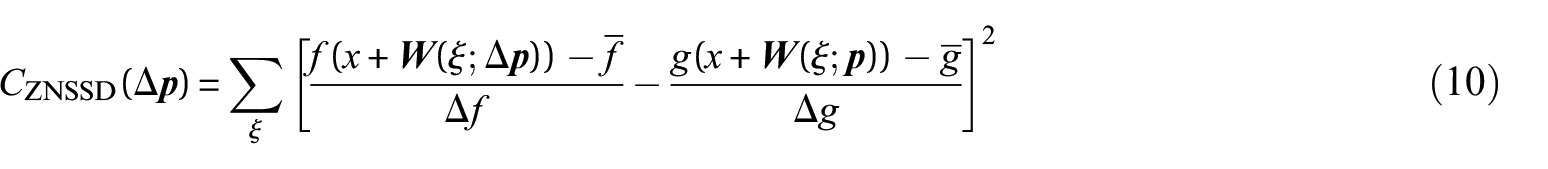
where f(x) and g(x) represent images of gray information. f(x) is expressed in the shape function form as shown in Equation (11).
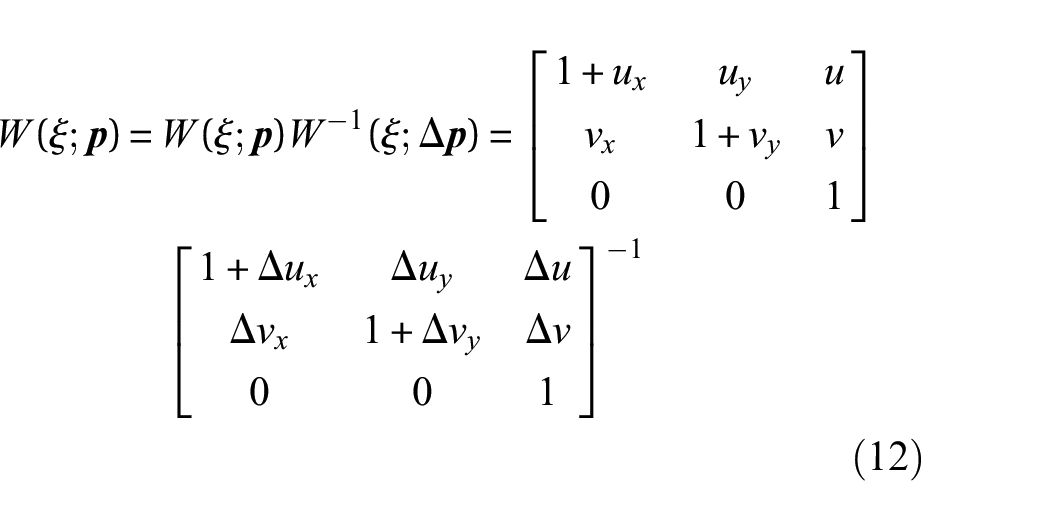
When using the DIC method for multi-vision image matching, the timing matching uses the ICGN sub-pixel iterative algorithm, and the stereo matching uses the ICGN 2 sub-pixel iterative algorithm. 44 And ICGN 2 can further reduce the sub-pixel calculation error during multi-vision camera stereo matching by introducing a second-order shape function.
To evaluate the accuracy and stability of our image-matching algorithm, this paper conducted simulation tests using standard speckle deformation images. These standardized images enable us to precisely quantify the algorithm’s matching accuracy and stability, thus providing robust validation. Specifically, five sets of 513 × 513 simulated Gaussian speckle images were generated using the open-source software “Light Painting.” 45 The displacement values ranged uniformly from u = v = 0.1 pixels to u = v = 0.5 pixels. The image center (257, 257) served as the reference point, with nine detection points distributed at 30-pixel intervals. The image-matching algorithm detected the displacement values at these detection points, calculated their mean values, and determined the absolute deviation from the set values. The results for the horizontal and vertical directions are presented in Tables 1 and 2, respectively.
Comparison of horizontal accuracy (unit: pixel).
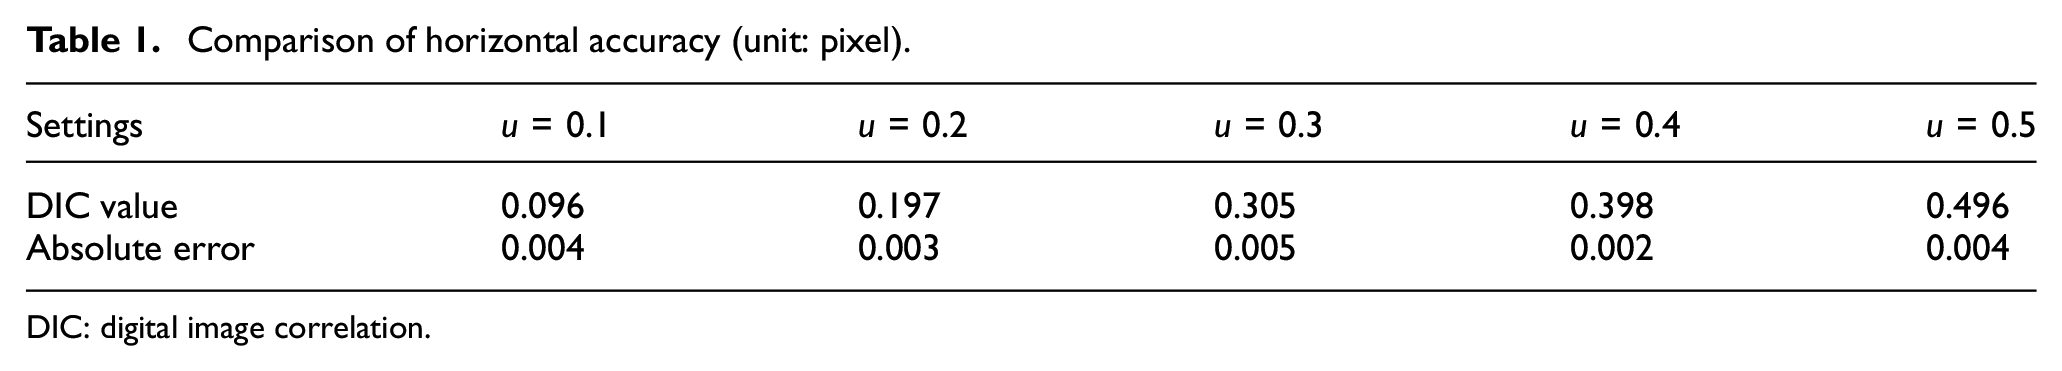
DIC: digital image correlation.
Comparison of vertical accuracy (unit: pixel).
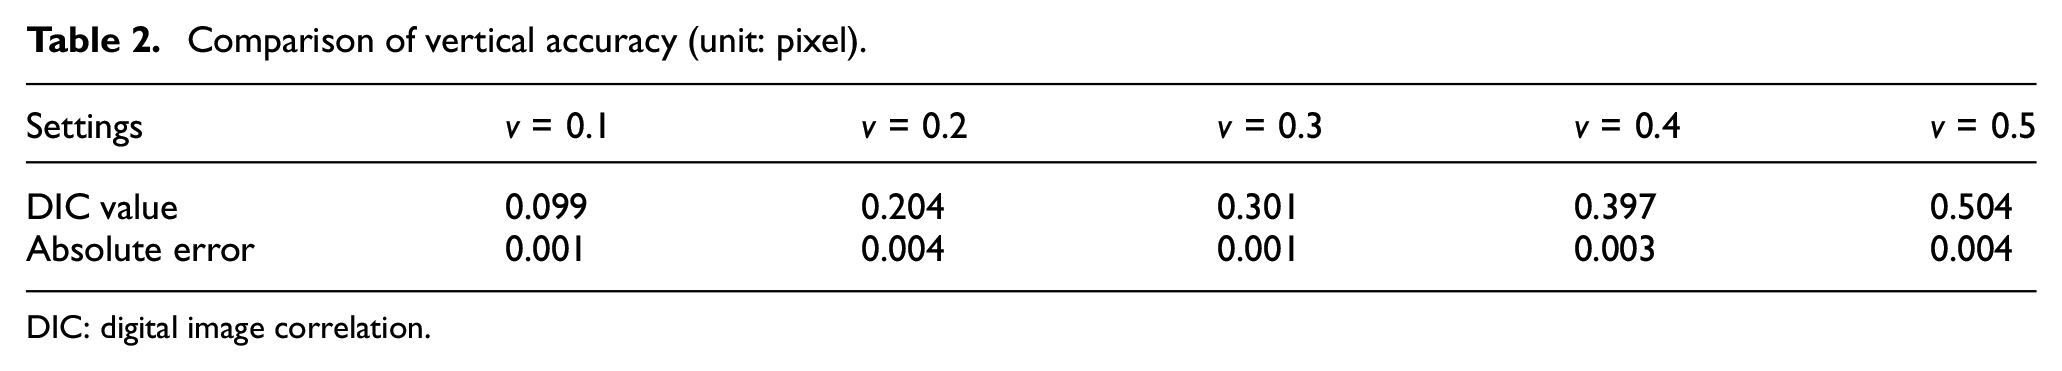
DIC: digital image correlation.
It is evident that the absolute error in the simulated speckle displacement calculation using the proposed high-precision image-matching algorithm remains within 0.01 pixels in both directions, with minimal variation in the results.
Overlapping area feature registration 3D reconstruction method
The three-dimensional reconstruction of detection points within the FOV’s overlapping region is crucial for computing the comprehensive blade surface deformation field. Due to the blade surface significant twist angles, the 3D reconstruction method based on image stitching is prone to mismatching, and the calculation error of directly stitching the blade face 3D data obtained by two sets of subsystems is large. The final image stitching effect accuracy is low. Therefore, the twisted blades point cloud datasets PIe and PIIe in 3D-DIC subsystem I and subsystem II were obtained by the method “Multi-vision digital image correlation method.” Then, the FOV overlapping area feature registration technology is used to perform a three-dimensional reconstruction of the twisted blade. Figure 4 shows a three-dimensional reconstruction method based on overlapping area feature registration.
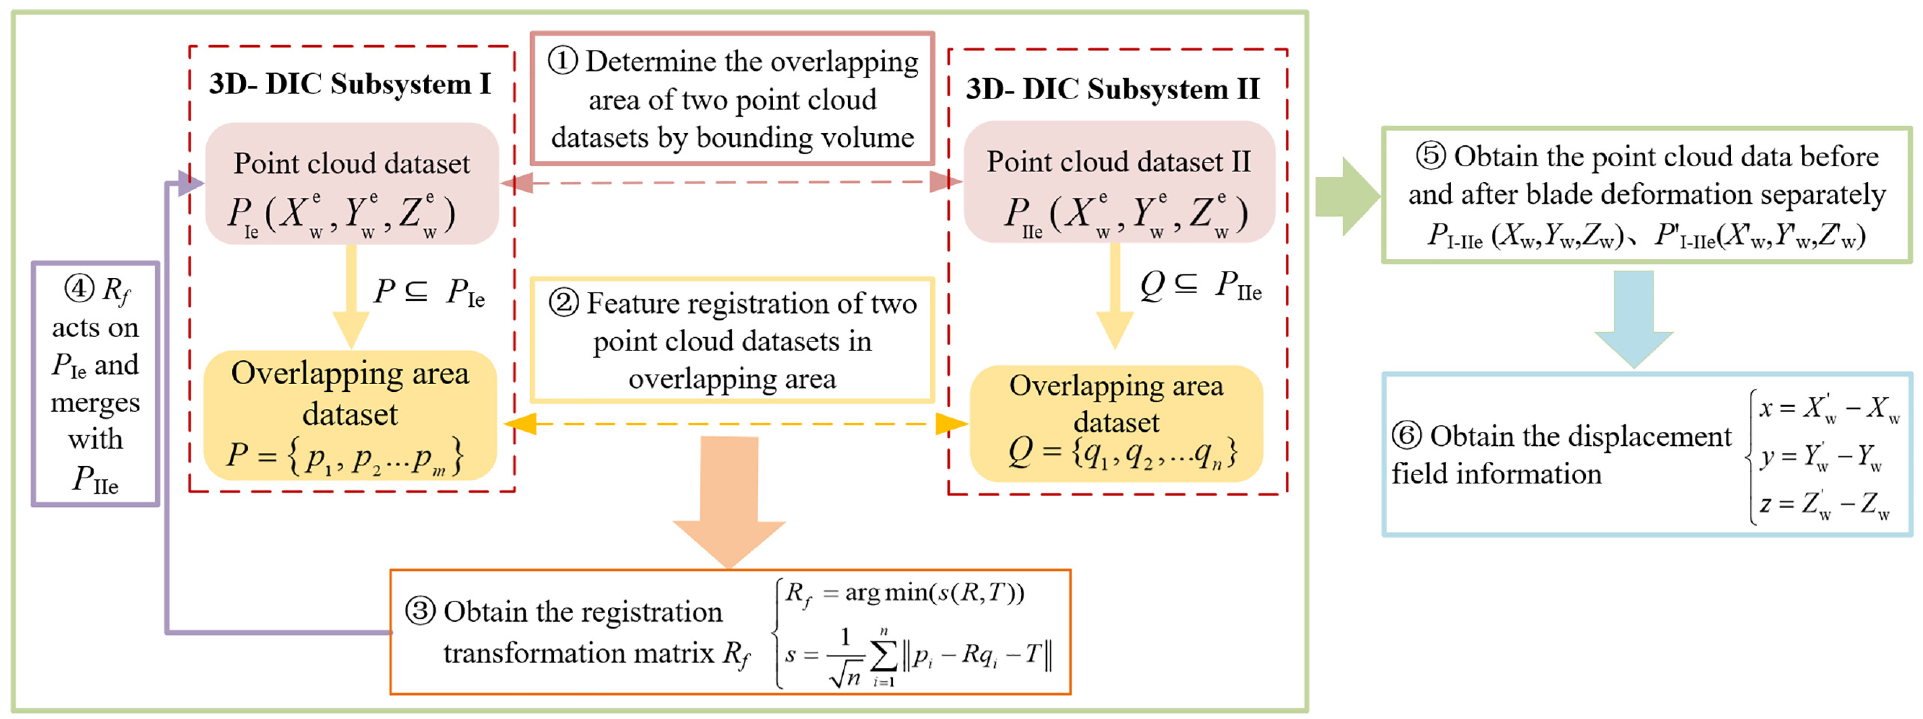
Three-dimensional reconstruction method based on overlapping area feature registration.
The following are the specific steps of overlapping area feature registration 3D reconstruction method.
① First, determine the overlapping area of the two sets of twisted blade point cloud datasets PIe and PIIe. That is, the corresponding point cloud datasets are searched point by point through the bounding volume algorithm and used as their respective subsets. The point cloud datasets within the overlapping area are respectively P = {p1,p2···pm} and Q = {q1,q2···qn}, and P ⊆ PIe, Q ⊆ PIIe.
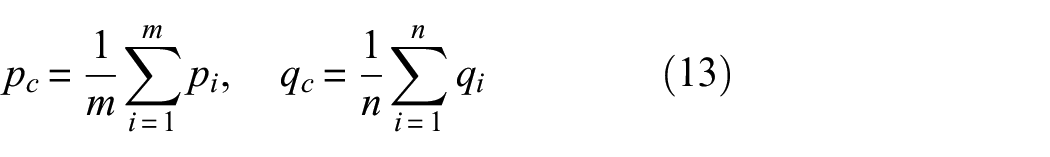
② Feature registration is used to process two sets of point cloud datasets P and Q of the overlapping area of the twisted blade under multi-vision. The centroids of the datasets are marked as p
c
and q
c
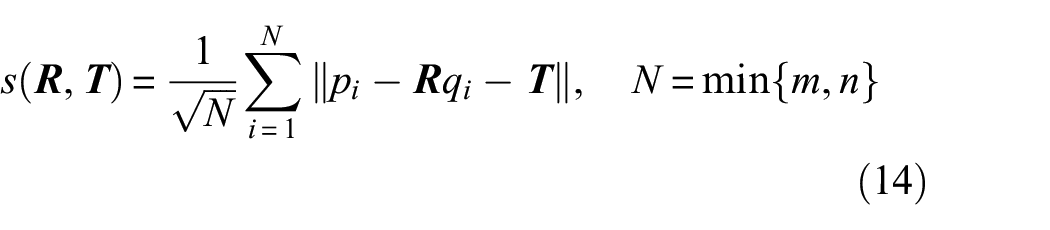
, respectively. Define the objective function in the iterative registration process as s(
③ After repeated iterations, obtain the optimal registration matrix

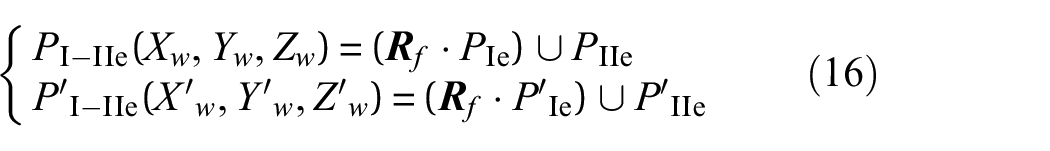
④ R f acts on the blade point cloud datasets PIe of subsystem I, and combines with PIIe.
⑤ Through step ①–④, the complete point cloud datasets PI-IIe 和 PI-IIe′ of the twisted blade surface before and after deformation can be obtained, respectively. Among them, P′Ie and P′IIe represent the point cloud data after the deformation of P'Ie and P'IIe respectively.
⑥ Ultimately, the displacement deformation field information of the twisted blade is solved.
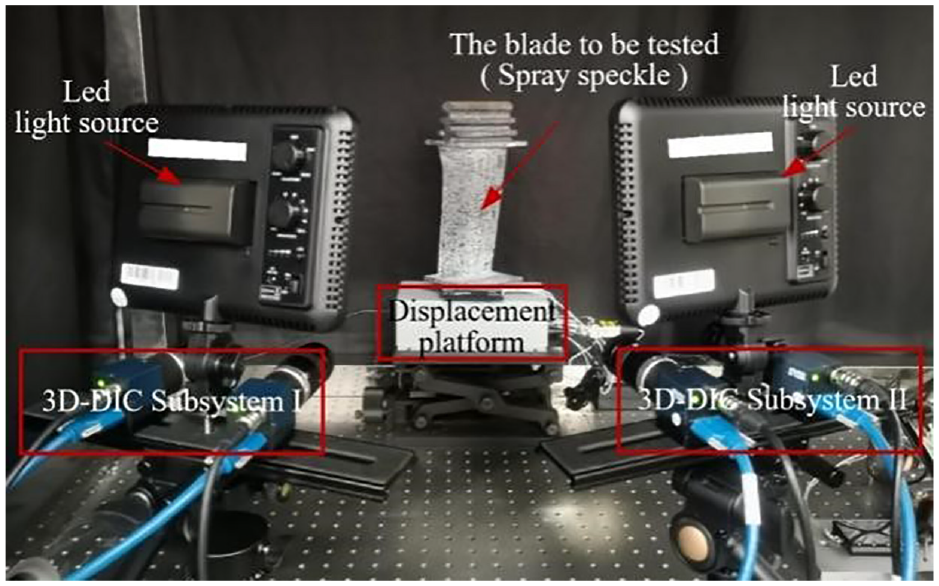
Taking the twisted blade surface as an example, the surface is sprayed with artificial speckles to realize the three-dimensional reconstruction of the detected blade surface detection point. During the experiment, the number of iterations was 100. Figure 5 is the matching result of detection points.
Detection point matching results.
Figure 6 shows the merging of two point cloud datasets before and after feature registration processing. It is evident that the direct fusion of these two sets of point cloud datasets yields a substantial error, and the splicing accuracy after feature registration processing is greatly improved.
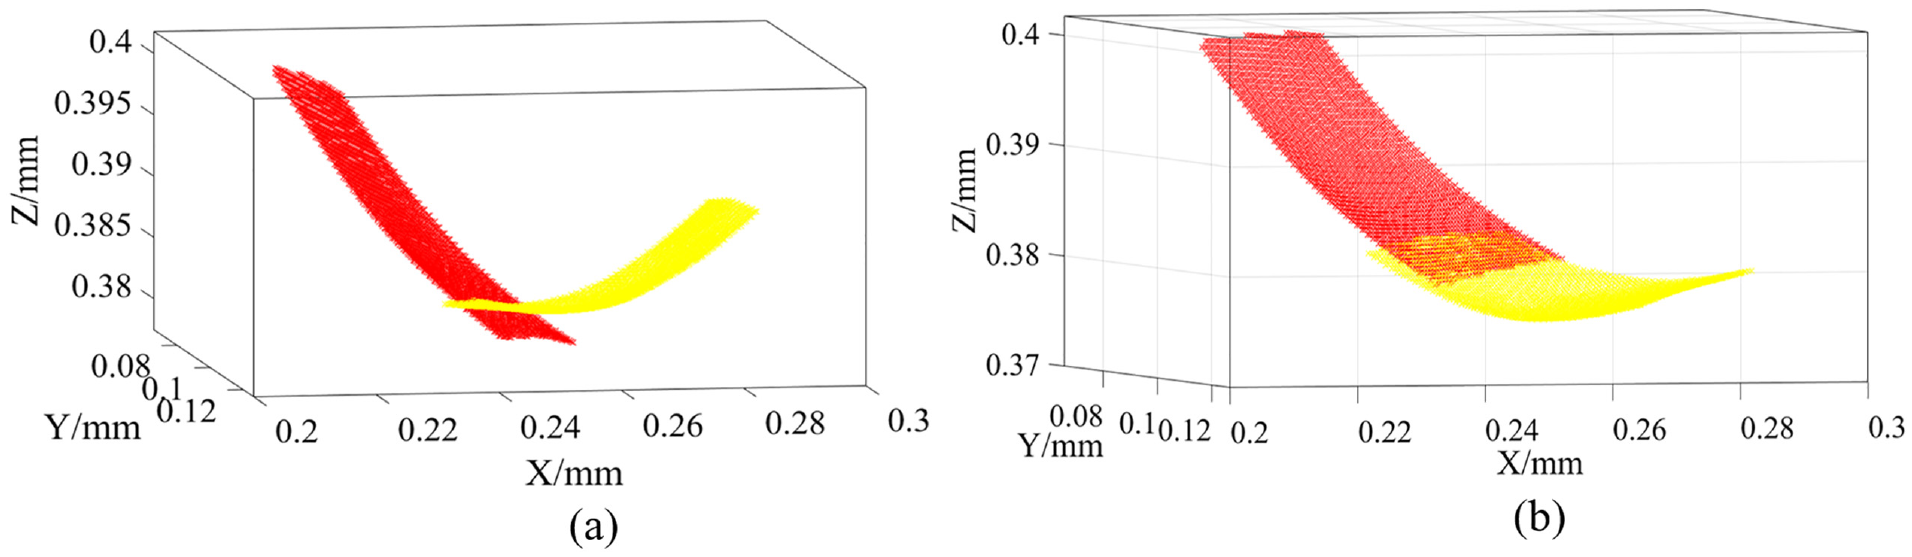
The merging of two point cloud datasets before and after feature registration processing: (a) direct splicing and (b) splicing after feature registration processing.
It should be noted that although subsystem I and subsystem II are uniform in the selection stage of their respective detection point areas after the overlapping area feature registration is completed. However, upon completion of feature registration in the overlapping area, high point cloud density leads to data redundancy. This redundancy significantly impacts the accuracy and computational efficiency of three-dimensional reconstruction for detecting twisted blade surfaces, as shown in Figure 6(b). Managing larger datasets prolongs computational times and affects subsequent steps such as data optimization through techniques like Delaunay triangulation. These optimizations are crucial for ensuring precise reconstruction results, albeit at the cost of increased processing complexity and time.
As illustrated in Figure 7, two datasets are merged. First, redundant data points in the overlapping area are removed iteratively and stitched. That is, Delaunay triangulation is applied between the vertices on the mesh boundary to optimize the minimum triangle angle, ensuring the generation of high-quality triangles.
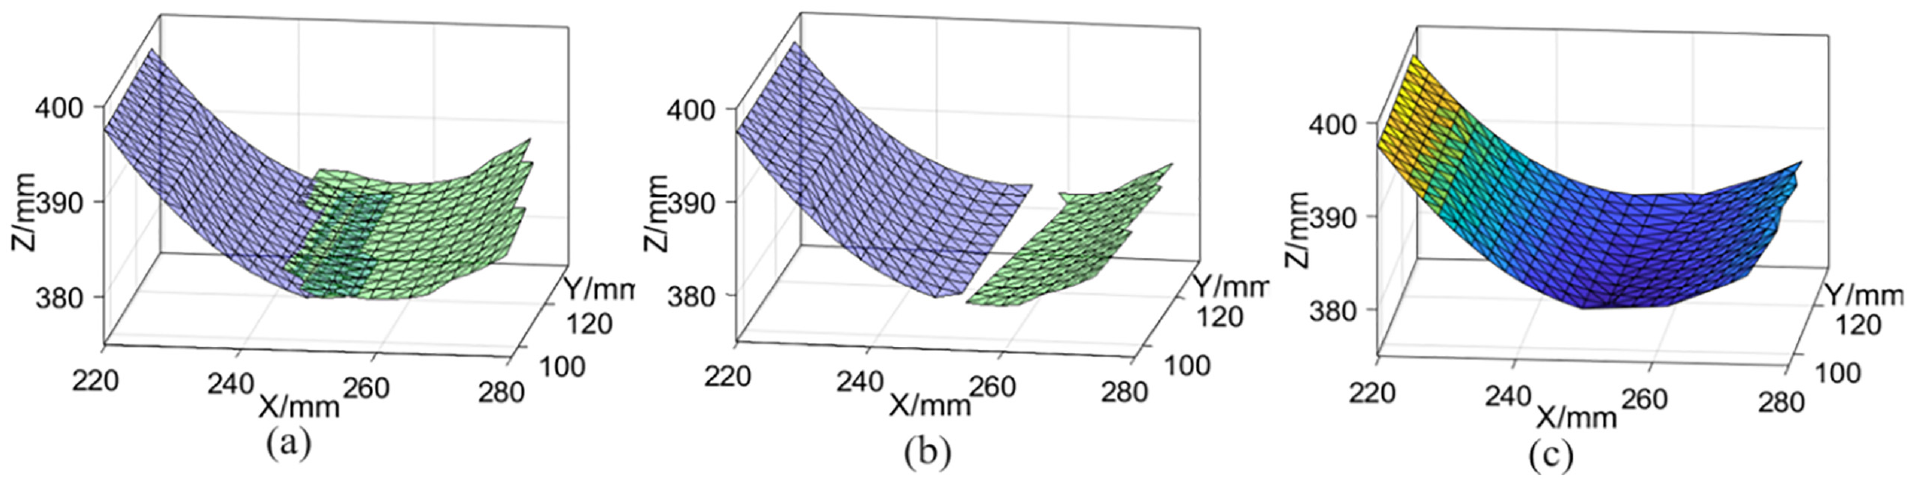
Two point cloud datasets merging diagram: (a) purple and green 3D meshes are three-dimensional reconstructions of two subsystems, (b) identify overlapping areas and remove redundant data points, and (c) Delaunay triangulation using only the original data points and filling the gap with new triangular meshes.
Figure 8 is the result of point cloud datasets post-processing. The twisted blade surface’s 3D reconstruction results acquired via the four-camera DIC measurement system exhibit uniformity and smoothness. The regions 1 and 2 circled in Figure 8 represent the redundant data parts of each of the two concatenated regions, which are related to the initial Region of Interest (ROI) region selection. The article aims to better demonstrate two splicing areas.
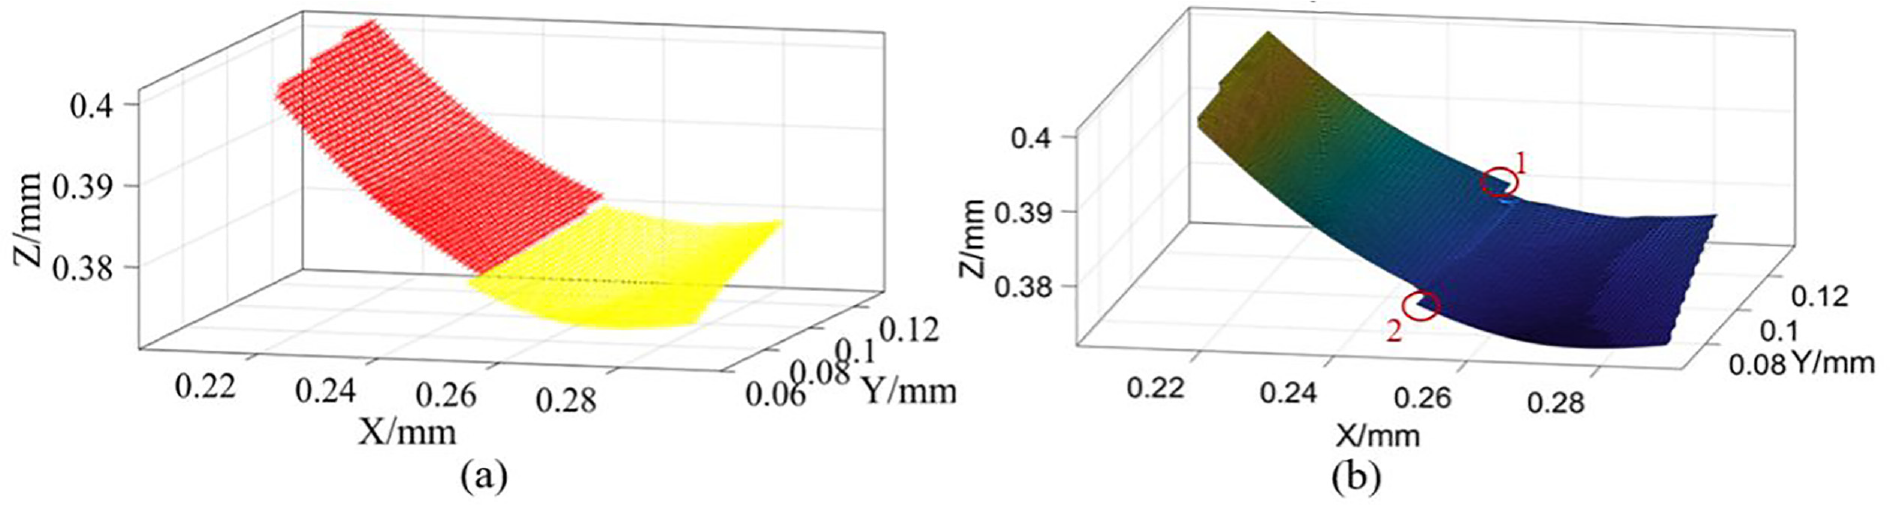
Point cloud datasets post-processing result diagram: (a) delete redundant data in overlapping areas and (b) Delaunay triangulation processing.
Twisted blade deformation calculation method
Displacement field calculation
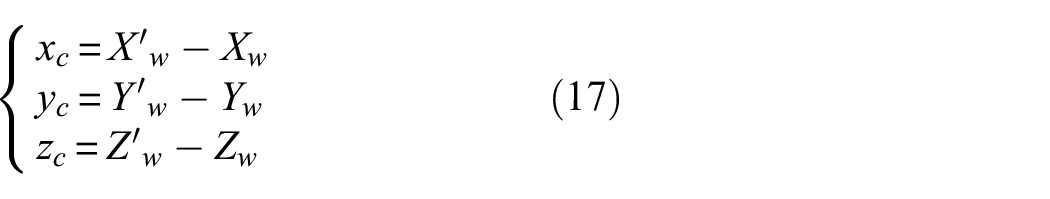
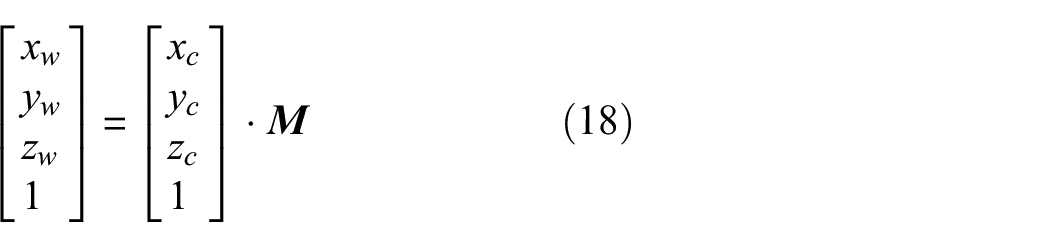
From Equation (17), the coordinates of the twisted blade in the multi-vision camera coordinate system were obtained. In practical measurements, aligning the world coordinate system with the actual motion direction of the object being measured is essential. Therefore, the authors considered placing the checkerboard at the location of the object being measured, perpendicular to the PI displacement platform. Establishes a transformation that connects the coordinate system of the first camera with the checkerboard. Through solving for the transformation matrix
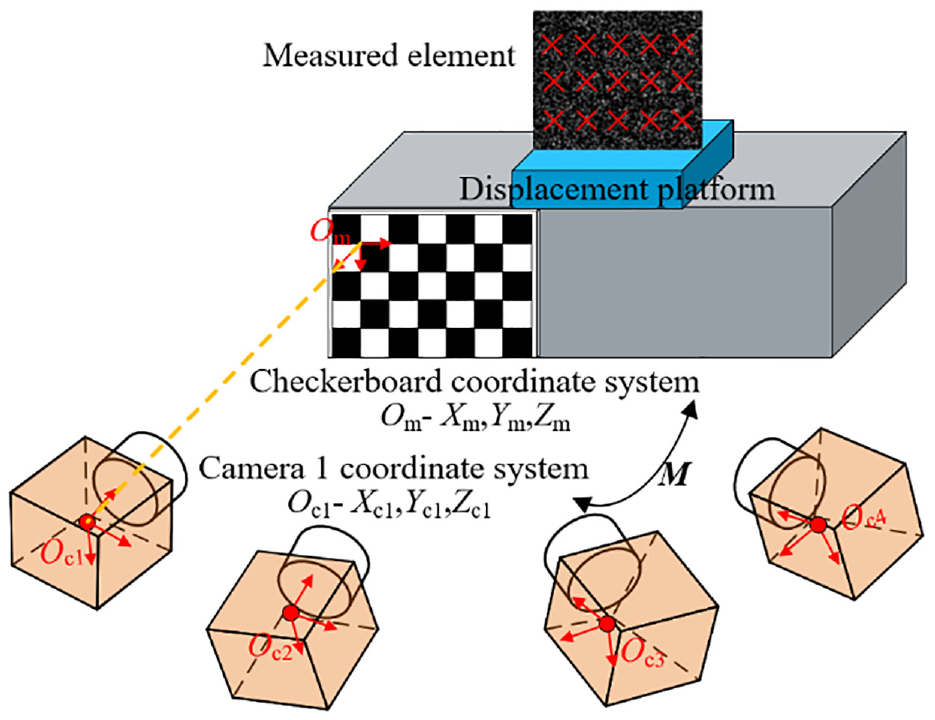
Coordinate system transformation based on checkerboard.
The coordinates of a point in camera’s coordinate system are denoted as (xc, yc, zc), while in the checkerboard coordinate system, are represented as (xw, yw, zw). Then there are the following coordinate transformation relations.
Strain field calculation
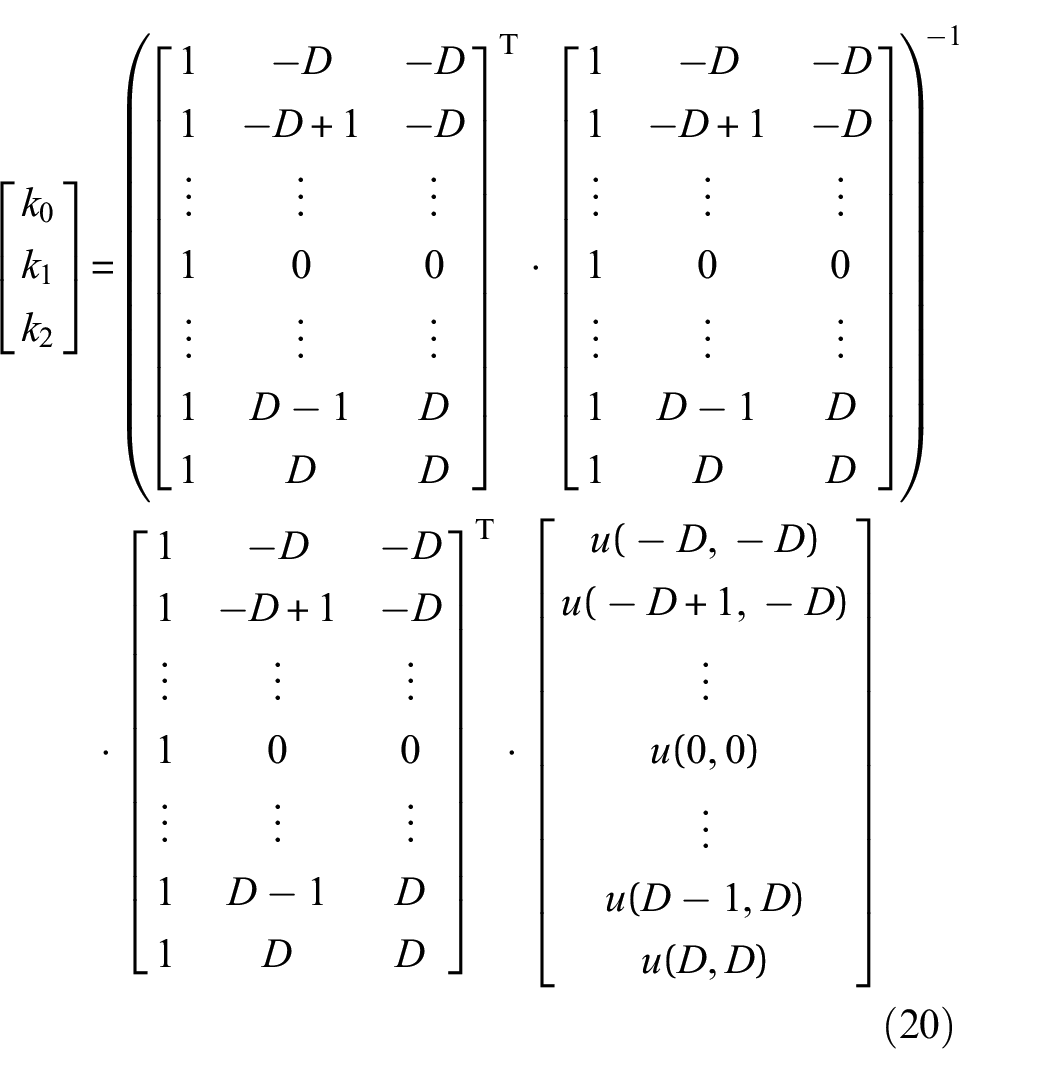
In this paper, the sub-pixel sets u and v before and after deformation are fitted based on the iterative least squares45,46 method, and the solution of the strain field is further completed. By calculating the original discrete displacement data point by point, the influence of noise is reduced, so as to obtain more accurate strain results. The strain calculation window is set to (2D + 1) × (2D + 1). If the window is small enough, the displacement distribution is best described as a planar plane. The displacement field discrete data in the window is fitted by a two-dimensional linear polynomial, as follows:

In the Equation (19), u and v are the original discrete displacement data point information by the DIC algorithm. The fitting polynomial coefficients k0, k1, k2 are solved according to Equation (20), and the same method is used for t0, t1, and t2.
For aero-engine twisted blades with large deformation at high speed, the Green strain component is used to characterize the strain.
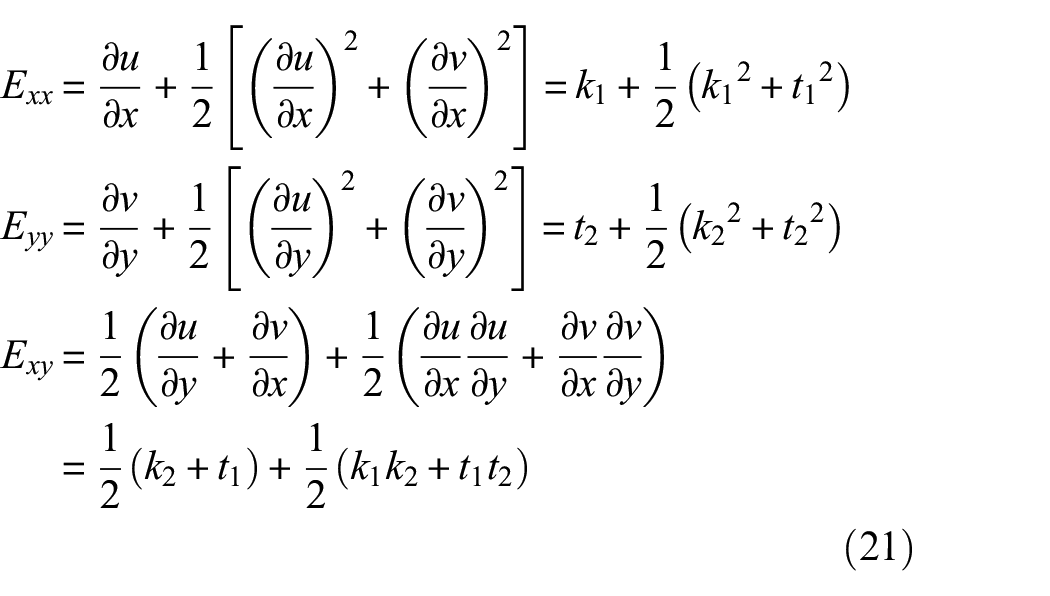
It is worth noting that when the deformation is small, the quadratic term in Equation (21), namely the Cauchy strain component, can be omitted. In situations involving minimal deformations, the typical strain calculation window size falls within the range of 11 × 11 to 21 × 21. For the aero-engine blade with large twist angle, the nonuniform strain is generated, and the strain calculation window is larger.
Experiment design and result analysis
Deformation field measurement experiment and accuracy analysis
The following section details this method for validating the precision of displacement and strain field measurement outcomes. First, the displacement correction experiment is conducted utilizing a high-precision displacement table and a checkerboard calibration plate. Then, the precision verification of the displacement and strain data is carried out by using the precision displacement platform and the strain gauge respectively. The focal length of the industrial camera is 8 mm, and the lens resolution is 2448(H) × 2048(V). The size of the checkerboard calibration plate is 12 × 9, and the side length is 20 mm. In this experimental environment, the stroboscope illumination was set to 120 lux, the camera exposure time was set to 20 ms, and the number of overlapping aero feature registration 3D reconstruction method’s iterations was set to 100.
Displacement correction experiment
The displacement correction experiment involves positioning the checkerboard in close proximity to the displacement platform’s. To illustrate, let's consider the experiment with a 1mm step along the X-direction. The measurement resolution of the precision displacement stage is 1nm, and the bidirectional repeatability positioning accuracy is 100 nm. Figure 10 depicts measurement experiment of twisted blade displacement to be measured. Figure 11 shows the schematic diagram of displacement correction method based on checkerboard.
Measurement experiment of twisted blade displacement to be measured.
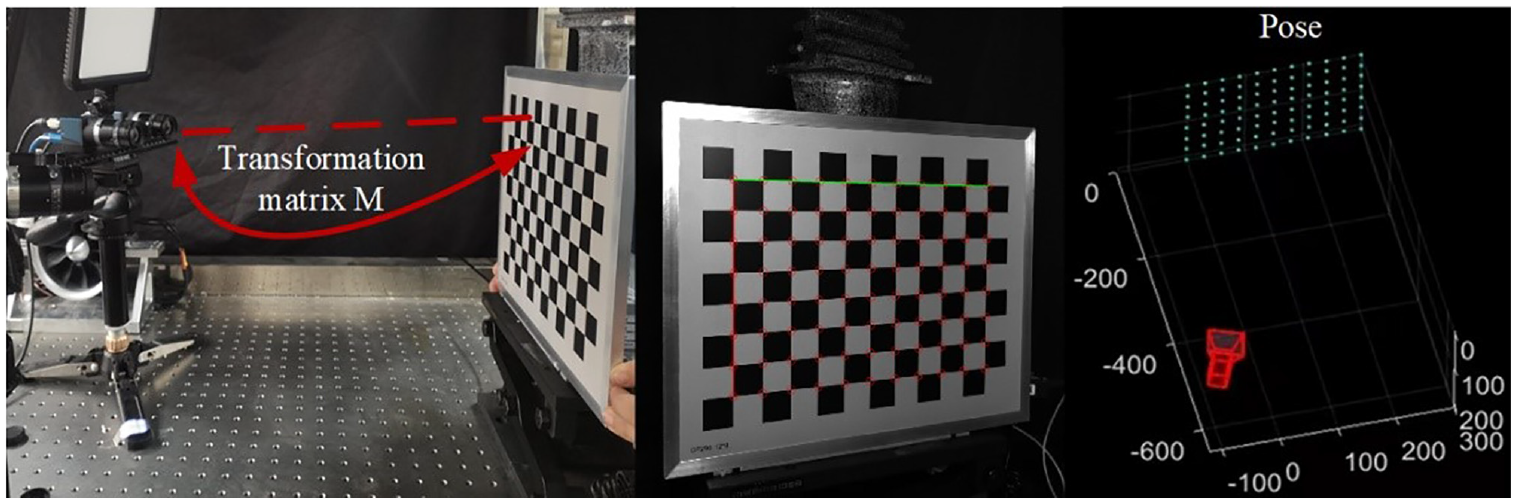
Schematic diagram of displacement correction method based on checkerboard.
Figure 12 is the uncorrected total displacement and X–Y–Z direction displacement measurement results. Figure 13 is the corrected total displacement and X–Y–Z direction displacement measurement results.
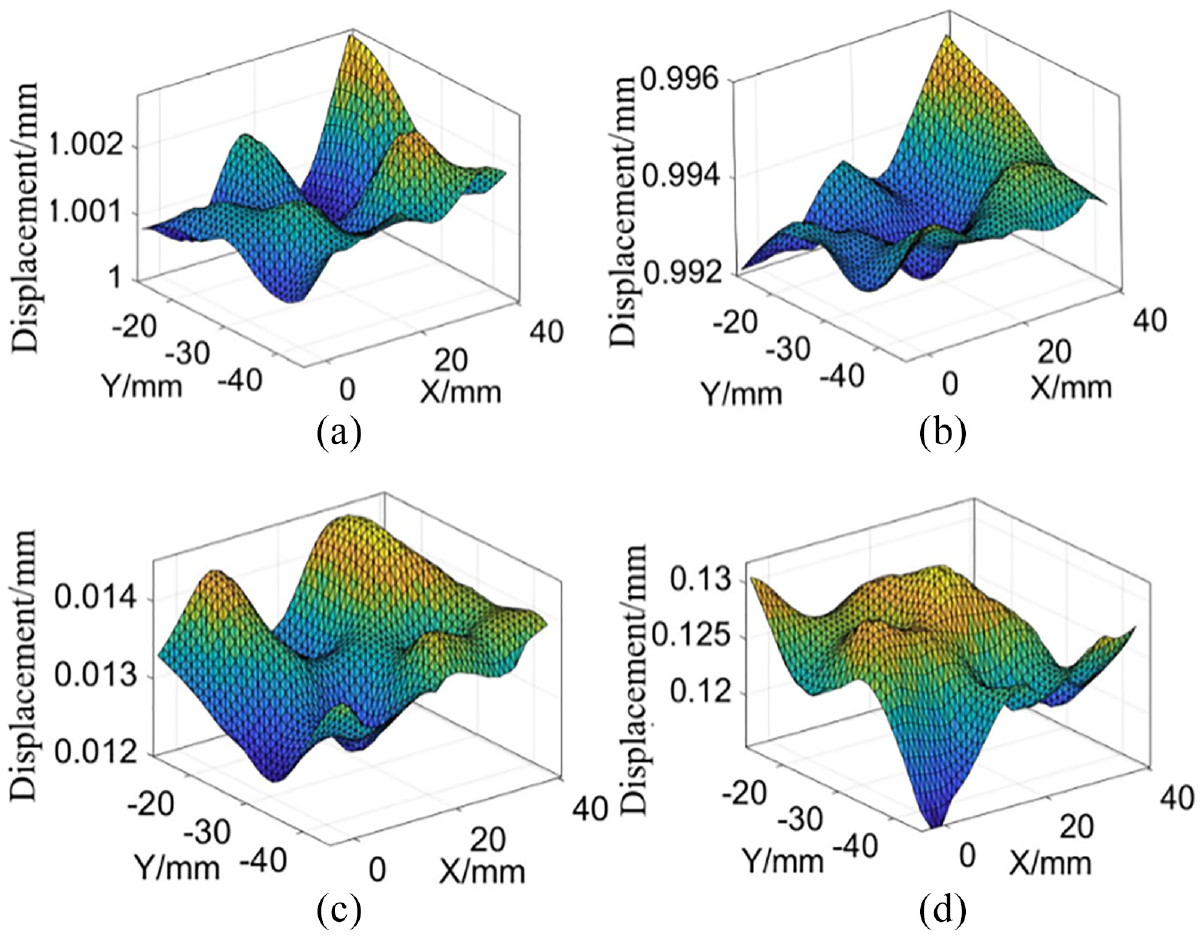
Uncorrected total displacement and X–Y–Z direction displacement measurement results: (a) total displacement, (b) displacement in X-direction, (c) displacement in Y-direction, and (c) displacement in Z-direction.
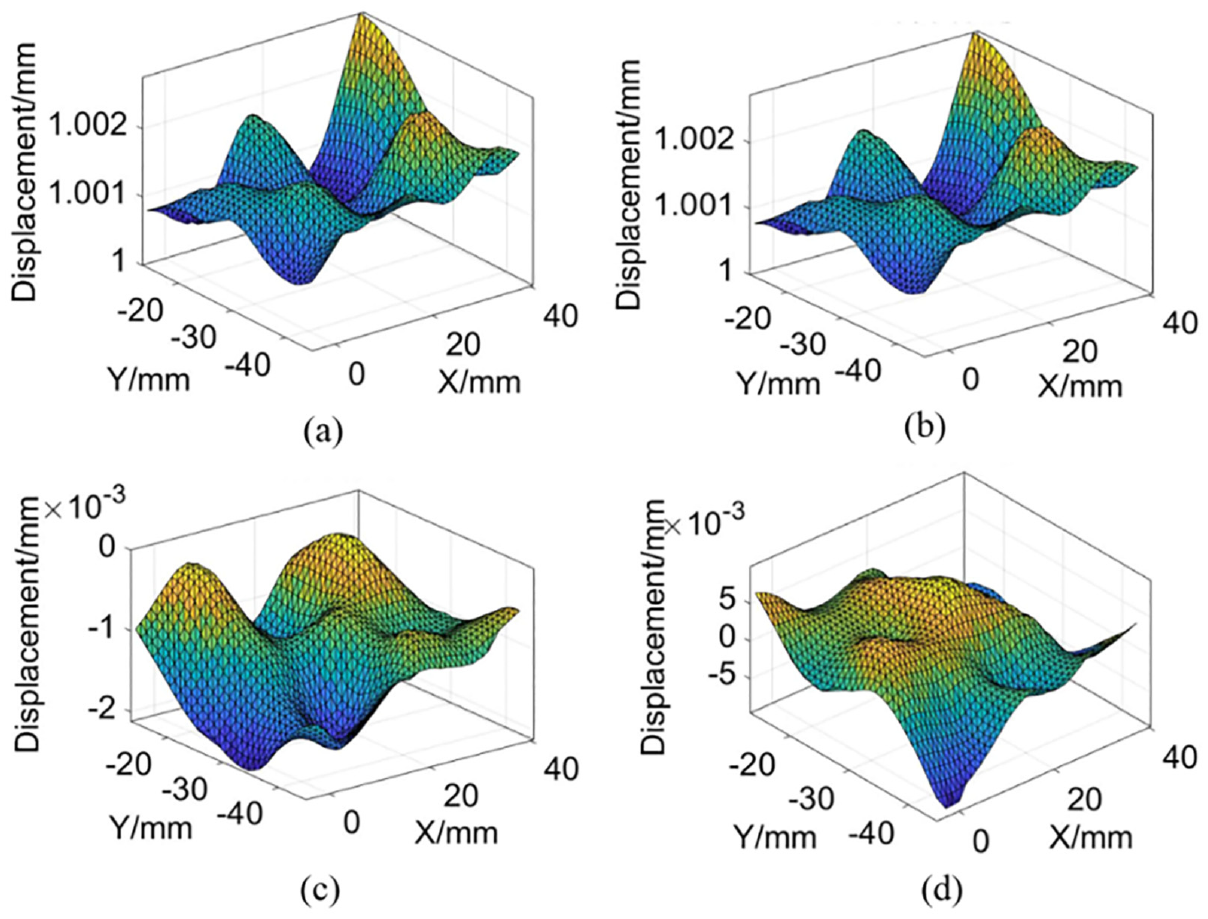
Corrected total displacement and X–Y–Z direction displacement measurement results: (a) total displacement, (b) displacement in X-direction, (c) displacement in Y-direction, and (d) displacement in Z-direction.
Based on the results presented in Figures 12 and 13, it can be observed that the errors are significantly reduced when the displacement platform is stepped by 1 mm. More precisely, the X-direction error is reduced by 6.25 μm, the Y-direction error is reduced by 8.67 μm, and the Z-direction error is reduced by 9.23 μm.
Displacement field measurement experiment and accuracy analysis
The displacement table undergoes 10 times continuously in X-direction, as depicted in Figure 14, for the X-direction displacement measurement conducted by multi-vision DIC system.
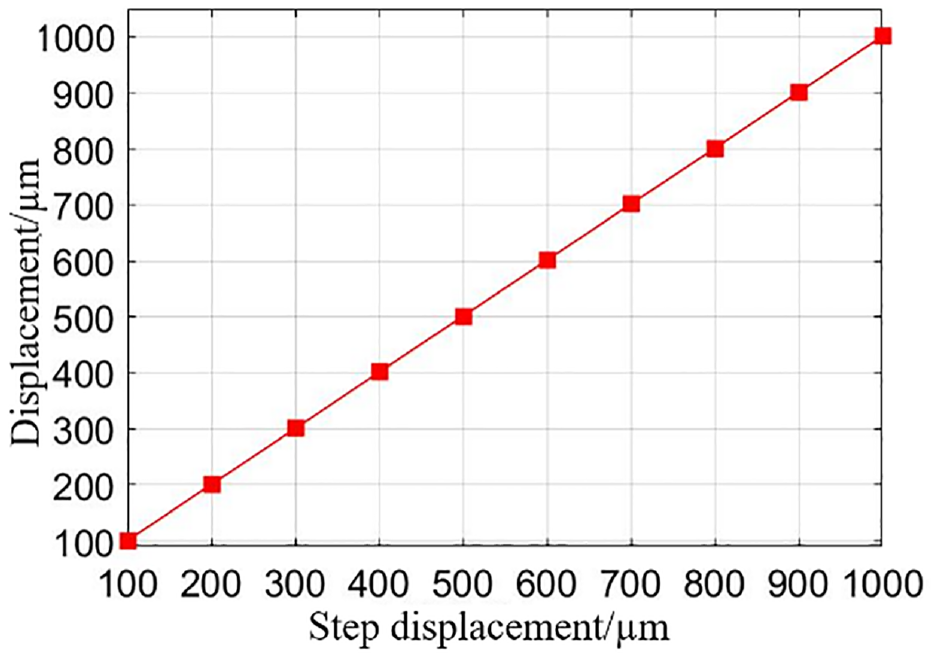
X-direction displacement of multi-vision digital image correlation measurement system.
Figure 14 indicates a close match between the step displacement and the value obtained from the measurement system, and the two are linear. Comparing the calculated X-direction displacement results with the step displacement of the displacement platform, the displacement measurement error between the multi-vision DIC and the step displacement of the displacement platform is obtained as shown in Figure 15.
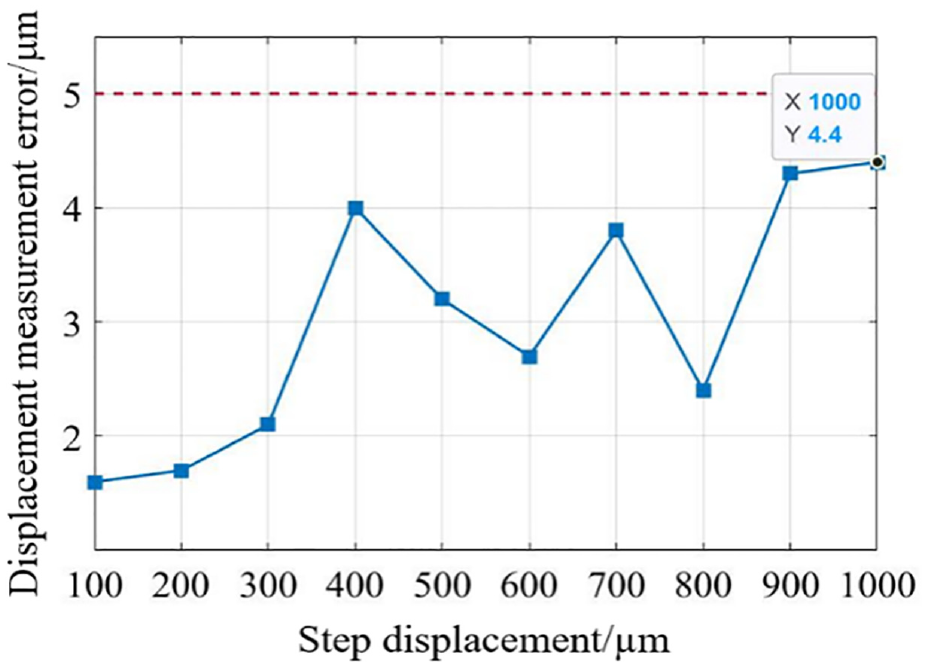
Measurement error between the multi-vision DIC and the displacement stage.
The displacement maximum error is not more than 5 μm. The maximum displacement error occurs at the 10th measurement.
Strain field measurement experiment and accuracy analysis
In the displacement accuracy verification experiment, when the measured part is only translated in a specific direction, the theoretical strain data is anticipated to be zero. However, real-world conditions are susceptible to noise interference and the three-dimensional strain field value is not 0. As shown in Figure 16, when the displacement table is stepped 0.1 mm along the X-direction, E xx , E yy , and E xy are not 0.
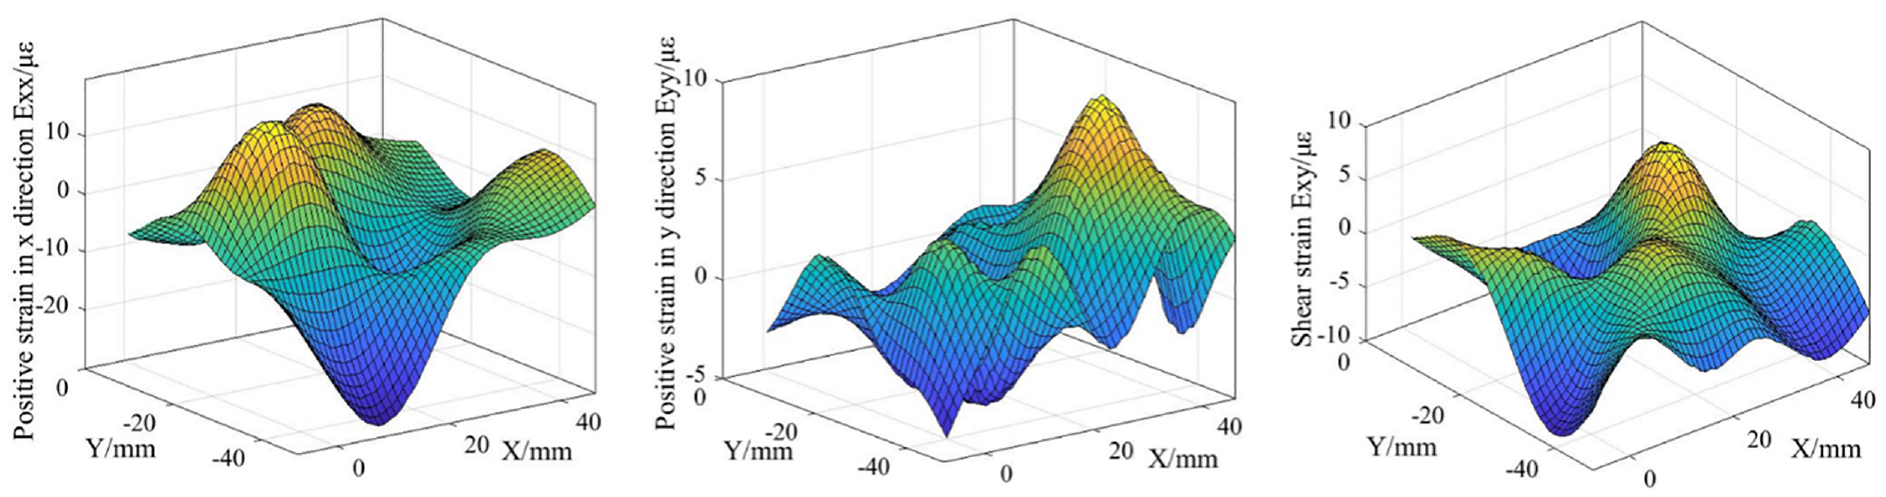
Measurement results of strain field when only pure translational displacement occurs.
In this paper, the accuracy of strain measurement is verified on universal testing machine. The experiment involved subjecting a Q235 steel plate, which had been speckle-coated. A 120 Ω strain gauge was affixed to the rear surface of the steel plate. The strain gauge data is acquired through strain testing and analysis system. Figure 17 represents the comprehensive experimental arrangement for the verification of strain data.
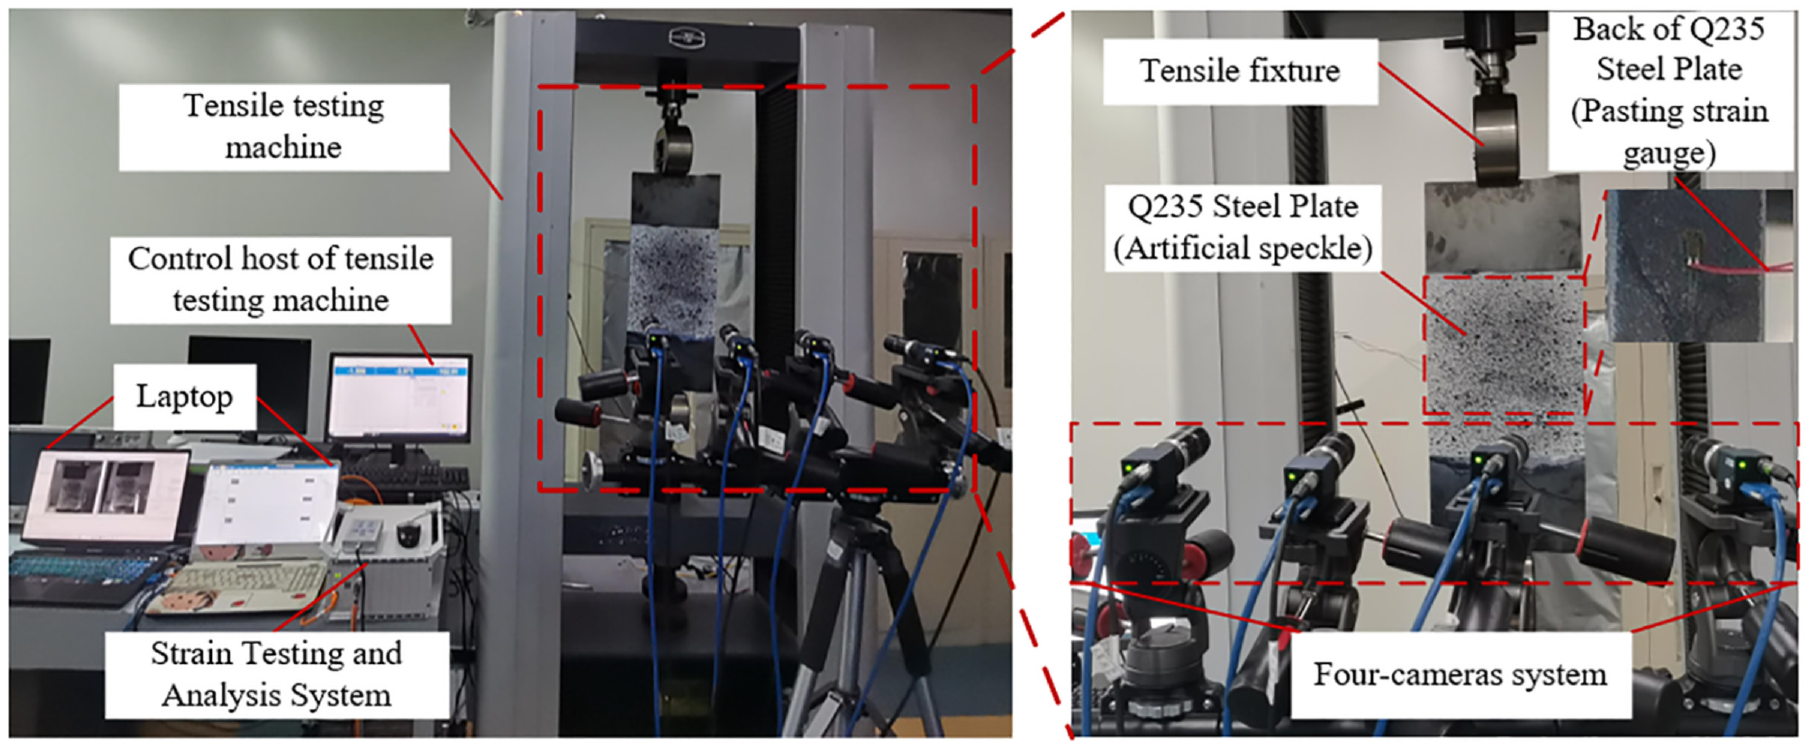
The overall experimental device of strain measurement accuracy verification experiment.
The testing procedure involves applying a 12 kN load at a rate of 0.05 kN per second. Take 40 strain measurement results at equal intervals. Figure 18 displays concurrent strain measurements obtained from the multi-vision DIC system and the strain gauge. Figure 19 illustrates the error curve for both the multi-vision DIC and strain gauge.
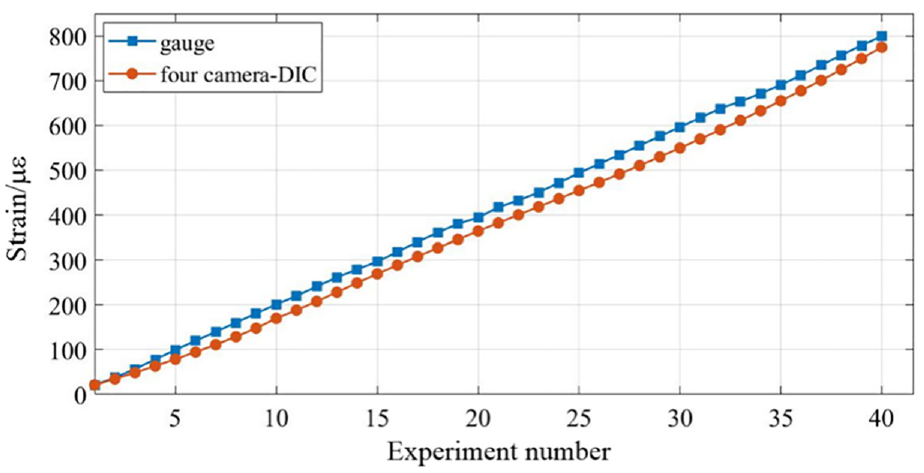
The strain measurement results of the multi-vision DIC and the strain gauge.
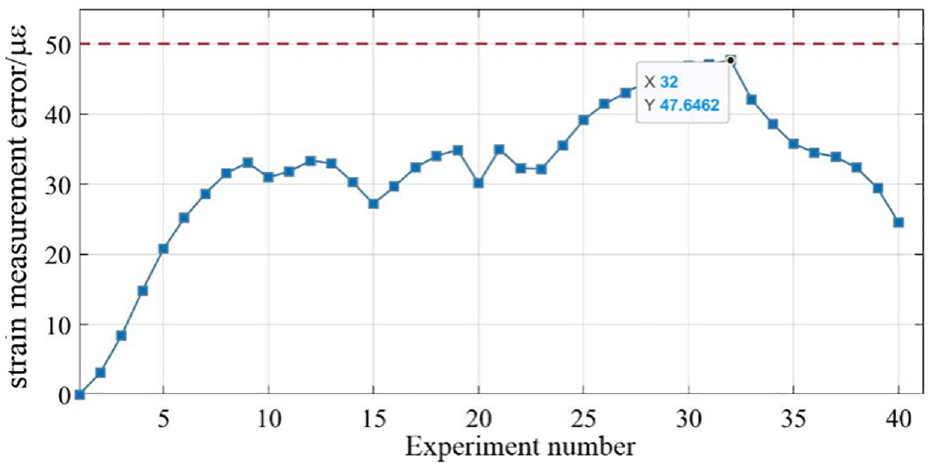
The error curve of the multi-vision DIC and the strain gauge.
As depicted in Figure 18, both the multi-vision DIC and the strain gauge readings exhibit a linear relationship, reflecting that the applied load stayed within Q235 steel’s elastic range.
As shown in Figure 19, the strain maximum error is not more than 50 με. The maximum strain error occurs at the 32nd measurement result. The DIC strain measurement value is consistent with the strain gauge measurement value but is smaller. Possible system reasons include: near the image boundary, the relevant window may not completely cover the measurement area, and then the strain value in the boundary area is usually underestimated, resulting in a systematic error. In addition, the strain gauge covers the strain concentration area, and the average strain value measured by DIC may be systematically smaller. In addition, the inconsistent or asymmetric loading conditions of the tensile machine in the experiment may lead to uneven strain distribution in the DIC measurement area, making the local strain value systematically lower than the average strain value of the strain gauge.
Rotating twisted blade deformation measurement experiment
The following is a deformation measurement experiment of rotating twisted blades (maximum speed up to 6000 rpm). An LED stroboscope-laser trigger system is utilized for illumination, tracking the rotation speed, and freezing the blade images within the FOV. The minimum delay of the high-speed stroboscope flash pulse reaches 10−7 s, the maximum illumination is 2000 lux, and the laser trigger device is integrated. The system can achieve the freezing of the image of the object under test at 300,000 rpm. The definition of the coordinate system is depicted in Figure 20 by the red arrow, where the Z-axis extends inward along the engine’s axis. Figure 21 shows the three-dimensional reconstruction results of the rotating twisted blade before and after deformation correction.
(1) Three-dimensional reconstruction results of rotating twisted blade
(2) Measurement results and analysis of displacement field of rotating twisted blade
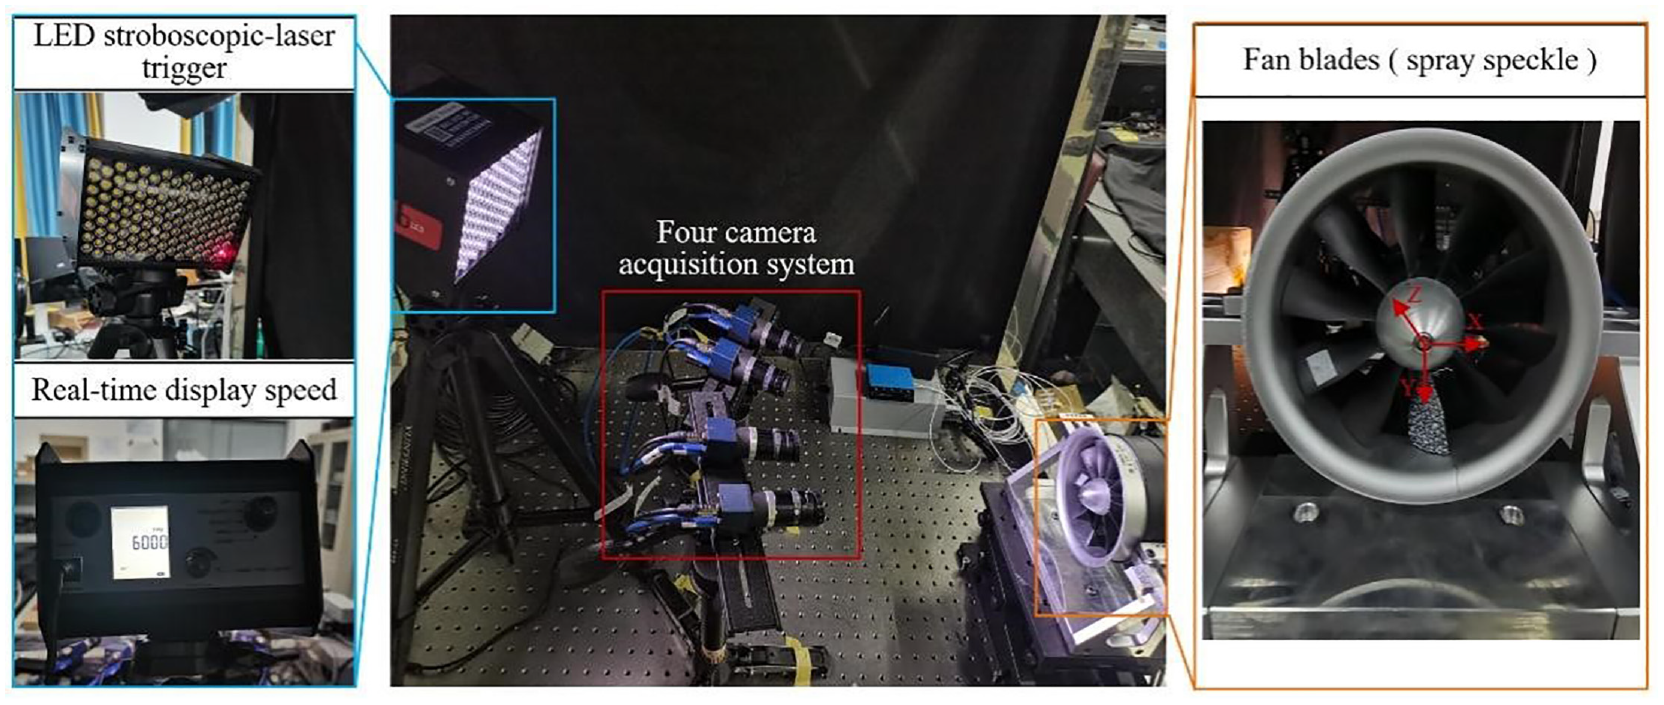
High-speed rotating twisted blade deformation measurement overall experimental device diagram.
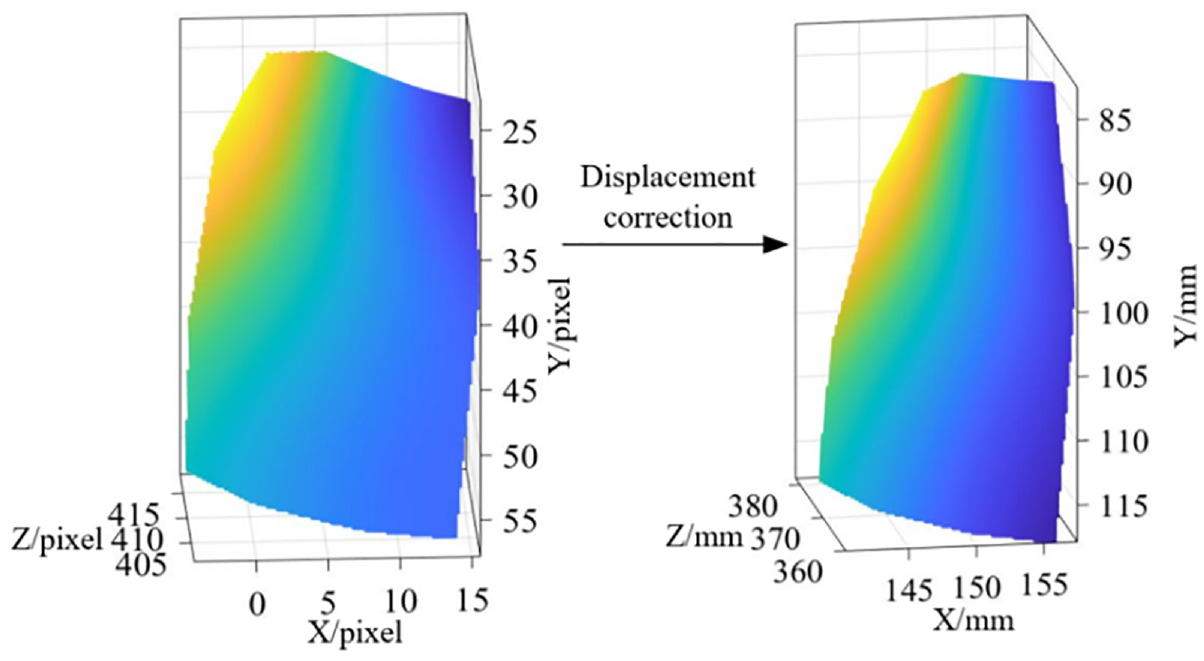
Three-dimensional reconstruction results of rotating twisted blade before and after displacement correction.
The displacement field measurement experiment is carried out based on the three-dimensional reconstruction results. Figure 22(a) displays the overall displacement results. Figure 22(b) to (d) represent displacement changes in each direction.
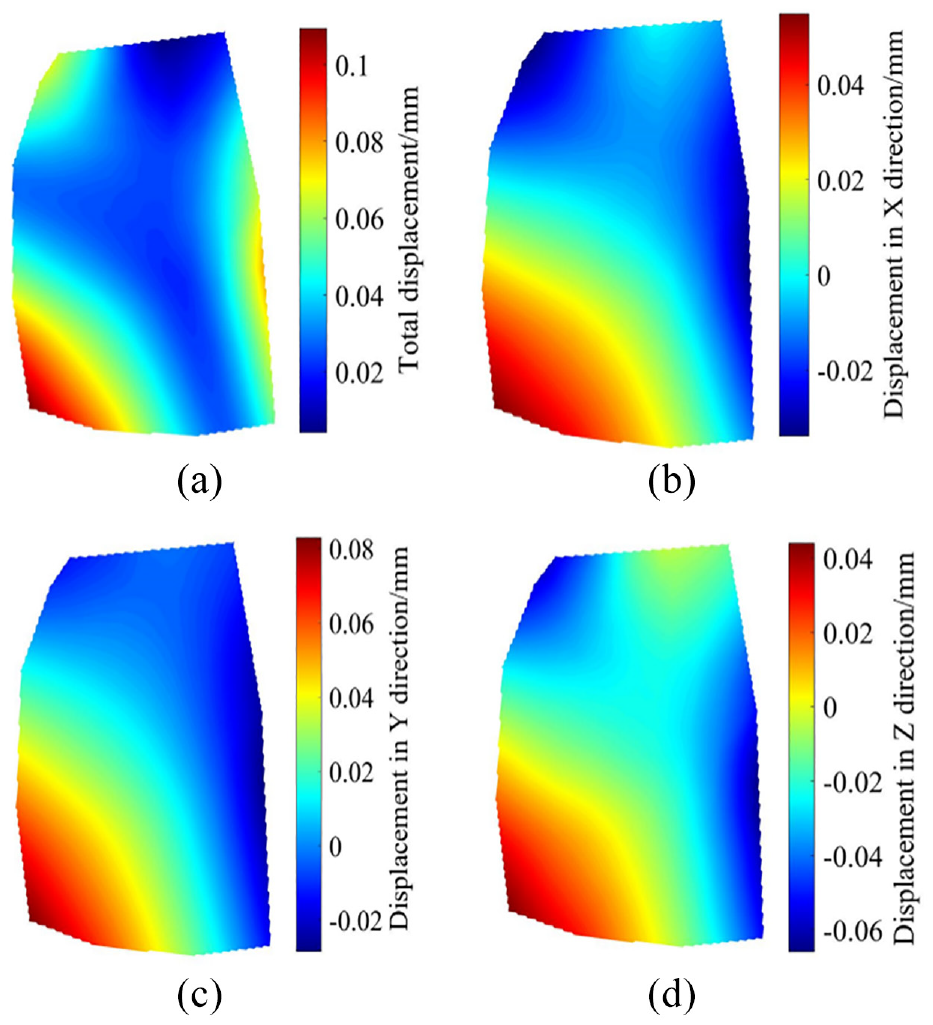
Three-dimensional displacement field condition of rotating twisted blade: (a) total displacement, (b) displacement inX-direction, (c) displacement in Y-direction, and (c) displacement in Z-direction.
Figure 22(c) reflects the displacement gradually increases along the Y axis(i.e., the radial direction). Because in the Y-direction, where centrifugal forces predominantly affect the rotating twisted blades, deformation becomes more noticeable as it approaches the blade’s tip.
(3) Measurement results and analysis of strain field of rotating blade
The strain results for the rotating twisted blade are depicted in Figure 23.
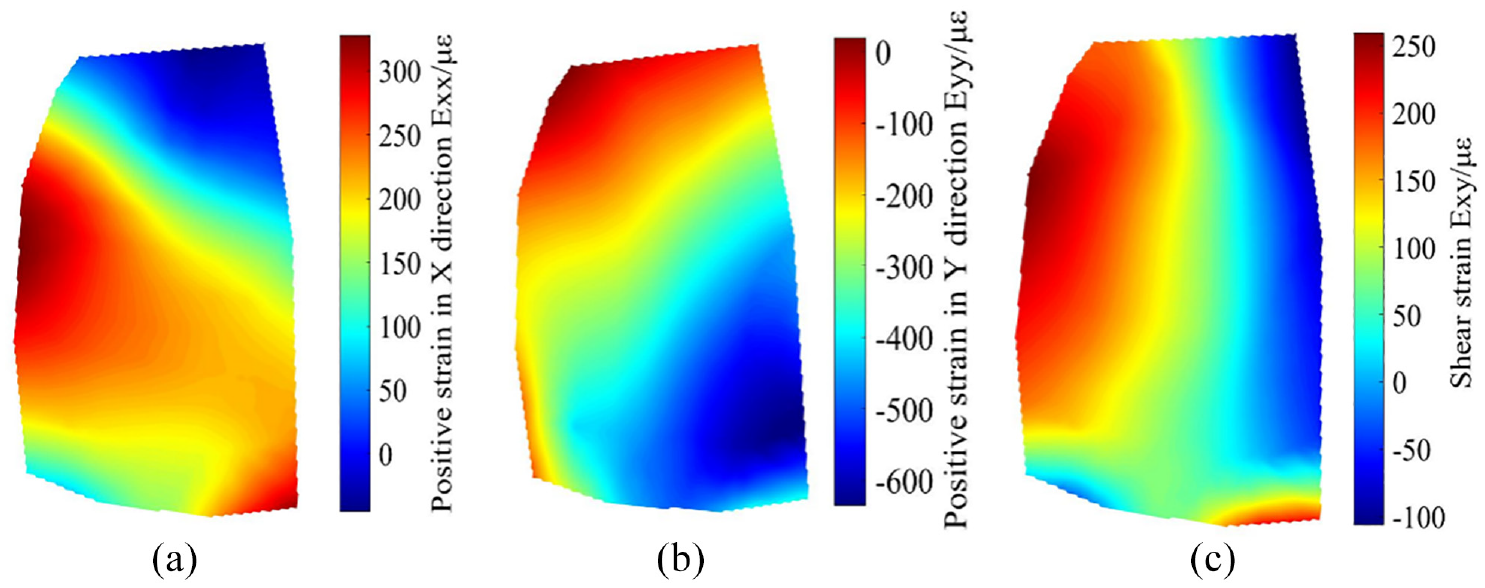
Strain field distribution of rotating twisted blade: (a) positive strain in X-direction E xx , (b) positive strain in Y-direction E yy , and (c) shear strain E xy .
Figure 23 reveals variations in the X-direction positive strain E xx across the rotating twisted blade surface, with different directions at the root and tip. And the strain degree is similar at the same distance from the shaft. The maximum E xx reaches 332 με. In the Y-direction positive strain E yy , the blade exhibits its highest values at both its root and tip, with the maximum strain at the root reaching 635 με. Additionally, the blade experiences shear strain E xy with a maximum value of 261 με.
To improve the verification of the accuracy and reliability of the measurement method, 10 repetitive experiments were carried out under the condition of constant speed and phase of 6000 rpm. Ten speckle images were collected, and the average value of the total displacement of all speckles in the region of interest (here - the paper select the tip area) was calculated for each image. The 10 sets of data are shown in Table 3.
Calculation results of 10 repeated measurements.
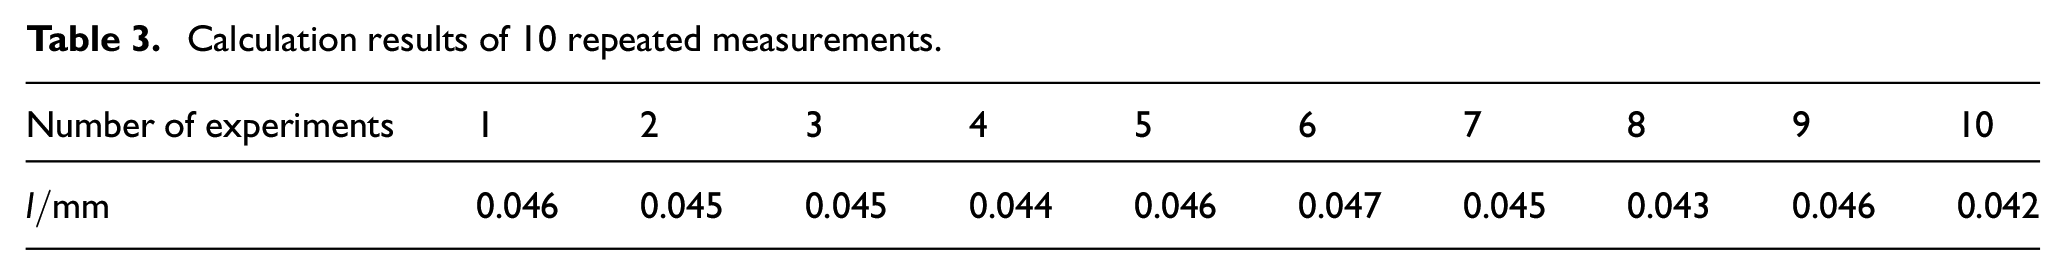
Subsequently, the 10 sets of average data were subjected to error analysis. The smaller the standard deviation, the higher the consistency and stability of the measurement results. The standard deviation of the displacement of the 10 sets of average values was calculated to evaluate their dispersion and thus the stability of the measurement method. The standard deviation of the average value
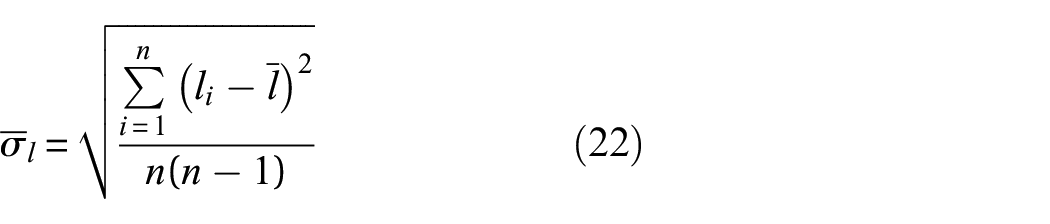
The average value
Conclusion
This paper proposes a multi-vision overlapping area feature registration method to calculate the deformation data of rotating twisted blades. It includes the calibration and image-matching method of multi-vision DIC method, overlapping region feature registration 3D reconstruction method, and the strain solution method based on discrete displacement data. It effectively addresses issues related to occlusion and shadows of aero-engine rotating twisted blades. This method can overcome the limitations of traditional contact sensor deformation measurement methods under rotation and achieve high-precision full-field deformation measurement of rotating twisted blades surface. Experimental results demonstrate that the method attains a displacement measurement accuracy of 5 μm and a strain measurement accuracy of 50 με. Under continuous rotation conditions, the maximum overall displacement of rotating twisted blades is 109 μm, with maximum displacements along the X, Y, and Z directions measuring 55, 83, and −63 μm, respectively. The maximum values of X-direction positive strain Exx, Y-direction positive strain E yy , and shear strain E xy on the rotating twisted blade surface are 332, 635, and 261 με, respectively.
In the aerospace industry, this method not only facilitates real-time monitoring of blade deformation, aiding in early detection and repair of potential structural issues to extend blade lifespan but also provides a scientific basis for flight safety and performance optimization through accurate strain data analysis. Moreover, design optimization based on experimental findings enhances blade stability and performance under high-load and high-speed rotation conditions.
Future research will further explore several areas: first, integrating existing multi-view overlapping area feature registration methods to develop high-precision vibration monitoring techniques for evaluating and optimizing dynamic response characteristics of rotating twisted blades. Second, integrating this method into aerospace engine maintenance systems to enable real-time online monitoring, providing reliable data support for operational status monitoring and fault prediction.
Footnotes
Declaration of conflicting interests
The author(s) declared no potential conflicts of interest with respect to the research, authorship, and/or publication of this article.
Funding
The author(s) disclosed receipt of the following financial support for the research, authorship, and/or publication of this article: This work was supported by the National Key R&D Program of China (grant number 2021YFF0603200), National Natural Science Foundation major research projects of China (grant number 91960109), National Natural Science Foundation of China (grant number 52275525, 52175498). Basic Research Project for Young Students of the National Natural Science Foundation of China (grant number: 523B2051)
Data availability
Data will be made available on request.