






Abstract
Single-signal crack detection methods perform unsatisfactorily in the presence of noise, prompting the need for alternative approaches. Leveraging multisource signals, which contain rich and complementary information, is a promising direction. In light of this, a compressor blade crack detection method based on the multilevel information fusion of acoustic and vibration signals is proposed. First, a multiscale data-level fusion convolutional neural network is designed, which fuses multisource homogeneous signals for crack detection. Second, multiple networks are trained with acoustic and vibration signals as inputs, respectively. Softmax layer of each network provides preliminary probabilities for each category, while the precision for each category in the validation set is calculated. Finally, an improved Dempster–Shafer theory approach is proposed to derive the final probability for each category according to the preliminary probabilities and precision, after which crack detection is realized. The proposed method is validated with experimental data from five categories of blades.
Keywords
Introduction
Compressor is the indispensable equipment in various industries, including energy, chemical, automotive, and agricultural. 1 Blades, as a vital part of the compressor rotor system, are continuously subjected to alternating loads of centrifugal and aerodynamic force during operation, as well as other factors such as temperature difference and vibration. 2 As a result, blades are prone to fatigue damage, which can further develop into cracks. Therefore, blade crack detection is of significance for operation of compressors.
There are two primary methods for detecting blade crack: offline detection method 3 and online detection method. 4 Common offline detection method includes radiographic inspection, 5 ultrasonic testing, 6 and eddy current testing. 7 However, offline detection method requires equipment shutdown for testing. In contrast, online detection methods can achieve online detection, making them more versatile in terms of usage scenarios.
The fundamental idea of signal processing methods is that damage causes variations in physical properties, which in turn leads to detective changes in modal properties, making it possible to reflect fault characteristics through signals. 8 Fan et al. 9 identified surge in compressors and detected blade crack using vibration signals. Sun et al. 10 investigated acoustic characteristics of compressors and demonstrated that the characteristic frequency of surge captured by acoustic signals is available to detect the operating status of compressors. Song et al. 11 proposed a crack detection method based on novel feature and feature selection by acoustic emission signals. In addition, pressure pulsation signals 12 and current signals 13 have also been utilized in the above application scenarios with promising progress.
The key steps of traditional signal processing methods are feature extraction and fault recognition. 14 However, manual feature extraction relies on expert experience and some features require dynamic models as prior knowledge. 15 Furthermore, the nonlinear characteristics of crack generation and propagation raise challenges for modeling. 16 Fault diagnosis frame is usually combination of individual parts and rarely considers the entire system, so traditional signal processing methods have certain limitations.
To address these limitations, machine learning, 17 especially deep learning, 18 has been extensively adopted. Deep learning models, including convolutional neural network (CNN), automatically extract features and identify faults without reliance on expert experience,19,20 enabling end-to-end fault diagnosis. Zhu et al. 21 declared a novel network comprising inception module and regression branch, using graphs obtained from the short-time Fourier transform as input.
Although progress has been made on single-signal fault diagnosis as described above, a single signal may be insensitive to faults and have limited information. Small crack signal tends to be drowned out by noise signal, hence blade crack detection based on single-signal methods is challenging. Since the source oscillates in an elastic medium generating acoustic waves, the fault characteristics are simultaneously reflected in acoustic and vibration signals. Consequently, there is a desire to investigate blade crack detection utilizing acoustic and vibration signals in order to improve diagnostic performance.
Multisource information is categorized into multisource homogeneous signals and multisource heterogeneous signals. 22 The former are signals from same type of sensors, while the latter refers to signals from various types of sensors. Multisource information fusion is classified into data-level, feature-level, and decision-level fusion. 23 Regarding homogeneous signals, 2D images such as vibration images and time-frequency diagrams are input to 2D CNN. However, training 2D CNN has high complexity, and the choice of 2D image form depends heavily on expert experience.20,24 By contrast, data-level fusion takes advantage of the correlation of homogeneous signals, fully exploits information in the original signals, and produces more informative signals. Yu et al. 25 defined variance contribution rate and fused three vibration signals into one signal. Similarly, Cheng et al. 26 established signal energy correlation function and Guan et al. 27 defined correlation kurtosis weight to fuse signals. Feature-level fusion gathers features extracted by each signal and seeks for an optimal feature subset. Ma et al. 28 brought forward autoencoder model to extract and fuse features of multi-source signals. Decision-level fusion capitalizes on outcomes of multiple models for better diagnostic results. Among decision-level fusion approaches, Dempster–Shafer (DS) theory and its improved versions are broadly used. Ji et al. 29 introduced a fault diagnosis method based on DS theory. Wang et al. 30 proposed a diagnosis approach employing the improved DS theory which effectively handles conflicts of evidence.
However, data-level fusion only fuses multisource homogeneous signals and is not capable of dealing with multisource heterogeneous signals. Besides, the weights are not adaptively adjusted during fusion, making it difficult to apply to different signals. Feature-level fusion cannot preserve complementarity of homogeneous signals which may entail loss of critical features during feature selection. Paradoxes occur during decision-level fusion when considerable conflict exists in the evidence.
To address the limitations of single-level information fusion, multilevel information fusion approach for compressor blade crack detection based on acoustic and vibration signals is put forward. First, a multiscale data-level fusion convolutional neural network (MDFCNN) is designed, which fuses homogeneous signals for blade crack detection. Second, multiple networks are trained with acoustic and vibration signals as inputs, respectively. Preliminary classification results of the networks along with the precision on the validation set are obtained. Finally, an improved DS theory approach is used for final crack detection results.
The remainder is structured below: Section “Review of related works” introduces related works. Section “The proposed method” details implementation of the proposed method. Section “Experiments” describes the compressor blade crack detection test bench. Section “Result and discussion” discusses results of the proposed method. Section “Conclusions” shows the conclusion.
Review of related works
Convolutional neural network
Basic CNN is structured with convolution layers, pooling layers, fully connected layers, and Softmax layers.
In a convolution layer, convolution kernels are applied to extract features from input samples. After activation function, these features are called feature maps. 31
The pooling layer down samples feature maps to reduce dimension of features and enable feature selection. 32 The fully connected layer flattens output of the previous layer, which is then processed through the Softmax layer to obtain the probability of each category and expressed as
where Softmax(j) denotes the probability of j-th category, x(j) is the output of j-th category in fully connected layer, and N represents quantity of possible target classes for the given inputs.
Convolution kernel for data-level fusion
Multichannel sensors are required to acquire multisource homogeneous signals. When processing these signals with a CNN, the input samples are denoted as
A convolution kernel matching the number of channels needs to be constructed to capture the homogeneous signals,
33
denoted as
When performing convolution, the stride is set to 1 × b and zero padding is used without considering bias. The convolution kernel for data-level fusion extracts feature from homogeneous signals to obtain the optimal one-dimensional representation of the original signals. This means that multisource signals are fused into a single signal. For example, process of data-level fusion using a convolution kernel with k = 1 is shown in Figure 1.

Data-level fusion using a convolution kernel with k = 1.
Additionally, convolution kernel for data-level fusion means that b is chosen adaptively according to the number of channels. The parameter k determines the receptive field of the convolution kernel. Convolution kernels with a large receptive field focus on the large-scale information of the original signals, while those with a small receptive field focus on the small-scale information of the original signals.
Inception module
In CNNs, determining size of the convolution kernel is crucial issue. GoogLeNet, with the codename Inception, is the first to introduce the Inception module. 34
Structure of Inception module is given in Figure 2, which simultaneously uses 1 × 1, 3 × 3, and 5 × 5 kernels to extract features from previous layer. These extracted features are concatenated in depth as the output feature maps. Since different kernel sizes are used, the Inception module can fuse features of different scales.
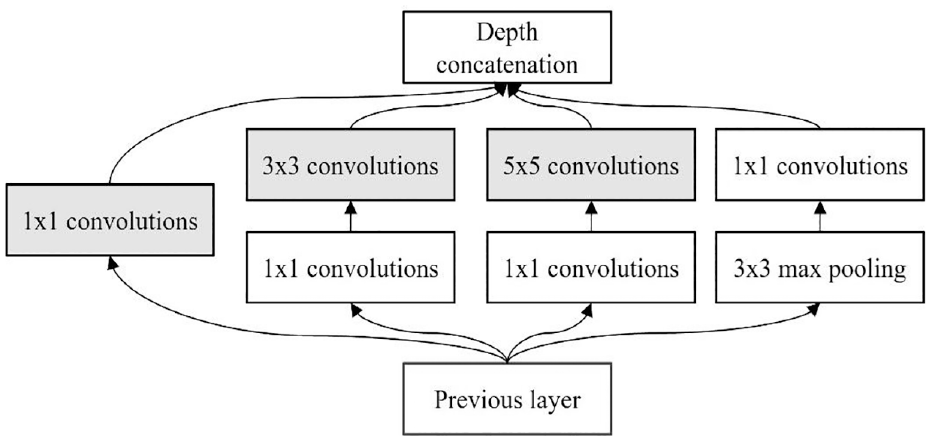
Structure of inception module.
The proposed method
Multiscale data-level fusion CNN
Data-level fusion fuses multisource homogeneous signals into one signal, obtaining a more informative signal than the original data. Traditional data-level fusion methods, like fusion using variance contribution rate, 25 require manual calculation of weights. The weights require prior knowledge and may not be usable for present signals and cannot be adaptively adjusted. However, constructing convolution kernels that match the number of channels can achieve data-level fusion of the multisource signal. The fused weights participate in network training as convolution kernel parameters, thereby allowing the optimal weights to be learned automatically during training.
In practice, the acquired acoustic and vibration signals are nonstationary, which are shown in Figure 3 at sampling frequency of 25,600 Hz. Nonstationary signal contains low-frequency and high-frequency components. Low-frequency components refers to slowly transforming components in time domain, while high-frequency components are rapidly changing components in time domain, such as pulses.

Acquired acoustic and vibration signals: (a) acoustic signal and (b) vibration signal.
For low-frequency components in multisource signals, the period is relatively long. To fully capture large-scale information in original signals, a kernel with a large receptive field should be chosen, 35 and the parameter k is set to a large value.
For high-frequency components in multisource signals, the signal duration is relatively short. To adequately focus on small-scale information in original signals, a kernel with a small receptive field needs to be selected. 35 Therefore, the parameter k is set to a small value.
The key issue in fusion is how to set the value of the parameter k. Inspired by Inception module, multiscale data-level fusion module 1 is designed to fully exploit both low and high frequency components in multisource signals, as shown in Figure 4.

Structure of module 1 for multiscale data-level fusion.
The input to the network for the signals from the b channel sensor is
Similarly, during feature extraction, the low-frequency component of the signal changes slowly in amplitude and large-scale features are evident. In contrast, the high-frequency components of the signal vary dramatically in amplitude, and small-scale features are evident. Thus, features of low-frequency components need to be extracted using convolution kernels with large receptive fields without being disturbed by local information, and features of high-frequency components need to be extracted using convolution kernels with small receptive fields. 35 While considering only large-scale information will lose small-scale information, considering small-scale information will lose large-scale information. Thus, there is a challenge to consider multiscale information when performing feature extraction.
Also inspired by Inception module, module 2 is designed for multiscale feature extraction, which simultaneously extracts features at different scales in the time domain using three kernels with different receptive fields, and concatenates the extracted feature maps in depth to obtain the result of multiscale feature extraction. In addition, module 2 includes a pooling layer. Taking output of module 1 as input of module 2, structure of module 2 is shown in Figure 5.

Structure of module 2 for feature extraction.
MDFCNN is proposed, which is composed of module 1 and module 2 stacked together, as shown in Figure 6. After the data-level fusion of input data by module 1, module 2 extracts features from the fused signals and the classification results are obtained at the Softmax layer. In particular, module 1 is not required when the input data are a single signal, in which case the network can also classify faults.

Structure of multiscale data-level fusion convolutional neural network.
To keep balance between complexity and generalization ability of the network, a grid search is used to select the hyperparameters of the network. The network is stacked with one module 1 and two modules 2. Three convolution kernels of different sizes,
A sample uses 4096 sampling points for acoustic and vibration signals with a sampling frequency of 25,600 Hz. When data-level fusion of two signals, parameters of MDFCNN are shown in Table 1.
Parameters of MDFCNN (b = 2).

MDFCNN, multiscale data-level fusion convolutional neural network.
In particular, when the input data is a single signal, module 1 is not required. Parameters of MDFCNN are shown in Table 2.
Parameters of MDFCNN (b = 1).

MDFCNN, multiscale data-level fusion convolutional neural network.
The improved DS theory approach
After training several networks for the classification task, the preliminary probabilities for each category are obtained in the Softmax layers of each network. The precision of each network for each category in the validation set is also available.
Existing improvements to DS theory mainly address the problem of conflicting evidence problems. In contrast, the improved DS theory approach proposed in this paper utilizes preliminary probabilities and precision for decision-level fusion, with flow chart given in Figure 7.

Flow chart of the improved Dempster-Shafer theory approach.
For a decision-level fusion task with N propositions, the frame of discernment is defined as
For a group of M trained networks, the preliminary probabilities for each category obtained from the Softmax layer of each network are utilized as M basic probability assignments (BPA). BPA function
where
In the validation set, the precision of i-th network for j-th category can be obtained and calculated as
where
The preliminary probability
Independent BPA functions can be combined according to the Dempster rule, denoted as
The combined BPA function serves as results of decision-level fusion, where the proposition with the highest BPA function is the diagnosed fault category.
The proposed compressor blade crack detection method
To fully utilize both collected acoustic and vibration signals, a crack detection method is proposed, with the flow chart shown in Figure 8.

Flow chart of the proposed method.
Multiple networks are trained, respectively, based on acoustic and vibration signals to obtain preliminary probabilities and precision. This is followed by decision-level fusion with the improved DS theory approach to obtain the final diagnosis.
Specifically, two channels of acoustic signals are marked A1 and A2. After the input of A1 and A2 separately to the networks, the preliminary probabilities
Experiments
The compressor blade crack detection test rig I is pictured in Figure 9, which includes a compressor, an inverter, two acoustic sensors, two accelerometers, and data acquisition system.

Compressor blade crack detection test rig I.
Acoustic sensors 1 and 2 are installed for acoustic signals at the air outlet and air inlet respectively, denoted as A1 and A2. Accelerometers 1 and 2 detect vertical and horizontal vibration signals respectively, which are denoted as V1 and V2. The installation of acoustic sensors and accelerometers is the result of references to literature. 36
Different crack lengths are used to represent different blade categories. Five blade categories are designed, which are shown in Figure 10.
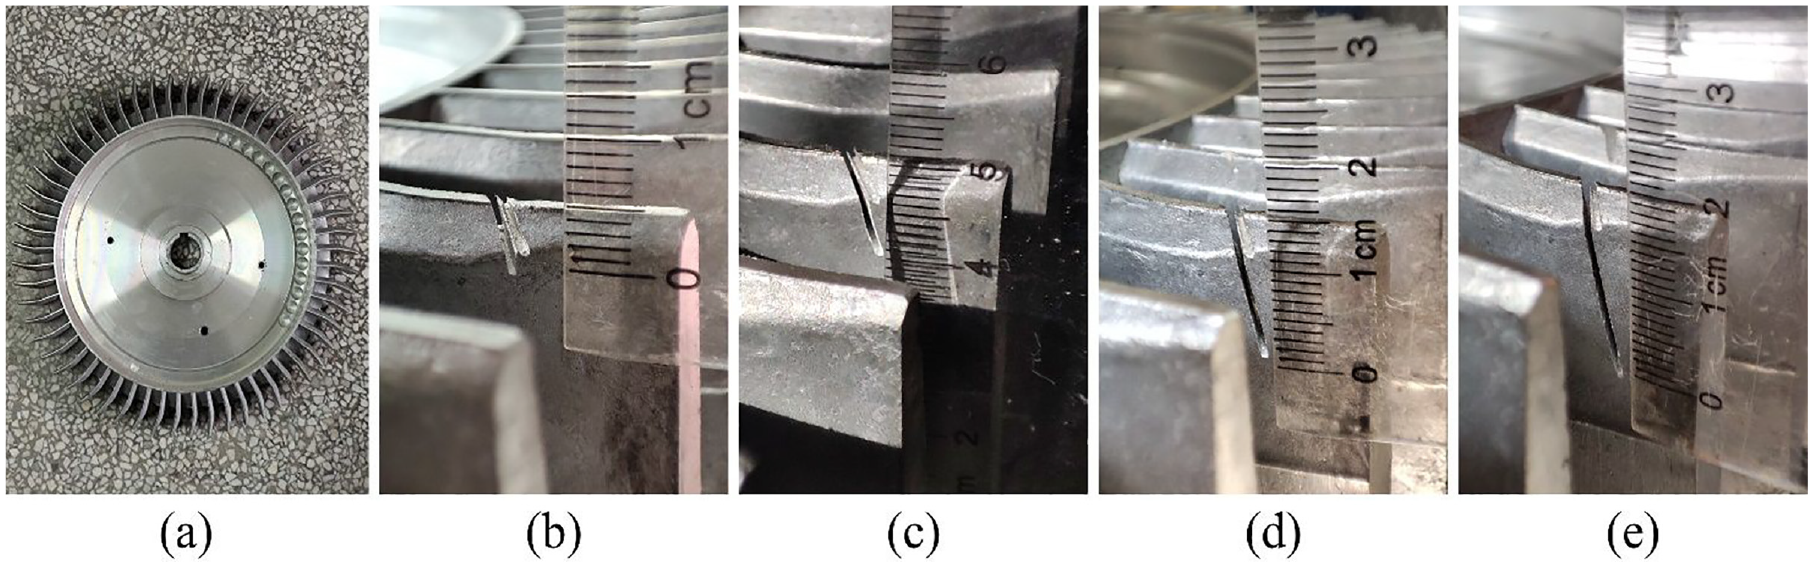
Five blade categories in test rig I: blade with the crack of (a) 0 mm, (b) 5 mm, (c) 10 mm, (d) 15 mm, and (e) 20 mm.
To evaluate the proposed method under different working conditions, acoustic and vibration signals are acquired at four speeds of 1200, 1500, 1800, and 2100 rpm, respectively, which are noted as condition 1, 2, 3, and 4. Blade crack detection is realized by classification problem at different working conditions.
The acoustic and vibration signals are acquired simultaneously with sampling frequency of 25,600 Hz and sampling time of 1 s, obtaining 25,600 sampling points per sample. Samples are divided at 4096 points and 50% overlap, as shown in Figure 11.
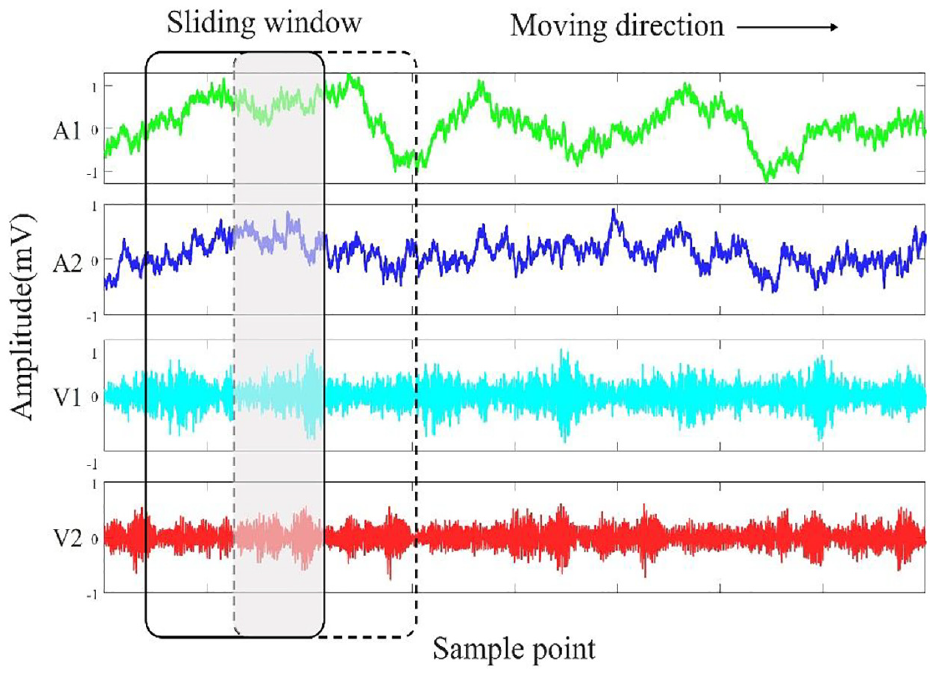
Process of sample generation.
For the five categories of blades, 40 acquisitions are made at each of the four working conditions. The signal is preprocessed through a sliding window to obtain 10 samples per acquisition, 400 samples per category per condition, for a total of 2000 samples for the five crack conditions. The mixed condition mixes the samples from the four conditions for a total of 8000 samples. The blade crack data set was formed and is shown in Table 3.
The experimental dataset.

Due to the low noise environment in the laboratory, the signal is relatively pure. In order to simulate a noise-perturbed signal in a real environment and to obtain robustness of the proposed method, Gaussian white noise is added. Signal-to-noise ratio is defined as
where
The dataset is divided into three subsets in a ratio of 5:3:2 for training, validation, and testing, respectively. The training set is used to train the network, the validation set to obtain the accuracy of the network and the test set to obtain the accuracy of the diagnosis.
Result and discussion
Result of the proposed method
The accuracy of the classification task for five categories of blades is calculated to evaluate the proposed method with the results shown in Figure 12. The first six networks are the preliminary results of the classification with MDFCNN, after which the decision-level fusion is the final result after using the improved DS theory approach. To simulate the noise disturbance of the compressor in practical operation, −6 dB Gaussian white noise is added.
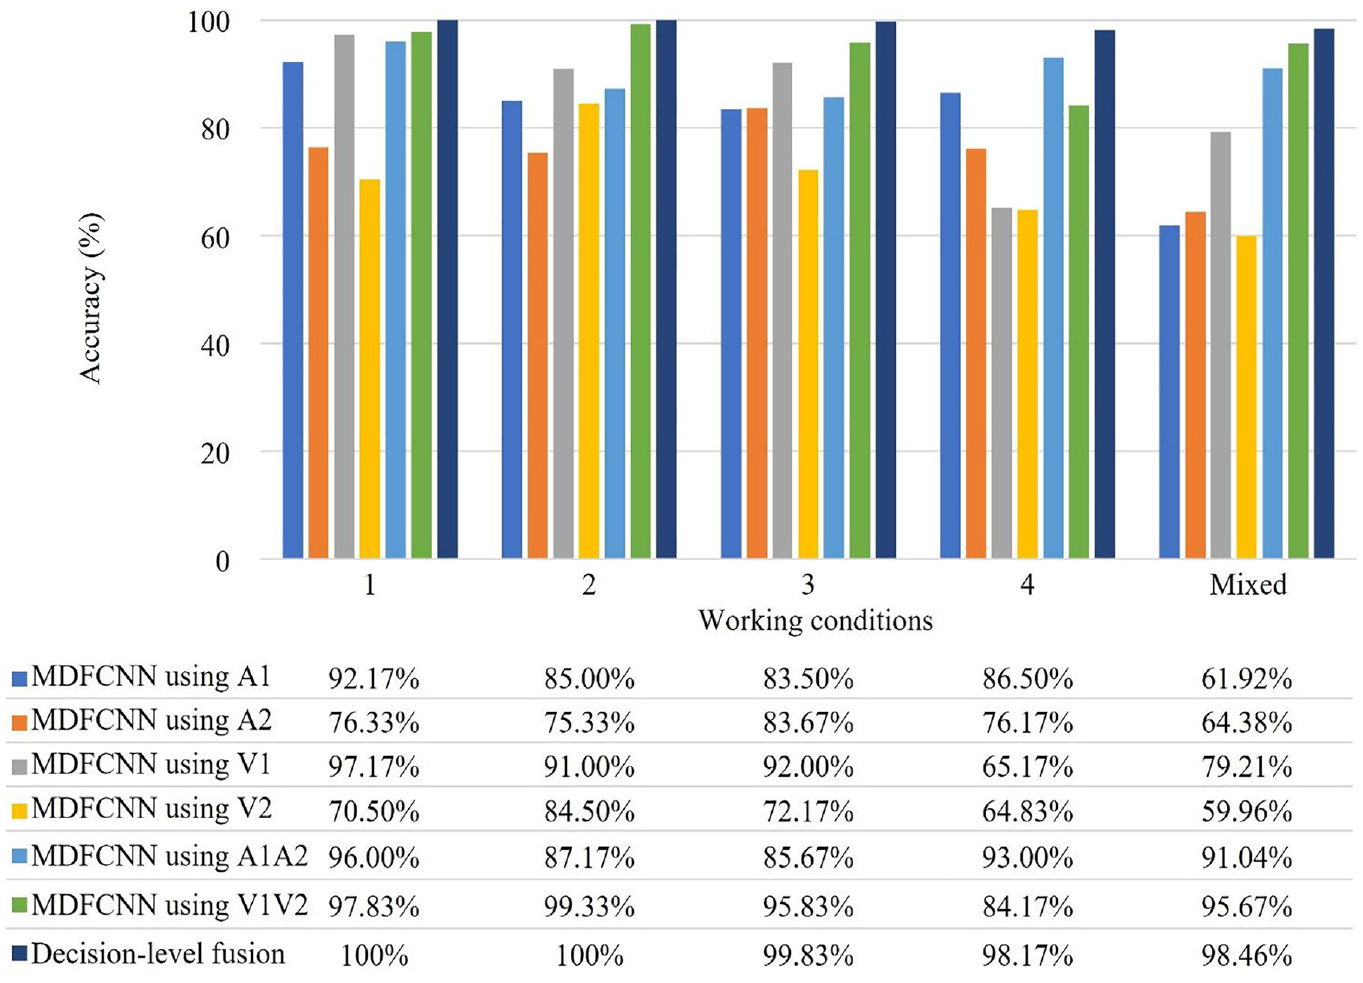
Results of the proposed method.
It is found that the performance of MDFCNN using A1 is generally superior to that of using A2. In particular, the accuracy of A1 was approximately 10% higher than that of A2 in working conditions 1, 2, and 4. Similarly, for vibration signals, the performance of MDFCNN using V1 is better than that using V2, with V1 achieving an accuracy rate more than 10% higher than V2 in working conditions 1, 2, 3, and mixed. However, the performance of signals of both A1 and A2 is not unsatisfactory under mixed working condition, while signals of V1 and V2 are not effective in working condition 4, indicating that the results of single signal are unstable.
The data-level fusion of two homogeneous signals by the MDFCNN provides better detection results than MDFCNN using single signal, with the accuracy of data-level fusion reaching over 90% under most conditions. However, the detection performance of acoustic and vibration signals varies under different working conditions, and the advantages of both signals could not be fully utilized by data-level fusion alone.
The decision-level fusion method, which utilizes the results of six networks, achieves higher accuracy than data-level fusion alone. Specifically, the proposed method achieves an accuracy rate of over 98% in all working conditions. Therefore, the proposed method effectively leverages complementary of acoustic and vibration signals, significantly improving accuracy and stability of the diagnosis.
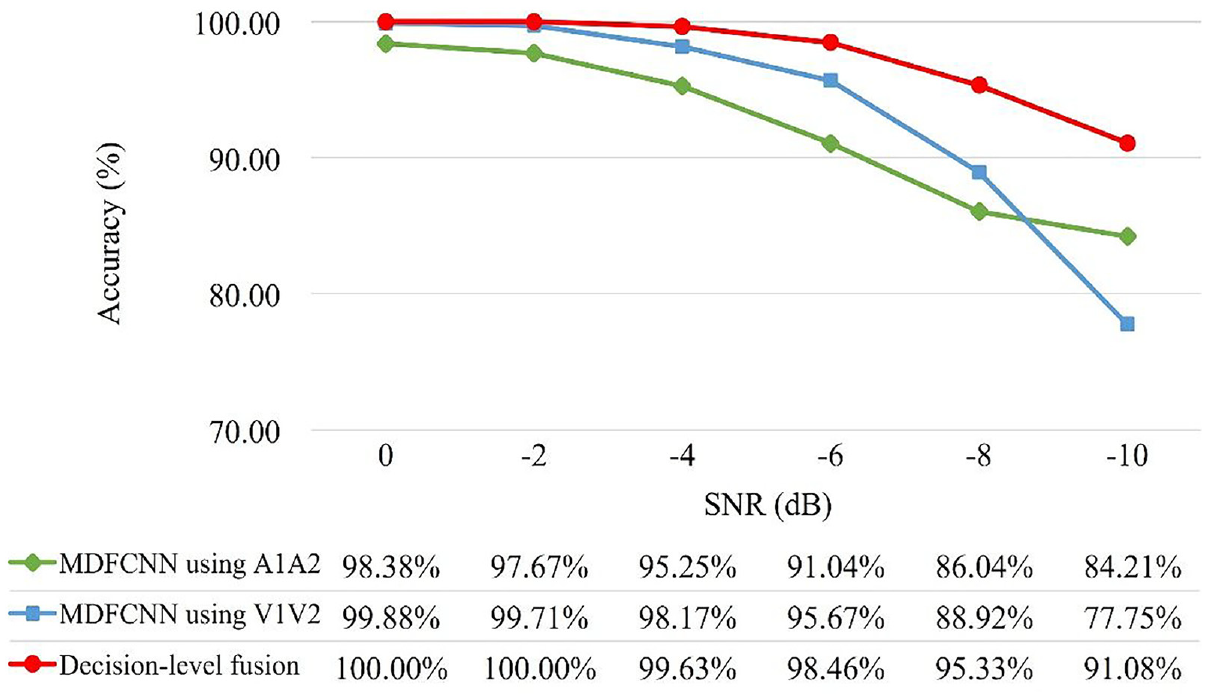
The above results are obtained with the addition of −6 dB Gaussian white noise. To analyze the robustness, the method is tested under different noise levels. Taking the mixed working condition as an example, noise ranging from 0 to −10 dB is added, and the results of MDFCNN using A1A2, MDFCNN using V1V2, and decision-level fusion are shown in Figure 13.
Results for different noise levels under mixed condition.
In the case of low noise, data-level fusion of vibration signals performs better than that of acoustic signals, while in the case of high noise, data-level fusion of acoustic signals performs better than that of vibration signals. From the confusion matrices, it can be seen that as the noise increases, the precision of vibration signal detection decreases in each category, while for acoustic signals, labels 1 and 4 are prone to overlap, while other categories have good classification performance, and precision decreases slowly with increasing noise. Decision-level fusion can fully utilize the classification results of different networks and achieve good classification performance under different noise levels.
Discussion of the proposed method
To further analyze the precision of different categories after classification using MDFCNN, taking data-level fusion as an example, confusion matrices of MDFCNN using A1A2 and MDFCNN using V1V2 are plotted. The five categories of blades are sequentially labeled as 1, 2, 3, 4, and 5, and −6 dB Gaussian white noise is added.
Confusion matrices of MDFCNN using A1A2 are shown in Figure 14. The confusion is concentrated on labels 1 and 4, resulting in lower precision for categories 1 and 4 and higher accuracy for other categories.
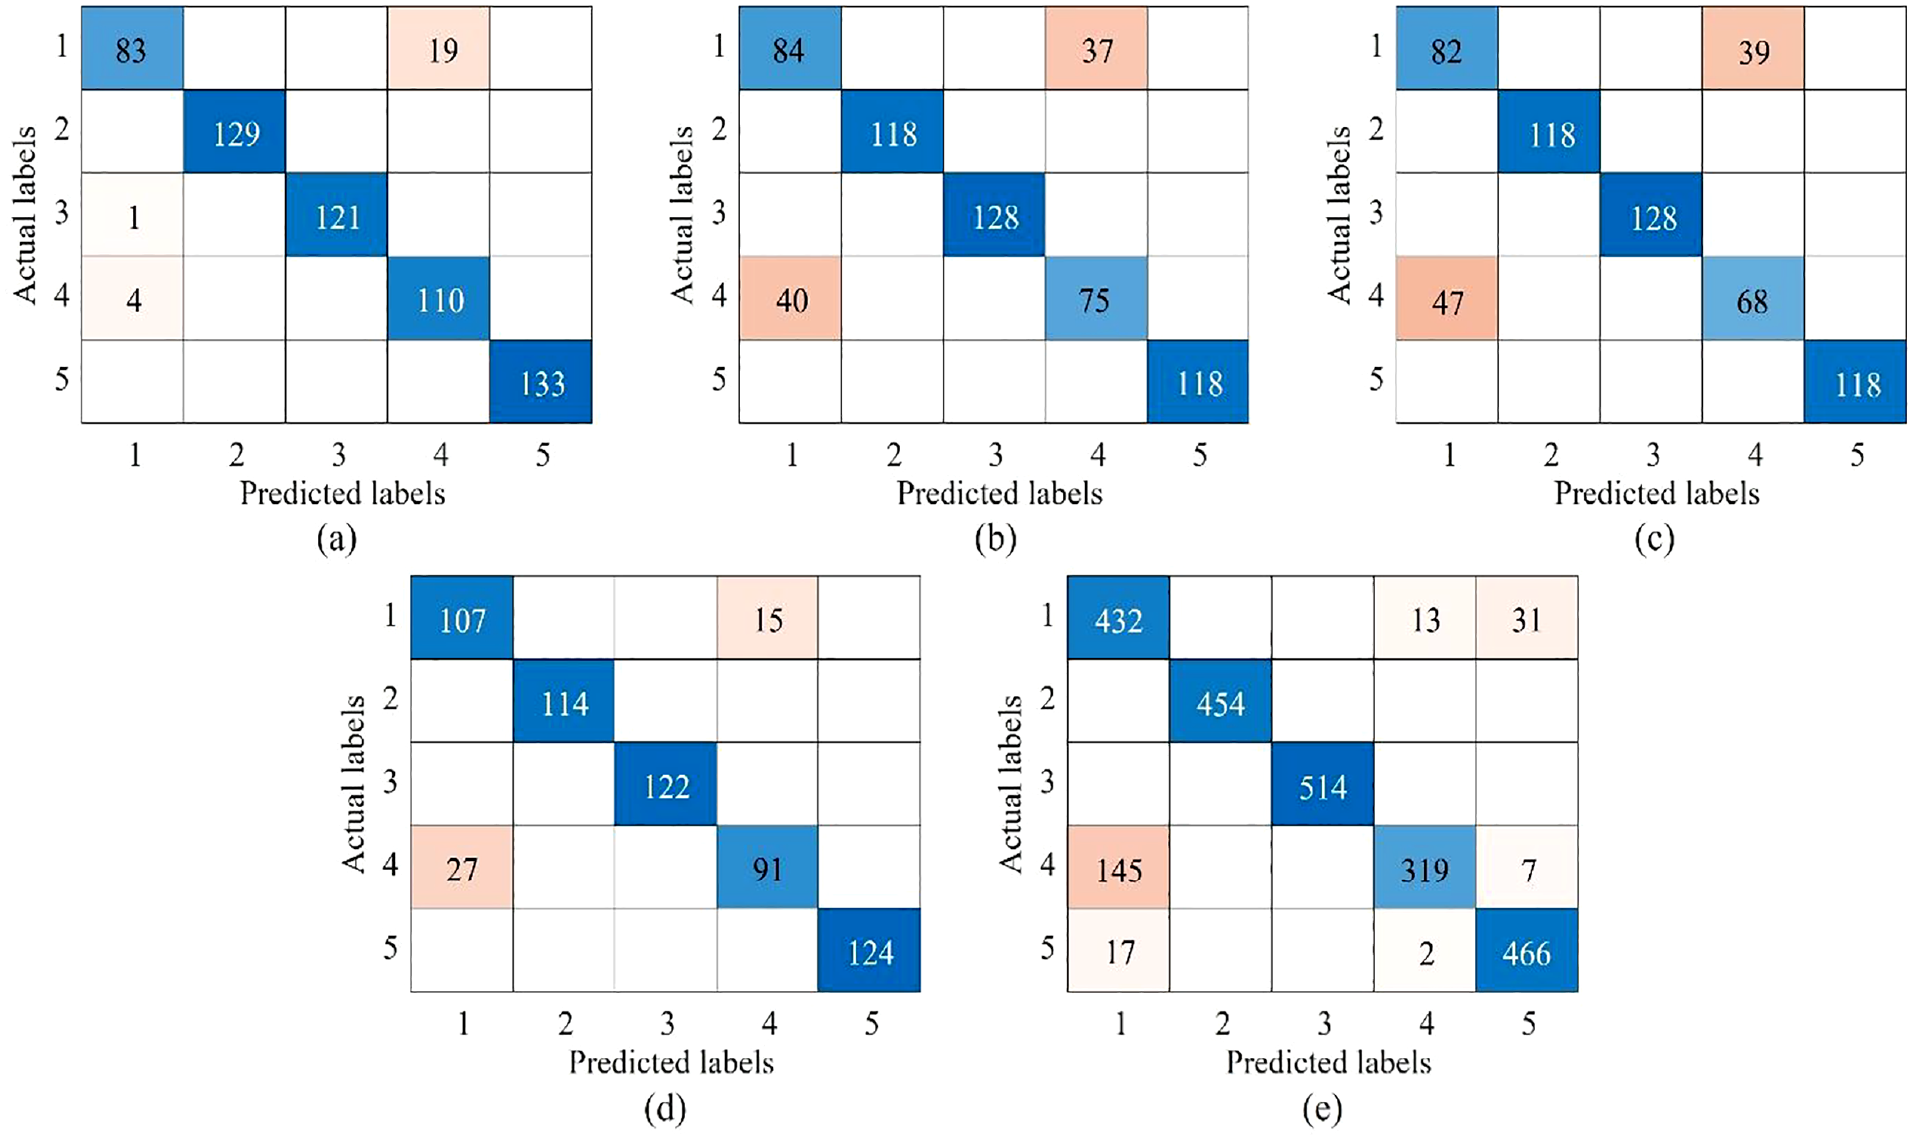
Confusion matrices of MDFCNN using A1A2: (a) condition 1, (b) condition 2, (c) condition 3, (d) condition 4, and(e) mixed condition.
Confusion matrices of MDFCNN using V1V2 are shown in Figure 15. The confusion distribution is uniform, leading to relatively high precision for each category with small precision differences. Considering the precision differences of different categories using different networks, using precision for decision-level fusion is necessary.
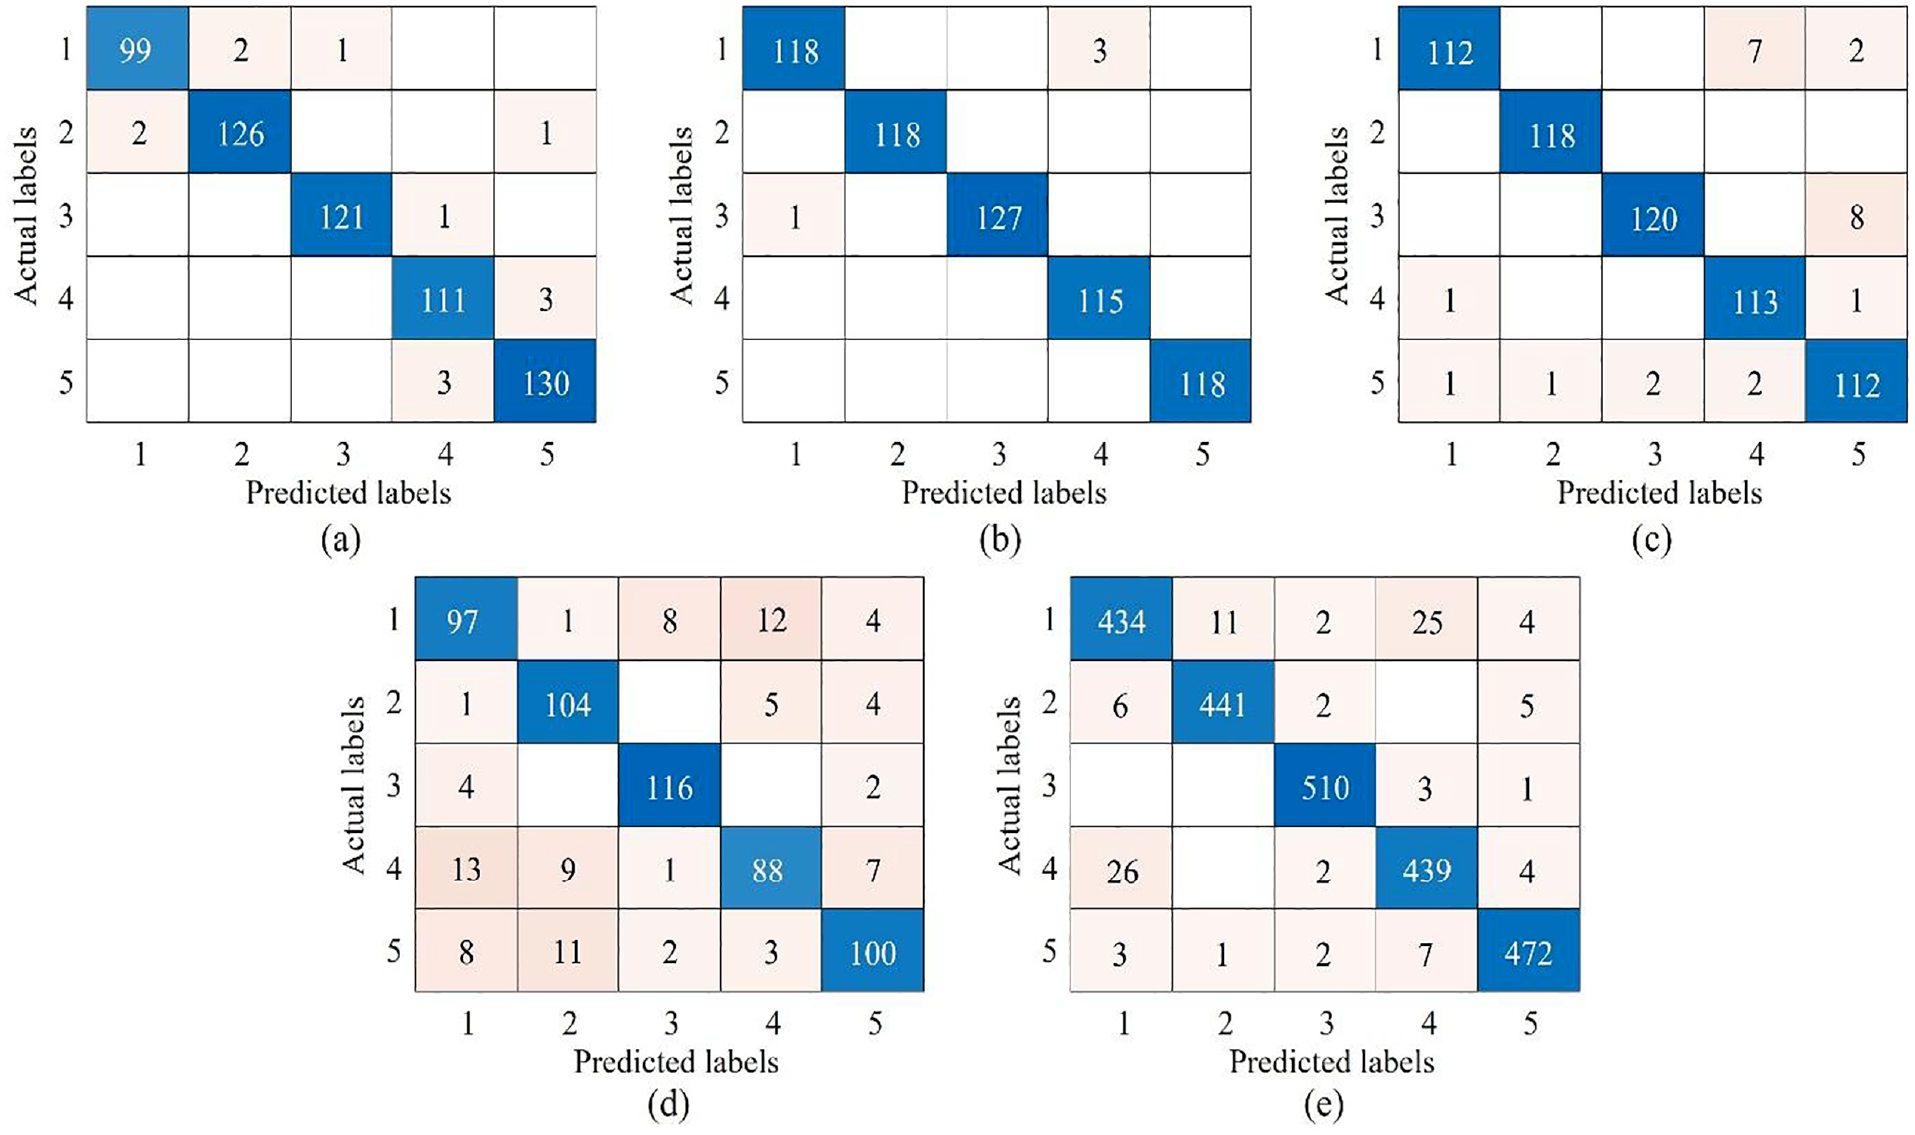
Confusion matrices of MDFCNN using V1V2: (a) condition 1, (b) condition 2, (c) condition 3, (d) condition 4, and(e) mixed condition.
In order to visual analysis process of the method, a t-distributed stochastic neighbor embedding (t-SNE) diagram of the multilevel fusion process is drawn. As an example of the mixed condition is shown in Figure 16, five different colored dots indicate five different categories of blade cracks. When the dots of different colors are mixed together, it indicates a low capability of crack detection. When the dots of different colors are separated, it indicates a high capability of crack detection.

Visualization of multilevel fusion under mixed condition.
There is a large confusion in the results of classification using individual signals in Softmax layer of the network, and a smaller confusion in the results of classification after data-level fusion using homogeneous signals. After using decision-level fusion, the results of the classification tend to be separated and therefore the accuracy of multilevel fusion is high.
To further investigate the sensitivity of proposed method to varying acoustic sensor locations, three comparison experiments by exchanging training and testing data are conducted. Specifically, the following comparisons are performed: training with A1 data and testing with A1 data (A1 → A1) versus training with A1 data and testing with A2 data (A1 → A2); training with A2 data and testing with A2 data (A2 → A2) versus training with A2 data and testing with A1 data (A2 → A1); and training with A1A2 data and testing with A1A2 data (A1A2 → A1A2) versus training with A1A2 data and testing with A2A1 data (A1A2 → A1A2).
The results of these experiments, conducted under condition 1 and with the addition of −6 dB Gaussian white noise, are summarized in Table 4.
Comparison when the locations of the sensors are different in the training and testing.

From Table 4, it is evident that the information from sensors A1 and A2 is complementary. Training with only the information from a single signal cannot be effectively tested with the information from another signal. However, training with the information from both signals simultaneously allows for the full utilization of multisensor information to a considerable extent.
Comparison of the MDFCNN with other data-level fusion methods
The proposed method achieves data-level fusion and crack detection by using the MDFCNN. Fusion using variance contribution rate, 25 signal energy correlation function, 26 and correlation kurtosis weighted fusion 27 can also be used to achieve data-level fusion.
To compare results of the proposed method with other data-level fusion methods, the signal fused by other methods is input into the MDFCNN for crack detection. With the addition of −6 dB Gaussian white noise, the results are given in Table 5.
Comparison results with other data-level fusion methods.

MDFCNN, multiscale data-level fusion convolutional neural network.
When using data-level fusion of acoustic signals, the proposed method achieves an accuracy rate higher or closer than other methods under all working conditions. In particular, single-signal diagnostics have poor performance under mixed condition and direct fusion of the acoustic signals by weight cannot exploit information in original signals, whereas the proposed method can make full use of correlation between signals from multiple sources to achieve an accuracy rate of over 90%.
When using data-level fusion of vibration signals, the proposed method achieves higher accuracy than other methods under all working conditions. Under condition 1 and 3, vibration signal A1 is diagnosed better and vibration signal A2 is diagnosed less effectively. When fusing the vibration signals directly according to the weights, the final fusion result is affected by performance of the vibration signal A2. In contrast, the proposed method can obtain adaptive optimal weights and obtain an accuracy rate of more than 95%.
Therefore, the proposed method is able to obtain adaptive optimal weights and fuse to obtain more informative signals than the original signals.
Comparison of the improved DS theory approach with other decision-level fusion methods
The improved DS theory approach is compared with the voting procedure and classical DS theory approach. The comparison is done by adding −10 dB Gaussian white noise, as shown in Table 6.
Comparison results with other decision-level fusion methods.

An ablation study is also carried out. For validity of acoustic and vibration signals alone, the results of decision-level fusion using only acoustic signals and using only vibration signals are compared separately, which are noted fusion using
The comparison reveals that the proposed method is superior to the voting procedure and classical DS theory approach. Due to the improved DS theory approach, which utilizes information about the precision of each category, the fusion is able to give higher weights to the categories with high accuracy.
The proposed method uses results of six networks for decision-level fusion. Comparing the use of only acoustic signals and the use of only vibration signals, the proposed method capitalizes on complementary of acoustic and vibration signals and performs better than using only acoustic or vibration signals.
Comparison of the proposed method with other crack detection methods
Comparison with other detection methods, such as support vector machine (SVM), 37 fast fourier transform - stacked autoencoder (FFT-SAE), 38 and long short term memory network (LSTM). 39 −6 dB Gaussian white noise is added for comparison and results are shown in Table 7. Methods based on single-signal use A1 and V1 as inputs, while methods based on multisource signals use A1A2 and V1V2 as inputs.
Comparison results with other crack detection methods.

The SVM method extracts 29 features for classification, which is less effective under mixed working conditions. Generally, vibration signal performs better than acoustic signal for diagnosis, but under working condition 4 the result of the vibration signal is only 63.33%. Therefore, the SVM method is not stable.
The FFT-SAE method extracts features from the frequency domain and the vibration signal has a good effect, reaching over 85% under all conditions, while the acoustic signal has a poor diagnostic effect. The spectrogram shows that the frequency domain features of the acoustic signal are drowned in noise, while the frequency domain features of the vibration signal are less affected by noise.
The LSTM method capitalizes on sequential characteristics of signals. Sequential characteristics of acoustic signals are obvious and diagnostic effect is higher than that of vibration signals.
The proposed method takes advantage of the complementary of acoustic and vibration signals with a high degree of accuracy.
Model overfitting discussion
The dataset mentioned above considers only one compressor, one blade and a single type of simulated defect. The test rig I is with the blade cutting direction roughly axial.
In order to explore different blades with blade cuts at different orientations, another test rig II is built, as shown in Figure 17, whose compressor model is XFJ-YJ-3.5A, and the rest of the experimental equipment is the same as that of test rig I.
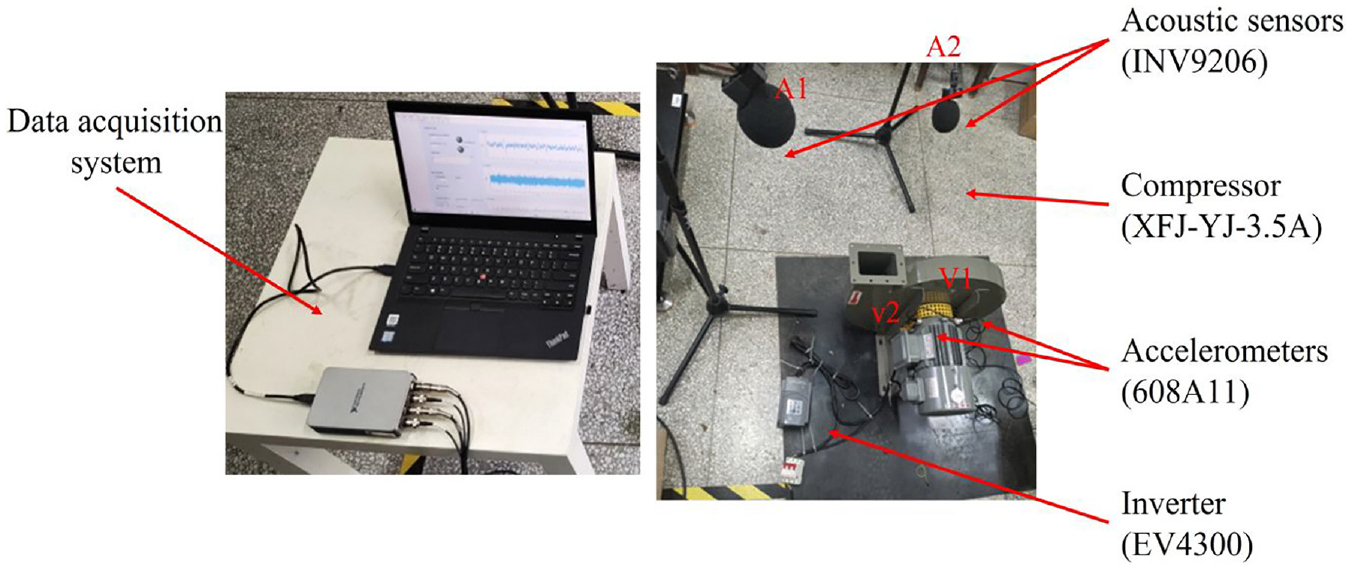
Compressor blade crack detection test rig II.
Five blade categories are designed, which are shown in Figure 18. Cutting direction is different from test rig I.
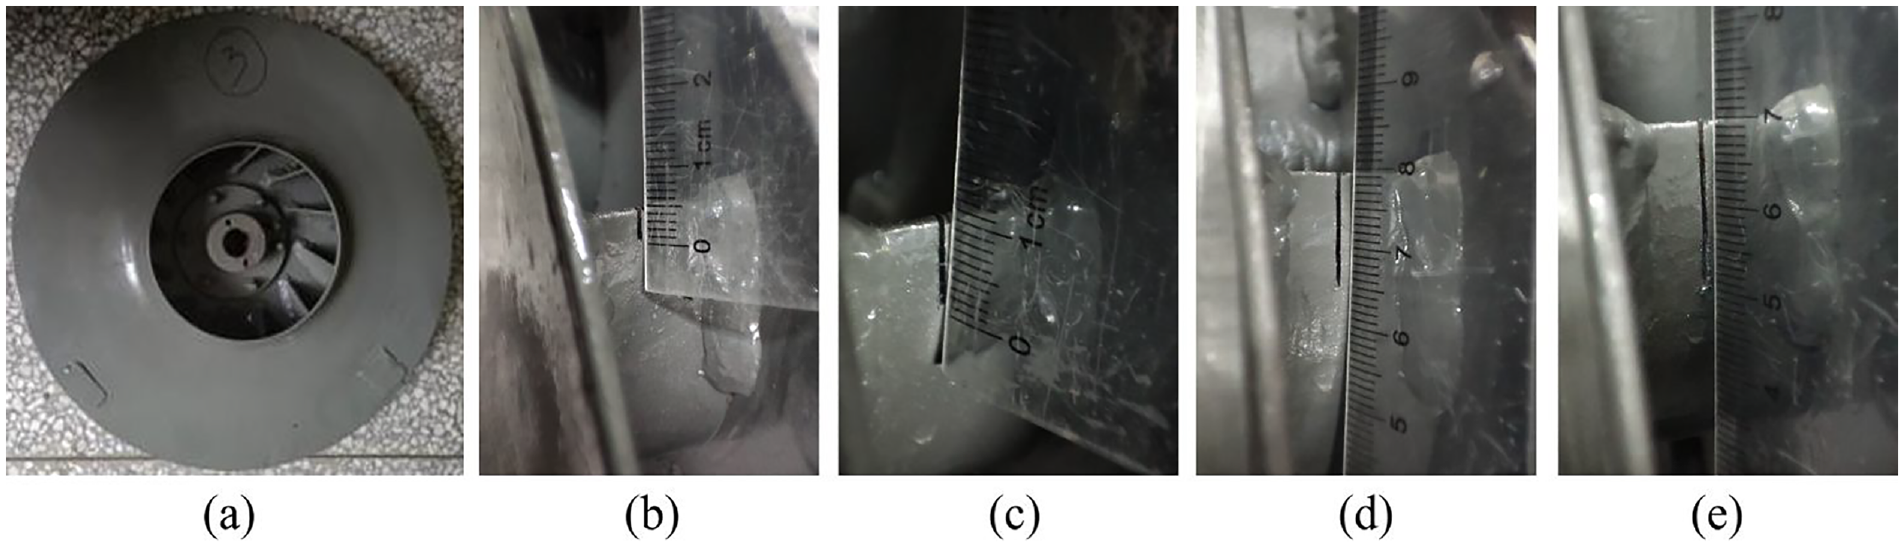
Five blade categories in test rig II: blade with the crack of (a) 0 mm, (b) 5 mm, (c) 10 mm, (d) 15 mm, and (e) 20 mm.
Using the proposed method, the accuracy of the classification task for five categories of blades is calculated to evaluate the proposed method with the results shown in Table 8. Also, −6 dB Gaussian white noise is added.
Results of the proposed method in test rig II.

MDFCNN, multiscale data-level fusion convolutional neural network.
From Table 8, it can be seen that MDFCNN using data-level fusion is more accurate than individual signals and decision level fusion can fully utilize the results of multiple models to achieve heel accuracy. So, the conclusion in test rig I are consistent with the conclusions in test rig II.
Conclusions
This paper presents a compressor blade crack detection method, which mainly consists of data-level fusion and decision-level fusion.
For data-level fusion, a MDFCNN is designed, which fuses homogeneous signals for blade crack detection. Multiple networks are trained with acoustic and vibration signals as inputs respectively for preliminary classification results along with the precision on the validation set.
For decision-level fusion, an improved DS theory approach is used for the final crack detection result according to the preliminary classification results and precision.
The proposed method is verified with experimental datasets of five categories of blades under four single and one mixed working conditions.
In this article, multilevel fusion is implemented for time domain signals. The comparison of other diagnostic methods reveals that acoustic and vibration signals contain wealthy information in time, frequency, and time-frequency domains. How to make full use of the multidomain information needs further study.
Footnotes
Declaration of conflicting interests
The author(s) declared no potential conflicts of interest with respect to the research, authorship, and/or publication of this article.
Funding
The author(s) disclosed receipt of the following financial support for the research, authorship, and/or publication of this article: This research is supported by the National Natural Science Foundation of China (Grant No. 51975117). The author would like to appreciate the anonymous reviewers for their valuable comments.
