
Abstract
Health monitoring of rolling bearings in aviation engines is critical for ensuring flight safety. As aircraft engines evolve toward higher thrust-to-weight ratios, increased loads, enhanced intelligence, and higher rotational speeds, the frequency of bearing failures has markedly increased, posing significant challenges to existing monitoring techniques. In response to the challenge regarding the monitoring and accurately diagnosing faults in the main bearings of gas turbine engines via a single detection method, a method for monitoring the state of rolling bearings is proposed based on the fusion of multichannel vibration signals and oil debris information. First, a weighted fusion model integrates data obtained from multiple vibration sensors. Subsequently, the complete ensemble empirical mode decomposition with adaptive noise (CEEMDAN) method is used to decompose the fused signal, and components with strong impulsive characteristics are selected based on kurtosis–correlation coefficient screening criteria for reconstruction. As a result, a vibration signal rich in bearing fault characteristic information is acquired. The total effective value is selected as the characteristic time-domain feature parameter, and the feature energy is introduced as the characteristic frequency-domain feature parameter. The fuzzy reasoning theory fuses the total effective value and feature energy for the first time into the vibration information parameter F1 by selecting the membership functions and the definition of fuzzy inference rules based on practical considerations and expert experience. Then, the measured number of oil metal debris is considered the debris information parameter F2. Based on the fuzzy reasoning theory, F1 and F2 undergo a second fusion analysis. Ultimately, the rolling bearing state is monitored, and the bearing faults are diagnosed. Experimental tests on the shedding of aircraft engine main bearings are conducted, where a vibration and oil debris detection system is installed to synchronously collect vibration and oil debris information throughout the bearing operation process. The proposed method is applied to analyze the collected data. The results indicate that the rolling bearing state monitoring method based on the fusion of multichannel vibration signals and oil debris information enables the comprehensive analysis of fault characteristics and the effective assessment of the bearing operation states.
Keywords
Introduction
Gas turbine engines (GTEs) are one of the most important components of aircraft, and their performance and reliability are crucial to flight safety. One of the key components of GTEs is the bearing system, which supports the rotating parts and ensures their smooth and efficient operation.1,2 GTE bearing failure can be caused by various factors, including wear, fatigue, corrosion, and contamination.3–5 Such failures can cause problems such as irregular vibrations, temperature increases, and abnormal sounds, adversely affecting engine performance and ultimately leading to catastrophic engine failure. Consequently, condition monitoring and fault diagnosis of GTE bearings are crucial to prevent accidents and ensure safety.
In recent years, signal processing technology has seen extensive development in industrial applications. Digital twin technology has enabled real-time monitoring and predicting of gear surface degradation due to high-precision signal processing algorithms, 6 significantly enhancing equipment health management capabilities. Additionally, the use of cyclostationarity properties of vibration signals in identifying gear wear mechanisms and track wear evolution 7 has become a critical tool in industrial applications. This approach can precisely identify the gear wear process and provide essential information for preventive maintenance. Furthermore, the fault information-guided variational mode decomposition (FIVMD) method 8 has demonstrated unique advantages in rolling bearing diagnostics. The FIVMD method enhances fault feature extraction by decomposing complex signals, particularly under strong noise conditions. Hence, fault diagnosis accuracy is significantly improved. Research in these emerging fields advances industrial equipment condition monitoring technology and offers additional intelligent and precise solutions for fault diagnosis under complex operating conditions.
Vibration detection is one of the main fault detection methods for GTE rolling bearings. The above method comprises several steps: signal acquisition, feature extraction, identification and detection status, and fault-type discrimination. Generally, it is difficult for conventional signal processing methods to extract sensitive features and diagnose faults. To this end, scholars have proposed wavelet transform, 9 empirical mode decomposition (EMD), 10 stochastic resonance,11,12 ensemble empirical mode decomposition (EEMD), 13 support vector machine (SVM), 14 neural networks, 15 variational mode decomposition (VMD), 16 and wavelet packet decomposition. Although the above signal processing methods can extract bearing fault characteristics, their application ranges differ significantly. Wang et al. 17 proposed a signal reconstruction method based on VMD and independent component analysis to classify rotor cracks, outer-ring bearing faults, and their coupling faults. Wang et al. 18 proposed an integrated fault feature and SVM to provide simultaneous high-precision and fast fault detection, which can quickly separate integrated fault feature signals. Wan and Wu 19 investigated the variation trend of time-domain parameters in the fault expansion process of rolling bearings. They analyzed the sensitivity of different time-domain parameters to faults. Tang et al. 20 adopted a complete set EMD with adaptive noise for time-domain feature extraction and simultaneously performed two fast Fourier transforms for deep frequency-domain feature extraction. Furthermore, recursive feature elimination combined with the chi-square test has been used to select the optimal feature subset from the obtained time–frequency features. Brusa et al. 21 proposed an algorithm to optimize the parameters required for de-noising based on the discrete wavelet transform and threshold methods. Xu et al. 22 developed a multidomain feature extraction method to extract diversified features from original signals; then, they used an unsupervised stacked sparse autoencoder network as a feature extractor to extract deep features from the original diversified features. Ye and Zhang 23 proposed a VMD optimized by Bayesian information criteria.
A dataset was constructed based on the separated vibration source signals. Moreover, an SVM optimized by an improved genetic algorithm was adopted for bearing fault diagnosis, which could effectively identify bearing faults. Luan et al.24,25 proposed a bearing fault characteristic energy calculation equation to diagnose bearing faults by improving the wavelet packet algorithm and taking the kurtosis value as an index. Sha et al.26,27 divided high-low signal-to-noise ratio signals by adjusting the relationship between normalized kurtosis and correlation coefficient to de-noise the vibration signals. The above studies demonstrate that indicators such as kurtosis value and correlation coefficient are highly effective in filtering out the periodic impact components related to bearing faults from vibration signals. Therefore, such indicators are useful for selecting signal components and reducing noise interference. Although vibration signals are sensitive to early bearing fault diagnosis, they often contain significant background noise that can obscure bearing fault features and hinder their adequate extraction. Thus, accurate diagnosis is challenging. Therefore, oil debris analysis must be incorporated to evaluate the bearing’s operational state.
The lubricating oil system is one of the indispensable components of GTEs. Its role is to lubricate and cool the rotating parts of the engine and serve as the transport medium for the abrasive wear on the rolling and sliding surfaces.28–30 GTE oil debris is mainly generated by the wear of the main bearings, return oil pumps, and other components. 31 Oil debris contains both metal and nonmetal materials. When a large amount of metal debris is detected in the oil, the main bearing will most likely undergo large-scale wear, leading to fatigue damage. To improve the diagnostic efficiency of oil systems, Zhang et al. 32 studied the diagnostic method of information fusion via an integrated intelligent algorithm. They mainly assessed the ferrography, spectrum, particle count, and other aspects. Du and Xiong 33 applied a backpropagation neural network in GTE fault diagnosis using its high parallelism and fault tolerance to monitor and diagnose the oil system. Wang et al. 34 designed a high-sensitivity inductance sensor for the detection of abrasive particles in the lubricating oil, which improved the detection sensitivity of the oil debris sensor. Bowen and Westcott 35 and Anderson 36 conducted in-depth studies to explore the correlation between particle size and five wear types. To monitor the condition of the equipment, GasTOPS Ltd. (Ottawa, ON, Canada) developed an oil debris monitoring (ODM) abrasive particle monitor, 37 which used two excitation coils and an induction coil to detect the interference of abrasive particles on the alternating magnetic field as they passed through the induction coil assembly. The monitor could detect spherical ferromagnetic and nonferromagnetic abrasive particles larger than 125 μm in pipes with a diameter of up to 0.5 inches, providing more accurate data support for equipment maintenance. On this basis, Ding and Wang 38 designed an oil wear monitoring sensor system and optimized the number of coils. By estimating the size of abrasive particles, their system could provide more timely and accurate warning signals in the early stages of equipment failure or wear. Madar et al. 39 statistically analyzed the severity of bearing damage based on an ODM wear particle monitor. Moreover, they divided the bearing expansion dimensions into three stages, that is, running-in, steady-state expansion, and accelerated expansion. They correlated the bearing damage quality with the failure conditions. In complex industrial machinery, a single sensor has certain limitations in comprehensively capturing information regarding the fault conditions. The above studies indicate that oil debris information is highly sensitive to fault diagnosis in the later bearing operation stages. Therefore, oil debris information can be integrated as a key parameter in bearing condition monitoring. Dempsey et al.40–42 integrated lubricating oil debris with vibration information to monitor the fatigue damage of bevel gears and roller bearings, achieving good results. Qiu et al. 43 developed a fusion method of vibration and online oil debris sensor data for predicting GTE bearing faults. They conducted an experimental evaluation on military engine differential bearings. Their results demonstrated that the fusion of the two signals improved the accuracy and robustness of bearing spalling detection. Therefore, it is necessary to use multiple sensors to diagnose all possible fault situations. In such a case, efficient information fusion is required to develop a reliable fault diagnosis system. The existing research has made some progress in monitoring the operational state of rolling bearings through the fusion of vibration and oil debris information. Nevertheless, the diagnostic accuracy of current methods still needs improvement, particularly under complex operating conditions. This statement is especially true for reducing the noise interference on the effective information within vibration signals.
Existing methods for bearing condition monitoring and fault diagnosis are mostly based on the vibration signals measured during bearing failures or the information obtained from collected oil debris. However, a single approach is often inadequate for accurate online condition monitoring of bearings. In response to the challenges of fault monitoring for rolling bearings in aircraft engines under complex operating conditions, this article proposes an innovative fault condition monitoring method based on the fusion of multichannel vibration signals and oil debris information. The key innovations of the proposed method are summarized as follows: (1) A weighted fusion model for multichannel vibration signals: By performing weighted fusion of data from multiple vibration sensors, the robustness of the signals is effectively enhanced, improving the capability to extract fault features. (2) Complete ensemble empirical mode decomposition with adaptive noise (CEEMDAN) decomposition combined with the kurtosis–correlation criterion: CEEMDAN is used to decompose the fused signals, and high-impact components are selected using the kurtosis–correlation criterion, significantly improving fault feature extraction accuracy, especially in noisy environments. (3) Introduction of feature energy and fuzzy reasoning fusion: Feature energy is introduced as a frequency-domain feature parameter, which is fused with the total effective value of time-domain features using fuzzy reasoning for the first level of fusion, providing a more comprehensive representation of bearing operating conditions. (4) Comprehensive fusion of oil debris information and vibration parameters: Vibration parameters and oil debris information are further fused through fuzzy reasoning, enabling multidimensional fault feature analysis and enhancing fault diagnosis accuracy and reliability. Experimental validation under complex operating conditions demonstrates that the proposed method, based on the fusion of multichannel vibration signals and oil debris information, offers significant advantages and provides more reliable technical support for fault diagnosis and condition monitoring of aircraft engines.
Theoretical method
CEEMDAN algorithm
Based on the calculation principle of EMD, CEEMDAN combines the advantages of multiple Gaussian white noise superpositions to the original EEMD signal to eliminate noise. Nevertheless, after CEEMDAN, the intrinsic mode function (IMF) component of adaptive white noise is obtained a limited number of times, reducing the overall average calculations. The error of the signal components generated after EEMD decomposition is minimized and the disadvantage of mode aliasing in EMD decomposition is compensated.
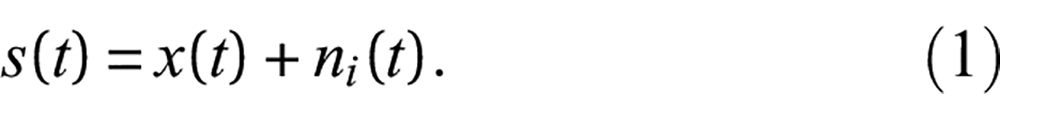
First, Gaussian white noise ni(t) (i = 1,2,…,N) is added to the original vibration signal x(t):
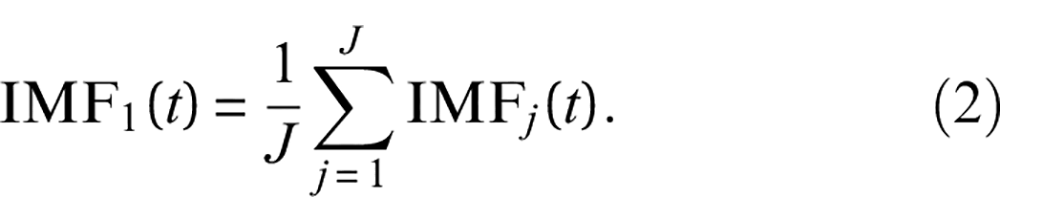
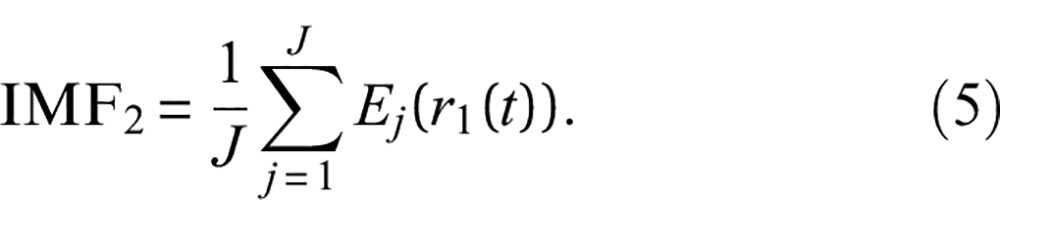
Subsequently, the signal with Gaussian white noise is decomposed according to the EMD method to produce J inherent modal components, where Ek(t) (j = 1,2,…,J) represents the Jth inherent mode component generated by EMD decomposition. Average calculation of the generated j inherent mode components is performed to obtain the first-order inherent mode component IMF1(t) generated by CEEMDAN:
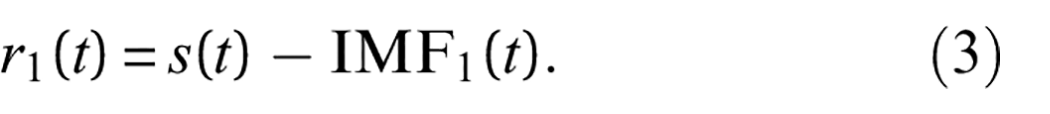
Simultaneously, the first residual signal r1(t) is generated:
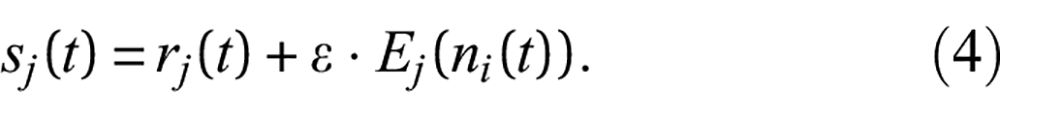
The operator Ej(·) is defined as the Jth mode component generated after EMD decomposition, and sj(t) represents the signal after adding Gaussian white noise to the Jth-order signal margin:
It can be observed that the second-order intrinsic mode component generated by CEEMDAN is
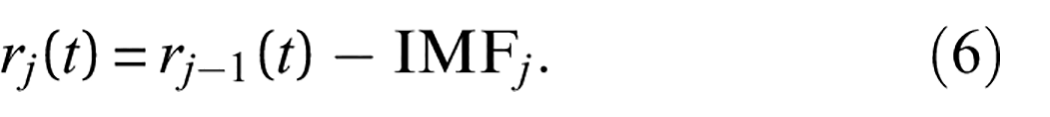
According to this principle, the signal margin of each order can be calculated to obtain the j (j > 1) signal margin:
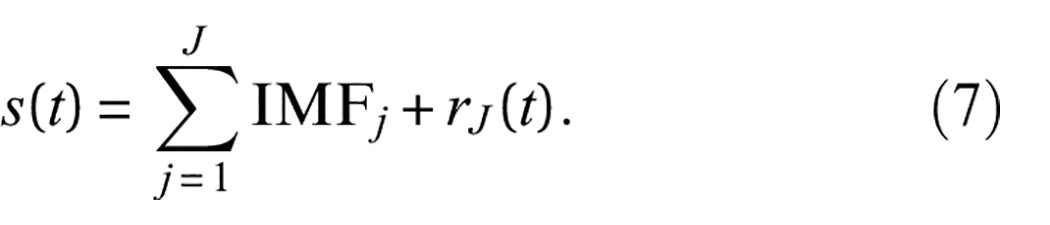
Next, the original vibration signal undergoes multiple EMD decompositions until the signal margin generated after the Jth decomposition cannot be decomposed further; then, the CEEMDAN process ends, and the expression for the vibration signal becomes as follows:
Since the CEEMDAN algorithm mitigates mode mixing by introducing white noise, selecting and handling the noise impacts the decomposition results. Inappropriate noise selection or excessive noise amount may lead to new, unnecessary components affecting the accuracy and effectiveness of the decomposition. Therefore, the Improved complete ensemble empirical mode decomposition with adaptive noise (ICEEMDAN) algorithm is introduced, where the noise added in each iteration is adaptively adjusted based on signal characteristics. White noise is selected as the Kth IMF component after EMD decomposition. This approach better eliminates mode mixing and improves the decomposition quality.
A composite signal was generated to validate the advantages of the ICEEMDAN algorithm by superimposing a low-frequency sinusoidal signal and a high-frequency intermittent signal. The sampling frequency was set to 400 Hz, with the low-frequency sinusoidal signal denoted as
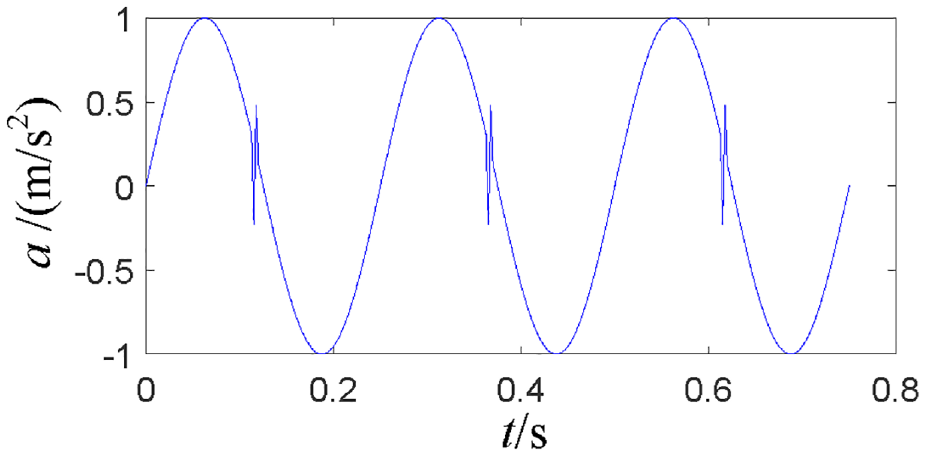
Original time-domain diagram of the composite signal.
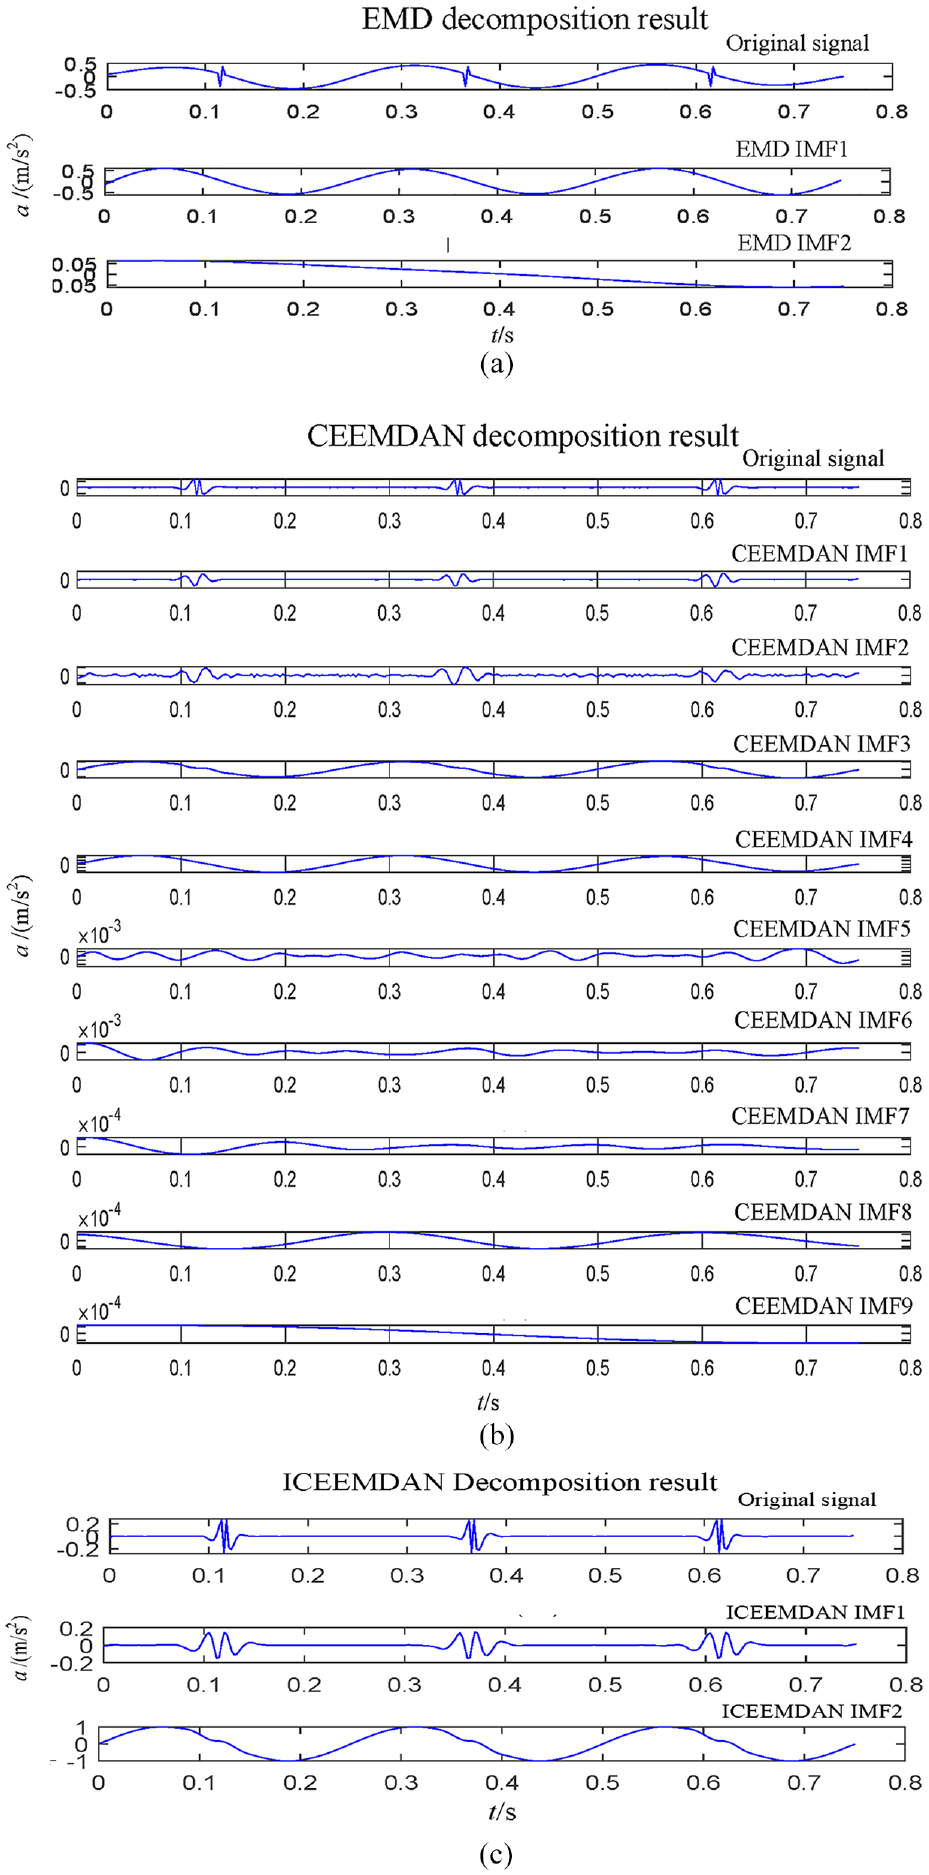
Decomposition results of different methods.(a) EMD. (b) CEEMDAN. (c) ICEEMDAN.
Weighted fusion model for multichannel vibration information
When multiple similar sensors measure the same target object, due to the complexity and uncertainty of the working environment, their measurement data are associated with problems such as outliers, as well as incomplete and even inconsistent detection targets. A multichannel vibration information fusion model is established to comprehensively suppress the irregular information collected by the vibration sensors and improve the impact components highly related to the bearing fault characteristics. Data from multiple similar vibration sensors are collected simultaneously, and the
where
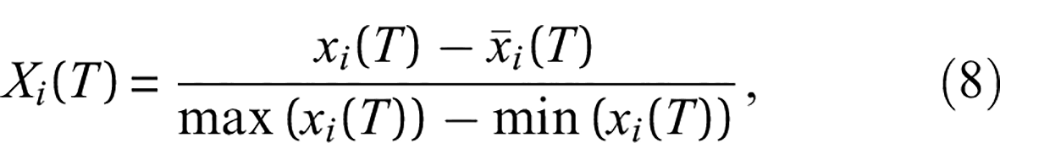
The phase relationship between
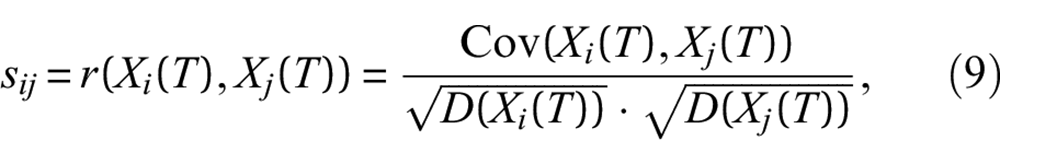
where r(X, Y) is the Pearson’s correlation coefficient of the X and Y variables, Cov(X, Y) is the covariance of the X and Y variables,
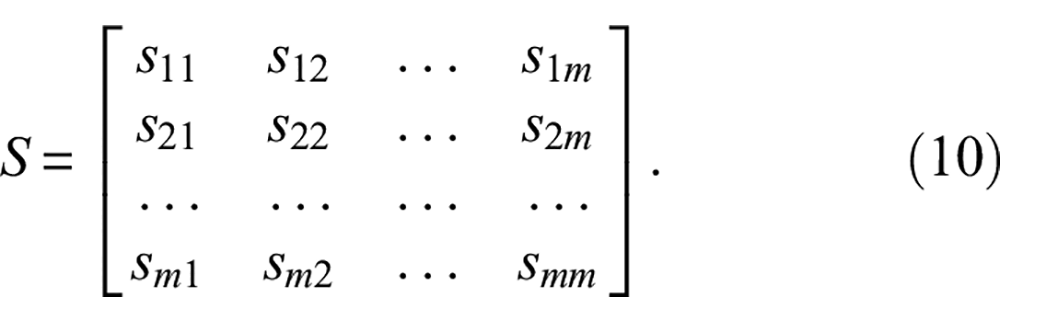
Subsequently, the correlation support matrix S is constructed as follows:
Therefore, in the period T, the support degree of all sensors (except sensor i) to sensor i is
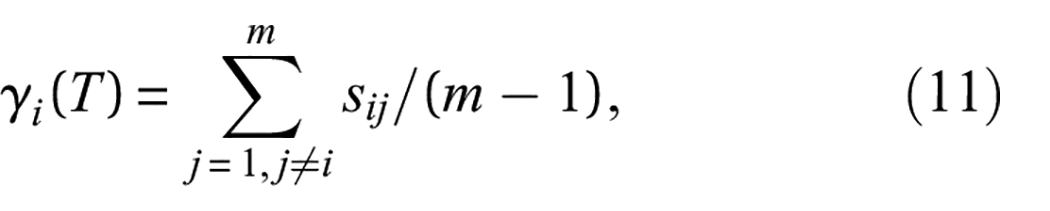
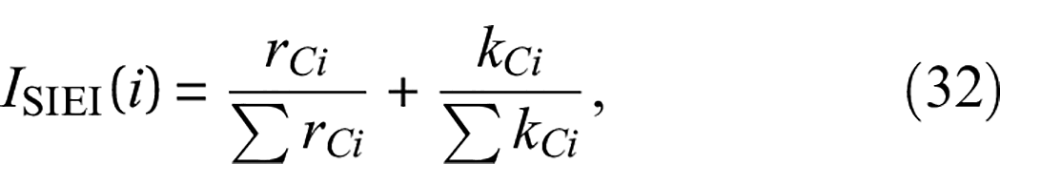
where
Support
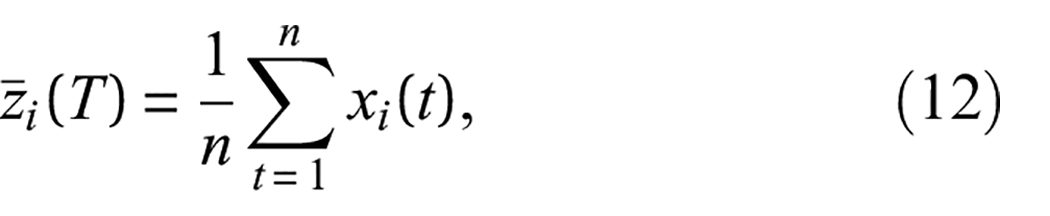
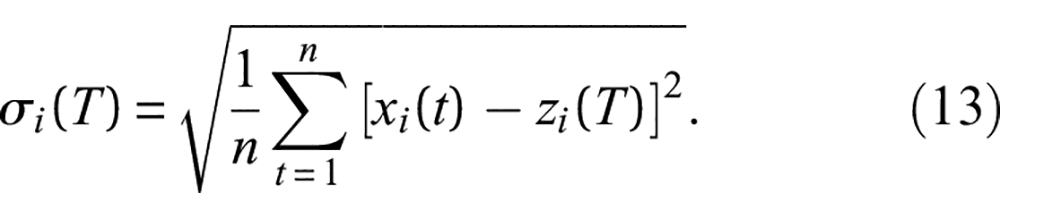
The variation factors are defined as follows:
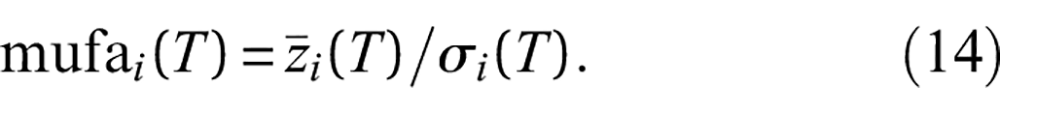
In general, among the data collected by the actual vibration sensor, those with higher impact components of fault characteristics have a larger standard deviation and a smaller mean value. Therefore, the variation factor is used to assess the reliability of the sensor data during the detection period. The larger the variation factor, the lower the reliability.
After considering the support degree between similar sensors and the reliability of each sensor itself, the weighted fusion model is used to complete the data fusion between similar sensors. The final weighted fusion expression is as follows:
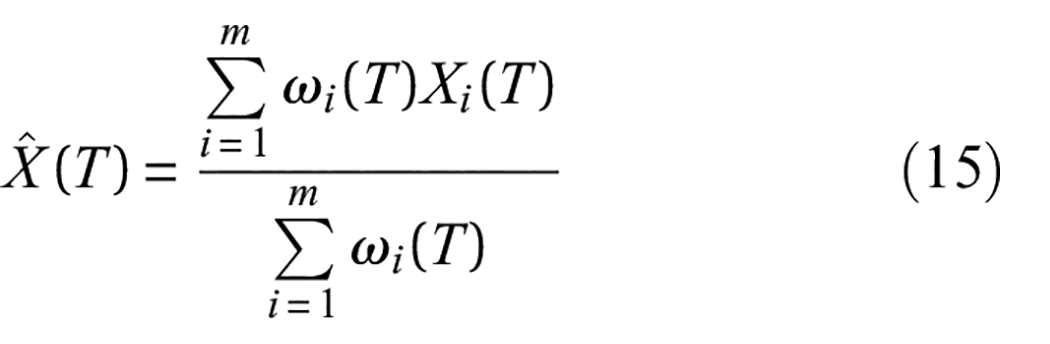
where
Kurtosis index: correlation coefficient screening criteria
After the multichannel vibration information has been fused by the proposed weighted fusion model, more effective vibration information can be extracted via CEEMDAN. To comprehensively screen and divide the strong and weak impact components among the J inherent modal components generated via CEEMDAN, the signal component division index S is set as the standard index and C as the comparison index.
According to the correlation coefficient, the threshold T is set, which is expressed as follows:
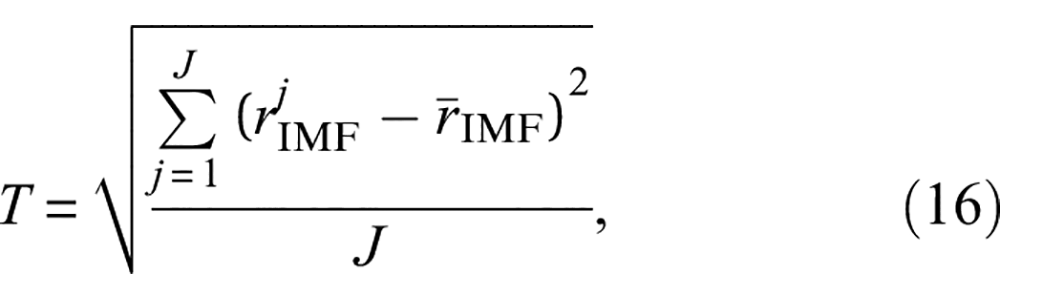
where
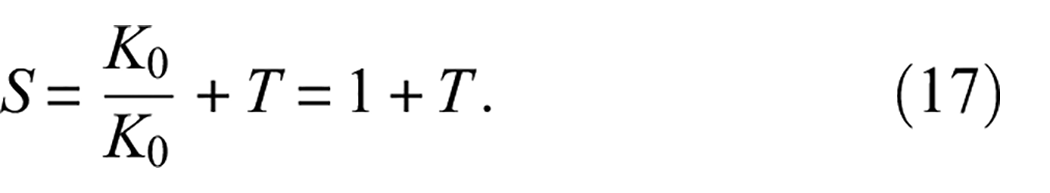
Subsequently, the standard index S is the sum of the threshold value, and the normalization result of the original vibration signal kurtosis index K0, that is, the ratio of the original vibration signal kurtosis index K0 to itself:
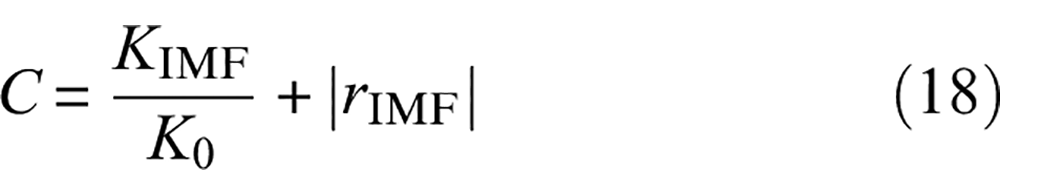
The comparison index C is set as the sum of the ratio of the kurtosis index KIMF of each inherent modal component to the original vibration signal K0 and the absolute value of the correlation coefficient between each inherent modal component and the original vibration signal:
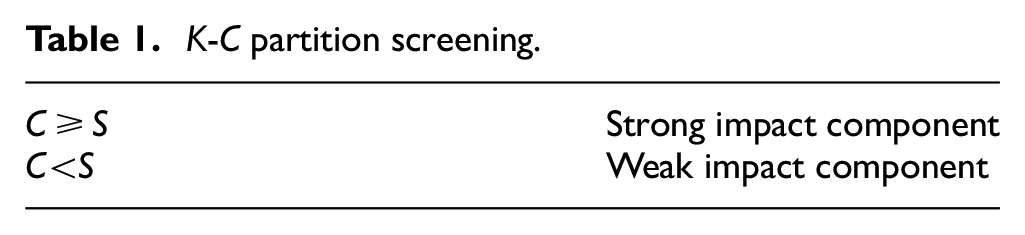
Then, the standard index S is compared with the comparison index C. If
K-C partition screening.
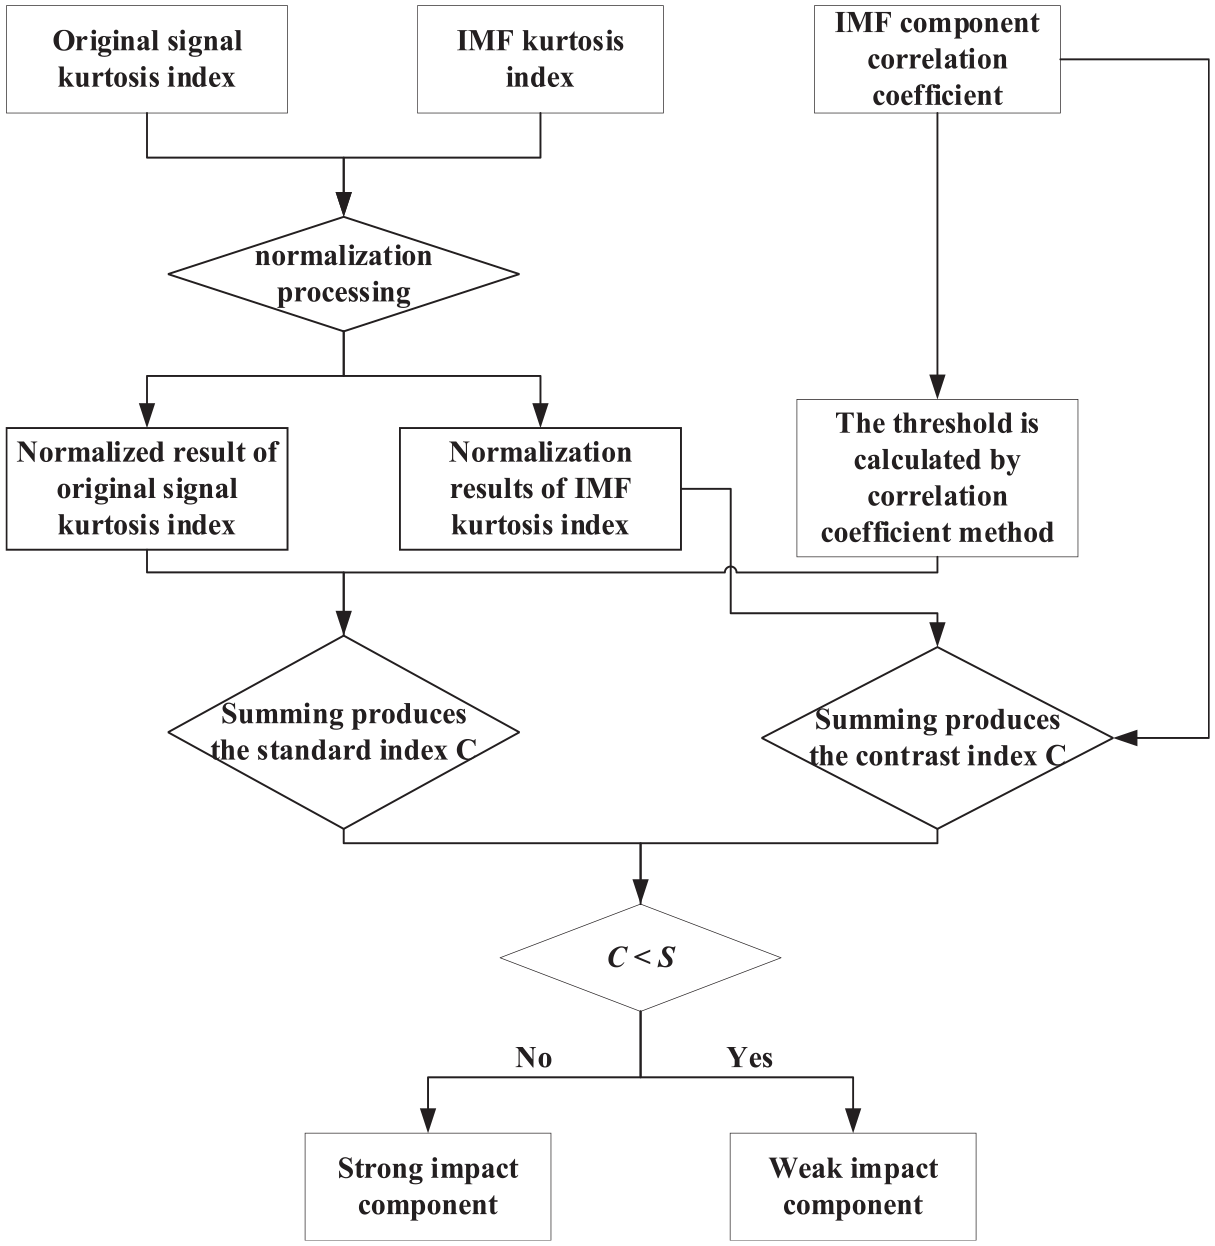
Kurtosis – correlation coefficient screening criteria.
Through the superposition of strong impact signal components, a one-dimensional strong impact signal is generated. After comprehensive screening according to the kurtosis index and correlation coefficient, the strong impact signal retains the impact component to the maximum extent and the effective information with a high correlation with the original vibration signal, effectively filtering out the noise component. The kurtosis index – correlation coefficient screening criteria provide the conditions for accurately extracting the characteristic parameters in the frequency domain.
Time-domain characteristic parameters
Time-domain signal analysis is one of the most important criteria for fault diagnosis of rolling bearings. In vibration signal analysis, the root mean square (RMS) and peak values are two basic parameters used to describe the size and characteristics of vibration signals. These values can be used to evaluate mechanical systems’ motion state and potential failure.
The effective value of a vibration signal refers to the average RMS value of the vibration signal amplitude in a certain period. It can reflect the strength and amplitude of the vibration signal within that period, and its equation is as follows:
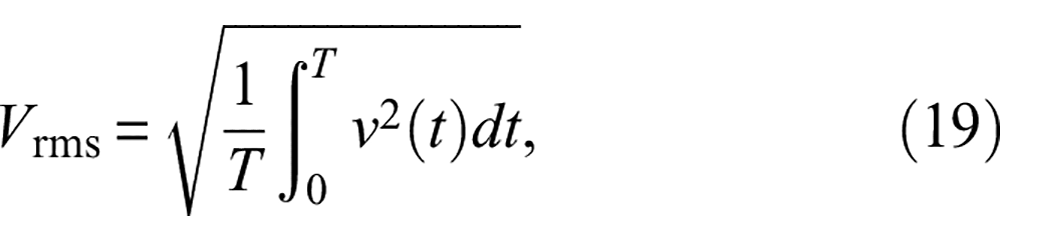
where Vrms is the effective value of the original vibration signal, v(t) is the amplitude at time t, and T is the period.
To comprehensively characterize the RMS value of vibration signals in a period T, the mean RMS value of multichannel vibration signals in T is calculated as the total RMS value:
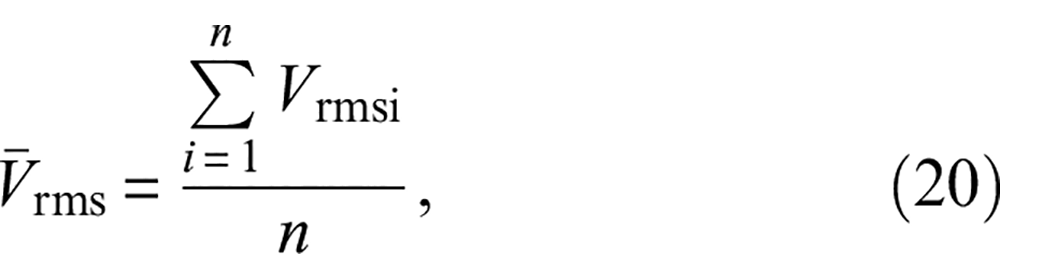
where
The RMS value is the basic parameter in vibration signal analysis and an important index to evaluate the running state of GTE rotor systems. In practical applications, it can be combined with other comprehensive analysis factors to evaluate the operating state of rotor systems.
Frequency-domain characteristic parameters
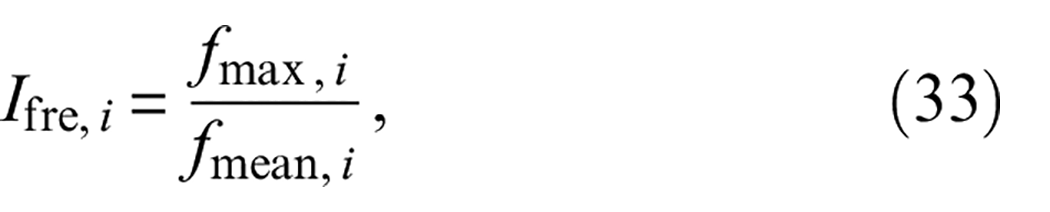
The frequency-domain information of vibration signals can characterize the running state of a bearing to a certain extent. The fault characteristic frequency of a rolling bearing can be extracted from the frequency-domain diagram. However, the correlation analysis of bearing fault information, such as the fault characteristic frequency with time-domain parameters and oil debris information, is associated with certain limitations. Therefore, the definition of the characteristic energy is introduced as the fault damage index of rolling bearings to conduct an in-depth analysis of vibration signals based on frequency-domain information.
The fault information energy E is introduced to characterize the different damage degrees of GTE rolling bearings. Energy E can be defined based on the rolling bearing parameters and vibration characteristics. E can be expressed by taking the outer-ring fault as an example:
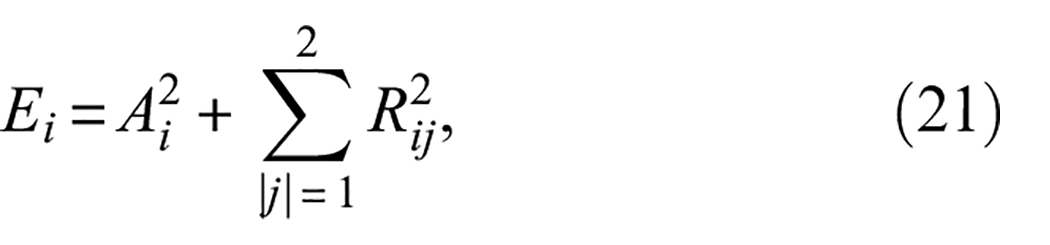
where Ai(i = 1,2,…,n) is the peak value of the ith-order fault characteristic frequency of the outer ring of the rolling bearing, and Ri is the modulation frequency of the fault characteristic frequency and the rotation frequency. The modulation frequency refers to the sum or difference of the fault characteristic frequency and m times the rotation frequency. To characterize the advantage of the peak fault signal value in the frequency band, the frequency band energy W is introduced, which can be expressed as follows:
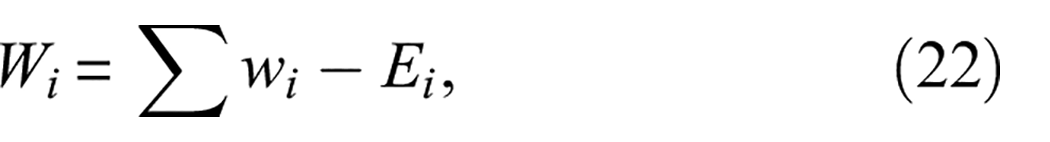
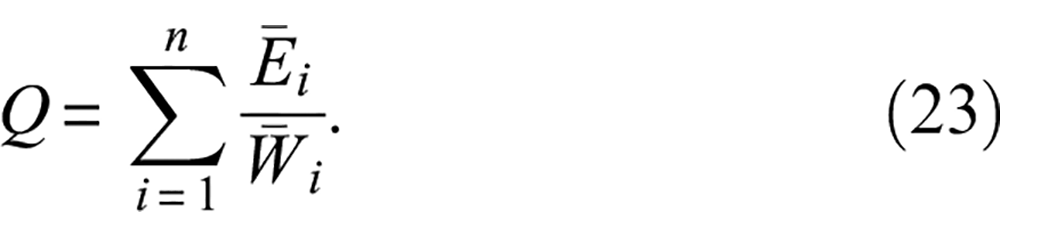
where wi (i = 1,2,…,n) is the peak value in the ±500 Hz frequency band at the ith order fault characteristic frequency of the rolling bearing outer ring. The ratio between the average value of the n-order fault information energy and the average frequency band energy of the corresponding order is calculated. The characteristic energy Q for bearing fault diagnosis is established, which is expressed as follows:
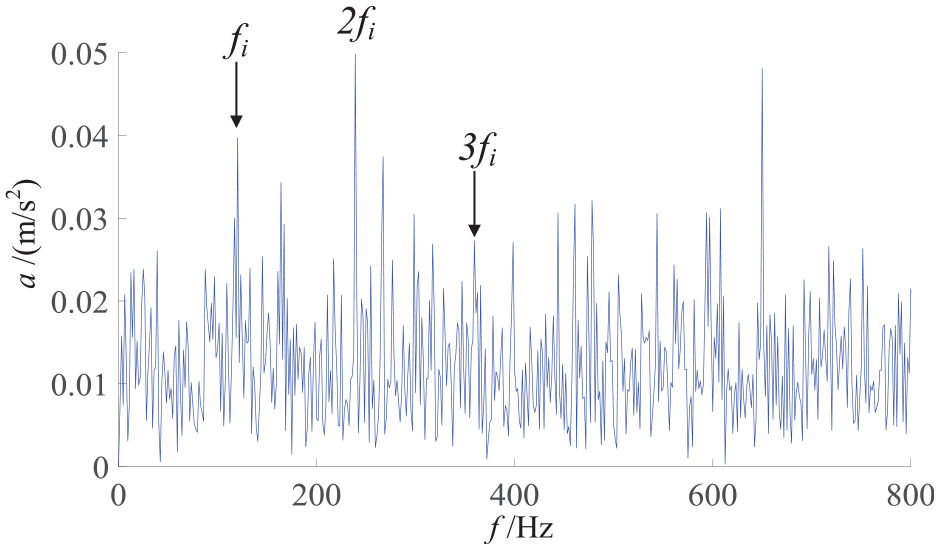
The vibration signals of this GTE type were statistically analyzed to ensure the accuracy of fault identification. The characteristic energy was calculated by taking the first three fault characteristic frequencies in the frequency domain and the two modulation frequencies on the left and right of the rolling bearing vibration signals. The definition of the characteristic energy is exhibited in Figure 4; a plot of the fault and modulation frequencies is shown in Figure 5, where A1, A2, and A3 correspond to the fault characteristic frequency and its multiplication.
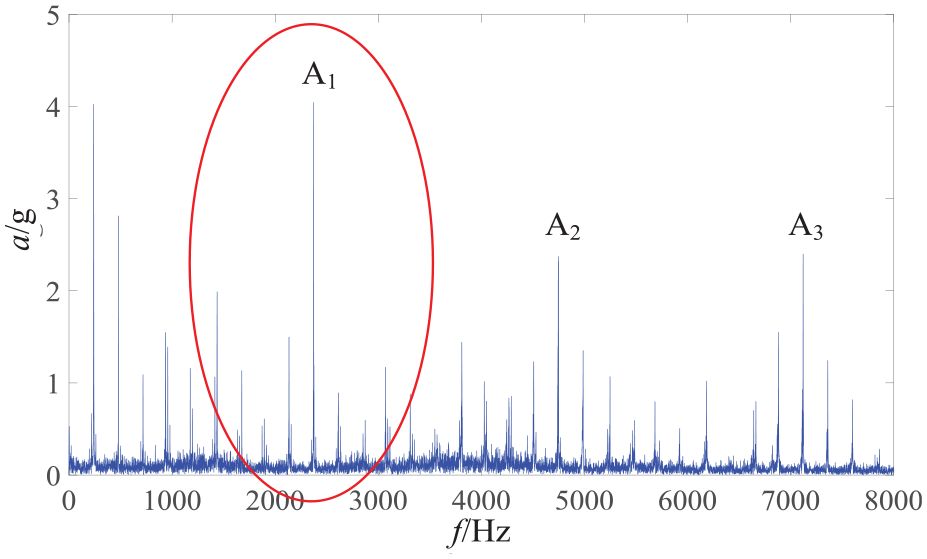
Characteristic energy definition. Red circle represents the local details of this frequency band, as shown in Figure 5.
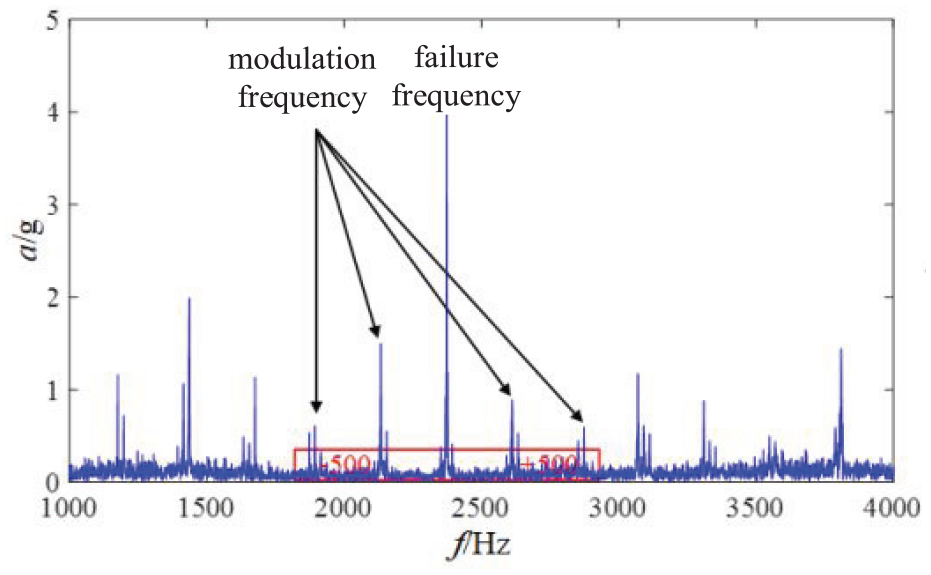
The failure and modulation frequencies.
The characteristic energy can quantify the bearing fault information in the frequency domain of the rolling bearing vibration signal. Thus, it can more intuitively and accurately describe the bearing operating state and fault information in the frequency-domain diagram.
Analysis of oil debris detection methods
Oil debris refers to the metal particles existing in the lubricating oil of the equipment, which are produced due to equipment wear, metal cutting, and other reasons. Online monitoring of oil debris is a method to monitor the running state of equipment and predict faults in real-time. Particle counting is one of the most commonly used online lubricating ODM methods. It is a method used to assess the operating state of equipment and predict failure by detecting the change in the number of particles in the lubricating oil. The basic principle is to monitor and count the number of particles in a lubricating oil sample in real time through a particle counter. This way, the change curve of the particle concentration in the lubricating oil can be obtained over time. The number of particles increases significantly when the equipment experiences abnormal wear or failure. In addition, the particle concentration curve changes. Therefore, by monitoring and analyzing the changes in the number and concentration of particles in the lubricating oil, abnormal wear, or failure of the equipment can be detected in time.
The equation for calculating the particle concentration is as follows:
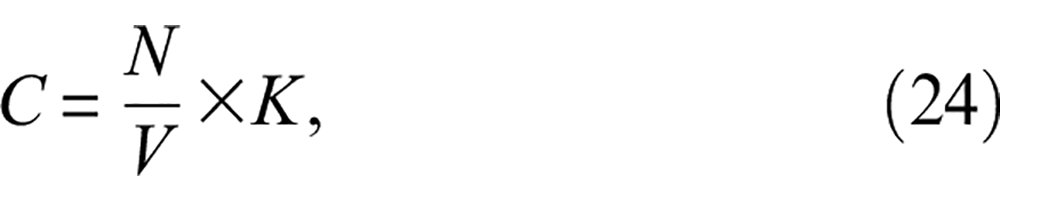
where C represents the particle concentration (number of particles per millilitre of lubricating oil), N denotes the number of particles in the lubricating oil sample, V represents the sample volume (mL), and K is the correction factor used to correct the sensitivity and measurement error of the particle counter, which is usually set equal to 1.
The signal of the oil metal chip sensor is a modulation process, which is presented in Figure 6.
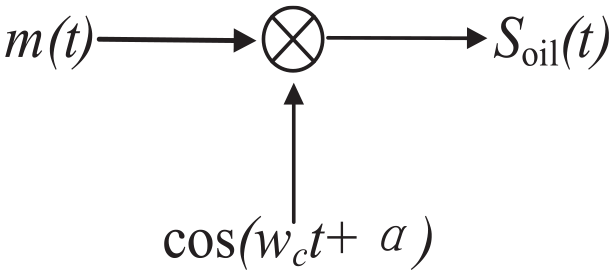
Oil debris sensor modulation principle.
where m(t) is the signal generated when particles pass through under DC excitation,
The following relationship is obtained:
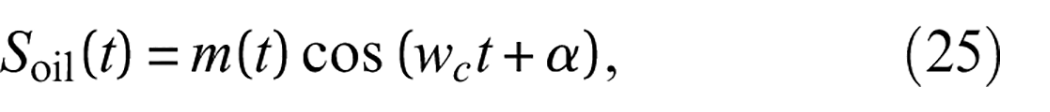
which can be converted to
where m(t) is the time-domain signal.
Fuzzy reasoning theory
Fuzzy reasoning is based on fuzzy logic, which can deduce a fuzzy conclusion under conditions involving imprecise, fuzzy, and incomplete information. In mechanical system fault diagnosis, fuzzy reasoning can be used to assess the state of mechanical systems and diagnose possible faults. The fuzzy reasoning process typically involves several steps, including fuzzy processing, fuzzy rule setting, fuzzy logic reasoning, and clear output generation. The fuzzy rule-setting process is the core of fuzzy reasoning, a knowledge expression described by fuzzy language. Fuzzy rules are composed of two parts, that is, the former and latter parts. The former describes the fuzzy variables’ fuzzy relation, and the latter describes the fuzzy value of the fuzzy output. For instance, in the fault diagnosis of mechanical systems, a fuzzy rule can be expressed as follows: if the vibration is large and the number of oil debris is large, the mechanical system is faulty. Among them, the ‘large vibration’ and ‘large number of oil debris’ parts are fuzzy variables whose membership function has been determined in the fuzzy processing. On the other hand, the “mechanical system failure” part is the fuzzy output, and its fuzzy value needs to be calculated in the subsequent reasoning process.
Fuzzy logic reasoning is the key process of fuzzy reasoning. It obtains the fuzzy output value through fuzzy operations on the preceding and following parts of the fuzzy rules. The most commonly used fuzzy logic operations include fuzzy intersection, union, and complement. These operations can be achieved via logic gates. Based on the set membership function and fuzzy rules, the Mamdani fuzzy reasoning method was used to perform logical reasoning. Figure 7 illustrates a schematic diagram of fuzzy reasoning logic.
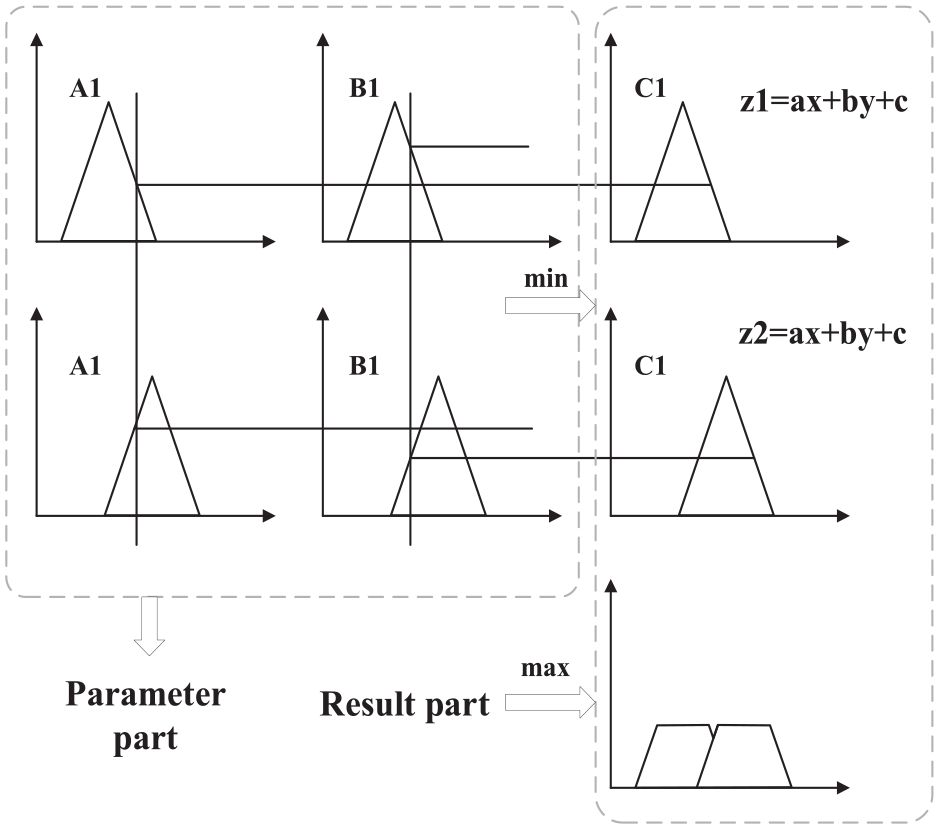
Fuzzy reasoning logic diagram.
In fuzzy logic, the membership function refers to the relationship between fuzzy variable values and fuzzy sets. A fuzzy set refers to a specific variable; its value can be divided into several fuzzy intervals, each with a corresponding membership degree. The fuzzy membership function describes these fuzzy intervals. Several membership functions exist, for example, triangular, trapezoidal, Gaussian, and generalized bell functions.
The trapezoidal membership function is a common membership function with a trapezoid-like shape. Unlike the triangular membership function, the trapezoidal one rises and falls more smoothly, allowing it to describe certain intermediate states. It is expressed as follows:
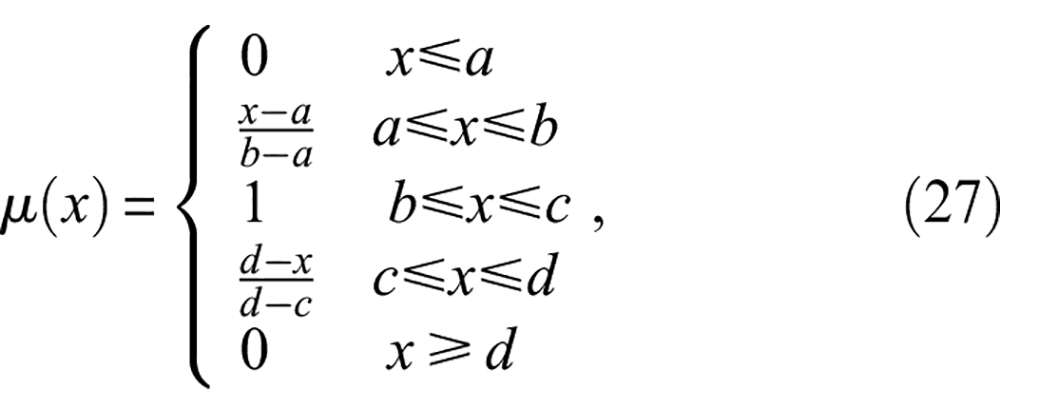
where a, b, c, and d are the four vertices of a trapezoid.
The generalized bell membership function generalizes the Gaussian membership function to multidimensional cases. Its shape resembles a multidimensional bell curve. It often describes the membership relationship between the multidimensional fuzzy variable value and a certain multidimensional fuzzy set. Its functional form is
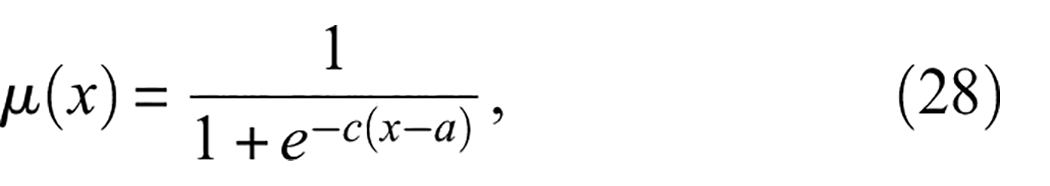
where a represents the central position of the generalized bell membership function, and c controls the function’s slope.
Rolling bearing state monitoring based on multichannel vibration signals and fusion with oil debris information
Since it is difficult for a single detection method to monitor and diagnose the condition of GTE rolling bearings, this article uses a multichannel vibration information fusion model and a coefficient screening criterion for kurtosis correlation to extract the vibration information after noise reduction. Then, this is fused with the oil debris information to finally monitor the running state of the rolling bearings and diagnose faults:
(1) The data acquired by multiple vibration sensors are weighted and fused into a one-dimensional signal through a multichannel fusion model.
(2) CEEMDAN is used to decompose the fused signal. The strong impact component is selected for reconstruction based on the kurtosis correlation coefficient screening criteria. Then, a vibration signal rich in bearing fault characteristic information is obtained.
(3) The total effective value of the original vibration signal is selected as the time-domain feature parameter. In contrast, the feature energy of the de-noised vibration signal is selected as the frequency-domain feature parameter. Based on the fuzzy reasoning theory, the above two parameters are fused into the vibration information parameter F1 for the first time.
(4) The measured number of metal chips in the lubricating oil is the information parameter F2. Fusion analysis of F1 and F2 is performed for a second time based on the fuzzy reasoning theory. Lastly, based on the output results, the rolling bearing state is monitored, and the bearing fault is diagnosed.
The monitoring process of the bearing running state is depicted in Figure 8.
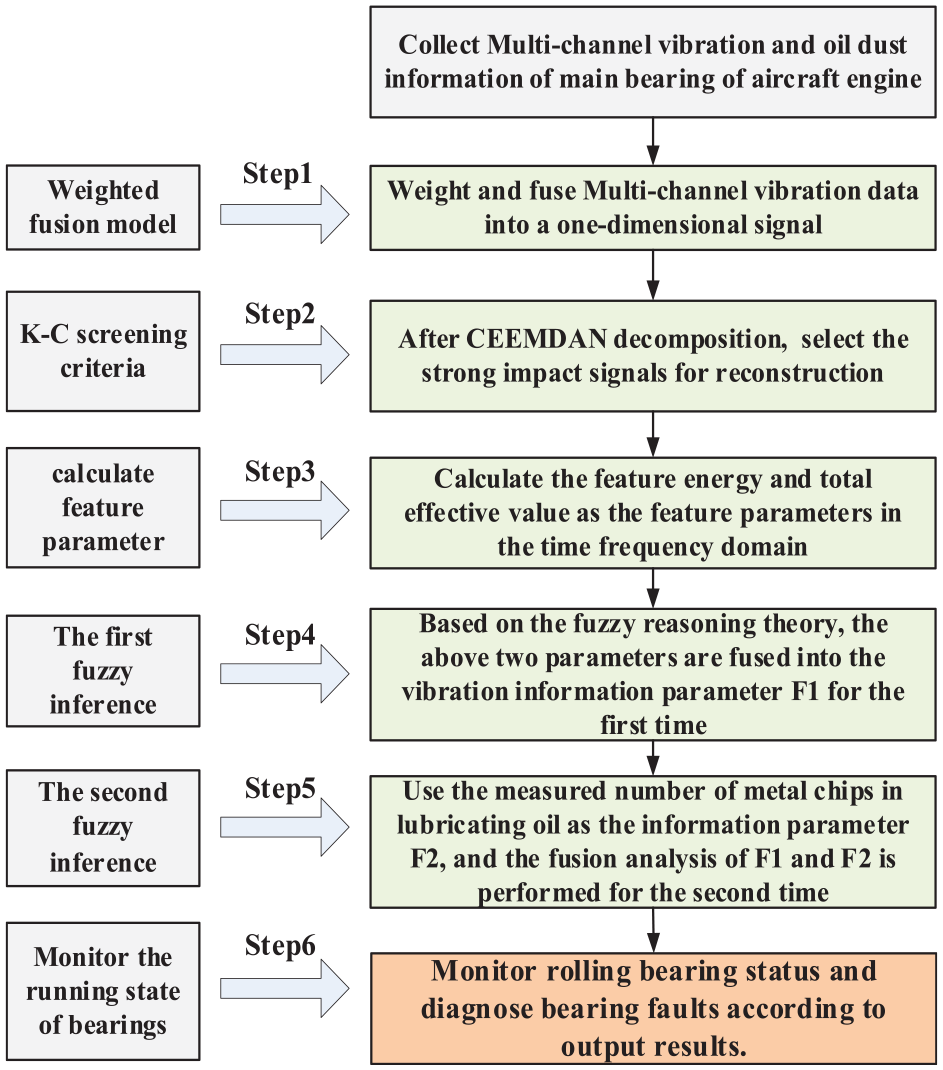
Flowchart illustrating the monitoring process for the rolling bearing operating state.
Comparison and verification of simulation signals
The inner race fault response function is constructed, and weak bearing fault signals obscured by noise are simulated in actual operating conditions by adding Gaussian white noise 44 :
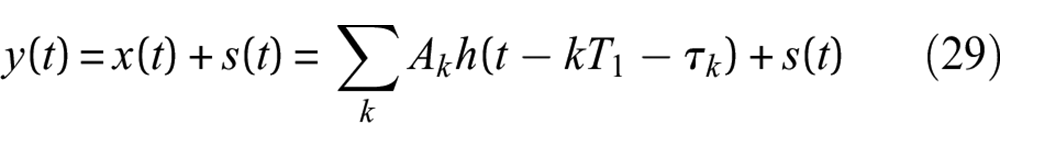
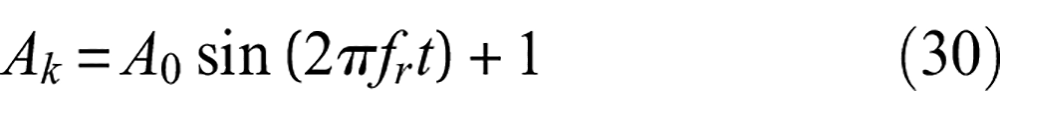
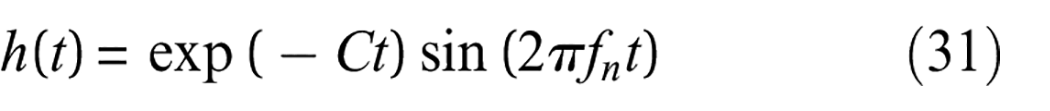
The parameters are as follows: A0 = 0.500; rotational frequency fr = 25 Hz; attenuation coefficient C = 800; Gaussian white noise s(t) is set with signal-to-noise ratios of −1, −2 and −3 dB to simulate three channels of signals affected by varying noise levels. The simulated signal time-domain plots are shown in Figure 9. The time-domain and envelope spectra of the three channels with added Gaussian white noise are shown in Figure 10. The impulsive components are obscured by noise in time-domain plots. In contrast, the characteristic frequency components related to bearing faults are very weak in the envelope spectra.
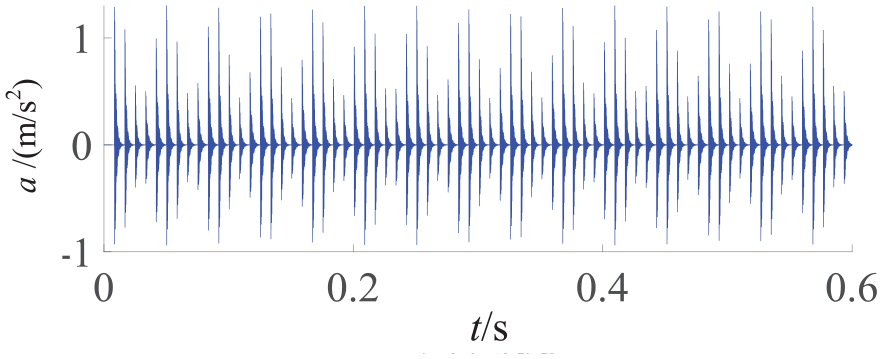
Original signal time domain plot.
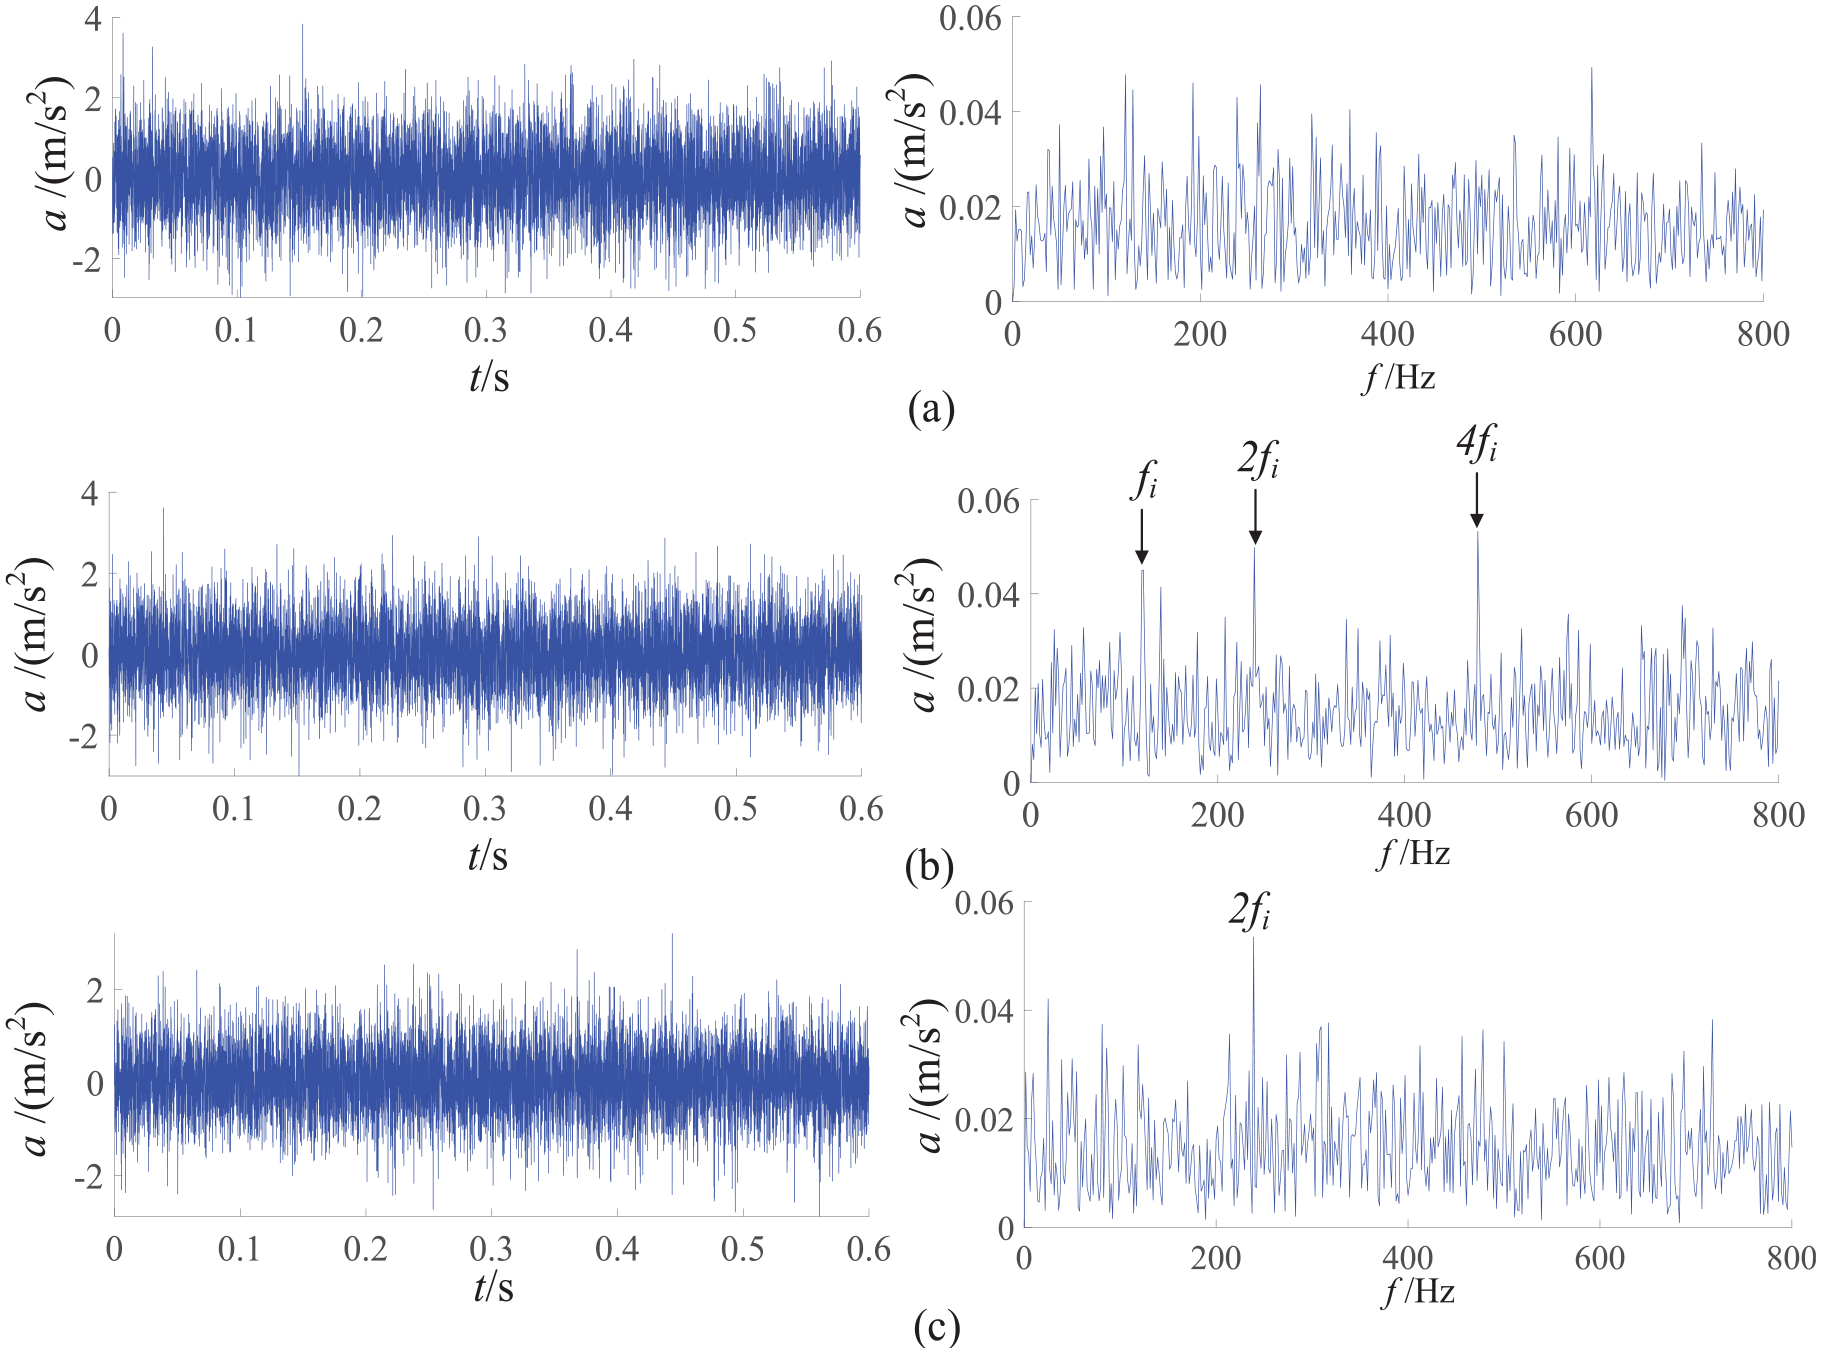
Time domain and frequency domain plots of three channels after adding different noise levels: (a) First channel time domain and frequency domain diagram, (b) Second channel time domain and frequency domain diagram, and (c) Third channel time domain and frequency domain diagram.
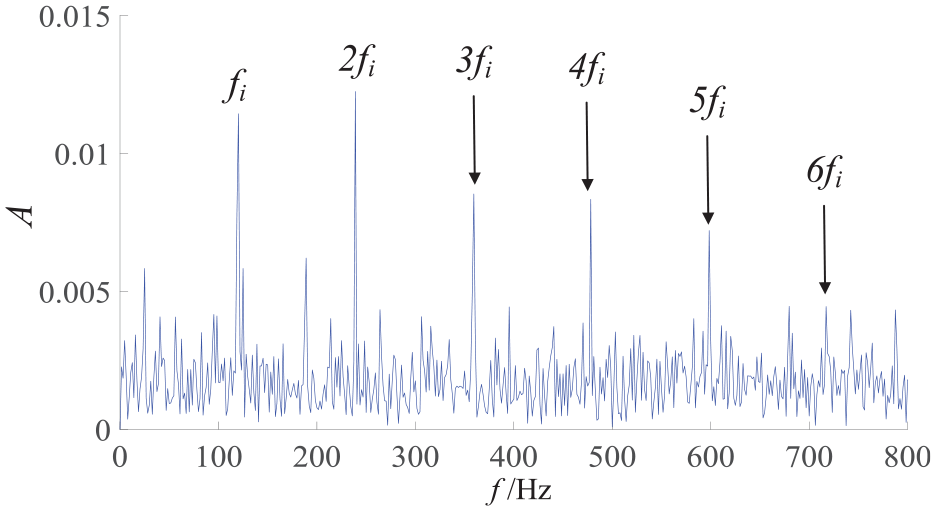
The search bandwidth for the fault feature energy Q was set to ±1 Hz around the fault characteristic frequency to visually compare the advantages of the proposed method in retaining fault-related information. A higher Q value indicates a more pronounced bearing fault feature. The theoretical characteristic frequency of the inner race fault simulation signal is 120 Hz. A weighted fusion model using multichannel vibration information was applied to merge the three-channel signals. The resulting fused signal was subjected to envelope demodulation, as shown in Figure 11. Compared to the envelope spectra of the three-channel signals in Figure 10, Figure 11 identifies the fault characteristic frequency and its harmonics (one to five times the fundamental frequency). However, significant interference can still be found around the characteristic frequency, especially near the three to five times harmonics. The calculated fault feature energy Q is 86. Additional processing of the fused signal using the kurtosis–correlation coefficient selection criterion and ICEEMDAN decomposition highlighted strong impulsive components, resulting in a new time-domain signal shown in Figure 12. The impulsive components are enhanced. The envelope analysis of this new signal (Figure 13) identifies the fault characteristic frequency and its harmonics (one to six times the fundamental frequency). The calculated fault feature energy Q is 124. Thus, the kurtosis–correlation coefficient selection criterion highlights fault feature information and suppresses interference components.
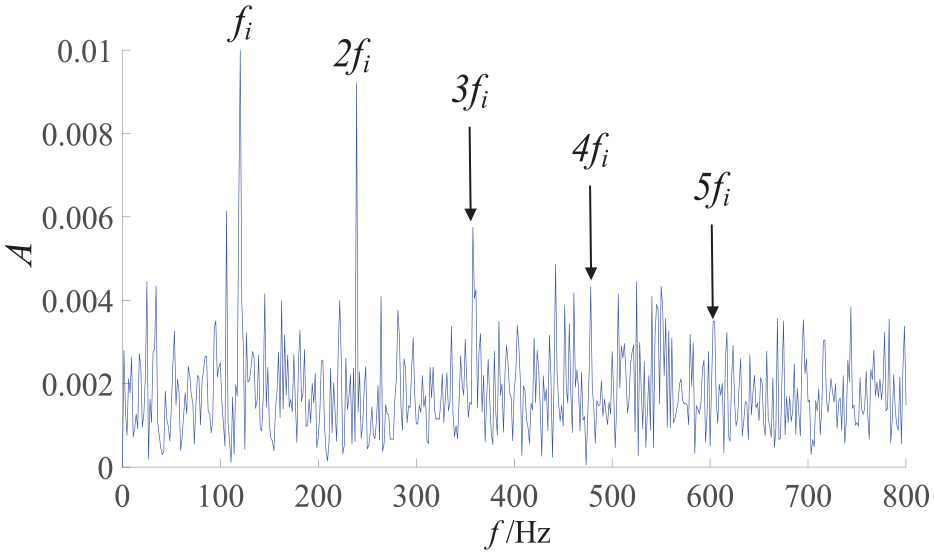
Signal envelope spectrum after weighted fusion of multichannel vibration information.
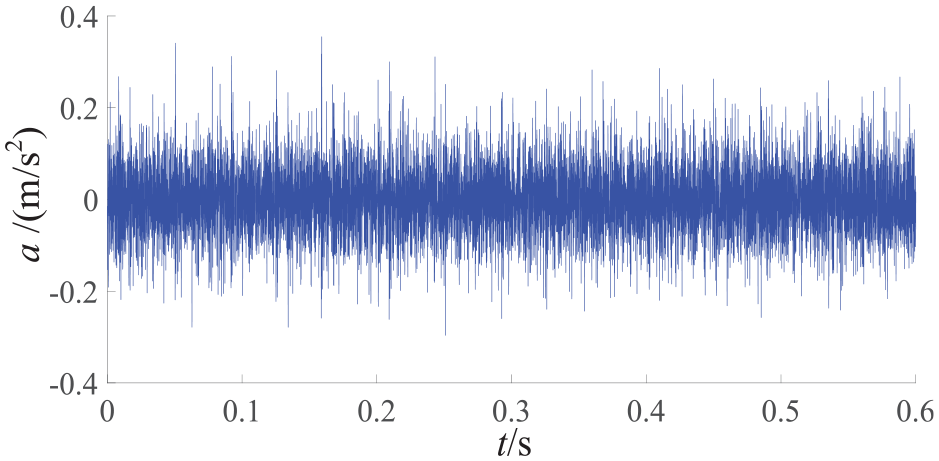
Reconstructed time-domain signal.
Reconstructed signal envelope spectrum.
The three-channel signals were processed using the kurtosis–correlation coefficient selection criterion to validate the advantage of the multichannel vibration information weighted fusion model in preserving effective information. The resulting reconstructed signals produced envelope spectra shown in Figure 14(a) to (c). The fault characteristic information identifiable in these spectra is quite limited. The calculated fault feature energies, Q, are 35, 42, and 51 for spectra shown in Figure 14(a) to (c), respectively. This observation indicates that the dominance of fault characteristic information in the envelope spectra is significantly less than the signals processed using the multichannel vibration information weighted fusion model.
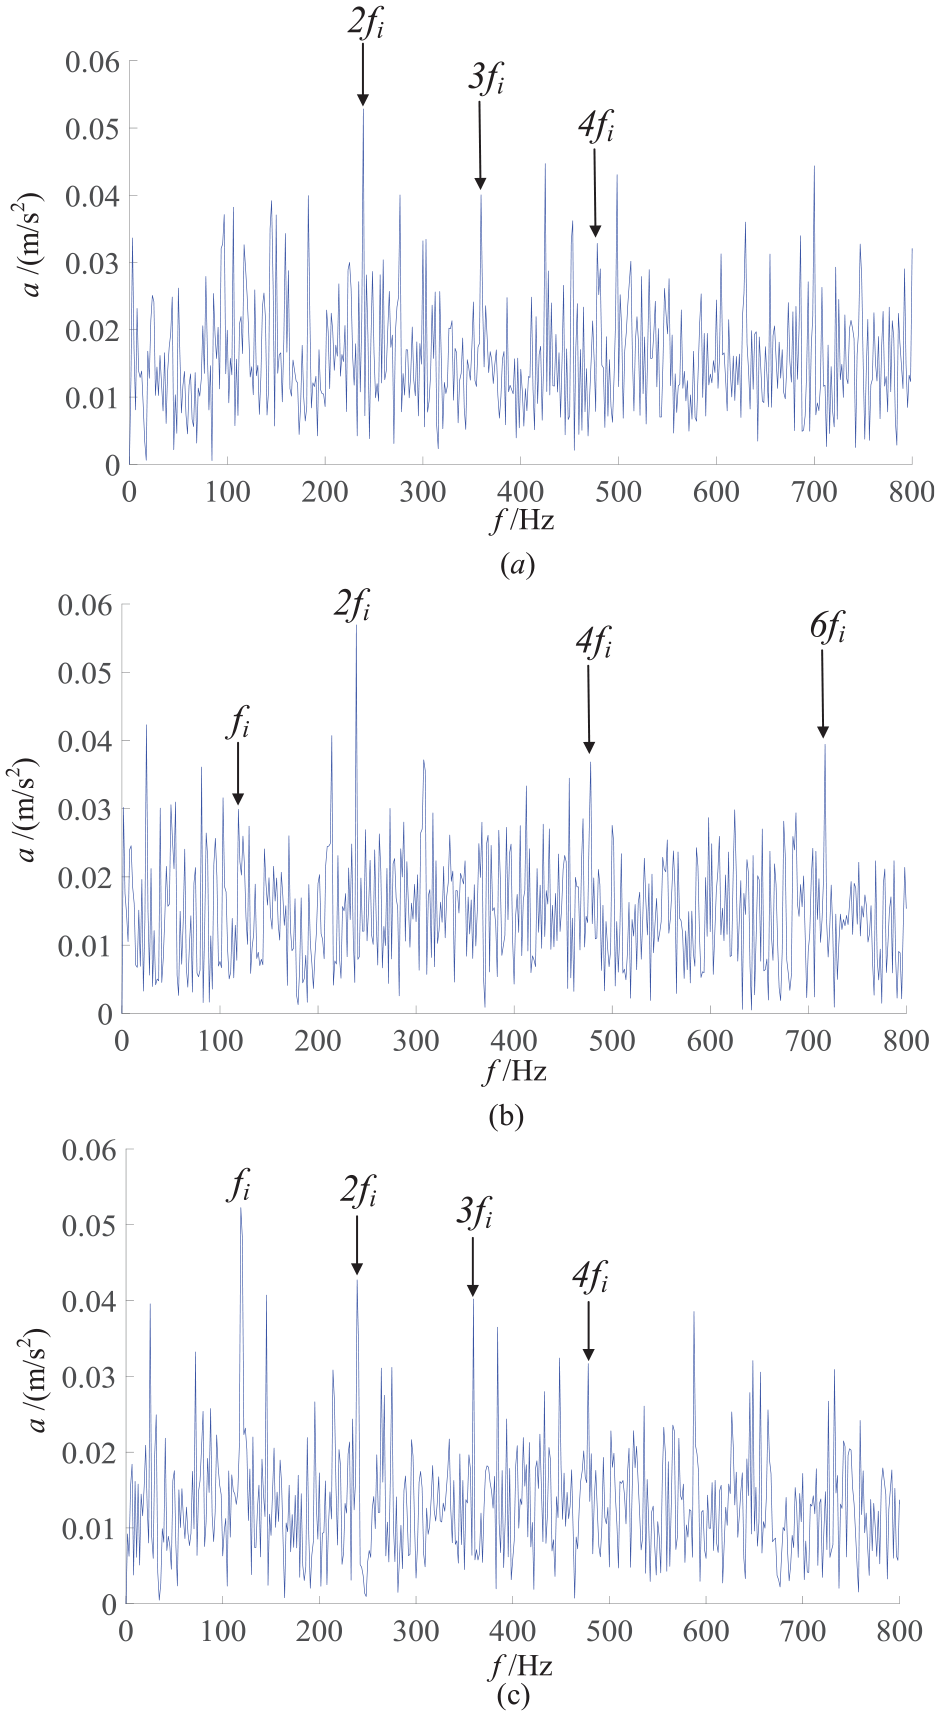
Reconstruction of envelope spectrum by kurtosis correlation coefficient screening criterion: (a) The envelope spectrum of the first channel is reconstructed, (b) The envelope spectrum of the second channel is reconstructed, and (c) The envelope spectrum of the third channel is reconstructed.
The collected vibration signals are first processed by EMD using an improved VMD based on EMD
45
and its method to select characteristic components in early fault detection of rolling bearings. Consequently, a series of IMFs are produced. Then, K IMFs with the highest
Figure 15 shows the final envelope spectrum obtained using the proposed method. Only fault-characteristic frequencies with relatively weak amplitudes can be identified at one to three times the fundamental frequency. Therefore, the proposed method demonstrates a significant advantage in extracting features from multichannel vibration information.
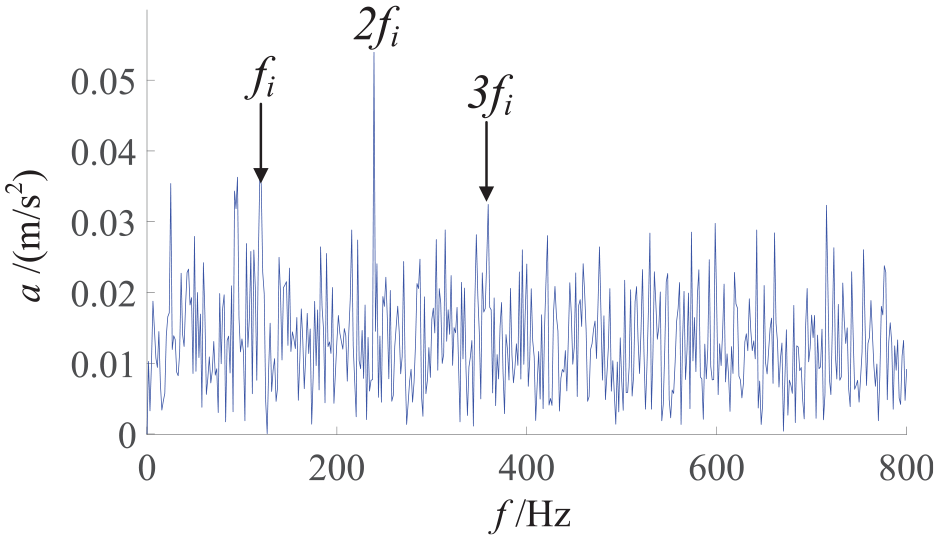
Reconstructed signal envelope spectrum by the improved VMD method.
where
where
To validate the advantages of the proposed multichannel weighted fusion method, we adopted a bearing fault diagnosis method based on multisensor signal processing 46 as a comparison. Let the vibration signals be denoted as x1(n), x2(n), …, xm(n). This method utilizes a correlation function-based weighting approach to fuse the vibration signals from multiple channels:
where
Figure 16 shows the envelope spectrum obtained using the correlation function-based weighting method. In this figure, the fault characteristic frequency and its harmonics are not prominently displayed. This could be due to the method not considering the quality of each channel’s signal, leading to an improper distribution of weights. In contrast, the weighted multichannel vibration information fusion method proposed in this article takes into account both the quality of each channel’s signal and its correlation with other channel signals, resulting in a more reasonable and effective weight distribution.
Envelope spectrum by correlation function weighting method.
The peak factor evaluation index is introduced to measure the parameter of the impact element strength in the signal and highlight the superiority of the characteristic energy evaluation index proposed in this article. The calculation formula of the vibration signal x(n) is set as follows:
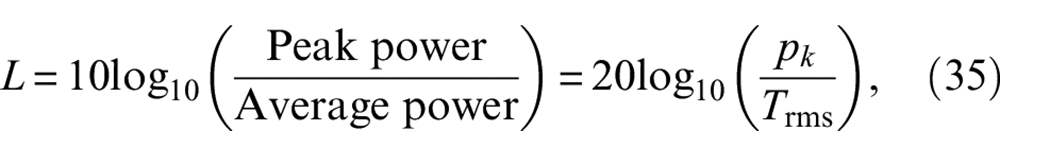
where L is the peak factor (in dB),
Before processing, the peak factors of the three-channel vibration signals were 11.03, 12.43, and 11.74 dB. After weighted fusion and kurtosis–correlation coefficient selection, the peak factor was 12.76 dB. Even though this value does not significantly improve numerically, Figures 11 and 14 indicate that the fault characteristics are significantly enhanced. Therefore, the proposed feature energy evaluation method offers clear advantages for bearing vibration signals under strong background noise conditions.
Theoretical validation shows that the multichannel vibration information weighted model and kurtosis–correlation coefficient selection criterion retain impulsive components related to faults, suppress overall noise interference, and highlight fault characteristic information.
GTE rolling bearing outer ring spalling progression test
GTE rolling bearing spalling progression test bench
Characteristic identification and diagnosis tests of typical faults of GTE bearings based on vibration signals were conducted. The test bench mainly comprises a motor, coupling, outer casing, temperature sensor, and lubricating oil system. The test sensors included vibration acceleration, oil particle, and speed sensors. The vibration acceleration was arranged directly above the outer end cover of the faulty bearing (Figure 17). Additionally, the rolling bearing vibration parameter test bench is shown in Figure 18.
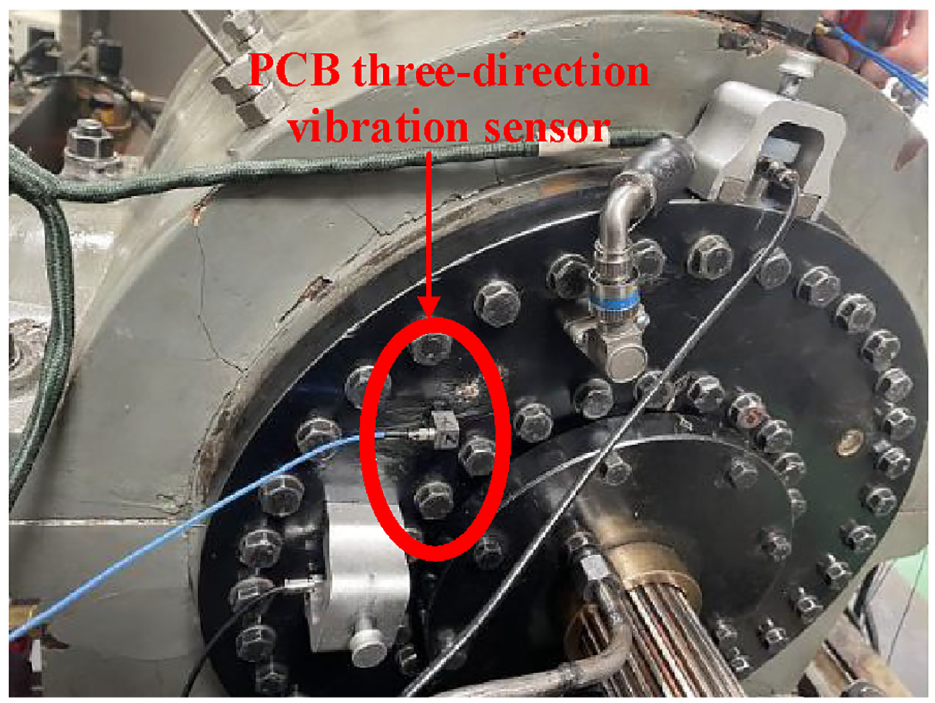
Vibration sensor installation location.
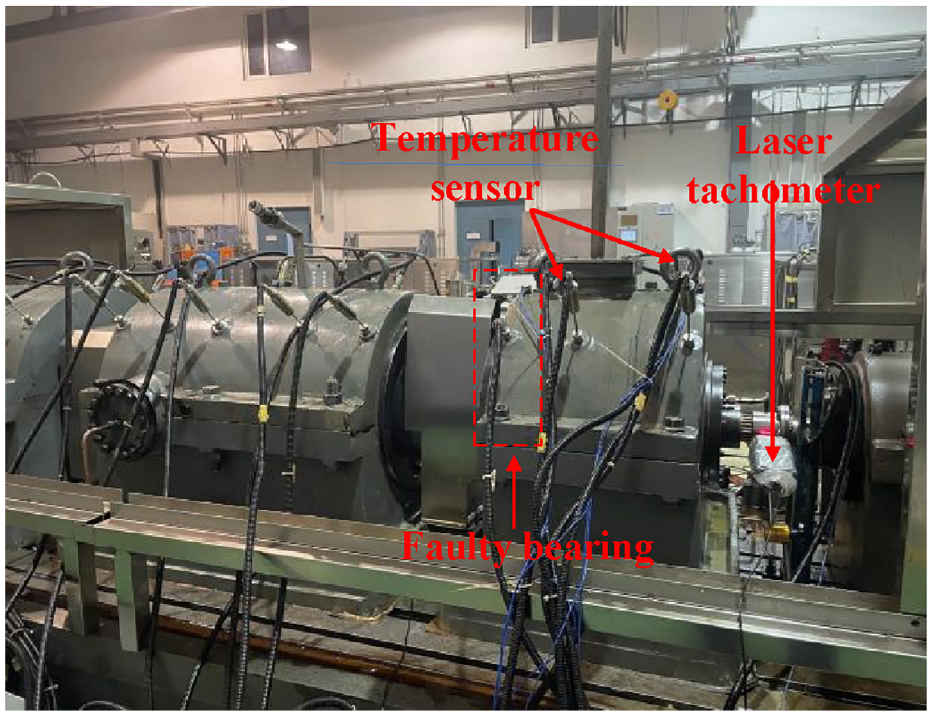
GTE rolling bearing spalling progression test bench.
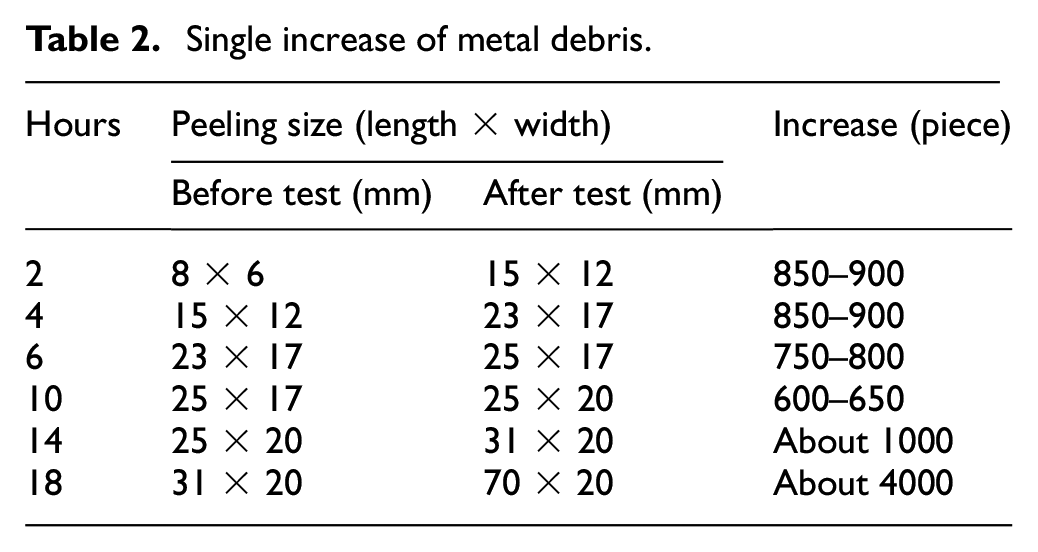
A spalling fault expansion test of a GTE rolling bearing with three fulcrum points was performed. The initial bearing fault size on the outer ring was 8 × 6 mm (length × width). Typical fault characteristic identification and diagnostic tests of GTE bearings based on vibration and oil debris information were conducted using the test bench for GTE bearing components. The high-pressure speed was 100% in operation. The vibration and oil metal chip data acquisition system is presented in Figure 19. The vibration signal sampling frequency was set to 51.2 kHz, and bearing information of three fulcrum outer rings of a certain type of GTE was collected. Each cycle lasted 0.5 h, the total operation was 18 h, and 36 cycles were collected. The metal debris sensor is located on the pipeline near the oil return outlet of the test lubrication system. Table 2 shows a single increase of oil metal debris during the entire operation.
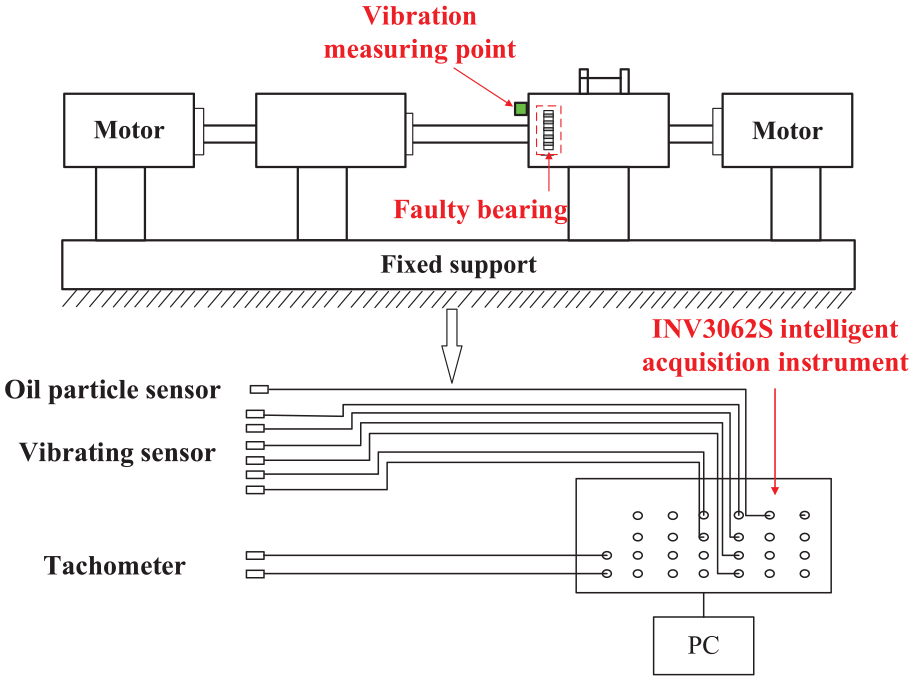
Schematic diagram of the rolling bearing vibration and oil debris collection system.
Single increase of metal debris.
Vibration and oil debris information processing and analysis
Time-domain vibration signal and oil signal analysis
After calculating the time-domain parameters of the multichannel vibration signals of the rolling bearing, the signal trends of the total RMS values in different periods can be compared. The rolling bearing may be faulty if the changing trend of the total effective value index has changed significantly within a certain period.
Vibration signals with a duration of 1 s in different running periods were taken to calculate the time-domain parameters by taking a channel vibration signal as an example. The time-domain signals before, during, and after bearing operation are presented in Figure 20. It can be observed that the vibration signal characteristics in each running period were different; thus, they should be analyzed in different periods.
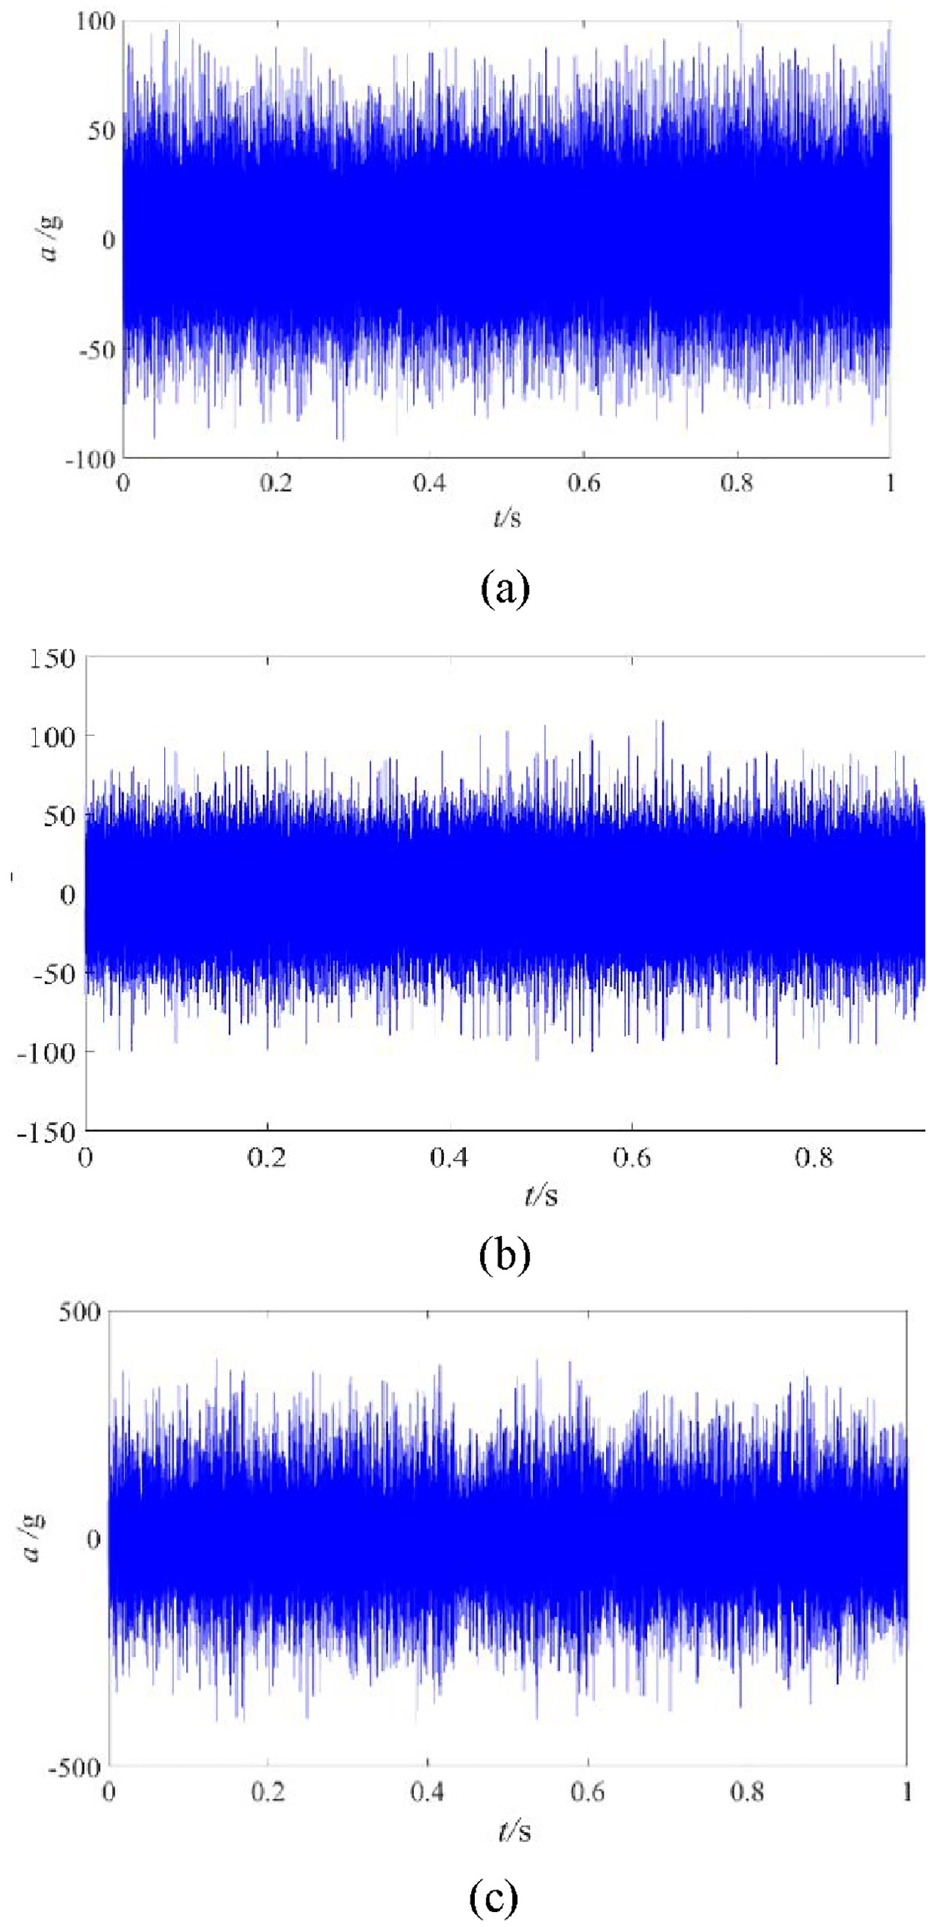
Time-domain vibration signals of bearing after operation for different durations. (a) 1 h of operation. (b) 9 h of operation. (c) 18 h of operation.
In different periods of rolling bearing operation, the vibration signal characteristics vary. Analyzing these characteristics can provide a basis for bearing fault diagnosis. The time-domain signals from different periods of rolling bearing operation were analyzed, and the changes in the time-domain signal parameters during the entire bearing operation process were obtained (Table 3). The time-domain parameters, the changing trend of the oil debris information, and the bearing damage during the entire running process are exhibited in Figure 21.
Time-domain parameter changes during bearing operation.

RMS: root mean square.
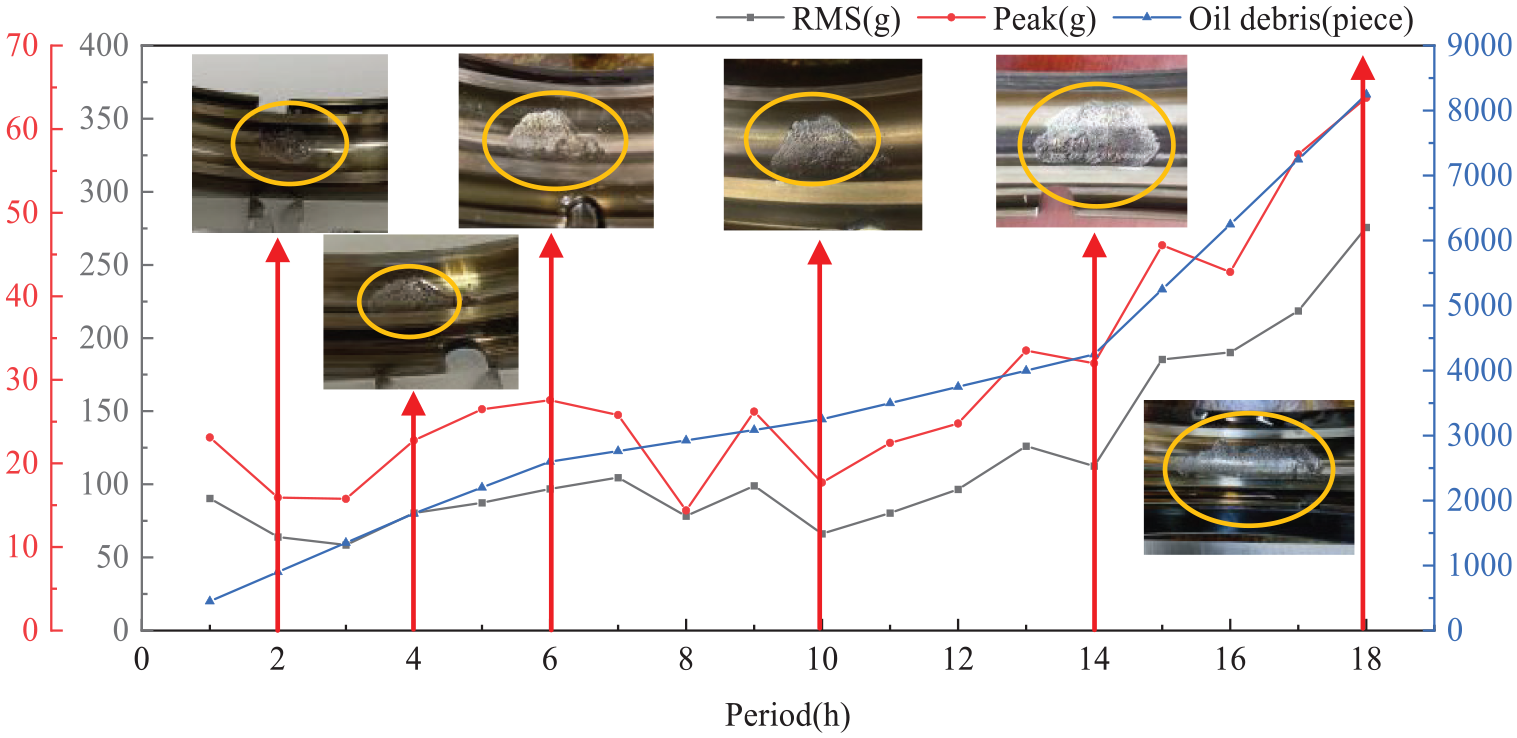
Time-domain parameters, change trend of oil debris number, and bearing damage condition during operation.
According to the statistical analysis of the time-domain vibration signals, the total RMS value of the three channels reached 23.1 g, and the peak value of the corresponding time reached 90.4 g after the bearing run for 1 h. After 9 h of operation, the effective value reached 26.2 g, and the peak value at the corresponding time reached 99 g. After 18 h of operation, the total RMS value reached 63.8 g, and the peak value at the corresponding time reached 257.7 g. The analysis of the RMS and peak parameters in the time domain reveals that the total RMS exhibited an increasing trend with elapsing operation time. The effective value in the middle period of bearing operation increased by 1.17 times, while the peak value increased by 1.22 times. The effective value of the bearing in the late running period increased by 3.93 times compared to that in the early running period, while the peak value increased by 3.71 times. This observation means that the wear of the bearing increased constantly, resulting in the accumulation of energy in the vibration signal, that is, it would lead to more severe failure.
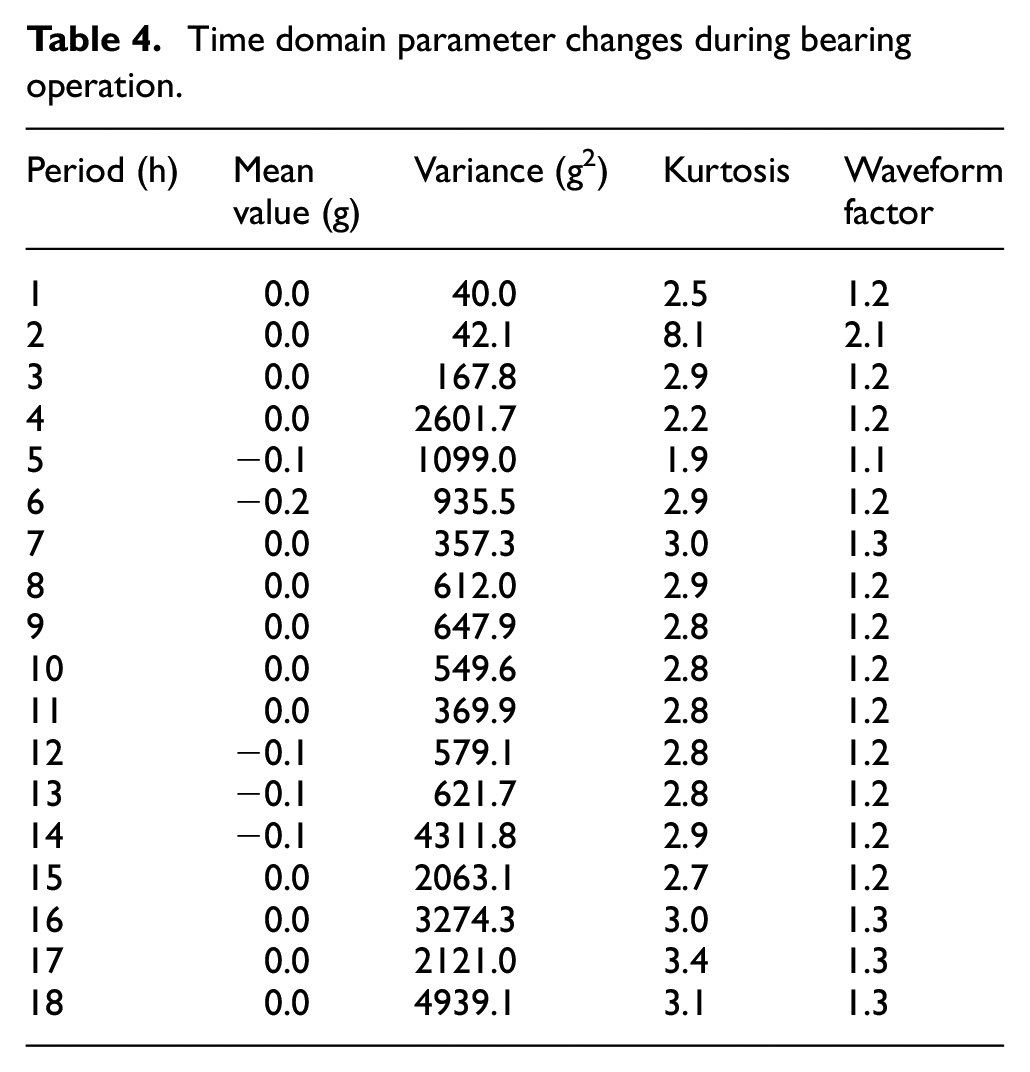
The average values of mean, variance, kurtosis, and waveform factor47,48 indices for the three-channel signals were compared to validate the monitoring advantages of the proposed overall effective value index compared to other indices. Table 4 compares various parameter indices over the entire operation. Figure 22 shows the trend of parameter changes throughout the bearing operation. As bearing faults progress, the signal variance generally increases, but with considerable fluctuations. In contrast, the remaining parameters show minimal variation throughout the bearing’s operation, making them less effective for accurately monitoring its operational state.
Time domain parameter changes during bearing operation.
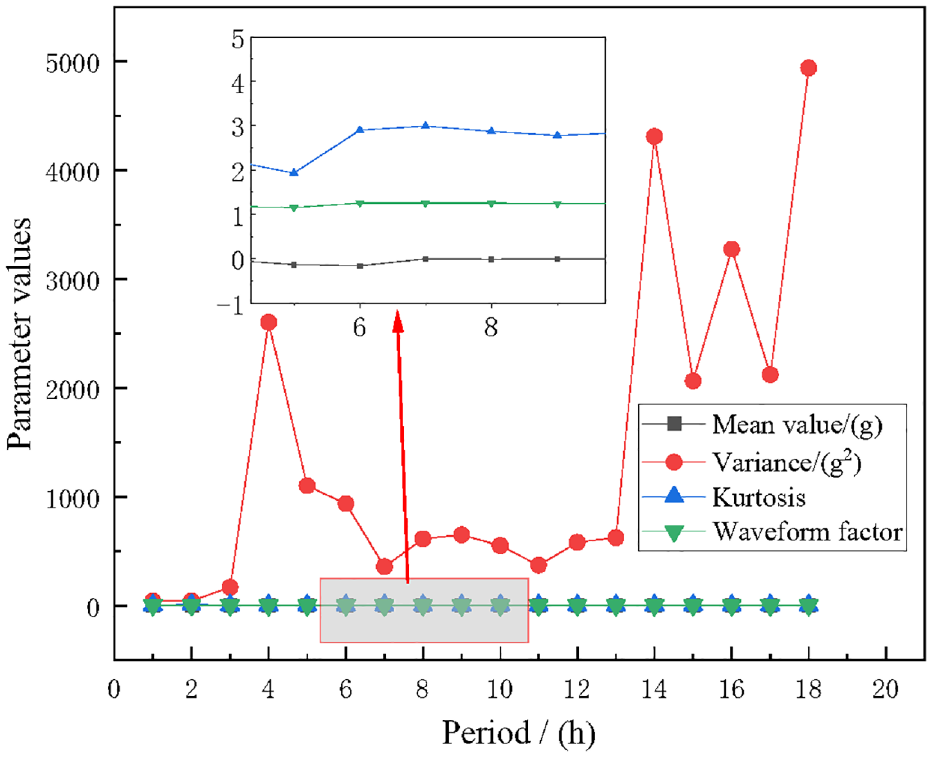
Multiparameter changes during bearing operation.
Frequency-domain vibration signal and oil signal analysis
The multichannel vibration information weighted fusion model and the kurtosis correlation coefficient screening model were used to fuse and de-noise the multichannel vibration data acquired by the main bearing spallation progression test bench. The fault characteristic energy Q at different periods of bearing operation was calculated to characterize the bearing vibration signal fault information in the frequency domain.
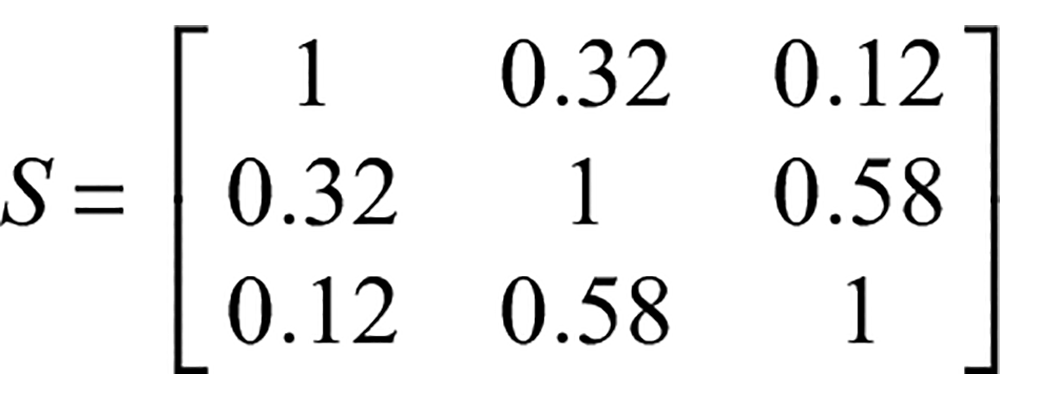
Furthermore, the bearing vibration signal after 1 h of operation was chosen, and the same set of data as that for the time-domain signal analysis was selected. The correlation support degree between each data series was calculated after normalizing the multichannel vibration data, obtaining the correlation support matrix of the three channels:
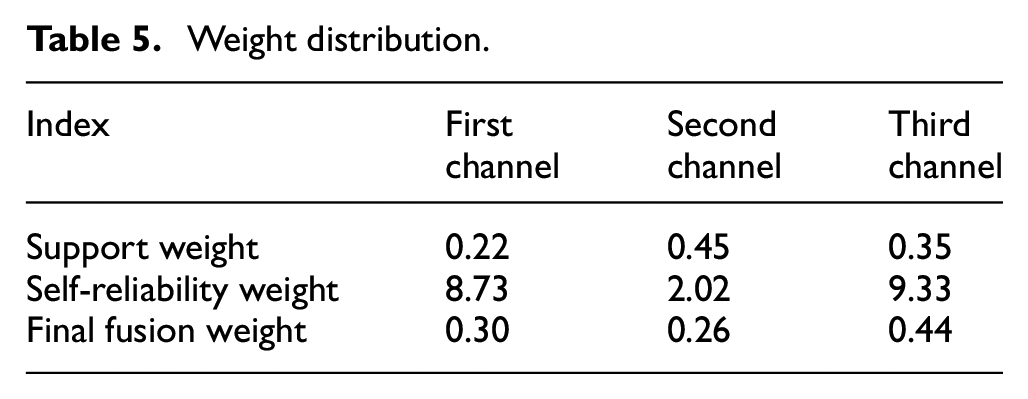
At the same time, the variation factor of each time series data was calculated as a part of the weight, and finally, data fusion was performed. The weights are assigned in Table 5.
Weight distribution.
A series of IMF components were obtained by CEEMDAN of the weighted and merged one-dimensional vibration signals. The kurtosis index and phase relationship values were calculated, and the partitioning index S and comparison index C were obtained (Figure 23). Based on the partitioning and screening of the kurtosis index – correlation coefficient, the first three strong shock components were selected for reconstruction. The obtained frequency spectrum for the outer ring of the faulty bearing after 1 h of operation is exhibited in Figure 24.
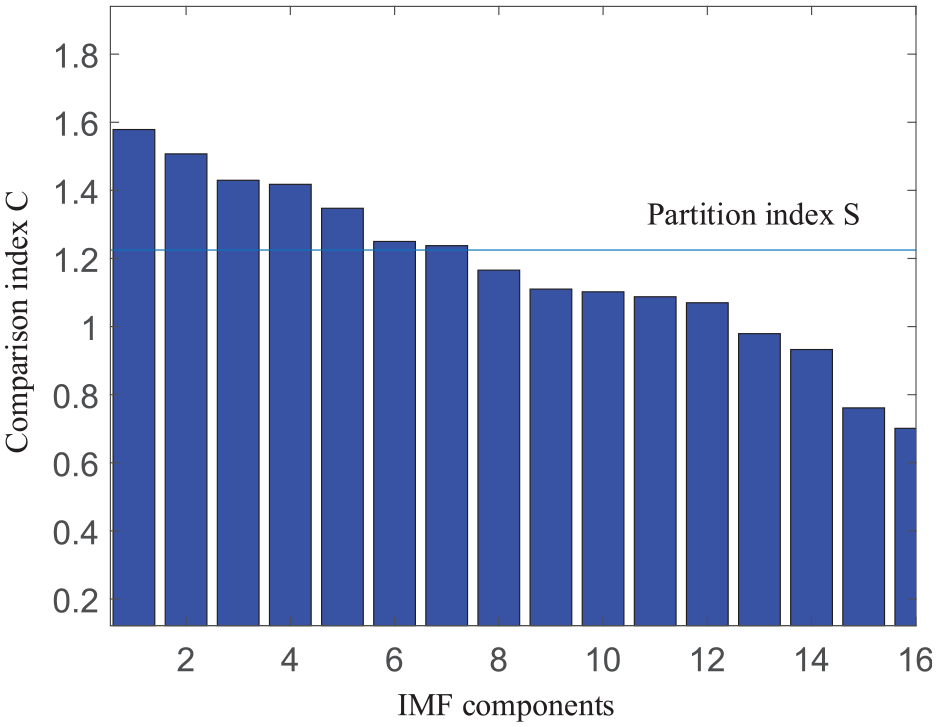
Classification and screening of IMF modal components.
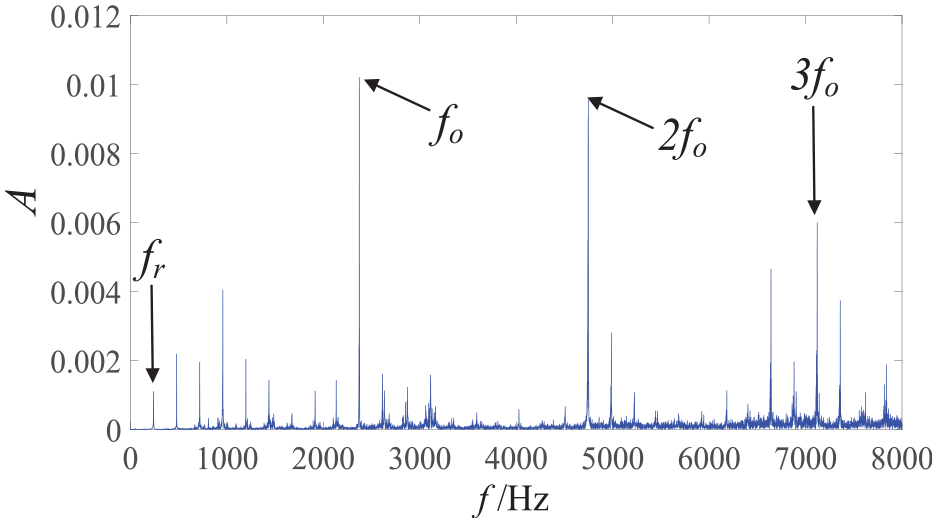
Frequency-domain vibration signal of a bearing operating for 1 h.
In the reconstructed signal in the frequency band of 0–8000 Hz, it can be identified that the drive shaft rotation frequency was 239 Hz, the bearing outer ring fault characteristic frequency could be identified as 2375 Hz, and its multiplication was 4749 and 7122 Hz. The modulation frequency is an important index for bearing fault diagnosis based on frequency-domain information. This method can demodulate the modulation information caused by bearing faults. The rich-bearing modulation frequency can be identified in the frequency-domain data with the axial frequency and the frequency doubling as the sideband. Based on the characteristic energy calculation equation, the first three-order bearing fault frequencies and the left and right two-order modulation frequencies are selected to calculate the characteristic energy in the frequency domain of the vibration signal. Data extraction showed that the characteristic energy of the bearing operating for 1 h was 79.4.
The fault characteristic energies of one, two and three channels were calculated to be 72.5, 75.8, and 74.4, respectively, to verify the validity of the multichannel vibration information weighted fusion model and kurtosis–correlation coefficient screening. Therefore, the proposed approach has a certain enhancement effect when representing effective vibration signal information.
The 9-h vibration signal of the bearing in the middle period of operation and the same set of data as that for the time-domain signal analysis were selected. The frequency spectrum of the bearing with a faulty outer ring after 9 h of operation was obtained (Figure 25). In the frequency band range of 0–8000 Hz, the characteristic frequency of the faulty bearing could be identified as 2,292 Hz, and its multiplication was 4584 and 6876 Hz. The rich bearing modulation frequency can also be identified in the frequency-domain data, which take the axis rotation frequency and the frequency doubling as the sideband. Based on the characteristic energy calculation equation, the first three-order bearing fault characteristic frequencies and the left and right two-order modulation frequencies are also selected to calculate the characteristic energy in the frequency domain of the vibration signal. Data extraction showed that the characteristic energy of the bearing operating for 9 h was 535.2.
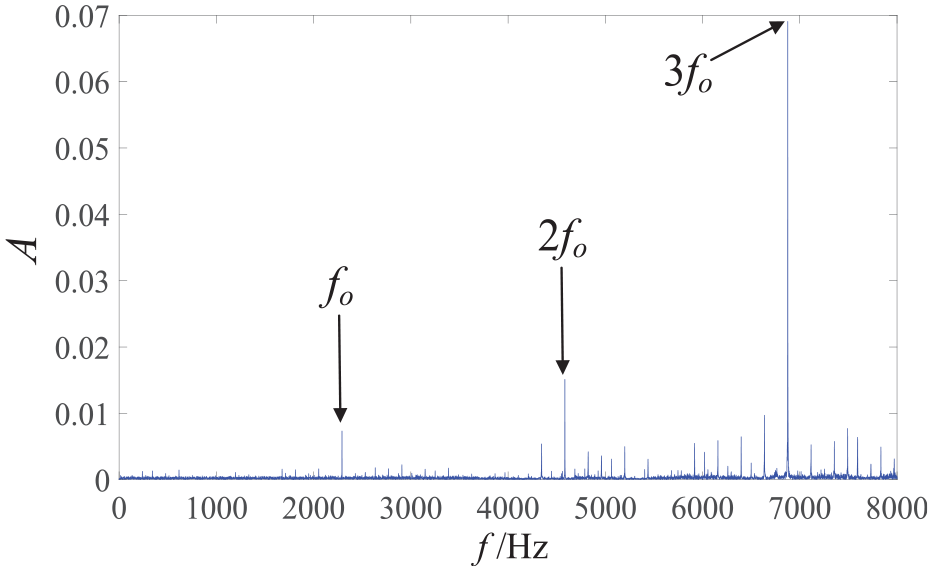
Frequency domain vibration signal of a bearing operating for 9 h.
The reconstructed envelope spectrum of the bearing with a faulty outer ring after 18 h of operation is presented in Figure 26. It can be observed that, in the frequency band range of 0–8000 Hz, the drive shaft rotation frequency was 239 Hz. Moreover, the bearing outer ring fault characteristic frequency was 2269 Hz, and the frequency doubling was 4537 and 6807 Hz. The rich bearing modulation frequency with the shaft rotation frequency and frequency doubling as side bands could also be identified in the frequency-domain data. Based on the characteristic energy calculation equation and through data extraction, the characteristic energy of the bearing operating for 18 h was found to be 55.
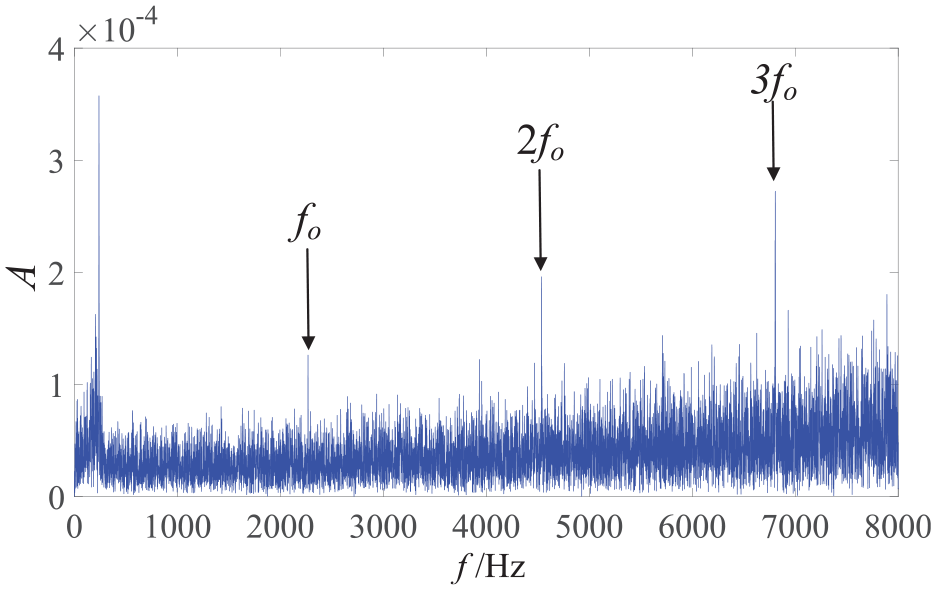
Frequency-domain vibration signal of a bearing operating for 18 h.
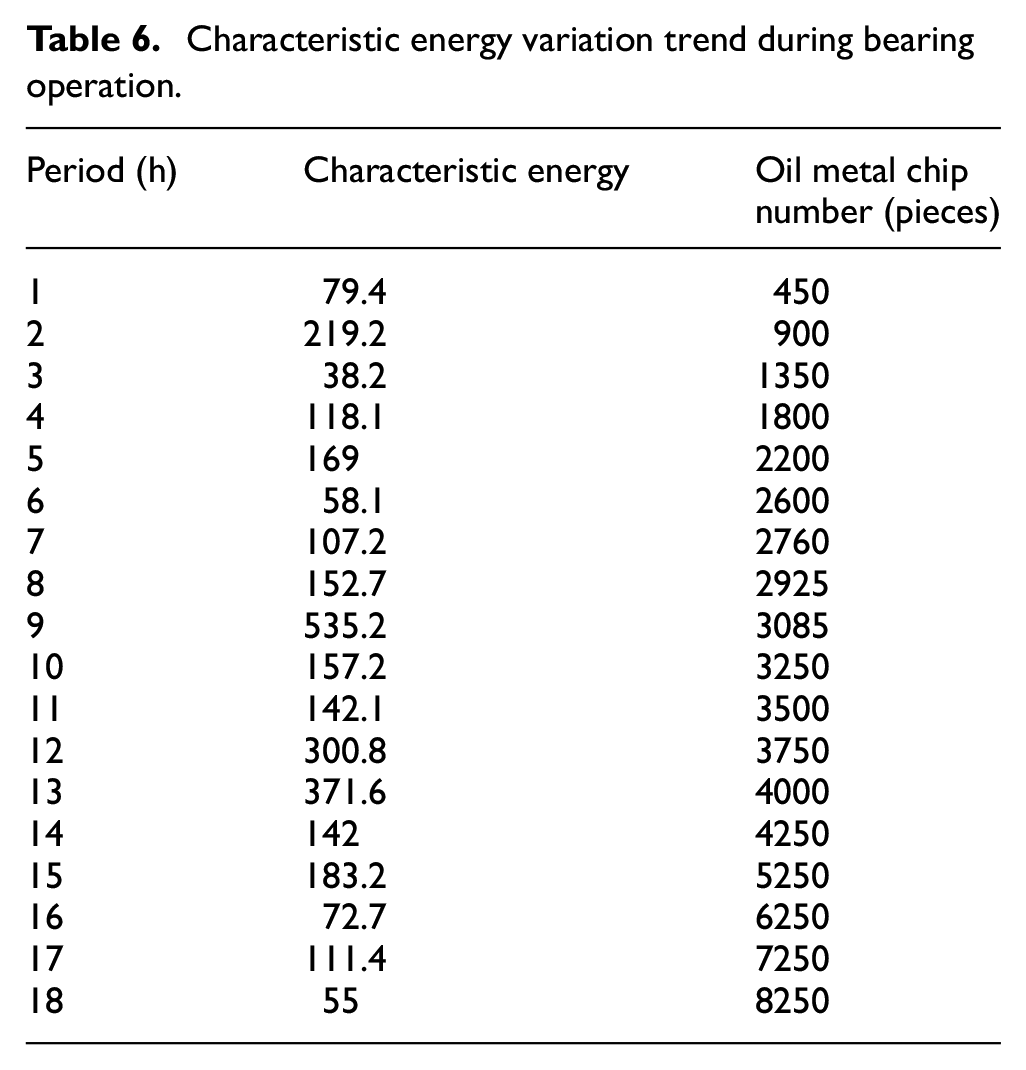
The characteristic energy of vibration signals in different periods of rolling bearing operation varies. The frequency-domain signals in different periods of rolling bearing operation were analyzed, and the frequency-domain characteristic energy changes in the entire bearing operation process were obtained (Table 6). The curves were drawn based on the characteristic energy and the number of oil debris (Figure 27).
Characteristic energy variation trend during bearing operation.
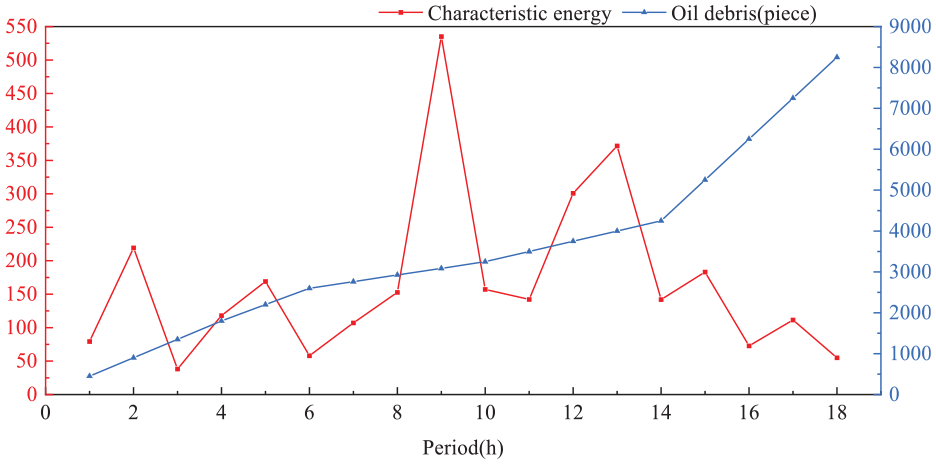
Change trends of the characteristic energy and oil debris number during the entire operation process of the bearing.
According to the statistical analysis of the vibration signal, the fault characteristic energy of the bearing operating for 1, 9, and 18 h reached 79.4, 535.2, and 55, respectively. This phenomenon indicates that with the bearing running, the frequency-domain signal characteristic parameters did not exhibit a monotonically increasing trend but increased gradually with elapsing operation time and produced a downward trend at a certain point. The characteristic fault energy of the bearing in the middle running period was 6.74 times that in the early running period. In the late running period, the fault characteristic energy of the bearing was reduced to 0.69 times that in the early running period. This observation suggests that as bearing wear progresses, the fault characteristics in the frequency domain of the vibration signal do not increase completely with bearing fault expansion but exhibit a certain regular change. The bearing continued to run in the later stage, the amount of oil debris increased, and the characteristic energy exhibited an overall downward trend. Since the bearing failure affected the operation of the entire engine system, the irregular vibration of the overall engine structure caused by the fault was further increased. Due to the bearing failure, the overall vibration of the test bench became irregular, severely affecting the engine’s smooth operation.
According to the above analysis, the frequency-domain vibration signal contains rich bearing fault information, and the characteristic energy, time-domain parameters, and oil debris number can be comprehensively assessed to characterize the bearing fault.
Vibration and oil data fusion diagnosis based on composite decision
The effective value, characteristic energy, and oil debris in the bearing fault frequency-domain data can reflect the running state of the bearing; nevertheless, this reflection cannot be achieved via a single index. The time-domain vibration characteristics are conducive to the overall monitoring of the running state of the bearing system and reflect its vibration state. The characteristic energy in the frequency-domain vibration signal benefits the early detection of bearing faults; however, with the progression of faults, the characteristic energy fluctuates and takes a low value when the fault is severe. During engine operation, the information regarding the metal debris collected in the oil is not always accurate. On the one hand, the bearing rolling body and the inner and outer raceways will wear, producing debris during normal operation. Conversely, the metal debris detected in the oil return circuit may have been produced by the wear or failure of other rotating systems. Consequently, it would be more accurate to assess the running state of bearings based on both the vibration signal and oil debris information rather than from a single parameter.
The first and second fuzzy inference controller diagrams are illustrated in Figure 28. First, the membership functions of fuzzy reasoning are defined. The RMS value of the time-domain signal increases with the progression of the bearing fault. It is suitable to choose a trapezoidal membership function and define three value intervals of low, middle, and high. In the early stage of the fault, the characteristic energy of the frequency-domain signal is at a high level. However, its fluctuation decreases as the fault expands to the late stage of operation. Therefore, choosing the generalized bell membership function and defining the low- and high-value intervals is suitable. Oil debris is in a steady growth trend, and their number increases to a higher level in the later stage of bearing failure. Thus, it is suitable to select a trapezoidal membership function and define three value ranges: low, medium, and high. Figure 29 shows the definitions of the membership functions.
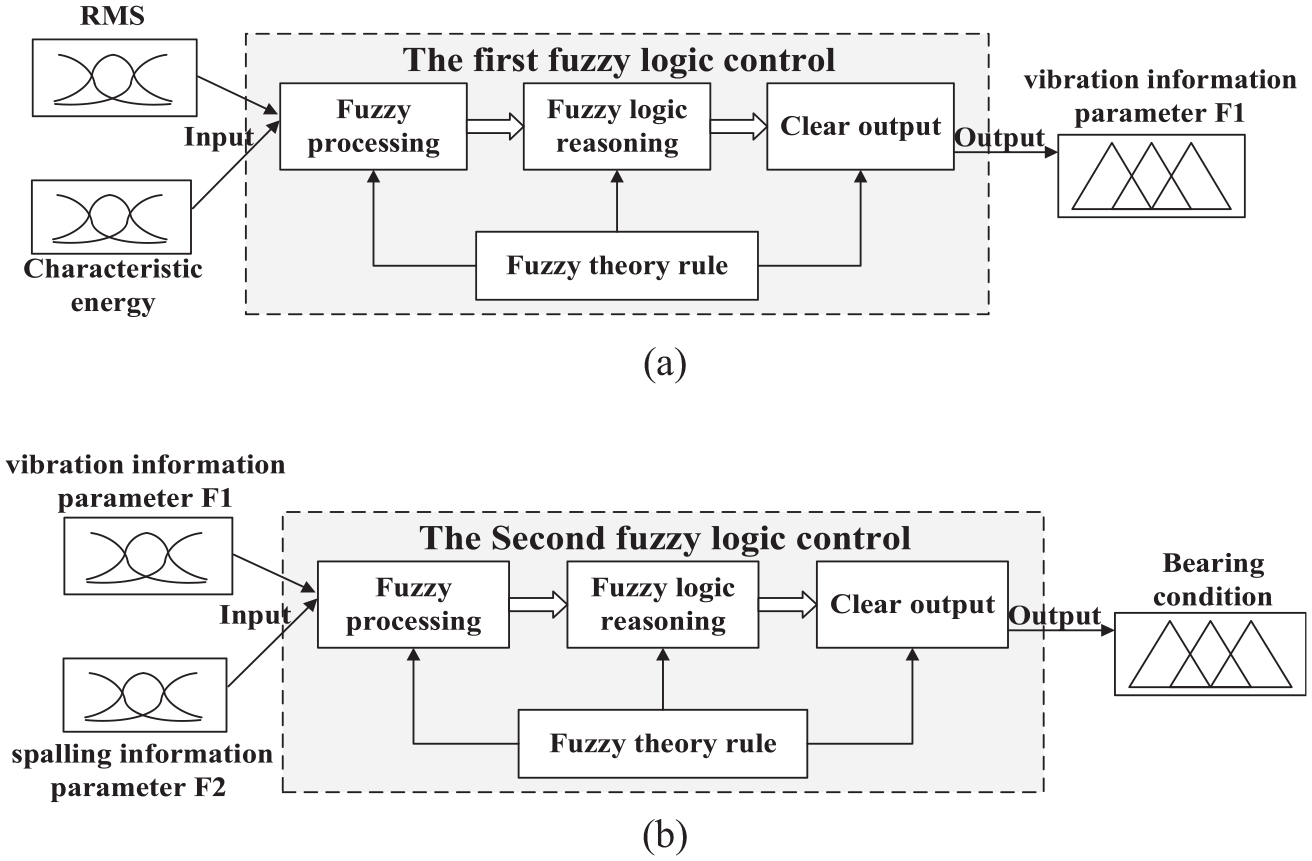
Fuzzy controllers. (a) Vibration characteristic parameters fusion. (b) Oil and vibration data fusion.
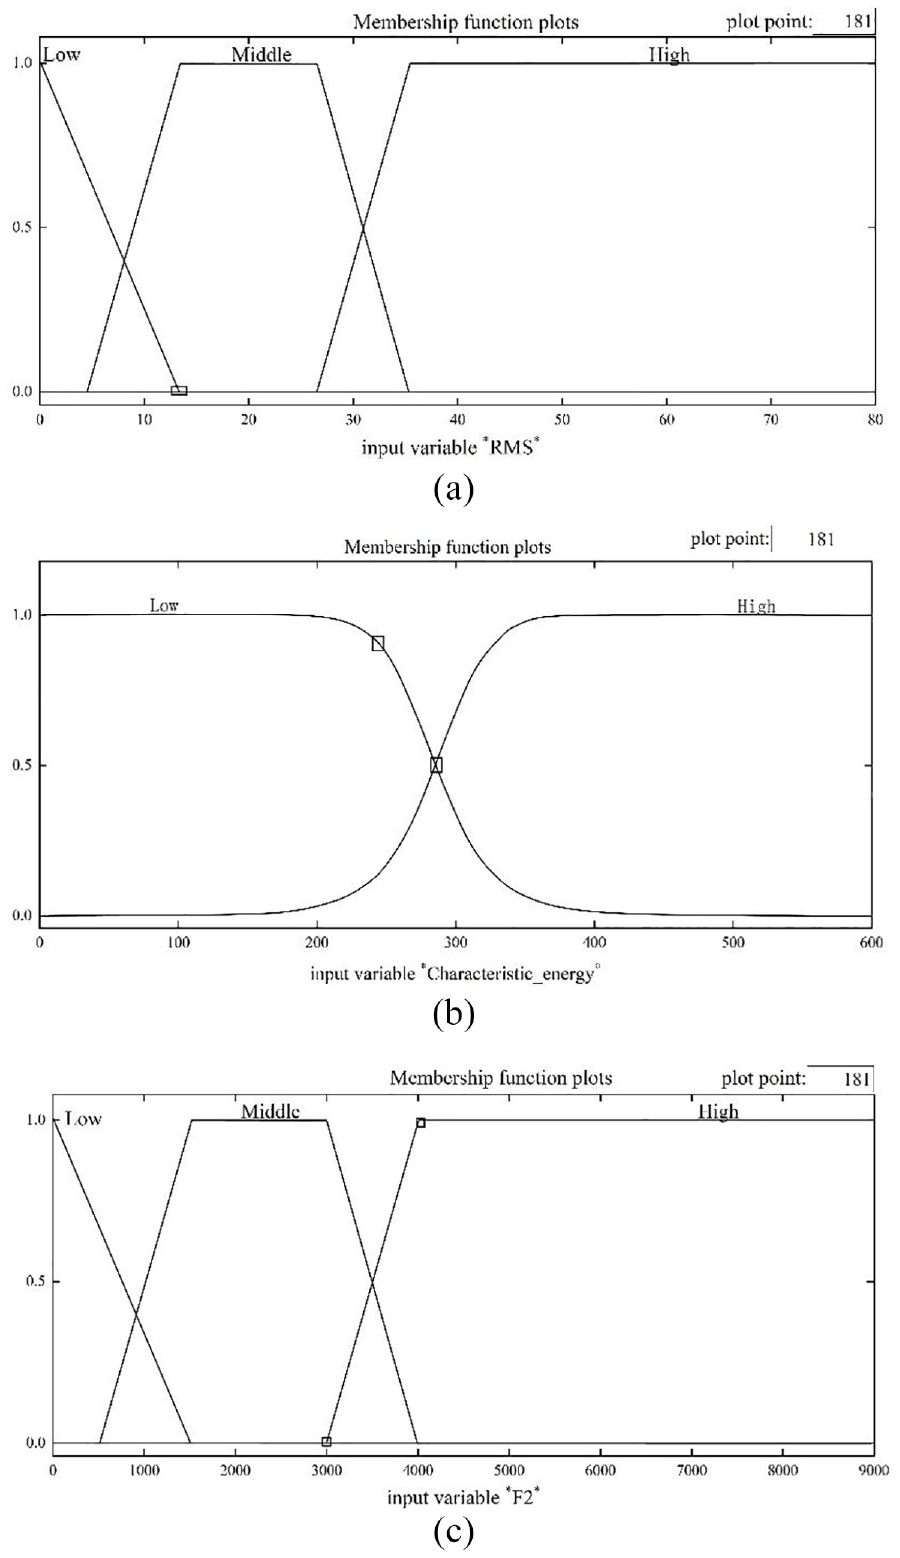
Membership functions. (a) Trapezoidal membership function of the RMS value of the time-domain signal.(b) Generalized bell membership function of the signal characteristic energy in the frequency domain. (c) Trapezoidal membership function of oil debris number.
First, the vibration signal’s effective value and characteristic energy are input, and the vibration information parameter F1 is output via fuzzy inference in the range of 0–10 for the first time. Then, F1 is input into the second fuzzy controller. Two inputs are formed with the spalling chip information parameter F2, and the output value, which ranges between 0 and 1, is the bearing state. The larger the value, the more severe the bearing damage. Therefore, based on the statistical analysis of the test data, an output value of 0–0.35 indicates that the bearing is in good condition. An output of 0.35–0.65 indicates that the bearing is in poor condition and needs to be repaired. An output of 0.65–1 indicates a severe bearing fault requiring timely maintenance. Otherwise, it can cause serious harm to the bearing system. These limits can be adjusted based on the operating conditions and specific testing requirements. In the end, the full running state of the bearing is obtained, which is shown in Table 7 and Figure 30.
Assessment of bearing damage degree during operation.
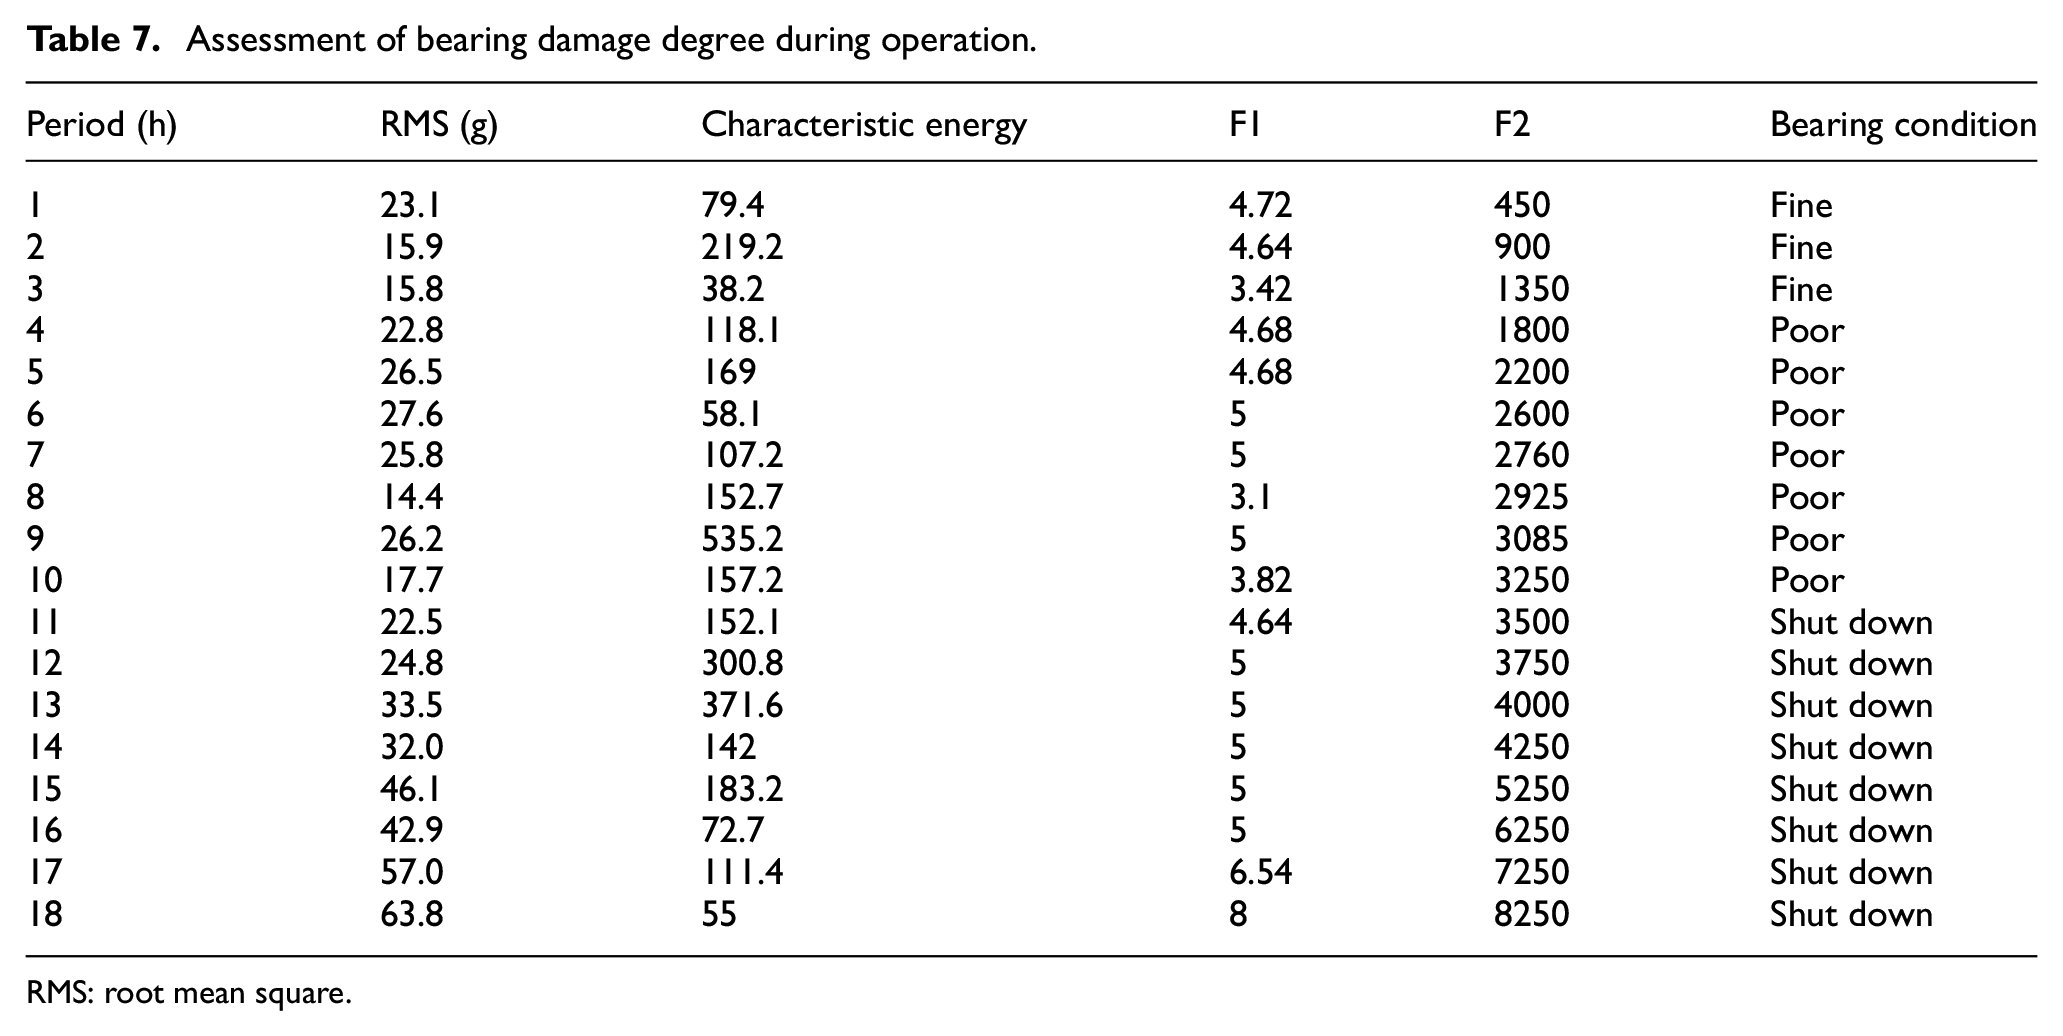
RMS: root mean square.
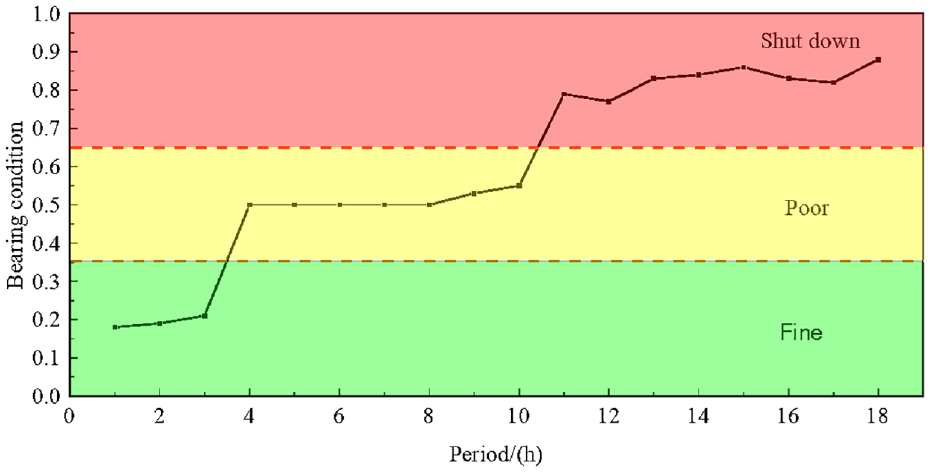
Bearing fault diagnosis and condition identification.
If only vibration information is used to monitor the bearing status, a value between 0 and 1 is output, indicating the bearing status (Figure 31). A discrimination error at the eighth hour can be observed; thus, the classification of the operating state of the three bearings in Figure 30 is poor. If only oil information is used to monitor the bearing status, a value between 0 and 1 is output, indicating the bearing status (Figure 32).
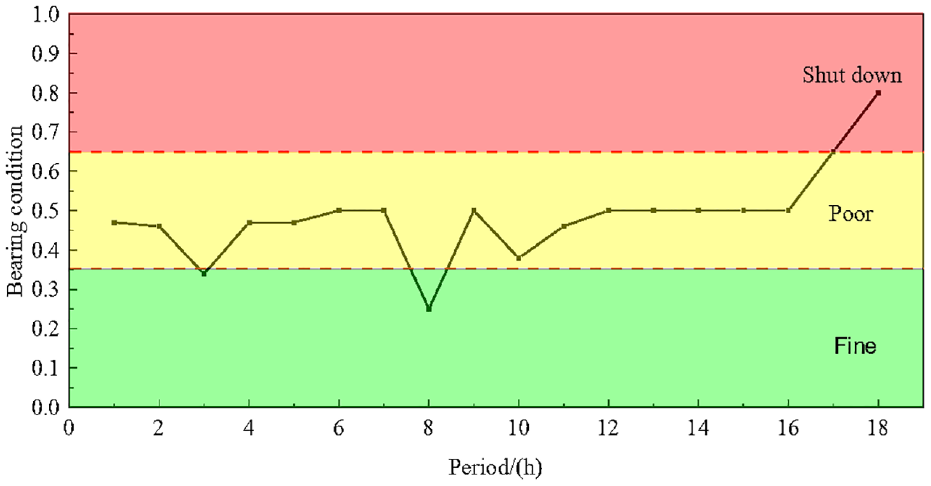
Bearing fault diagnosis and condition identification (vibration-only information).
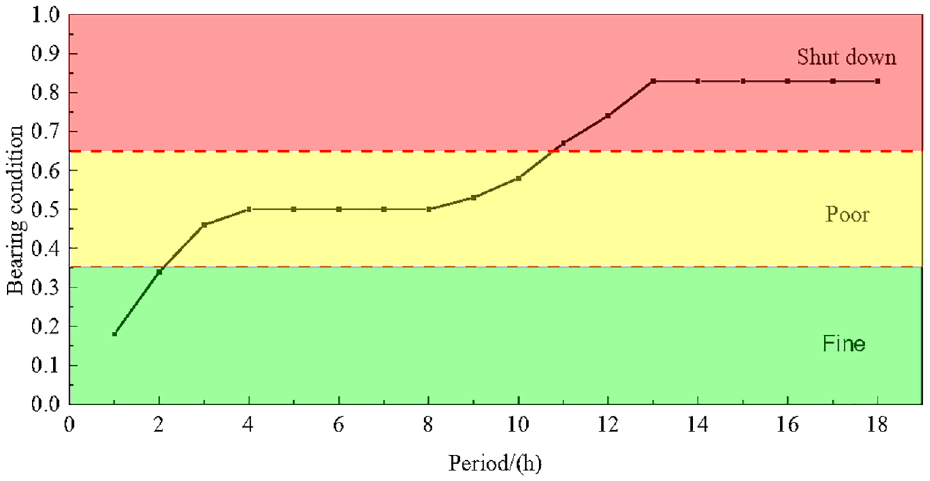
Bearing fault diagnosis and condition recognition (oil-only information).
From the perspective of detection system design, in order to increase the detection probability and minimize false positives, the model output should form well-separated data classes, that is, one for good condition (category 1), one for poor condition (category 2), and one for serious condition (category 3). These three classes should ideally have low intra- and high interclass variance. 39 Interclass distance determines the similarity or the distance between samples within the same class. The smaller the intraclass distance, the more similar the samples in the same category and the better the clustering effect. The interclass distance can be calculated via the Euclidean distance as follows:
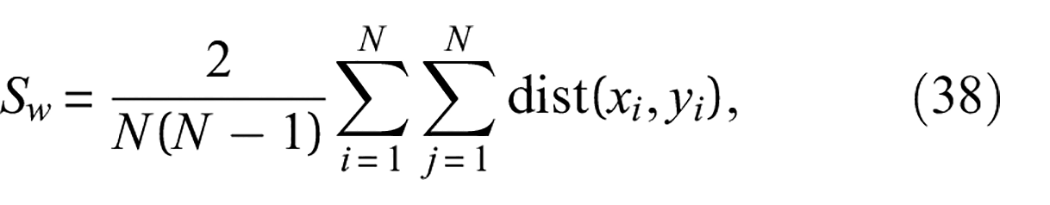
where N is the number of samples within the class and dist represents the Euclidean distance between samples.
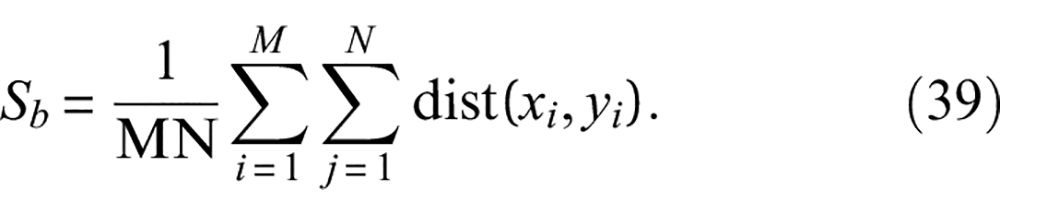
Interclass distance determines the difference between samples of different classes. The greater the distance between classes, the more scattered the samples between different classes and the better the classification effect. The Euclidean distance is again used to calculate the interclass distance:
Three categories of bearing operation states are output by the method proposed in this article, that is, good condition, poor condition, and serious condition. A class distribution parameter G is defined as follows:
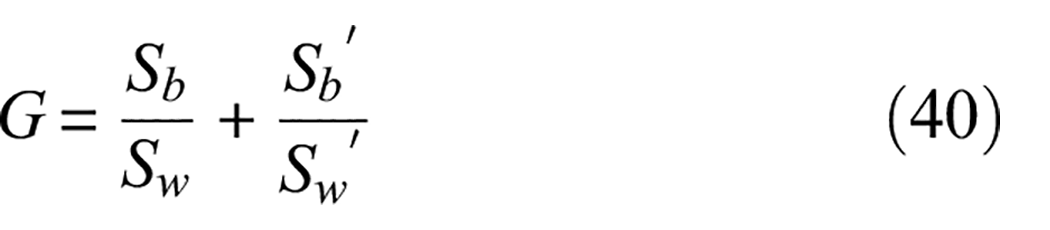
where
After calculation:
Consequently, the proposed main bearing fault diagnosis method based on vibration and oil debris information fusion can significantly improve the accuracy and robustness of bearing fault spalling expansion detection. Since more experimental or field data are available, the fusion model can be easily reconfigured and updated.
Conclusions
In response to the challenge regarding the monitoring and accurately diagnosing faults in the main bearings of GTEs via a single detection method, this article proposed a method for monitoring the state of rolling bearings based on the fusion of multichannel vibration signals and oil debris information. Since the fault features are not easy to extract, the multichannel vibration information fusion model and kurtosis–correlation coefficient screening criteria proposed in this article are employed to extract the vibration feature parameters, combined with the oil information for composite fusion diagnosis. The effectiveness of the proposed method is verified experimentally, and the conclusions are as follows:
(1) The effective value was selected as the time-domain characteristic parameter, the characteristic energy as the frequency-domain characteristic parameter, and the number of oil debris was fused with the vibration information. The RMS parameters of the vibration signal tended to increase with fault expansion. The characteristic energy in the frequency domain decreased and fluctuated when the fault expanded to a certain extent. The vibration signal was sensitive to the early fault diagnosis of bearings. Oil debris is an important factor for diagnosing bearing faults; its variation trend is monotonically increasing, and the change in its amount is more significant in the later stages of bearing failure.
(2) The composite decision fusion method can effectively fuse the vibration signals (RMS and characteristic energy) and perform the first fuzzy reasoning. The second fuzzy reasoning can more accurately monitor the running state of the bearing by incorporating the spalling chip information parameter. It has been verified that the main bearing fault diagnosis method based on the fusion of vibration and oil debris information can significantly improve the accuracy and robustness of bearing fault detection.
(3) The fuzzy reasoning theory was used to fuse the vibration signal of rolling bearings and the oil debris information, which can define the test benchmark according to the actual situation. The proposed approach can be widely used in the condition monitoring and fault diagnosis of rolling bearings under different working conditions, as well as for different types of bearings and fault types.
We did not consider sensor data such as temperature and pressure, which may lead to limited accuracy of the final results. In the future, we will consider incorporating more sensor data to enhance the generalization and robustness of the model. Additionally, we aim to combine this approach with stochastic resonance 49 to complement existing noise elimination methods, thereby further improving the performance of fault diagnosis.
Footnotes
Acknowledgements
The authors thank the Liaoning Provincial Department of Education for its projects and the China Aviation Development Industry-University-Research Cooperation Project.
Declaration of conflicting interests
The author(s) declared no potential conflicts of interest with respect to the research, authorship, and/or publication of this article.
Funding
The author(s) declared the following potential conflicts of interest with respect to theresearch, authorship, and/or publication of this article: The authors received financial support from Liaoning Provincial Department of Education 20240051for the research, authorship, and/or publication of this article.