






Abstract
Conventional laser scanning techniques that employ scanning laser Doppler vibrometers (LDVs) excel at inspecting flat, plate-like structures but produce errors when examining complex, three-dimensional (3D) structures without prior knowledge of the structure’s geometry. Herein, we propose a novel approach that integrates an LDV with a laser distance meter (LDM) and performs 3D shape estimation using compensation algorithms to minimize errors caused by the nonuniform scan spacing resulting from curved surfaces. The LDM, in conjunction with Galvo mirrors, facilitates the acquisition of 3D point clouds representing the curved surfaces of the structure, thereby outlining its geometry during the 3D shape estimation process. Spacing errors, calculated by subtracting neighboring points with nonuniform spacing arising from curvature variations, are effectively mitigated. The proposed method not only compensates for these spacing errors but also creates an optimal, adaptive scan grid tailored for different 3D structures. By ensuring uniform laser scan spacing on curved surfaces, this technique reduces potential errors resulting from spacing discrepancies. Experiments conducted on aluminum and composite structures reflecting the curvature of an aircraft wing demonstrated the improved accuracy on curved surfaces achievable using this technique.
Keywords
Introduction
Structural health monitoring (SHM) systems ensure that structures remain safe and operational over extended periods, by continuously monitoring their condition and detecting potential issues before they become critical. SHM systems function similarly to the human nervous system, utilizing networks of actuators and sensors to detect, locate, and assess structural anomalies in real time, thereby triggering necessary corrective actions.1–5 Despite significant advancements in SHM technology, traditional contact sensors still play a crucial role.6–8 While these sensors offer advantages such as high sensitivity for signal measurement and comprehensive structural assessment through real-time monitoring, they also face certain limitations. These include the need for extensive sensor arrays and increased installation and maintenance costs due to the susceptibility of such sensors to damage. These challenges, however, highlight areas for further technological development and innovation rather than diminishing the value of contact sensors.
With regard to addressing the aforementioned limitations, noncontact sensor technologies represent a practical alternative to traditional methods, particularly in applications where contact sensors are less feasible. Noncontact sensor-based systems can detect structural damage without direct physical interaction. Notable examples include air-coupled transducers, which transmit airborne ultrasonic waves through the structure and use the reflected signals to detect defects such as cracks, voids, and delamination.9,10 Electromagnetic acoustic transducers, which generate and receive ultrasonic waves through electromagnetic induction, do not require direct contact or couplants either. 11 Among noncontact techniques, laser Doppler vibrometry is a particularly noteworthy technique, capable of accurately measuring surface ultrasonic waves by mapping the velocity and displacement of surface points in response to guided wave excitation.12–15 Laser Doppler vibrometry enables fast and dense interval scanning over large areas, significantly advancing the capabilities of full-wavefield analysis compared with traditional contact sensors.
Full-wavefield analysis is an advanced method that captures the entire wave propagation through a structure, enabling the visualization and analysis of dynamic behaviors and anomalies through the acquisition of comprehensive acoustic wavefield data across an area of the structure. This approach provides detailed descriptions of the propagation of guided waves and their interactions with defects in either the time or frequency domain. Lee et al. developed wave propagation imaging techniques to assess different types of damage, such as cracks and wall thinning in elbows and welded joints in nuclear power plants, as well as debonding, impact damage, and delamination in aircraft structures.16–21 Yu and Tian developed spatial-frequency–wavenumber filter-based damage detection techniques, experimentally validated on cracked aluminum plates. 22 Tian et al. used frequency–wavenumber and space–wavenumber spectrum analysis to detect and quantify delamination, demonstrating the technique’s ability to identify delamination length and depth by comparing wavenumber components to theoretical predictions. 23 Mesnil et al. employed instantaneous and local wavenumber techniques on guided wavefield data to quantify delamination in composites, evaluating the accuracy and computational efficiency of these techniques in advanced SHM. 24 Michaels et al. introduced a full-wavefield measurement technique that enhances the utilization of damage-scattered waves by effectively utilizing frequency–wavenumber domain filtering to remove incident waves. 25
Another advanced technique is steady-state ultrasonic imaging, which employs standing waves to deliver energy effectively to the structure; by eliminating the need for time delays to ensure traveling wave dissipation, this technique enables faster scanning. Flynn and colleagues introduced this method, which offers several key advantages, including acoustic wavenumber spectroscopy (AWS).26–28 Jeon et al. developed local wavenumber mapping and a two-dimensional (2D) wavelet–wavenumber filter to detect and visualize various types of damage in composite structures.29,30 They also introduced a compressive sensing technique to improve the efficiency of full-wavefield analysis. 31 Kang et al. employed AWS to identify shallow defects using an interdigitated transducer-based scanning laser Doppler vibrometer (LDV) and developed a quantitative depth-wise visualization method.32,33 Purcell et al. enhanced the accuracy of damage detection and quantification on metallic plates by developing a bandpass mode filtering technique for multi-frequency full-field steady-state wavefields. 34
With the broadening applicability of these technologies, the need for scanning techniques capable of handling complex three-dimensional (3D) structures has become increasingly evident. Traditional laser scanning technologies, such as scanning LDVs, excel at inspecting flat, plate-like structures. However, they encounter difficulties and produce errors when examining complex 3D structures without prior knowledge of the structure’s geometry. These problems are exacerbated by the nonuniform scan spacing caused by variations in the structure’s curvature, which introduce errors in spatial frequency (i.e., wavenumber) estimation; this precludes accurate defect detection and evaluation with most wavenumber-based structural defect detection techniques. To address these issues, 3D LDVs have been developed, which offer significant advantages for complex 3D structures.35,36 They can measure the complete velocity profile by capturing both in-plane and out-of-plane vibrations with high spatial resolution, which enables detailed mapping of vibration patterns. The noncontact nature of 3D LDVs preserves the integrity of intricate or delicate structures, while their flexible setup enables accurate measurements on curved, irregular, or hard-to-reach surfaces. Therefore, 3D LDVs are highly adaptable and effective for the analysis, monitoring, and maintenance of complex 3D structures, enabling reliable defect detection and evaluation and enhancing the efficiency and effectiveness of structural inspection and maintenance across industries. However, the prohibitive cost of these systems inhibits their widespread adoption. To circumvent this shortcoming, techniques that can correct visualization results while using a single LDV are being developed. For instance, Koskelo and Flynn developed multiple surface local wavenumber estimation methods based on steady-state ultrasonic imaging, which exhibit improved damage detection capabilities across various structures. 37 Fickenwirth et al. developed a full-field 3D laser scanning system to extend the applicability of steady-state ultrasonic imaging techniques to SHM. 38
Herein, we propose a cost-effective and efficient method that combines a low-cost, compact system comprising a single LDV and laser distance meter (LDM) with a scan grid compensation technique. This system ensures effective damage detection even in curved structures by minimizing any errors caused by nonuniform scan spacing. By capturing the 3D shape and analyzing the degree of nonuniform scan spacing at each scan point, an optimal scan grid is generated according to the surface of the structure. This ensures that accurate ultrasonic measurements are performed at uniformly spaced scan points in the initially intended area, which guarantees the accuracy of subsequent wavenumber estimation and defect detection. The proposed method was validated on aluminum and composite structures with varying surface conditions and curvatures; the results demonstrate that it overcomes the limitations of existing methods and accurately estimates the location and size of defects. The proposed approach thus shows significant potential to enhance the overall effectiveness and reliability of SHM systems.
Steady-state ultrasonic wavefield measurements in curved structure
Steady-state ultrasonic wavefield measurement has become crucial for evaluating the integrity of various structural components. This technique is useful for exciting structures effectively and rapidly detecting subtle changes in ultrasonic properties caused by defects. However, ultrasonic wavefield measurements are unsuitable for curved structures because of geometric complexities and the resulting difficulties in assessing ultrasonic properties. Recent rapid advancements in ultrasonic technology have shown the potential for accurate and efficient analysis of such curved surfaces. This paper explores these advancements and their contributions to achieving precise steady-state ultrasonic measurements on curved structures.
Steady-state ultrasonic wavefield measurements
The process for acquiring complete steady-state ultrasonic wavefields is illustrated schematically in Figure 1. A piezoelectric (PZT) transducer attached to the plate’s surface generates steady-state excitation at a specific frequency. An LDV system then scans a uniformly discretized 2D grid with an
This yields a 2D complex response matrix, denoted as
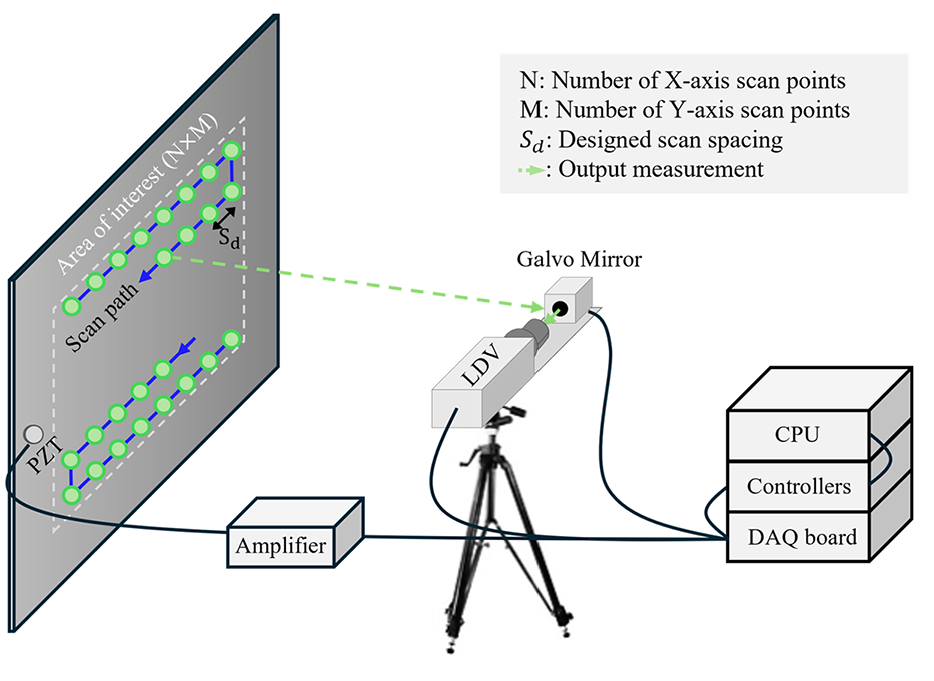
Data acquisition process for steady-state ultrasonic imaging.

Real (a) and imaginary (b) components of steady-state wavefield measurement on the aluminum plate at 350 kHz excitation frequency.
Nonuniform spacing errors
When scanning nonparallel structures or surfaces with complex geometries, traditional methods that assume uniform spacing on a virtual plane parallel to the laser system face challenges. The angle of the structure and its inherent geometry result in nonuniform spacing. This invalidates the assumption of uniform spacing for each component in the spatial analysis of the steady-state ultrasonic response

Wavefield data in wavenumber domain and imaging result with nonuniform scan spacing: (a) Nonuniform scan spacing, (b) misestimated wavenumber data, and (c) imaging result.
Scan grid compensation
To minimize scan spacing errors caused by curved surfaces, we combined an LDV with an LDM. We also developed an algorithm for scan grid compensation and adaptive scan grid formation, which is detailed in this section.
Integrated laser scanning system
We used an integrated laser scanning system that combines a conventional LDV-based system with an LDM. This system aligns two lasers with different wavelengths onto a single Galvo mirror using two prisms, as depicted in Figure 4(a); the LDV operates with a laser wavelength of 1550 nm, while the LDM uses a laser wavelength of 636 nm. One prism is designed to refract the LDM laser at a 90° angle, while the other prism refracts the LDM laser at a 90° angle and simultaneously allows the LDV laser to pass through. This configuration enables automatic synchronization of the two lasers, which are used for different purposes, along the same path. Figure 4(b) illustrates the two-stage operation of the system: (1) a 3D point cloud of the structure to be inspected is acquired using the LDM, and an optimal scan grid is generated based on the structure’s geometry; (2) ultrasonic signals are measured using the LDV on the derived optimal scan grid.
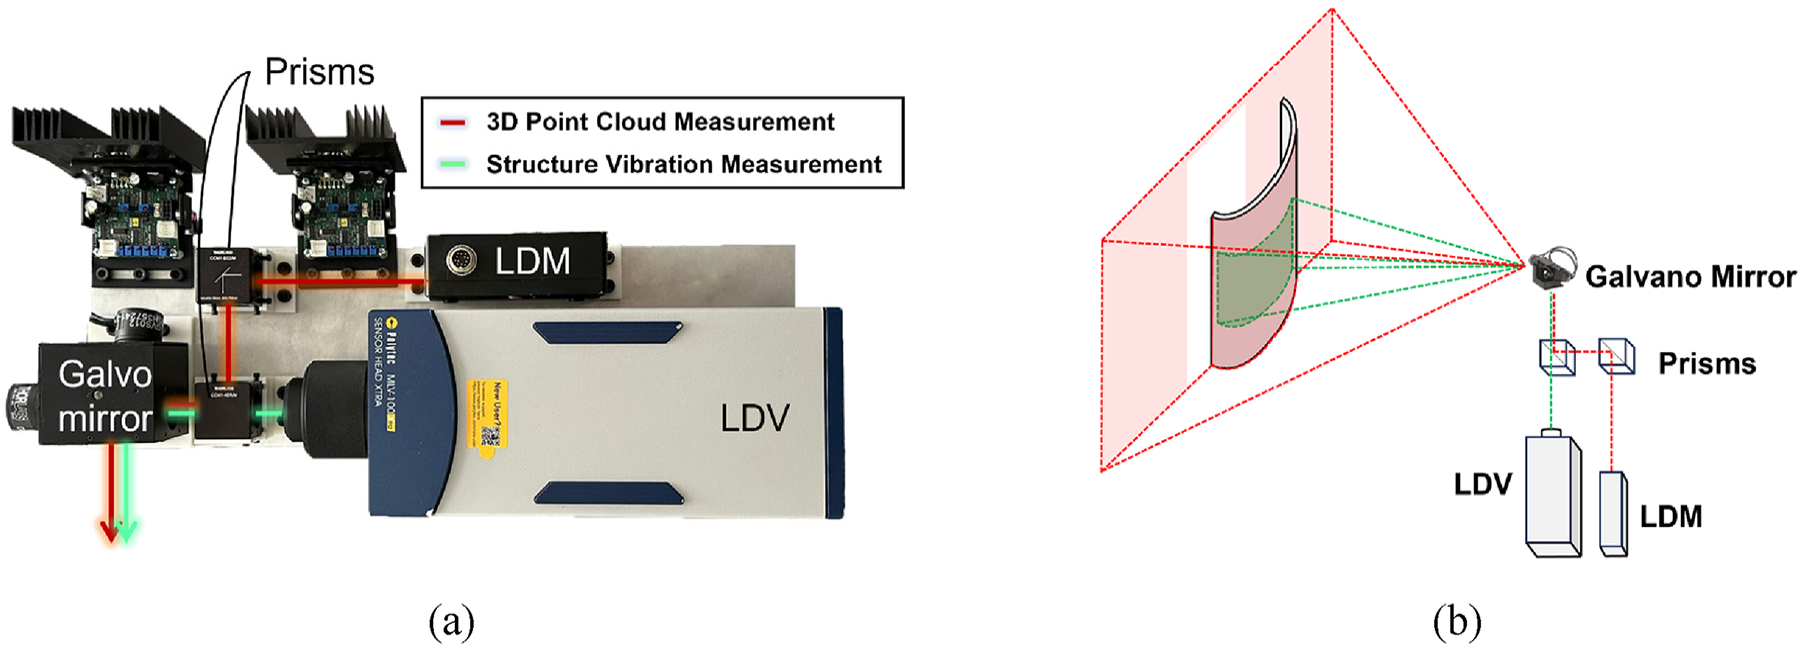
Integrated laser scanning system: (a) actual system configuration and (b) operation schematic.
As shown in Figure 5(a), the Galvo mirror is moved along the X- and Z-axes by θ and φ, respectively, with intervals of several centimeters (which is about 10 times the laser scan spacing), and the distance D is measured using the LDM; this yields a 3D point cloud of the structure’s shape based on the following spherical coordinate expressions:
Figure 5(b) illustrates the 3D point cloud of a tilted plate measured using the LDM in the integrated laser scanning system.
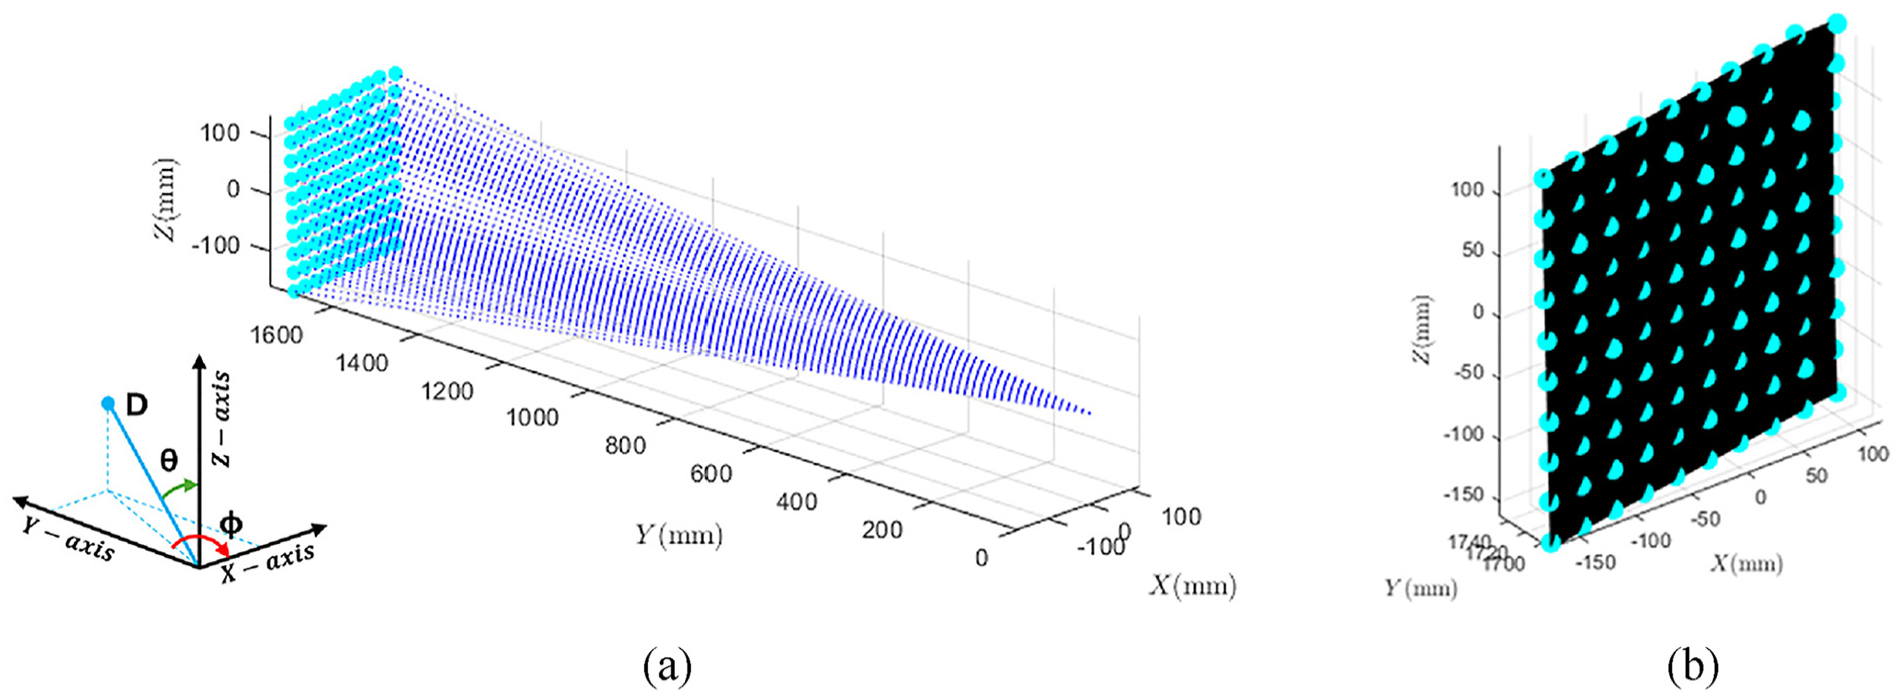
Three-dimensional point cloud measurements using LDM: (a) coordinate of point based on distance and angles and(b) estimated plane.
Shape estimation
Shape estimation using a 3D point cloud involves several key steps. First, the measured 3D point cloud must represent the shape of the structure accurately. To obtain a mathematical representation of the structure’s shape, polynomial fitting is applied to the
where akl denotes the coefficients of the polynomial, p and q are the degrees of the polynomial in x and
To determine the optimal polynomial, we varied
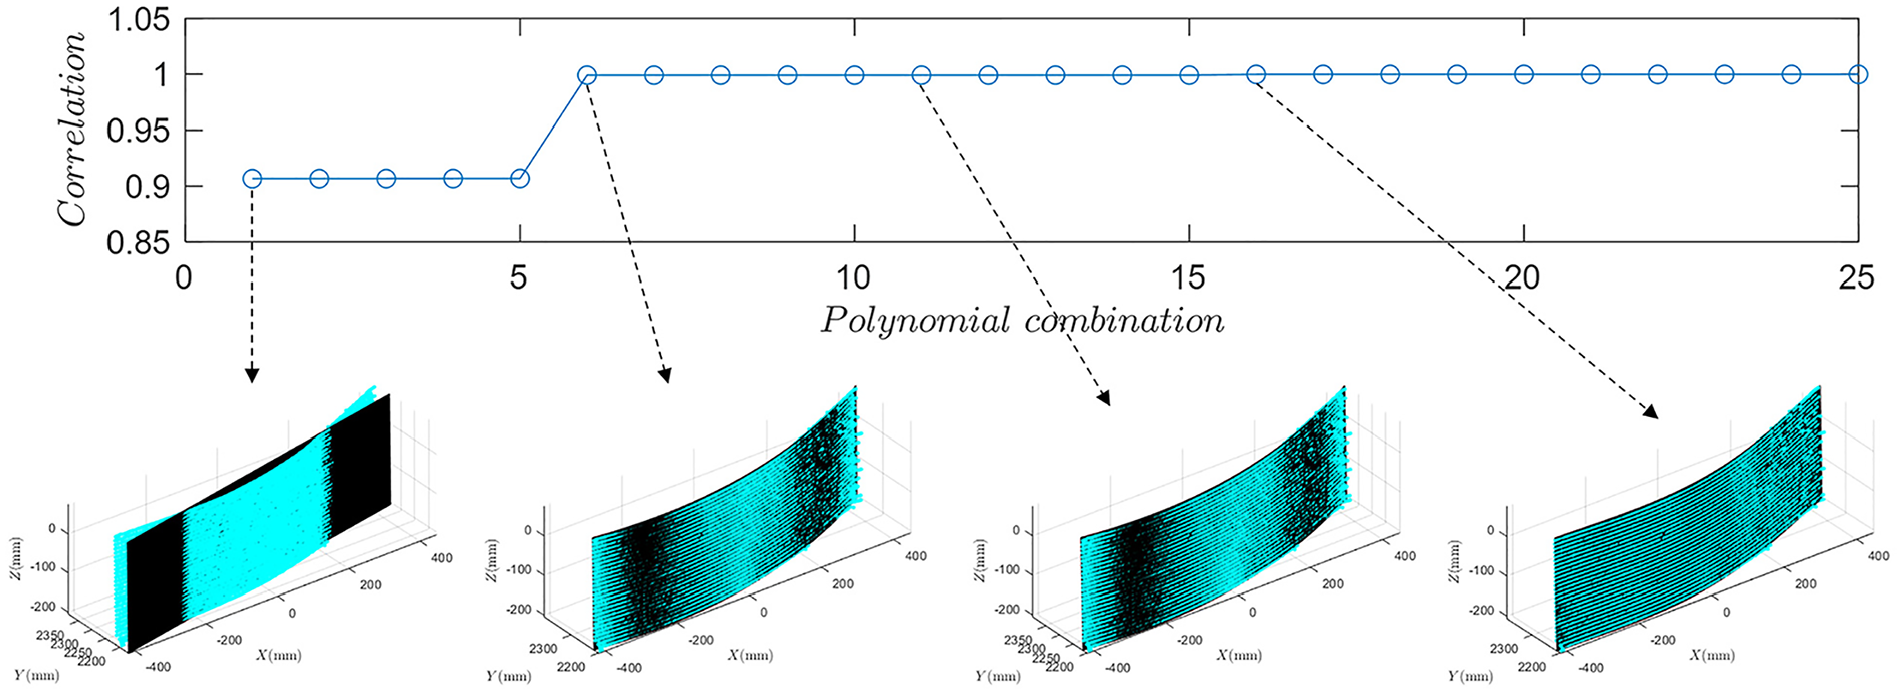
Shape estimation through maximum correlation analysis.
Nonuniform spacing error indicator
Figure 7(a) illustrates the nonuniform spacing issue on curved surfaces, as described in the “Steady-state ultrasonic wavefield measurements in curved structure” section. With traditional scanning methods, uniform spacing is achieved on flat, parallel plates. However, on curved surfaces, the scan spacing can increase or decrease depending on the curvature, leading to distortion of the spatial information in the measured data. This distortion can cause errors in wavenumber estimation and compromise the extraction of wavenumber components related to defects, thus hindering defect detection.
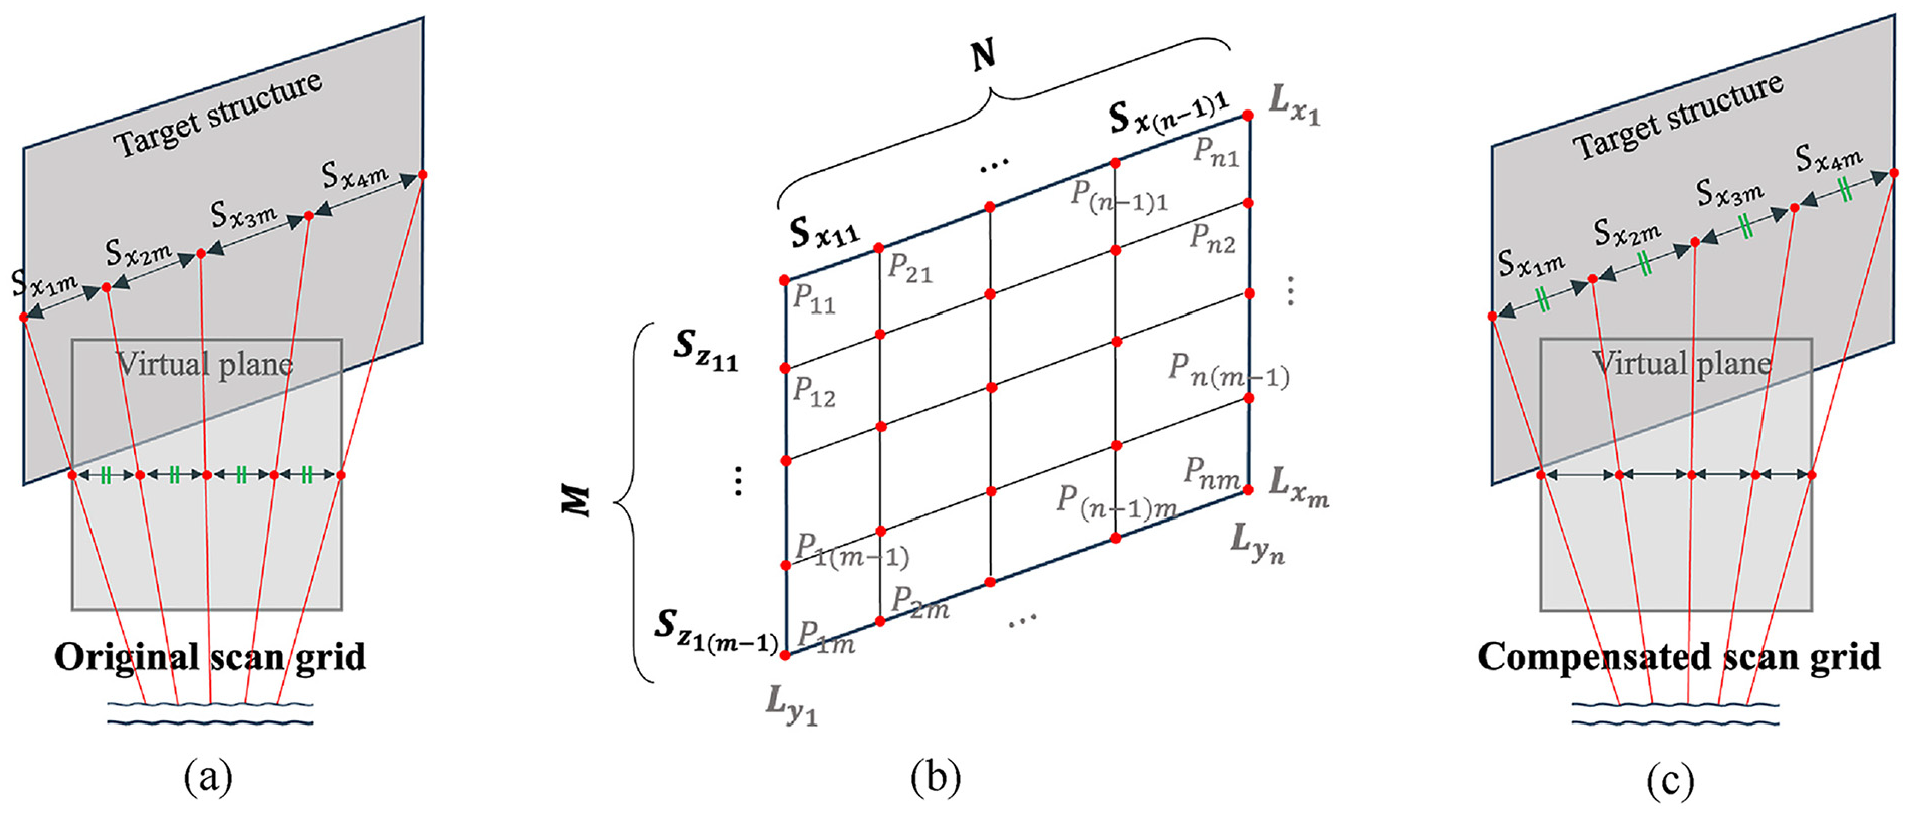
Spacing compensation process: (a) before compensation, (b) schematic of scan grid, and (c) after compensation.
To overcome this issue, the first step is to calculate the spacing error, which indicates the extent of variation in scan spacing. As illustrated in the schematic of the scan grid in Figure 7(b), the spacing error is defined by the following equations:
where
Scan grid compensation and adaptive scan grid formation
To correct the position of each scan point, the spacing error indicator defined earlier is multiplied by the average scan spacing for each scan line. The average scan spacing is calculated by dividing the length of each scan line by the number of scan points. The lengths of the curves along the X-axis and Z-axis can be approximated by summing the small intervals between successive points. This is expressed mathematically as
In these equations,
The average scan spacing for each scan line is calculated using the following equations:
Here,
Next, the calculated spacing error is used to adjust the differences between the measured and the designed scan spacings, thereby creating an optimized scan grid adapted to the structure. These average scan spacings and spacing error indicators can be used to correct the coordinates of each scan point to address nonuniform spacing. The compensated coordinates can be calculated using the following equations:
with the initial conditions
Using the compensated
As shown in Figure 7(c), this approach ensures that the scan grid is accurately compensated for nonuniform spacing, thereby improving the accuracy of the scanned data. Figure 8 illustrates the steady-state ultrasonic measurements and imaging results with the compensated uniform scan spacing for the structure shown in Figure 3. Due to the compensation process, the wavenumber data in Figure 8(a) are more accurate than the misestimated wavenumber data in Figure 3(b). Figure 8(b) presents the imaging result, which is significantly more accurate than that in Figure 3(c); this demonstrates the effectiveness of the scan spacing compensation in correcting nonuniform spacing and enhancing the overall quality of ultrasonic measurements and imaging.
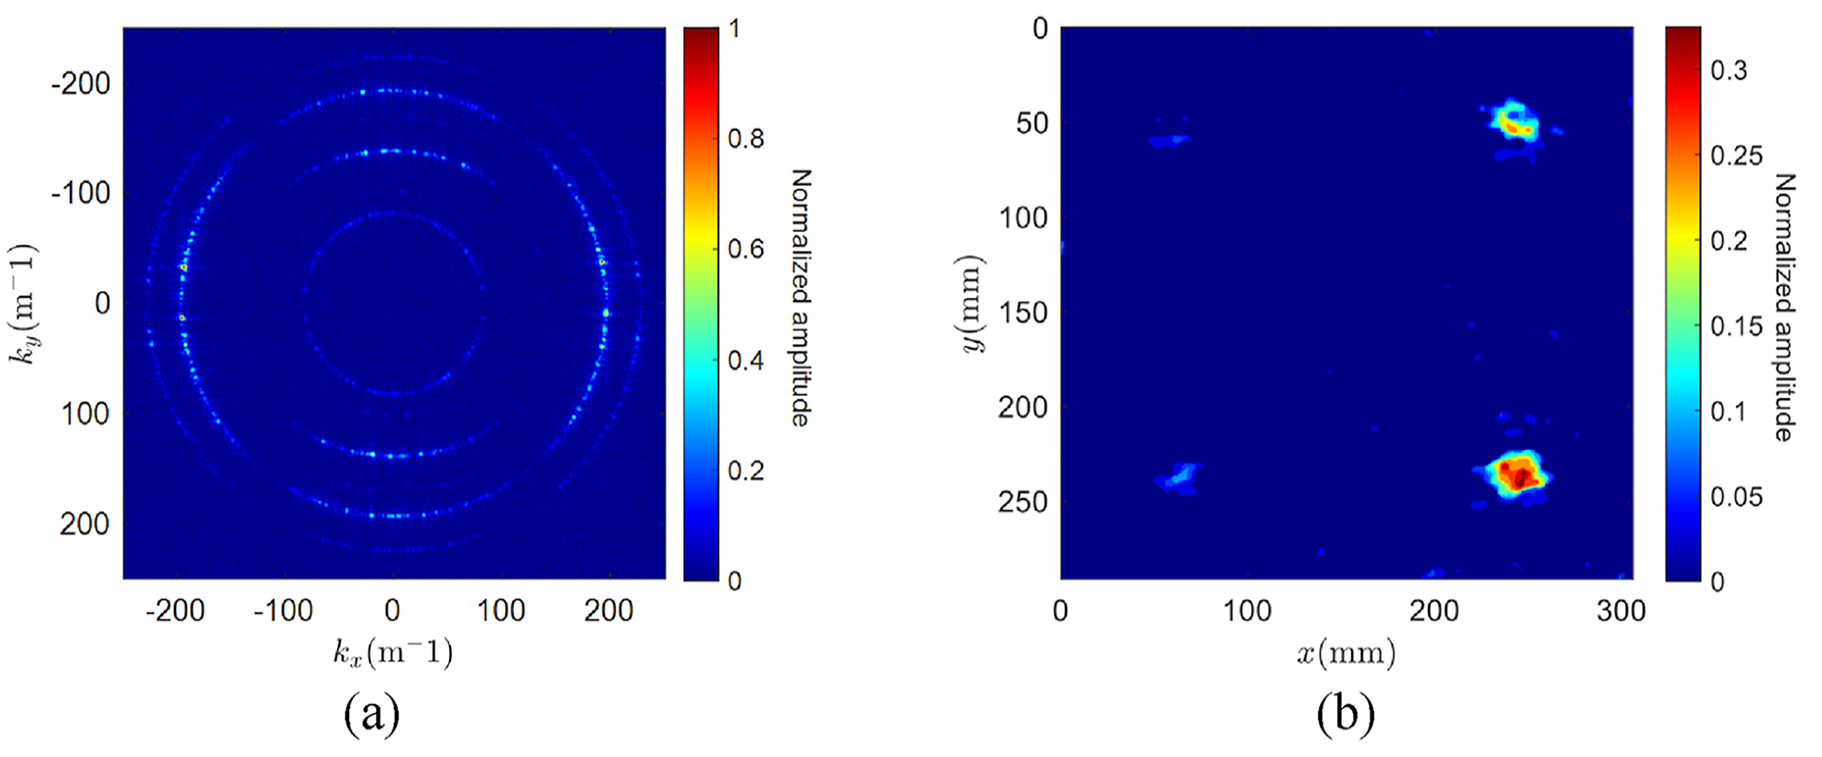
Wavefield data in wavenumber domain and imaging result with compensated uniform scan spacing: (a) wavenumber data and (b) imaging result.
Experimental validation
We employed the integrated laser scanning system to assess structural integrity. To induce vibrations in the structure, we used a PZT actuator (APC 850, disk type) driven by an amplifier (NF HAS4052). The input signal to the PZT was amplified to 40 V, and the signal shape was a sine wave, chosen to achieve a steady-state ultrasonic response. The structural responses were precisely measured by scanning the structure with the LDV (Polytec OFV-5000 Xtra), which was supported by a mirror-tilting device (Thorlab GVS-012). This device has a coverage angle of up to 20° in both the horizontal and vertical directions and is designed to efficiently reflect more than 95% of light in the wavelength range from 500 nm to 2.0 µm; hence, it is compatible with the lasers used in both the LDV and LDM. A data acquisition system (NI USB-6363) operating at a sampling frequency of 2 MHz was used to generate and measure the signals. This comprehensive system operates in two stages. First, the LDM is used to acquire a 3D point cloud of the structure to be inspected and to generate an optimal scan grid based on the structure’s geometry. Thereafter, the LDV is used to measure ultrasonic signals on the derived optimal scan grid.
Damage imaging in a curved aluminum plate with corrosion
Experimental setup
The experiments were performed on a curved aluminum plate (900 × 300 × 2.6 mm) with simulated corrosion to validate the proposed technique, as illustrated in Figure 9. The corrosion was simulated on the side of the specimen opposite to the scanning area; thus, it was not visible during the scanning process. Three corrosion spots were created, with depths of 1.6, 1.8, and 2 mm. The structure was excited with an excitation frequency of 250 kHz via a standing wave generated by the PZT actuator mounted in the center, as displayed in Figure 9(b). The surface velocity of the aluminum plate was directly measured using an LDV with a configuration of 50 mm/s/V. The velocity range observed during the experiment was ±100 mm/s, corresponding to harmonic sinusoidal motion driven by the steady-state response. The scan spacing, with a spatial resolution of 0.5 mm, was set to ensure detailed measurements. The curved aluminum plate was arranged such that the leftmost part was parallel to the scanning system, with the curvature increasing toward the right, as shown in Figure 10(a). This setup allowed us to examine the effect of curvature on the scanning process. Figure 10(b) illustrates the calculated angles of incidence for each scan point, showing the angle between the scanning laser and the surface of the structure at each point. These angles can potentially misalign the laser beam, which can affect the measurement accuracy.
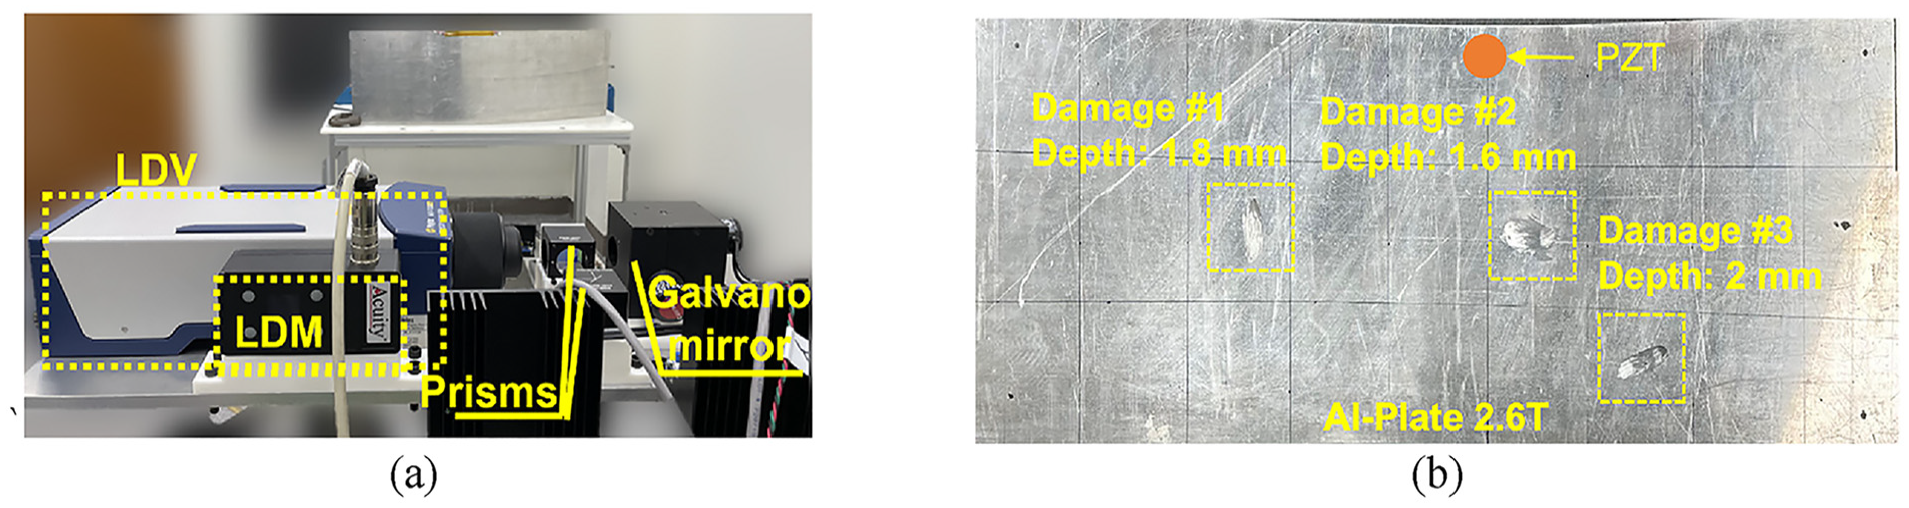
Experimental setup on a curved aluminum plate: (a) scanning system with LDV and galvanometer, (b) rear side of test specimen with defects.

Incidence angle of laser on the surface of the curved aluminum plate: (a) top view of the structure showing surface curvature and (b) incidence angle at each measurement point.
Shape estimation result
For the aluminum structure, polynomial fitting with degrees of 4 for x and 3 for
Using this polynomial model, the proposed compensation technique generates an optimal scan grid that enables scanning with uniform spacing across the surface of the structure, as shown in Figure 11(b). The comparison of the scan spacings in the zoomed-in region shown in the inset of Figure 11(b) indicates that the conventional scan grid results in nonuniform spacing, especially with increasing curvature. However, the proposed compensation technique provides uniform scan spacings, allowing for precise scanning at the desired points.

Shape estimation and scan grid compensation on a curved aluminum plate: (a) shape estimation results and(b) comparison between original scan grid and compensated scan grid based on surface curvature.
Imaging result
The imaging results presented in this section are based on wavenumber data and the application of a previously developed wavenumber filtering technique. Wavenumber data represent the spatial frequency of wave propagation and are essential for distinguishing wave modes, such as symmetric and antisymmetric modes, which depend on material properties, thickness, and the frequency of ultrasonic excitation. When defects are present, these main wave bands exhibit deviations, appearing as sidebands caused by changes in wave propagation. By analyzing these patterns, the technique enables accurate defect detection and visualization. Because the structure has an elongated shape and as the incidence angle increases toward the right, as shown in Figure 10(b), the spacing error also increases accordingly when using the uncorrected scan grid. This results in wavenumber estimation errors, as seen in Figure 12(a), which affect the imaging results shown in Figure 12(b). Specifically, Figure 12(a) shows that incorrect wavenumber estimation values for the normal region coexist with the defect-induced wavenumber shifts outside of each ultrasonic mode, thereby compromising the accuracy of defect detection and visualization substantially. Applying the compensated scan grid obtained using the developed correction technique significantly reduces the spacing error, ensuring accurate wavenumber estimation, as shown in Figure 12(c). This allows for the precise filtering of defect-induced wavenumber shift components, enabling accurate detection, as demonstrated in Figure 12(d). In addition, the defects can be visualized at their exact locations and with the correct sizes.
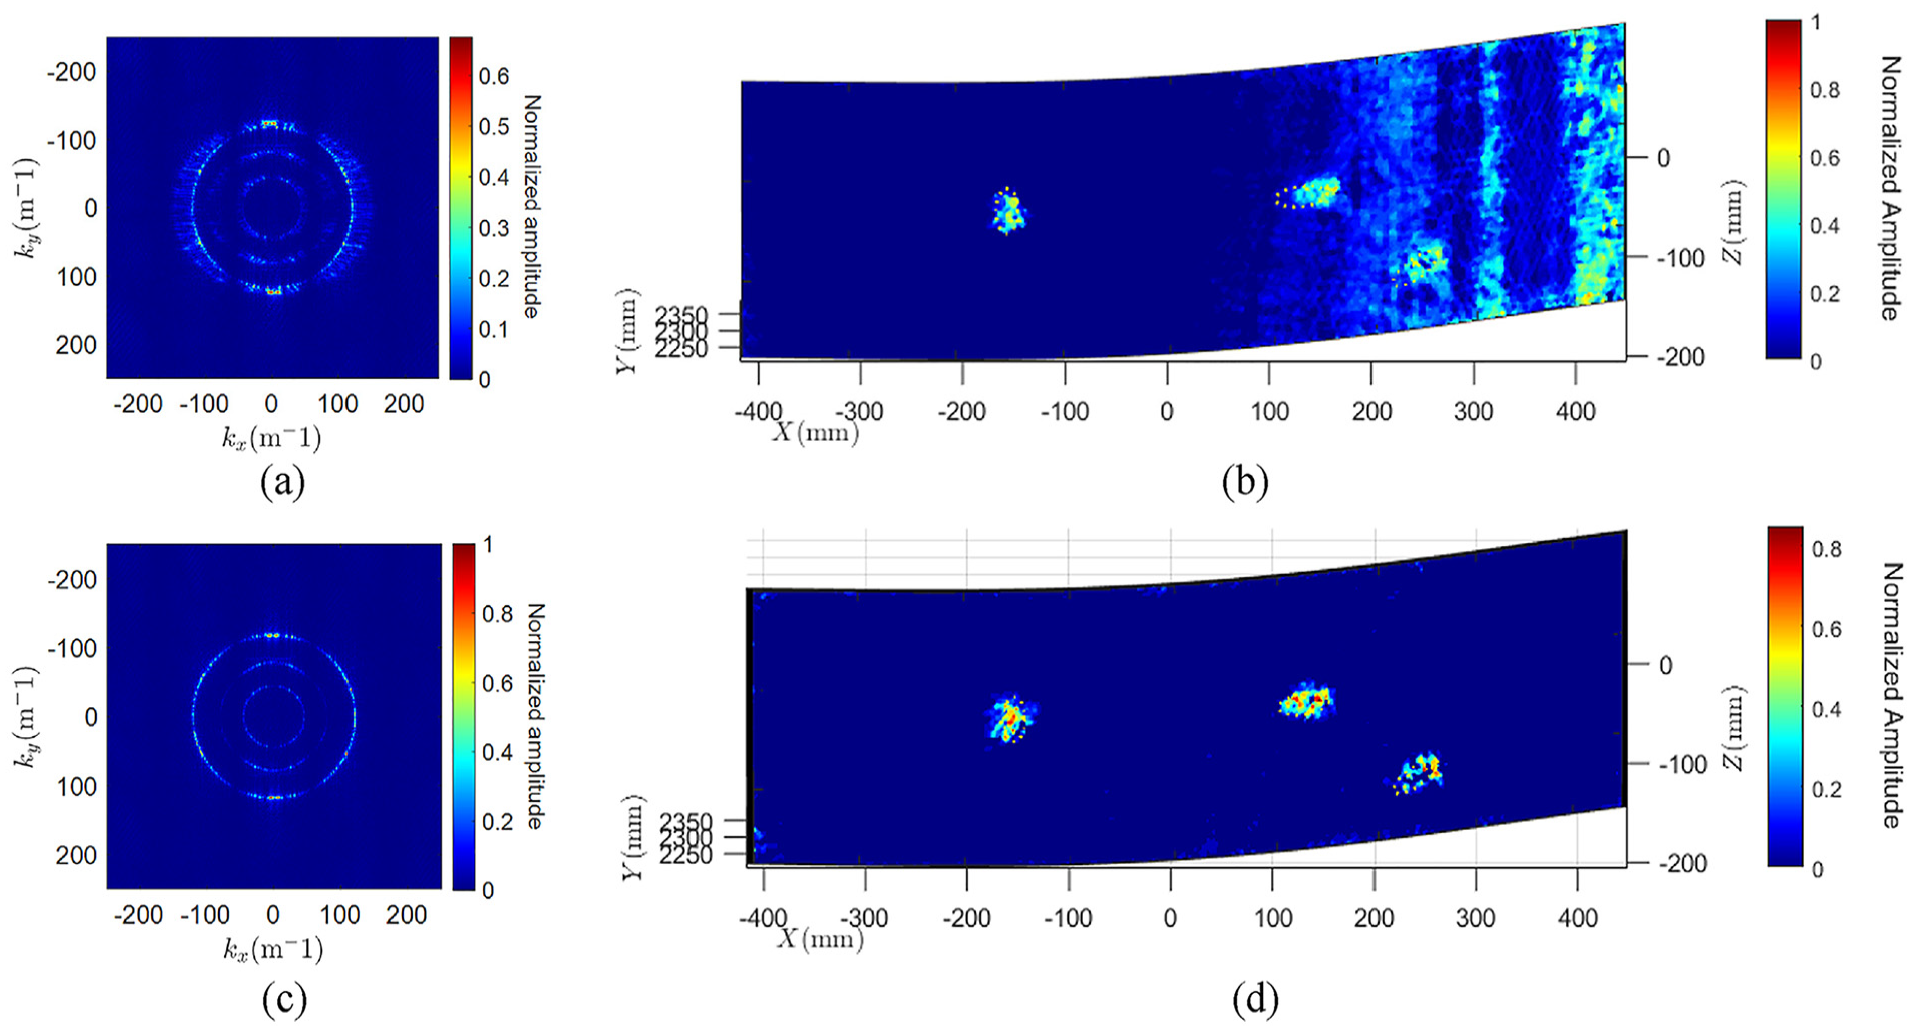
Comparison of wavenumber data and imaging results between original and compensated scan grids on the aluminum curved plate: wavenumber data obtained using (a) original and (c) compensated scan grids and (b, d) corresponding imaging results with the defect shapes indicated by the yellow dotted lines.
Damage imaging in wing skin–shaped curved composite plate with delamination
Experimental setup
The proposed technique was also validated through experiments on a composite plate with defects of various sizes and in different laminate layers, as displayed in Figure 13(b). The composite plate was a 650 × 300 × 2 mm carbon fiber–reinforced polymer (CFRP) panel made of SKYFLEX USN12 prepreg material, with a lay-up configuration of [0/45/90 s] containing eight plies. It featured 15 distinct defects, which were created by inserting 80-μm-thick Teflon tape of different sizes (5 × 5–20 × 20 mm) into the third, fifth, and seventh laminate layers. A standing wave with a 300 kHz frequency was generated using the PZT actuator to excite the structure. The surface velocity of the composite plate was directly measured using an LDV configured with a sensitivity of 50 mm/s/V. The velocity range measured during the experiment was ±12.5 mm/s, reflecting steady-state sinusoidal motion. To ensure uniform wave propagation across the inspection area and mitigate the anisotropic effects of the composite material, four PZTs were attached outside the inspection area at positions top, bottom, left, and right of the composite structure. The scan spacing, with a spatial resolution of 0.25 mm, was set to ensure detailed measurements and thorough inspection. Figure 14(a) depicts the composite structure, designed to mimic an aircraft wing, and Figure 14(b) shows the curvature at each scan point.

Experimental setup on curved CFRP plate: (a) scanning system with LDV and galvanometer, (b) sizes of delaminations and the specific composite layers where they are located.

Incidence angle of laser on the surface of the curved CFRP plate: (a) top view of the structure showing surface curvature and (b) incidence angle at each measurement point.
Shape estimation result
As seen in Figure 14(a), the left side of the composite structure is relatively flat, while the right side curves sharply, creating a more complex surface geometry. Consequently, polynomial degrees of 5 for x and 5 for z yielded the highest correlation coefficient of 0.999. The polynomial model is expressed as
With this fitted polynomial, the proposed technique ensured accurate scan grid compensation for the complex geometry of the composite structure. Figure 15 shows the compensation of nonuniform spacing to uniform spacing, as illustrated by the blue dots. While the quantitative limits of the laser incidence angle for the structure vary depending on the surface conditions, the proposed technique could accurately inspect curvatures of up to approximately 55° in this structure, which is larger than the curvature of the first aluminum structure.
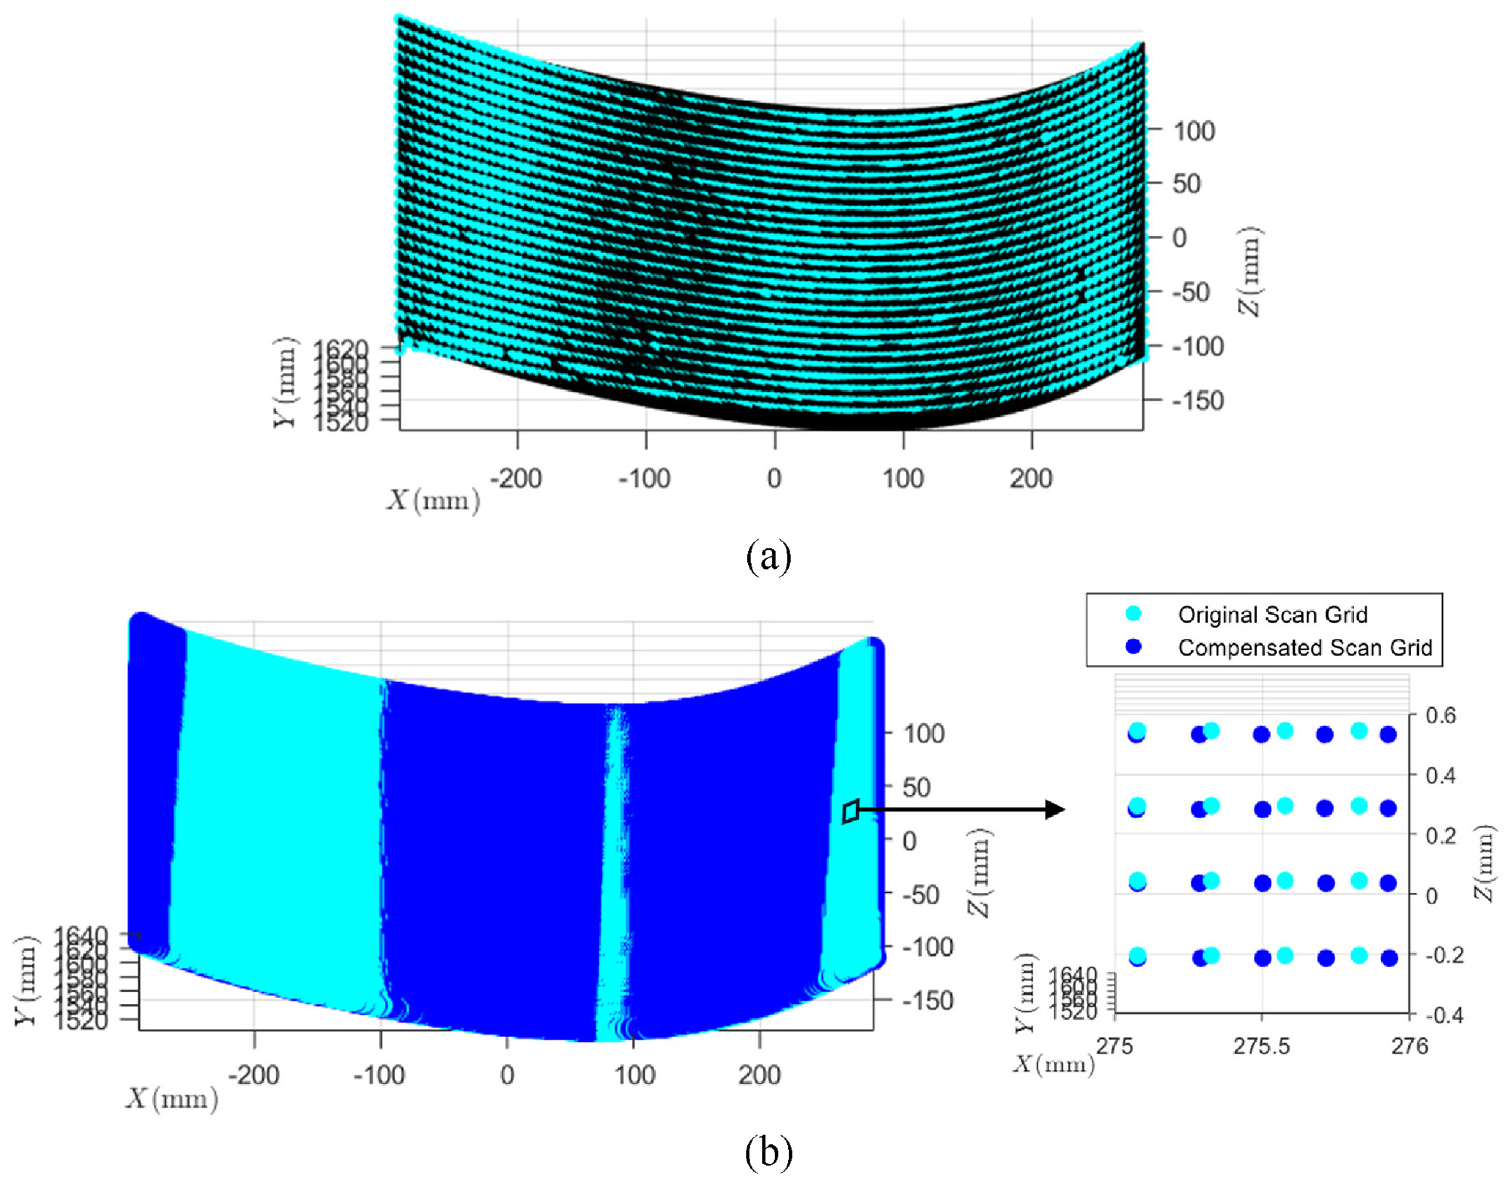
Shape estimation and scan grid compensation on curved CFRP plate: (a) shape estimation results and (b) comparison between original scan grid and compensated scan grid based on surface curvature.
Imaging result
Figure 16 illustrates the steady-state ultrasonic wavefields in the wavenumber domain and the imaging results for the curved composite CFRP plate. As depicted in Figure 16(a), when the structure was scanned using the conventional method, wavenumber estimation errors due to the nonuniform scan grid were clearly observed across the three ultrasonic modes (A0, S0, and A1). In addition, the directionality inherent in the anisotropic material and the rapidly changing curvature of the structure toward the right exacerbated these errors. Specifically, Figure 15 shows that the conventional scanning method resulted in measurements with spacings larger than the designed value, leading to overestimated wavenumbers, as observed in Figure 16(a). This is further highlighted in the imaging results in Figure 16(b), where the erroneous wavenumber components due to the curvature variation and defect-induced components are mixed; this is especially noticeable on the left and right sides, which have significant curvature variations. Thus, the proposed scan grid correction technique effectively eliminates wavenumber estimation errors by ensuring accurate data measurement from the steady-state ultrasonic measurement stage. Figure 16(c) and (d) presents the wavenumber data and imaging results obtained from accurately measured steady-state wavefield data obtained using the proposed method. Figure 16(c) demonstrates that the proposed technique enables precise measurement of the ultrasonic modes of the structure. Figure 16(d) confirms the detectability of all 15 defects at positions with varying curvatures, thus validating the effectiveness of the proposed method in scanning and defect detection.

Comparison of wavenumber data and imaging results between original and compensated scan grids on curved composite CFRP plate: wavenumber data obtained using (a) original and (c) compensated scan grids respectively and (b, d) corresponding imaging results with the actual defect shape indicated by the yellow dotted lines.
These results confirm that the proposed technique, which integrates an LDV and LDM coupled with associated algorithms, can be employed for damage detection on highly complex structures. The integration with the LDM is straightforward as both devices can share one Galvo mirror for measuring structural responses and estimating the structure shape. For a given structure, an LDM scan can be performed in advance to estimate the shape and generate optimal scan grids. The LDV can then be used to scan the predefined grids created by the LDM. This two-step scheme could widen the applicability of LDV-based damage detection techniques to various structures.
Discussion
The applicability of the proposed integrated laser scanning system was validated through two experiments conducted on aluminum and CFRP plates. In the first experiment, accurate measurements were achieved for aluminum plates with incident angles up to approximately 33°, reflecting the limitations of high reflectivity and specular reflection. The second experiment on CFRP plates, characterized by their multi-layered structure and diffuse reflection properties, demonstrated accurate measurements for incident angles up to approximately 58°. To further evaluate the applicability of the technique, additional testing was performed by systematically increasing the incident angle in increments of 5° on the same structure. These tests revealed that accurate measurements were achievable up to 35° for aluminum and 70° for CFRP. The higher maximum incident angle for CFRP is attributed to its ability to scatter light in multiple directions, reducing dependency on precise alignment with the LDVs detection head. Conversely, aluminum’s specular reflection nature results in a stronger reliance on optimal alignment between the laser and the surface, thus limiting its performance at higher angles. These results underscore the significance of material-specific considerations when applying the proposed scanning technique. While the reflective characteristics of aluminum restrict its adaptability on highly curved surfaces, the diffuse reflection capabilities of CFRP expand the potential applications of the method. By integrating such material-dependent insights, the proposed system demonstrates enhanced reliability and versatility across various structural configurations and surface geometries.
Conclusion
The primary contributions of this study lie in cost efficiency and adaptability. The proposed system integrates a single LDV with a low-cost LDM, supported by an advanced compensation algorithm, to achieve comparable performance to conventional commercial systems without the complexity and high costs. While traditional commercial systems are generally constrained by their intricate configurations and prohibitive expenses, which limit their use in resource-constrained environments, the proposed system overcomes these barriers and enhances the accessibility of SHM technologies. In particular, a thorough analysis of the performance and applicability of the proposed system and compensation technique has been conducted. Experimental validation on structures with various curvatures demonstrated the system’s capability to accurately detect and visualize defects in materials like aluminum and CFRP. The proposed method effectively reduced wavenumber estimation errors and successfully isolated defect-induced changes from ultrasonic modes, enabling precise identification and visualization of defect locations and sizes. These results emphasize the practicality of the proposed system and its effectiveness in addressing the challenges posed by nonuniform scan spacing on curved structures. Moreover, by providing optimized scan grids and enabling the collection of precise data from curved structures under diverse material conditions, the proposed system demonstrates its potential to economically replicate the performance of expensive commercial systems. This study broadens the feasibility of adopting SHM technologies and contributes to improving the safety and operational efficiency of structural systems. While the system has demonstrated robust performance, some minor limitations related to variations in signal intensity and energy density due to reflectivity and incidence angles have been observed. However, these challenges can be addressed through further research and development, paving the way for the proposed system to become a widely applicable SHM solution for diverse structures and environments.
Footnotes
Declaration of conflicting interests
The author(s) declared no potential conflicts of interest with respect to the research, authorship, and/or publication of this article.
Funding
The author(s) disclosed receipt of the following financial support for the research, authorship, and/or publication of this article: This work was supported by the Korea Institute for Advancement of Technology (KIAT) grant funded by the Korea Government (MOTIE) (RS-2024-00406796, HRD Program for Industrial Innovation) and the Korea Institute of Planning and Evaluation for Technology in Food, Agriculture and Forestry (IPET) through the Agriculture and Food Convergence Technologies Program for Research Manpower Development, funded by the Ministry of Agriculture, Food and Rural Affairs (MAFRA) (project no. RS-2024-00397026).
