
Abstract
As a fundamental material in the aerospace sector, the long-term service performance of composites is inseparable from their internal damage evolution. Therefore, studying the relationship between damage evolution and the mechanical behavior of composites in different aging states is of great significance. Acoustic emission (AE) has emerged as an effective method for investigating the damage evolution of composites due to its high sensitivity to material microscopic damage and the superiority of real-time monitoring, and the key to studying damage evolution lies in the accurate selection of AE features. The Laplacian score (LS) is a traditional algorithm for feature selection in AE, but its limitations severely hinder the application of the algorithm. In this study, an improved LS feature selection algorithm (Imp-LS) is proposed, which enhances the ability to identify feature correlations and improves the robustness of feature selection. The robustness of the Imp-LS algorithm and the effectiveness of AE for whole-life health monitoring of composites are validated through monitoring the mechanical behavior of double cantilever beam testing on various aging composites.
Introduction
Composites are extensively utilized in the aerospace sector owing to their high specific strength, specific modulus, elevated temperature resistance, and corrosion resistance.1–3 The predominant damage modes of composites include matrix damage, delamination, and fiber damage; moreover, the evolution of damage significantly impacts the safety of materials during service. 4 Therefore, it is imperative to characterize the damage evolution of composites utilizing non-destructive testing (NDT) techniques. Acoustic emission (AE) has emerged as an effective method for investigating damage evolution due to its high sensitivity to microscopic damage and advantages in real-time monitoring. 5
AE is a transient elastic wave phenomenon generated by the rapid release of energy from a damaged source within a material, which has gradually evolved into a NDT method. In recent years, studies on the application of AE technology in the field of damage characterization of composites have made significant progress.6,7 Brunner 8 investigated the damage evolution of fiber-reinforced polymer (FRP) specimens with predominant damage modes, employing AE and finite element analysis. Lyu et al. 9 established a correlation between AE signal features and damage types in 2D-C/SiC specimens subjected to creep testing in a humid oxygen environment, thereby revealing differences in failure mechanisms between short- and long-lived samples. Jung et al. 10 investigated the variation of AE signals with propagation distance in carbon fiber/epoxy composites and assessed the applicability of an improved b-value in composites. Saeedifar et al. 11 utilized AE to perform a comprehensive damage assessment of titanium metal and carbon FRP (CFRP) bi-material bonded structures. The study demonstrated that AE has the potential to monitor the integrity of aerospace composite-metal bonded structures. Wang et al. 12 investigated the relationship between damage modes, states, and AE feature parameters, through three-point bending testing on three-dimensional woven ceramic matrix composites. Du et al. 5 automated the damage diagnosis process using AE and a deep learning model that incorporates an attention mechanism (AM). Compared to traditional machine learning models, the convolutional neural network model combined with AM achieved superior pattern recognition accuracy.
Damage signal processing serves as the foundation for characterizing damage. AE features are information parameters extracted from damage signal waveforms, and the specific damage information embedded within each feature remains unknown. However, the utilization of redundant or irrelevant features adversely affects the efficiency and accuracy of damage detection and classification. Consequently, preserving the rich information features through dimensionality reduction is crucial for effective composite damage monitoring using AE. Feature extraction 13 and feature selection 14 represent two fundamental methods for dimensionality reduction. Feature extraction involves integrating information from multidimensional features into low-dimensional representations, which often results in a change in the physical interpretation of these features. Feature selection selects specific features from the original feature set and combines them into a new feature subset, which preserves the physical meaning of the features. Effective data dimensionality reduction does not necessitate adherence to a single method; rather, dimensionality reduction methods should be selected or combined based on specific requirements. Feature selection can be classified into supervised, semi-supervised, and unsupervised categories based on the utilization of labels. 15 Obtaining a priori knowledge of labeling information from AE data is challenging due to its inherent complexity, so unsupervised methods represent a research focus. 16 Based on differing operational strategies, feature selection can be further classified into filtered, wrapper, and embedded methods. 17 Given the computational costs, filtered and embedded methods are more appropriate for the feature selection process concerning AE data. 18 Gulsen et al. 19 integrated multiple feature selection methods to investigate damage patterns in CFRP sandwich composites subjected to transverse compressive loads, thereby demonstrating the effectiveness of integrated methods in enhancing the clustering performance of damage-related AE data. Nie et al. 20 proposed an embedded unsupervised feature selection framework founded on classical least squares regression (LSR) and discriminative k-means, termed fast sparse discriminativek-means (FSDK). The framework enhances feature selection effectiveness by streamlining the optimization model and employing sparse regression strategies. The Laplacian score (LS) is a filtering algorithm that has been utilized in AE feature selection.21,22 Oz et al. 23 employed the LS algorithm for damage feature selection for tensile testing of CFRP composites in the presence of transverse cracks and also analyzed the correlation between damage patterns and AE features. Xu et al. 18 applied the LS algorithm alongside two additional feature selection methods for the dynamic evaluation of AE data streams from bonded joints in composite wind turbine blades, investigating the roles of AE features in both damage identification and the indication of damage processes.
However, the LS algorithm not only does not take into account the relationships among features but also relies on empirical settings for its parameters, which severely impacts the usability of the selected feature subset and complicates subsequent AE data analysis. Furthermore, the effectiveness of employing AE to monitor damage in composites throughout their entire service life remains unvalidated. It is still uncertain whether the feature selection for AE data associated with damage in composites across different aging states is sufficiently robust.
To address the above shortcomings, this paper introduces the feature correlation clustering selection (FCCS) algorithm and integrates the FSDK embedded unsupervised feature selection framework to overcome the limitations of the LS algorithm and enhance the robustness of the proposed approach. Furthermore, utilizing the accelerated aging testing to simulate the material aging states of glass FRP (GFRP) composites across various service periods. The robustness of the Improved LS (Imp-LS) algorithm and the effectiveness of AE for whole-life health monitoring of GFRP composites are demonstrated through monitoring the mechanical behaviors during double cantilever beam (DCB) testing of composites with different aging states.
The remainder of this paper is organized as follows. In the section titled “Experiments,” the specimen conditions, aging states, and mechanical testing method are described. In the section titled “Feature selection algorithms,” the LS algorithm is reviewed, and an improved version of the algorithm is proposed. In the “Results and discussions” section, the effects of feature selection for the two methods are compared, and the application of the Imp-LS algorithm to the damage characterization of composites is illustrated. The principal conclusions of this paper are presented in the section titled “Conclusion.”
Experiments
Specimen preparation
The DCB specimens composed of 24 layers of unidirectional (0°) fiberglass cloth impregnated with barium phenolic resin were utilized in this study, as depicted in Figure 1. The fundamental performance parameters of the material are presented in Table 1, with a single-layer thickness of 0.205 mm. Initial cracks were introduced by embedding a PTFE plastic film with a length of a0 = 40 mm. The total length L = 180 mm of the specimen, width b = 25 mm, thickness 2h = 5 mm, and a 20-mm fixture clamping end was pre-fabricated on the crack side of the specimen.
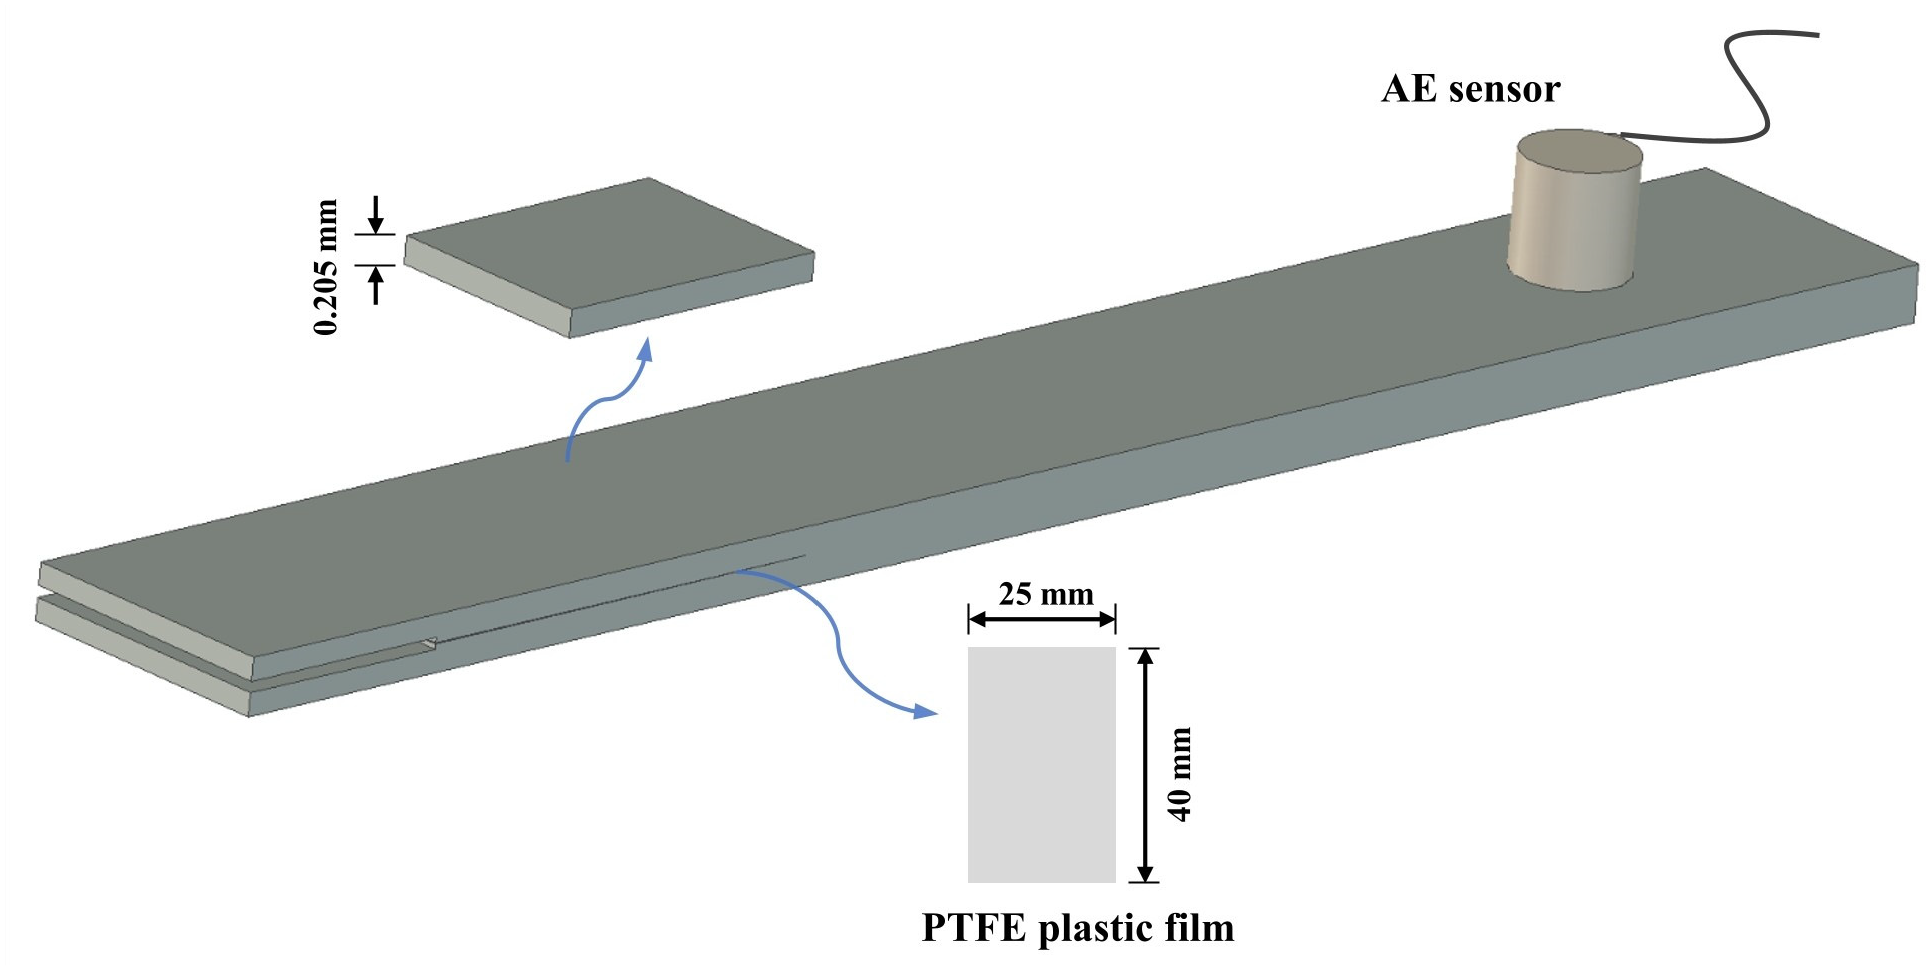
Schematic diagram of the DCB specimen. DCB: double cantilever beam.
Fundamental performance properties of the specimens.
To simulate the state of composites under varying service periods, all DCB specimens were exposed to five different aging environments with distinct aging parameters. The aging settings and corresponding specimen numbers are presented in Table 2. The aging environment was controlled using an Angelantoni Test Technologies S.R.L. DM1200C temperature and humidity test chamber, as shown in the physical diagram in Figure 2. This equipment is capable of accurately simulating both temperature and humidity, with a temperature range of −75 to +180°C and a humidity range of 10 to 98% RH.
Aging parameters for five aging states of DCB specimens.
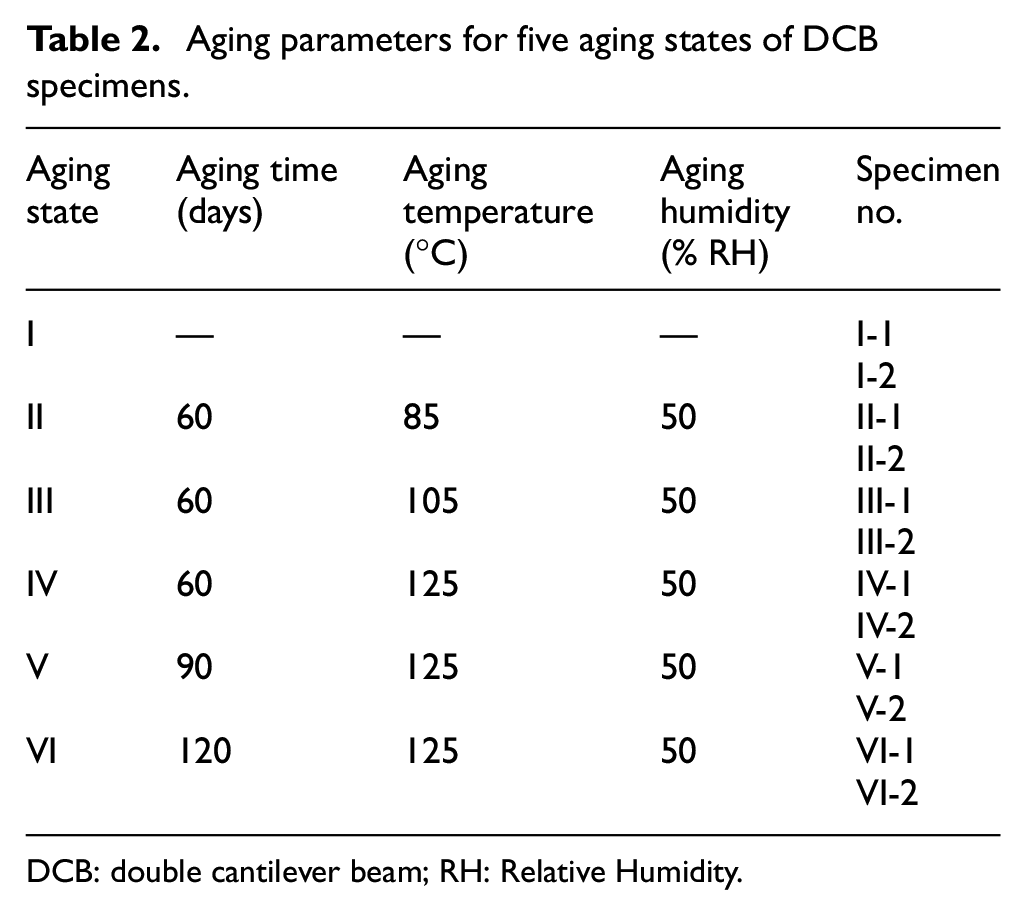
DCB: double cantilever beam; RH: Relative Humidity.
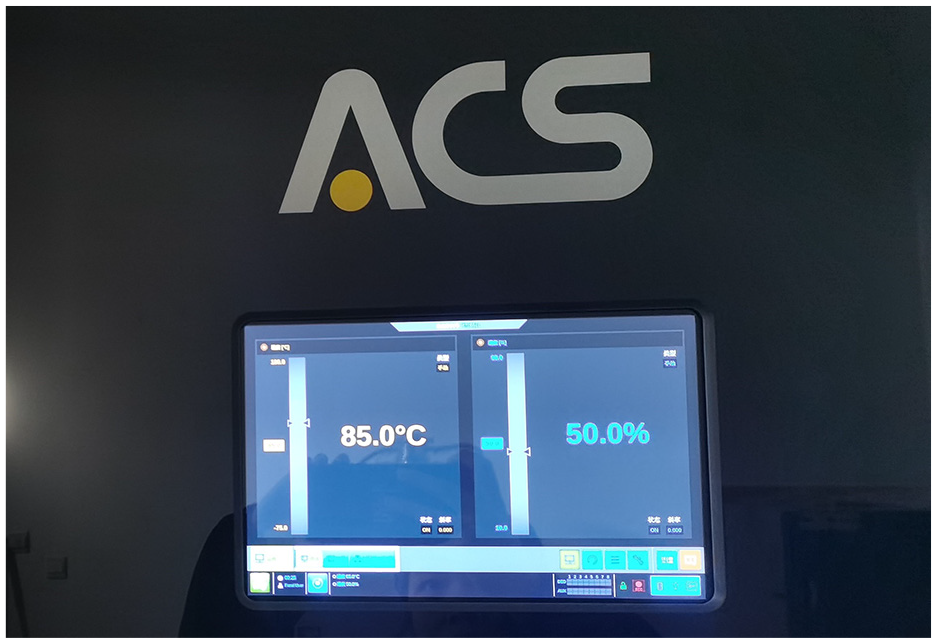
DM1200C environmental chamber.
Testing methods
All DCB specimens were tested utilizing an Instron electronic universal testing machine model 3365, employing displacement control with a speed setting of 0.5 mm/min. The testing state is shown in Figure 3, while the crack propagation of the specimen during the testing was monitored using the JKLW-U600 microscopic observation device, and the testing was concluded when the total tensile displacement exceeded 30% of the total crack length. The crack extension state observed during the intermediate loading stage is shown in Figure 4.
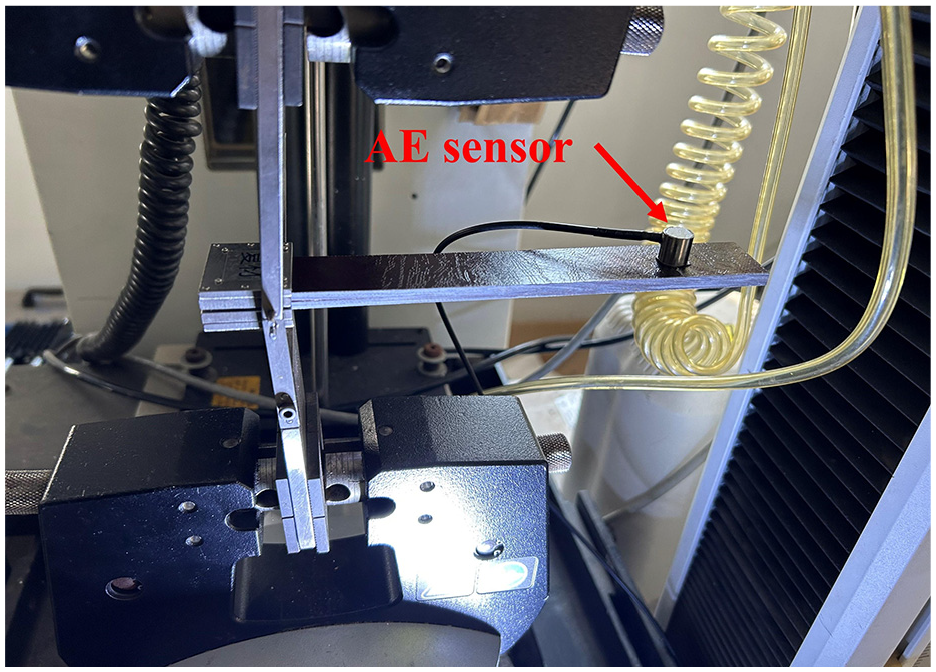
DCB and AE testing. DCB: double cantilever beam; AE: acoustic emission.
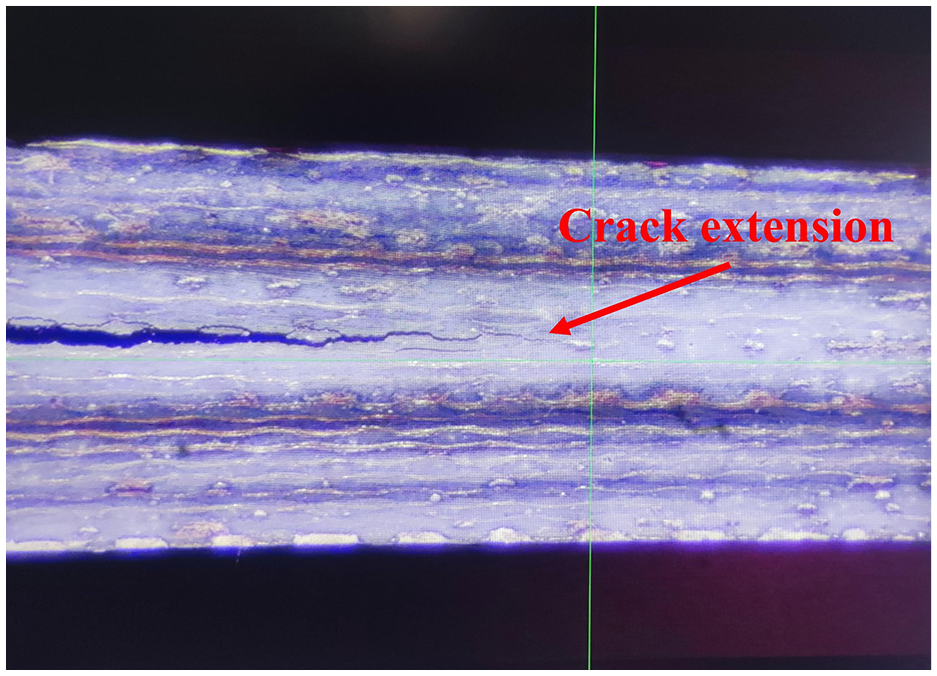
Crack extension of DCB testing specimen. DCB: double cantilever beam.
The AE system utilized in this study is a PCI-2, manufactured by Physical Acoustics Inc. in the United States. The sensor exhibits a resonance frequency of 150 kHz, a response frequency range of 20–500 kHz, a sampling frequency of 1 MHz for the testing, and a signal gain of 40 dB. The sensor with this bandwidth was selected because it has been successfully used in the AE monitoring of composites,23–25 which helps prevent the effectiveness evaluation of the improved algorithm from being affected by other factors. The common characteristics of AE hits are illustrated in Figure 5, while each AE hit contains 14 recorded features, and their definitions are provided in Table 3. The threshold for AE signal acquisition is set at 45 dB, with timing parameters such as peak definition time, hit definition time, and hit lock time established at 200, 800, and 1000 μs, respectively. Before the AE testing, the lead break testing was calibrated. 26
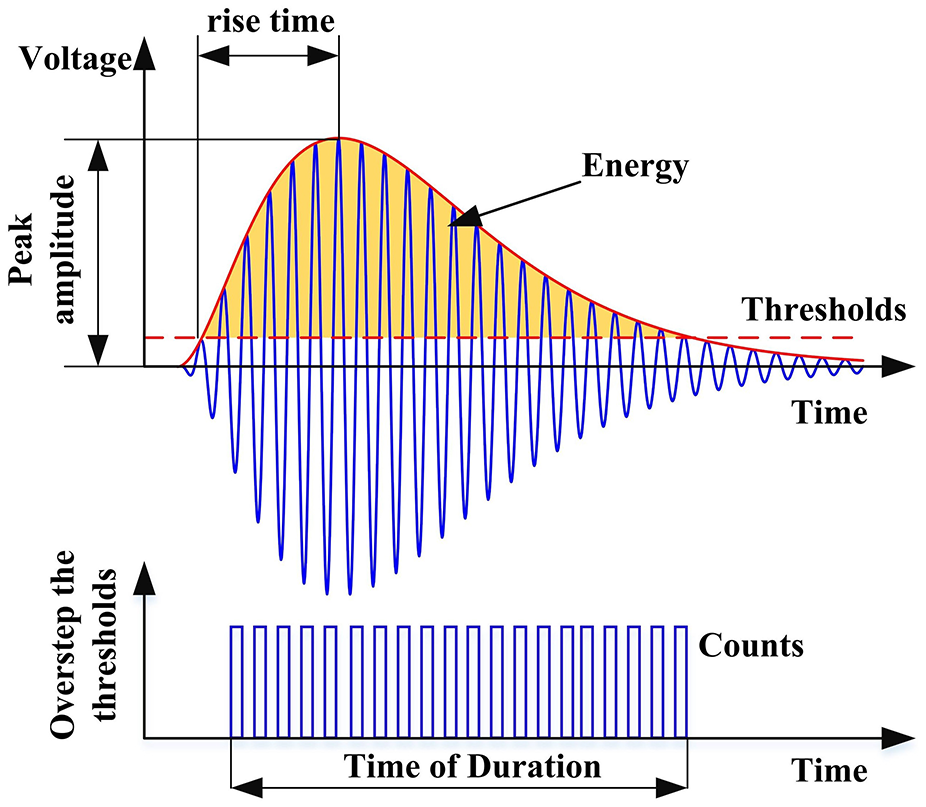
AE hit parameters. AE: acoustic emission.
Collected AE characteristics with their definitions.
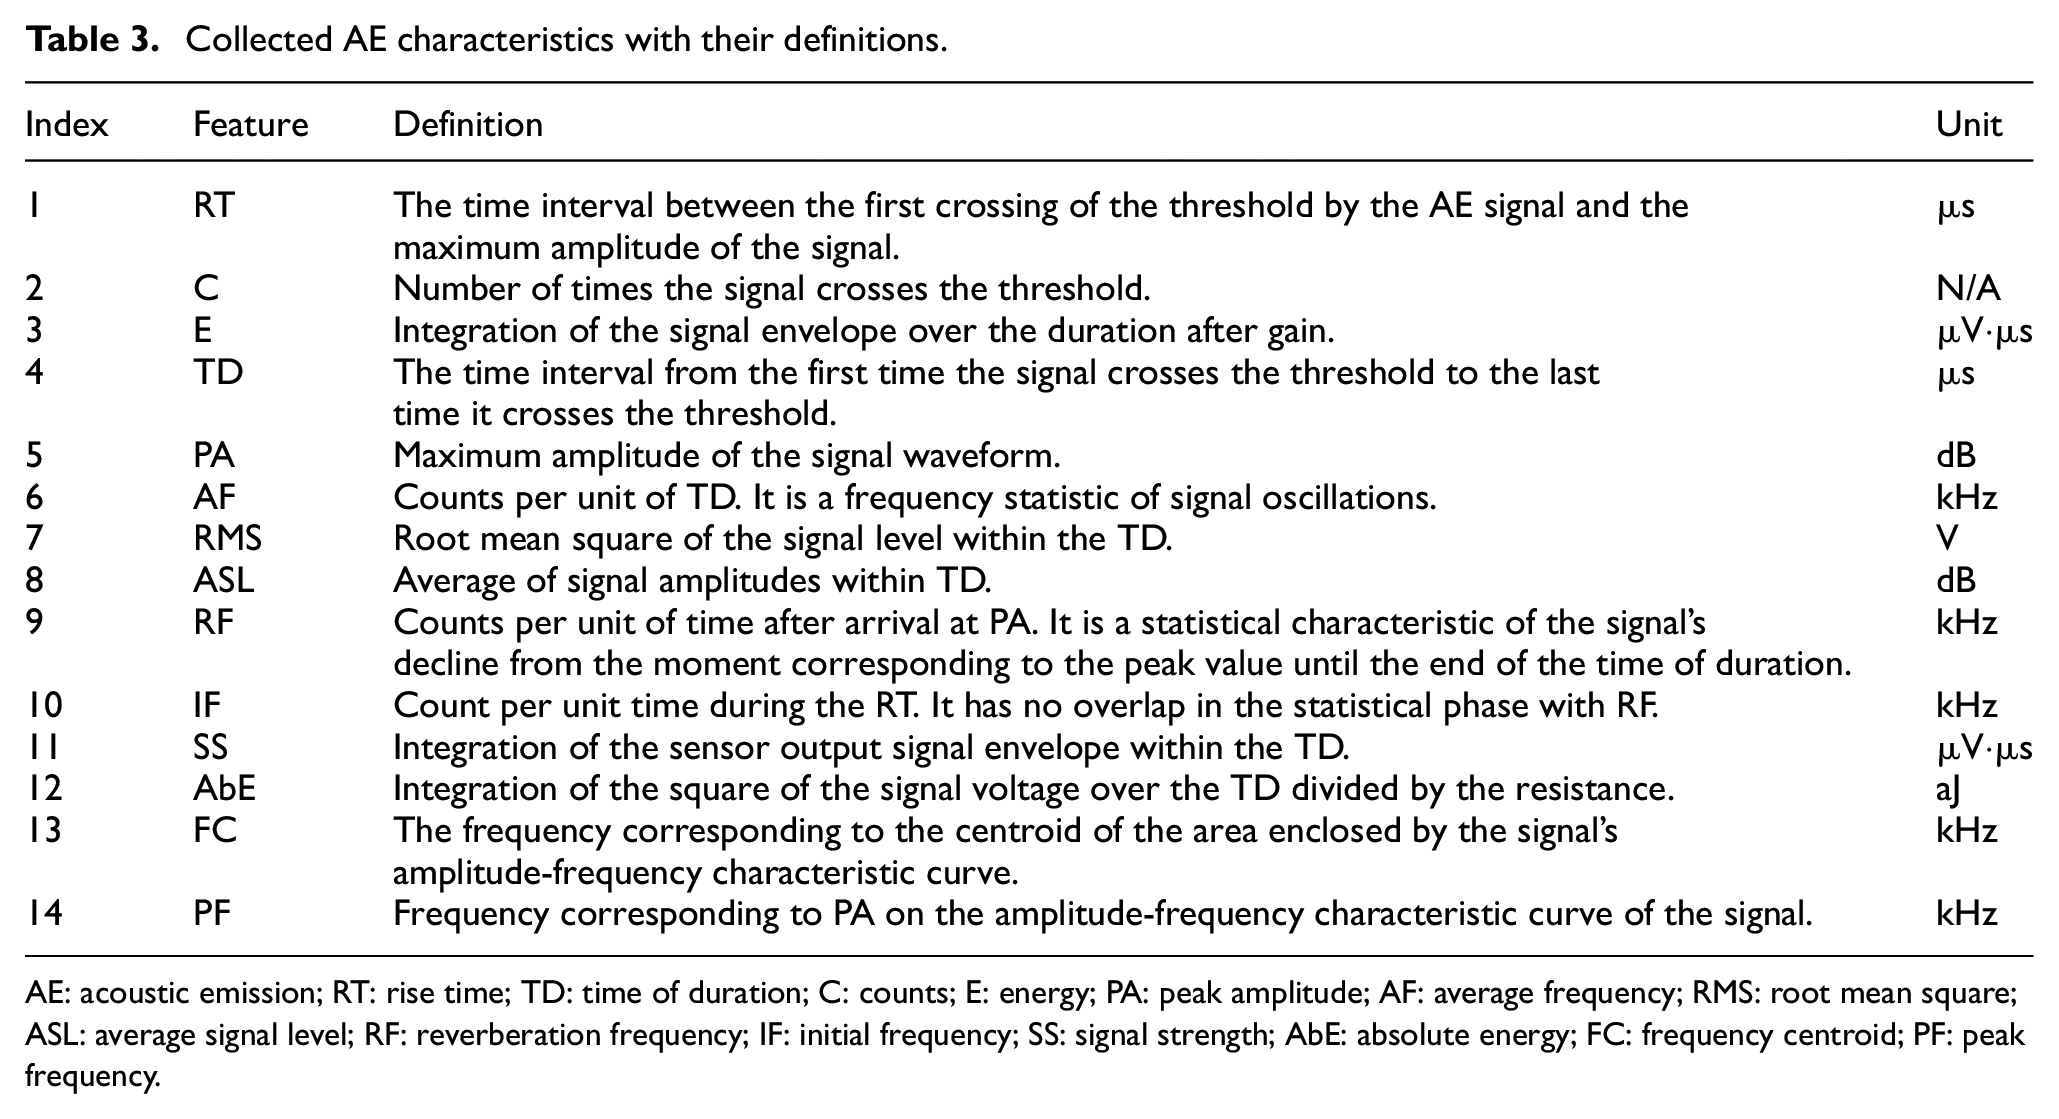
AE: acoustic emission; RT: rise time; TD: time of duration; C: counts; E: energy; PA: peak amplitude; AF: average frequency; RMS: root mean square; ASL: average signal level; RF: reverberation frequency; IF: initial frequency; SS: signal strength; AbE: absolute energy; FC: frequency centroid; PF: peak frequency.
Feature selection algorithms
The selection of effective AE signal features is critical for establishing a correspondence between damage signals and damage modes. To mitigate electromagnetic and friction noise interference, while considering the signal characteristics, effective signals with a rise time range of 1–10,000 μs and an average frequency range of 15–400 kHz are retained.
Assuming that n samples of hit signals are recorded in a single trial and that each signal is characterized by d AE features, the raw data matrix is denoted as
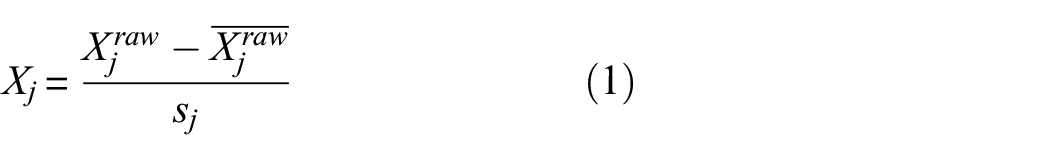
where
Only a limited number of useful features from all signal features are selected to create a new feature subset, thereby preventing the issue of dimensionality catastrophe. In this section, the LS feature selection algorithm is reviewed, and its limitations are addressed to develop a robust and reliable feature selection algorithm for damage characterization.
LS algorithm and its limitations
The LS feature selection algorithm evaluates the capacity of AE features to maintain the local geometric structure of the data space.18,21 The algorithm first defines all values of the rth feature as
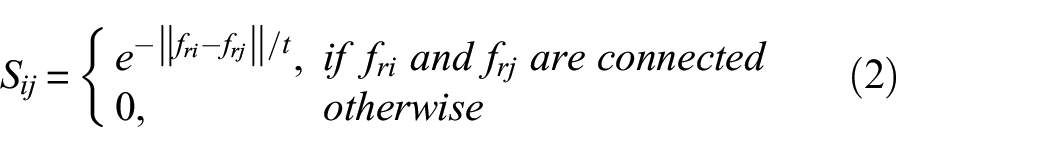
where e is the natural constant, and t is an empirically determined constant set to half the average distance between data points. The Laplace matrix

where
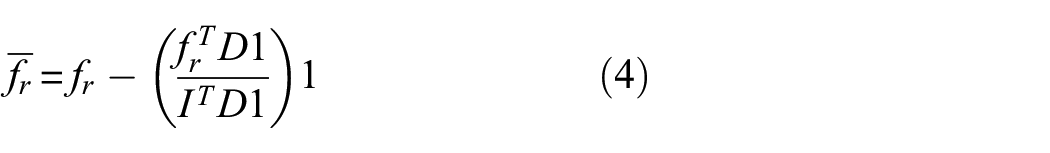
Then, the score of the rth feature is:
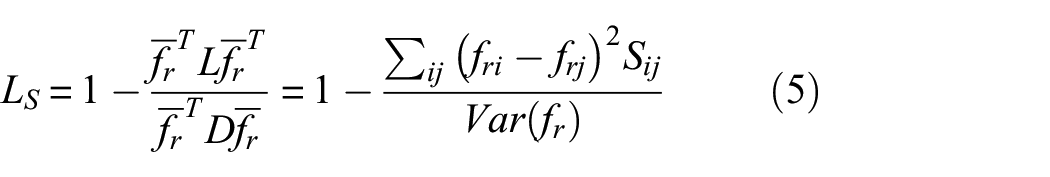
where
The calculation method of the LS algorithm reveals several limitations. First, the algorithm fails to account for the correlation between features, potentially resulting in the selection of redundant features and increasing the complexity of the study. Second, the performance of the algorithm is contingent upon the values of the number of neighbors k, and the constant t, yet there is no established standard for reference. Furthermore, the algorithm primarily concentrates on the local structure of the data, which hampers its ability to capture global information and is significantly influenced by noise, thereby impacting the feature selection results.
Although the LS algorithm has been utilized, its inherent shortcomings continue to complicate research, increase the challenges of data processing, and render accurate and reliable research results difficult to achieve. Therefore, it is imperative to enhance the algorithm to address its limitations.
Algorithm improvements
To address the limitations of the LS algorithm, the FCCS algorithm has been proposed to eliminate the impact of redundant features. Additionally, the embedded feature selection algorithm FSDK 20 is introduced to mitigate the influence of the LS algorithm’s parameters, enhance the global search capability of the improved algorithm, and establish a robust and reliable feature selection algorithm for AE monitoring of composite damage.
Feature correlation clustering selection
FCCS classifies similar features based on correlation and selects the most representative features, thereby excluding redundant features. Based on the characteristic properties of AE signals, mutual information (MI)
28
—a metric capable of capturing nonlinear statistical dependencies between two random variables—was employed to quantify the correlation among features in dataset X. This approach effectively circumvents the limitation of Pearson coefficient,
29
which only measures linear relationships and is often inadequate for characterizing AE signal features. The MI between features
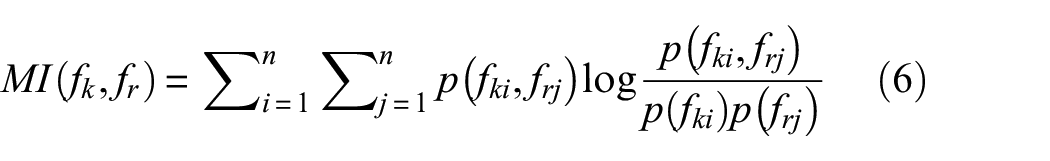
where

where
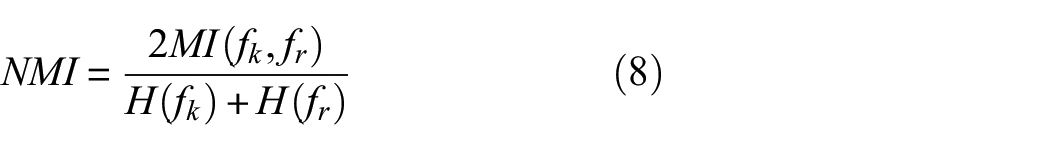
where
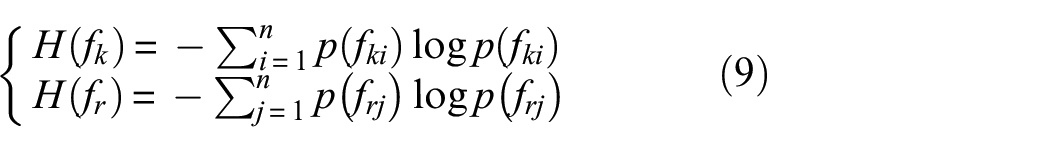
A feature-classification binary tree was constructed based on NMI correlation metrics. Initially, the d features in dataset X were treated as d separate clusters, with each cluster corresponding to an individual node. The distance between clusters j and k is defined as Equation (10).

The two clusters with the smallest distances are merged into one, and the distance between the new cluster and the other clusters is recalculated. The distance between the two merged clusters u and v is calculated using an averaging algorithm as Equation (11).
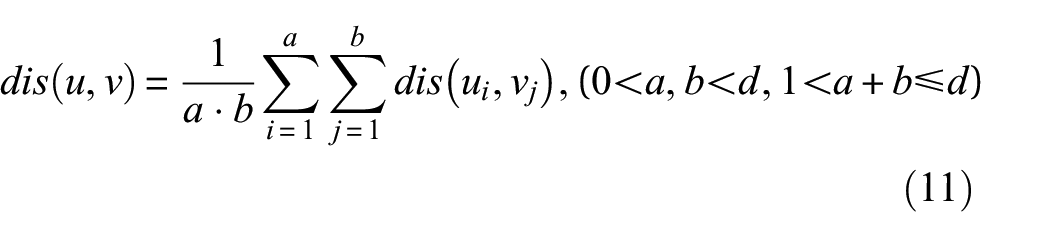
where the new cluster u is formed by merging a clusters, and the new cluster v is formed by merging other b clusters.
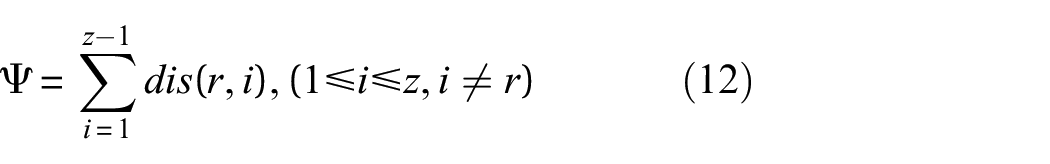
According to the algorithm’s mechanism, the number of features selected by FCCS exhibits a high degree of freedom; therefore, the final number of clusters to be merged can be determined based on the stability of feature clustering across multiple sets of experimental data. Assuming the original d features are merged to form c clusters, redundant features can be excluded by selecting representative features from each cluster. If there are z features in the yth cluster, the selection of representative feature
Ultimately, the c AE features with lower correlation are retained, thus improving the limitation of redundant features inherent in the original LS algorithm.
Fast sparse discriminative k-means
The LS algorithm struggles to ensure the accuracy of feature selection results due to its parameter sensitivity and limited global search capability; thus, the FSDK algorithm is introduced. The feature selection process of the FSDK algorithm integrates LSR with discriminant k-means clustering, constructs a weighted pseudo-labeling matrix G to simulate the true categories of the data, and achieves feature selection by minimizing the distance between data points and their pseudo-labels. The core of the algorithm is to optimize the following objective function:
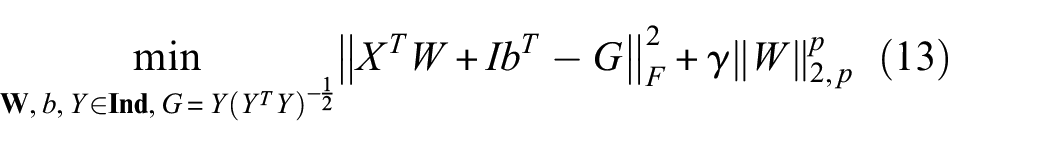
where
The feature selection results of the FSDK algorithm are significantly influenced by the initial label matrix
Results and discussions
The third section introduces the Imp-LS algorithm to overcome the limitations of the LS algorithm. In this section, the feature selection results of both algorithms are presented, and their usability is evaluated. Furthermore, based on the superior results, the mechanical behavior of composites in various aging states is monitored.
Feature selection results and effectiveness of the improved algorithm
Feature selection results
The feature selection result of the LS algorithm for 12 samples across six aging states is shown in Figure 6. The error bars represent the standard deviation of the scores for specimens of the same type. The average Ls values of RT, E, PA, AF, RMS, ASL, RF, IF, SS, FC, and PF are stably higher than 0.9, indicating that these features are suitable for clustering and possess robustness.
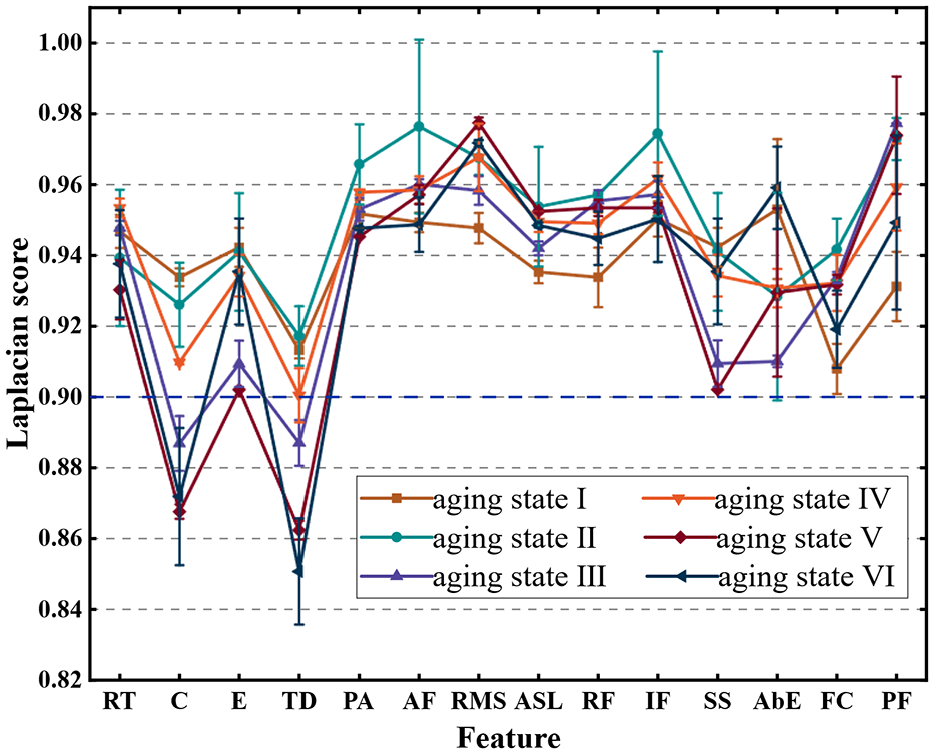
Average Ls score for all specimens.
Based on the feature selection result of the LS algorithm, the Imp-LS algorithm computes the average correlation clustering results of the preliminarily selected features across all specimens, as illustrated in Figure 7. The features are classified into six categories, as presented in Table 4. On this basis, through the integration and selection of the parallel computing results of the FSDK algorithm, which yielded features including PA, AF, IF, RF, and FC, three AE features—PA, AF, and FC—were selected. The feature selection results for both the LS and the Imp-LS algorithms are summarized in Table 5.
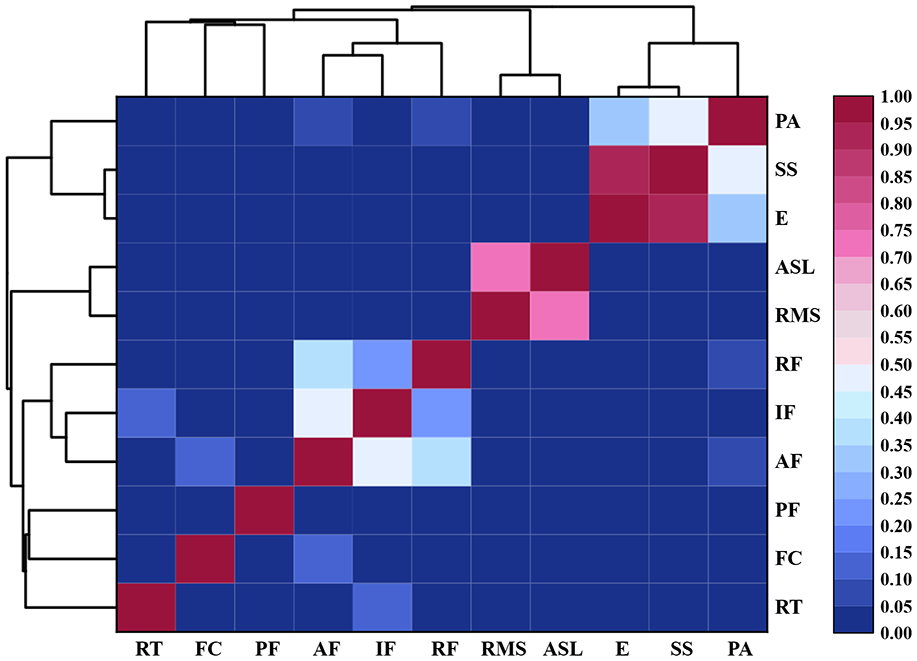
Average correlation of features across all specimens and clustering tree.
Imp-LS algorithm feature clustering results.
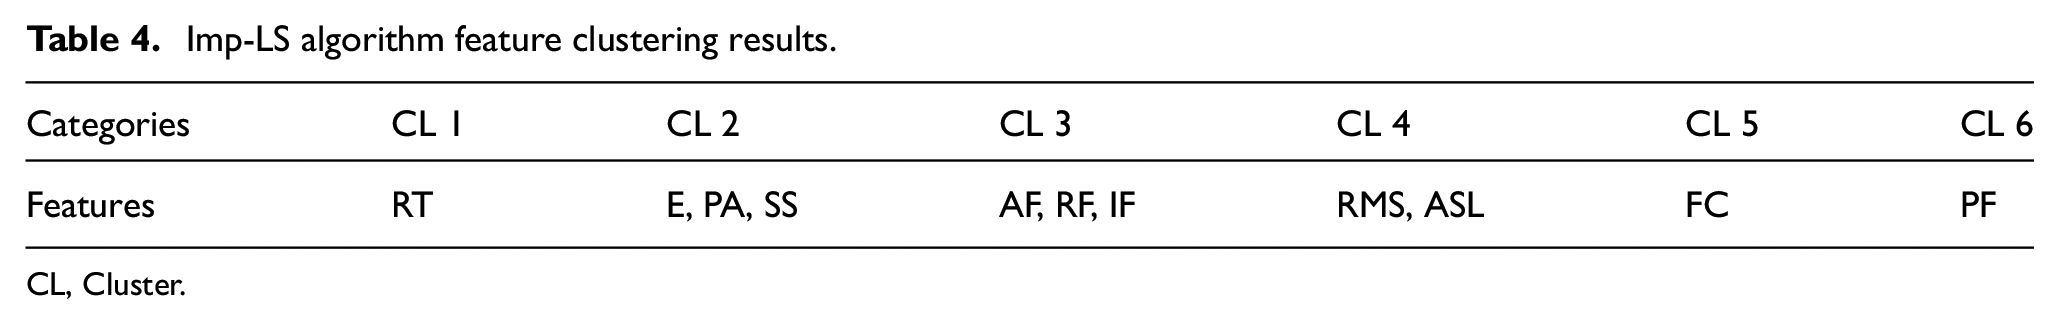
CL, Cluster.
Feature selection results for algorithms LS and Imp-LS.
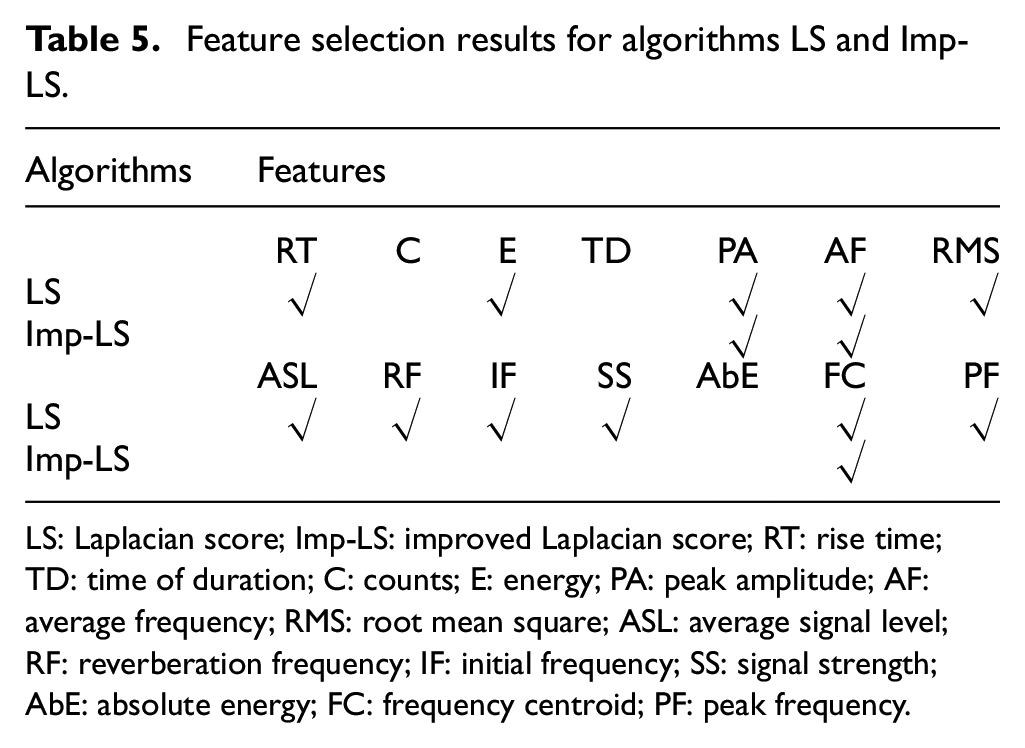
LS: Laplacian score; Imp-LS: improved Laplacian score; RT: rise time; TD: time of duration; C: counts; E: energy; PA: peak amplitude; AF: average frequency; RMS: root mean square; ASL: average signal level; RF: reverberation frequency; IF: initial frequency; SS: signal strength; AbE: absolute energy; FC: frequency centroid; PF: peak frequency.
Validation of the effectiveness of the improved algorithm
The ultimate purpose of feature selection is to serve the clustering of AE data; therefore, the effectiveness of the corresponding feature selection algorithm can be evaluated by assessing the clustering performance of a selected subset of features. Principal component analysis (PCA) 30 and k-means clustering are recognized as effective methods for processing AE signal data.24,31 PCA can further reduce dimensionality based on the selected feature subset, which selects the first few principal components with a cumulative contribution rate exceeding two-thirds, enhances the visualization of the data while retaining the primary information from the feature subset.7,27 The k-means algorithm necessitates the a priori determination of the number of clusters, denoted as parameter k. Therefore, discussing the process of determining k using an optimal clustering evaluation index strategy provides an effective means to assess the clustering performance of the corresponding subset of features, thereby enabling a comparison of the effectiveness of different feature selection algorithms.
Internal assessment metrics for evaluating clustering performance by comparing inter-class and intra-class differences are effective tools for determining the optimal number of unsupervised clusters. Considering multiple metrics collectively mitigates misjudgment arising from reliance on a singular metric; consequently, the internal metrics integrated into the optimization assessment strategy encompass the Silhouette Coefficient (SI), 32 the Davies–Bouldin Index (DBI), 33 and the Calinski–Harabasz Index (CHI). 34
The SI metric assesses the degree of separation between classes by evaluating the similarity of samples to both in-class and out-of-class samples, which is calculated using Equation (14).
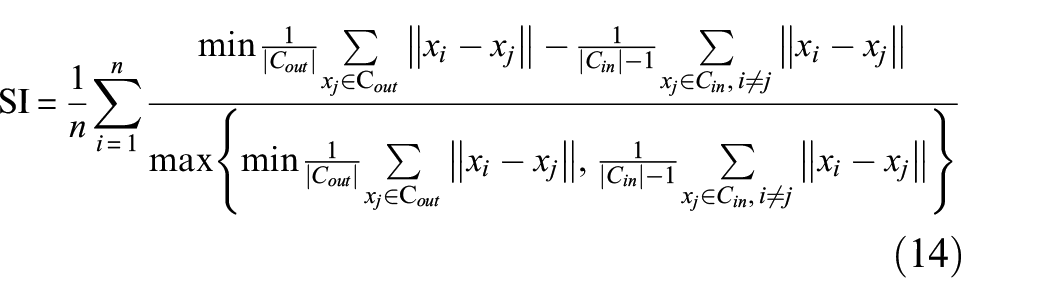
where n is the total number of samples, Cin denotes the class in which sample i is located, and |Cin| is the number of samples; Cout and |Cout| denote other classes; ||xi−xj|| denotes the Euclidean distance between samples i and j. The SI can range from −1 to 1. When the distance within the class is small, and the distance between the classes is large, the SI assumes a higher value, suggesting that the sample exhibits better classification performance.
The DBI can be utilized to measure intra-class tightness and inter-class separation, defined as Equation (15).
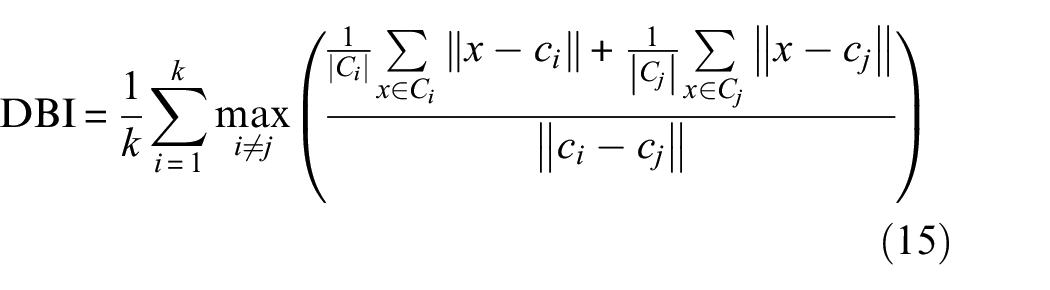
where k is the number of classes, ||x−ci|| denotes the Euclidean distance between sample x in class i and the centroid ci of samples in the class, and ||ci−cj|| denotes the Euclidean distance between the centroids of class i and class j. The DBI yields values greater than 0, with smaller values indicating more effective clustering.
The CHI measures clustering performance by calculating the ratio of intra-class variance to inter-class variance, as expressed by Equation (16).
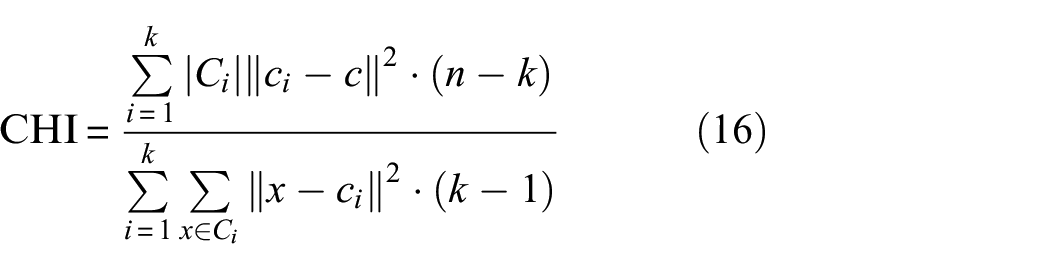
where c denotes the centroid of all samples and ||ci−c|| 2 denotes the square of the Euclidean distance between the centroid of class i and the whole. A larger CHI indicates a stronger connection among samples within a class, greater dispersion among classes, and improved clustering effectiveness.
This article selected a second piece from each aging state for analysis to avoid redundant discussions of AE data from similar specimens. Figure 8 presents the principal component variances and their cumulative results of the feature subsets obtained from the two feature selection algorithms. The PCA results for the feature subset selected by the LS algorithm are illustrated in Figure 8(a). According to the cumulative variance cut-off of 2/3, the LS algorithm’s feature subset must retain the first four principal components to ensure sufficient feature information, except for the data from specimen V-2. The PCA results for most specimens indicate that clustering visualization remains a complex challenge. Figure 8(b) displays the PCA results for the feature subset selected by the Imp-LS algorithm, which shows that retaining only the first two principal components is sufficient for each specimen to capture most of the information in the feature subset, a favorable outcome for subsequent clustering visualization.
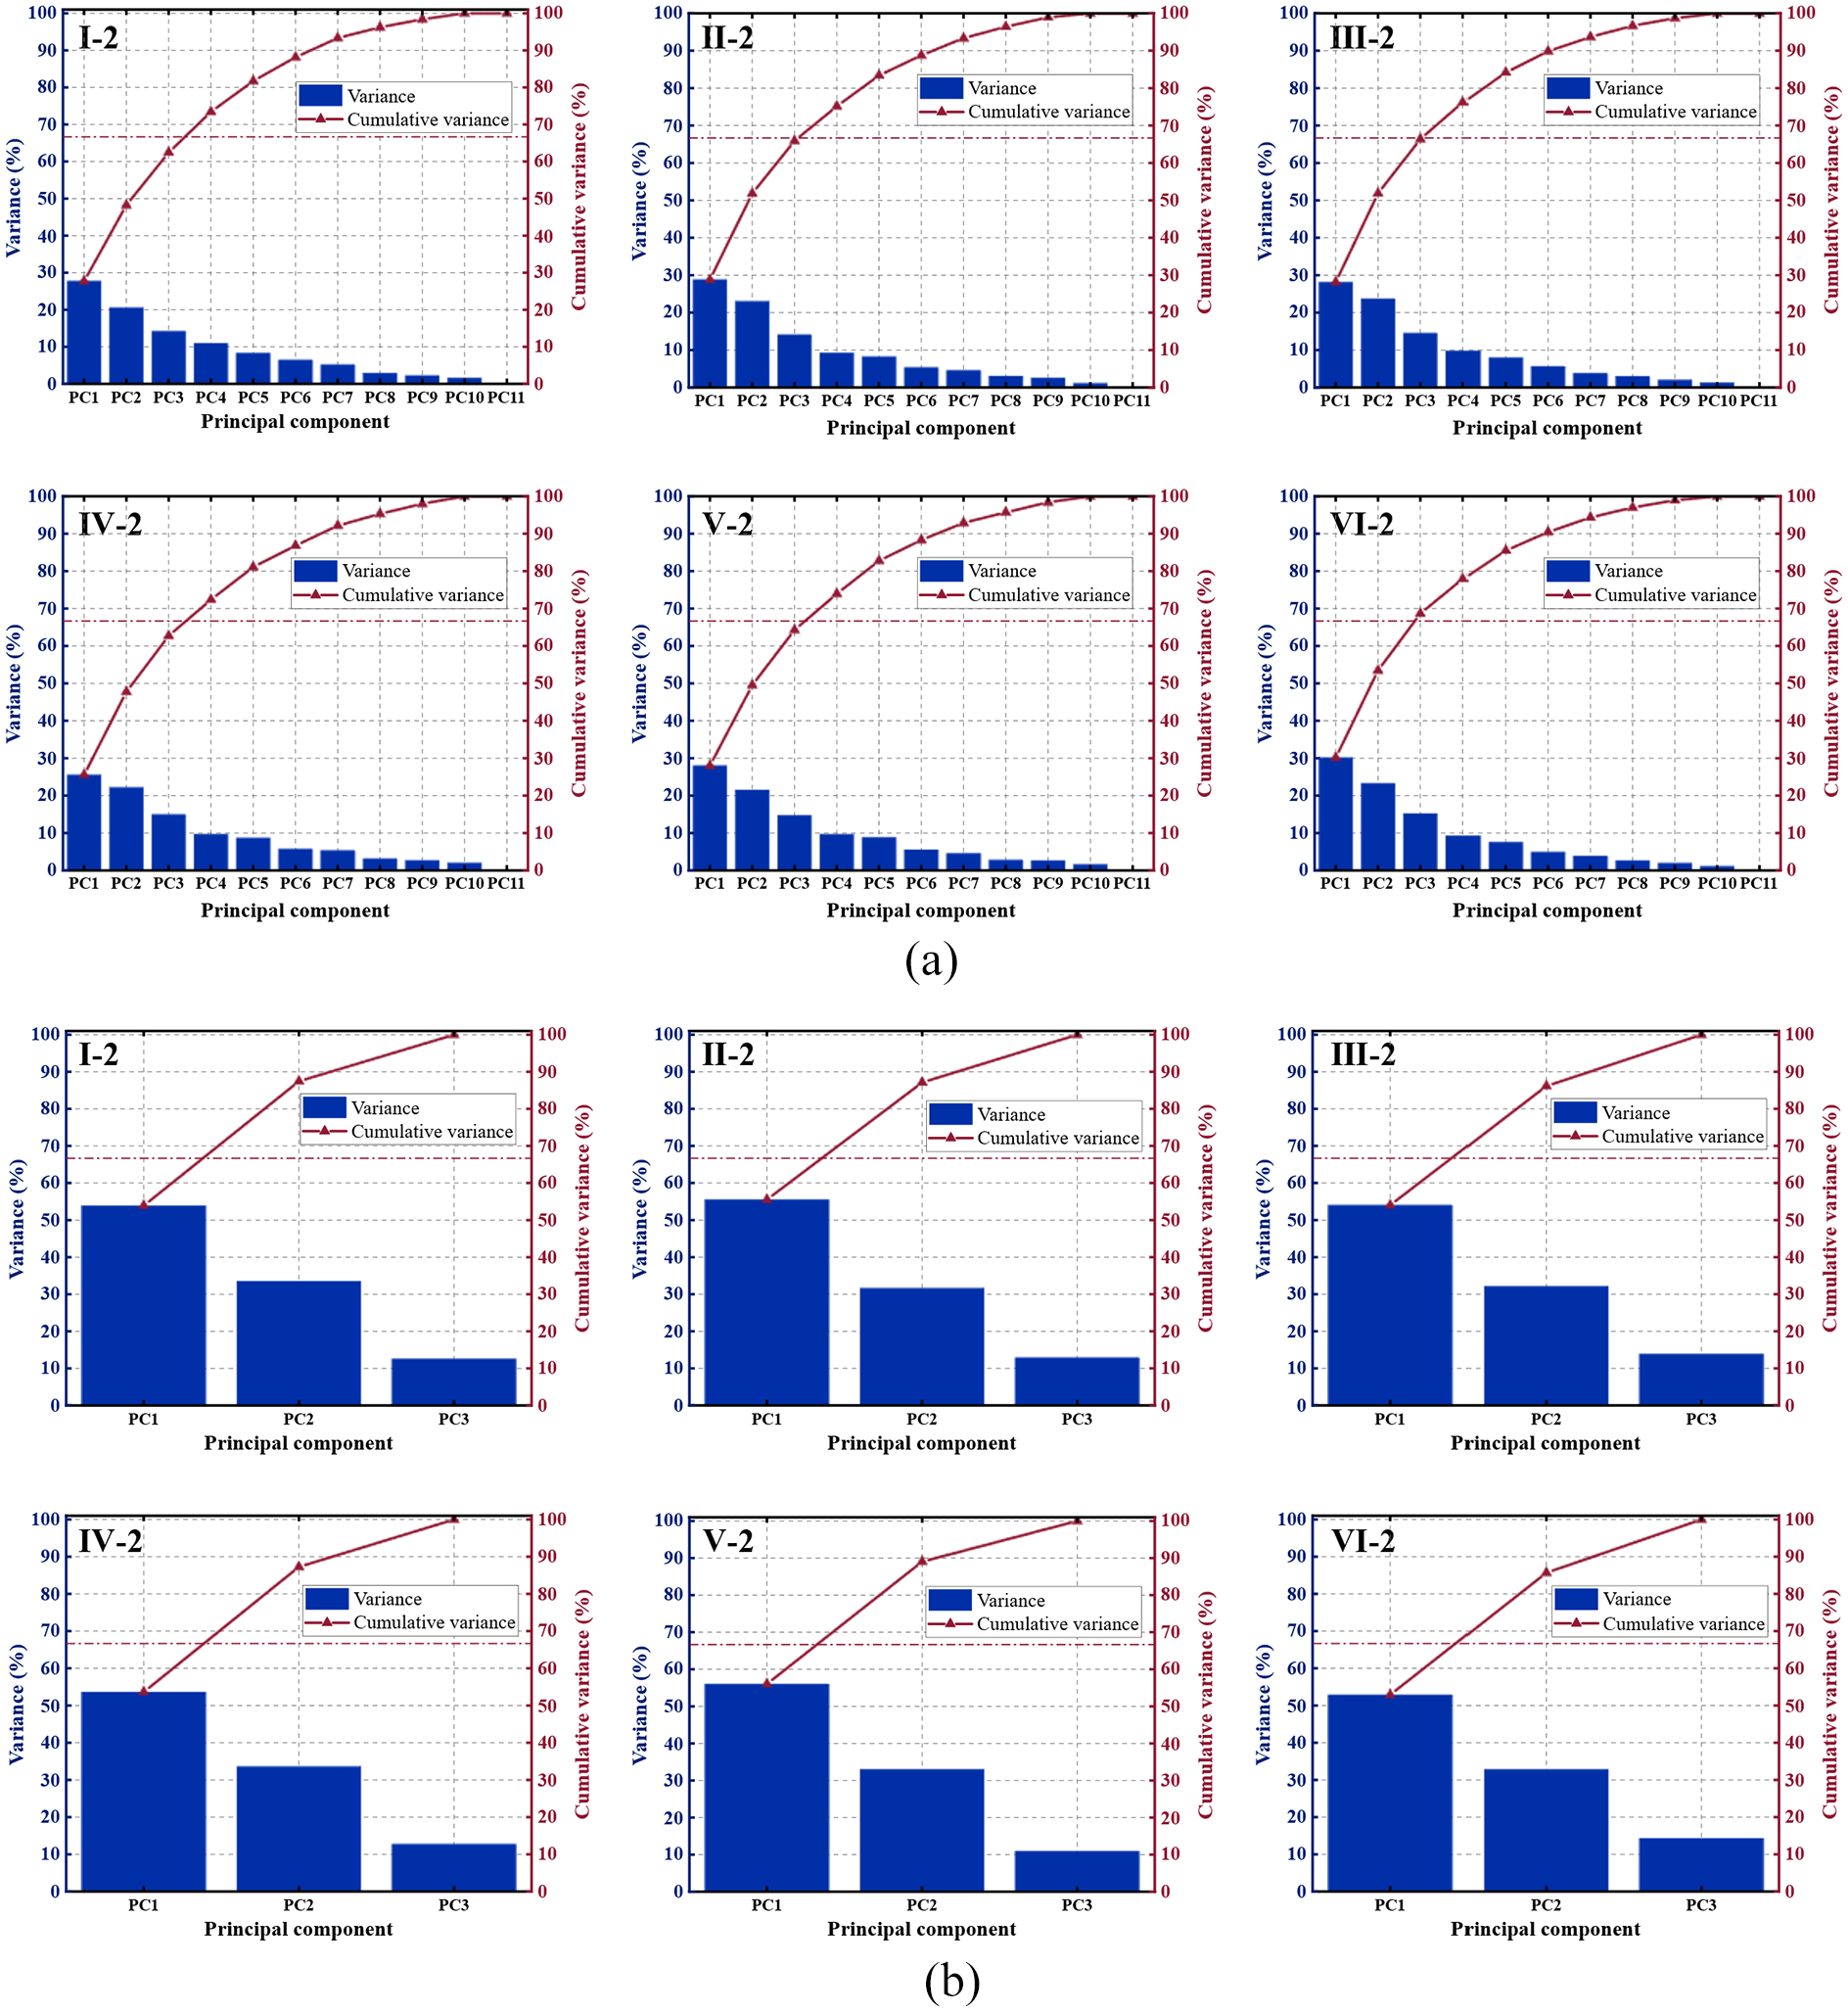
Principal component variance and cumulative results for six aging state specimens: (a) LS algorithm and (b) Imp-LS algorithm. LS: Laplacian score; Imp-LS: improved Laplacian score.
The results of the PCA calculations initially evaluated the usability of the LS and Imp-LS algorithms; however, the ability of the feature selection algorithm to determine the number of clusters for the k-means algorithm serves as a more critical criterion for evaluation. The principal component data retained after the PCA calculations for each specimen were utilized to calculate the clustering evaluation metrics values. The LS algorithm retains the first four principal components for the feature subset, while the Imp-LS algorithm requires the retention of only the first two principal components. Considering the characteristics of the composite damage modes and the clustering evaluation metrics, the optimal number of clusters is determined within the range of 3–5. The calculation results are illustrated in Figure 9, where the numbers of clusters 2 and 6 serve as reference boundaries and are not selectable values.
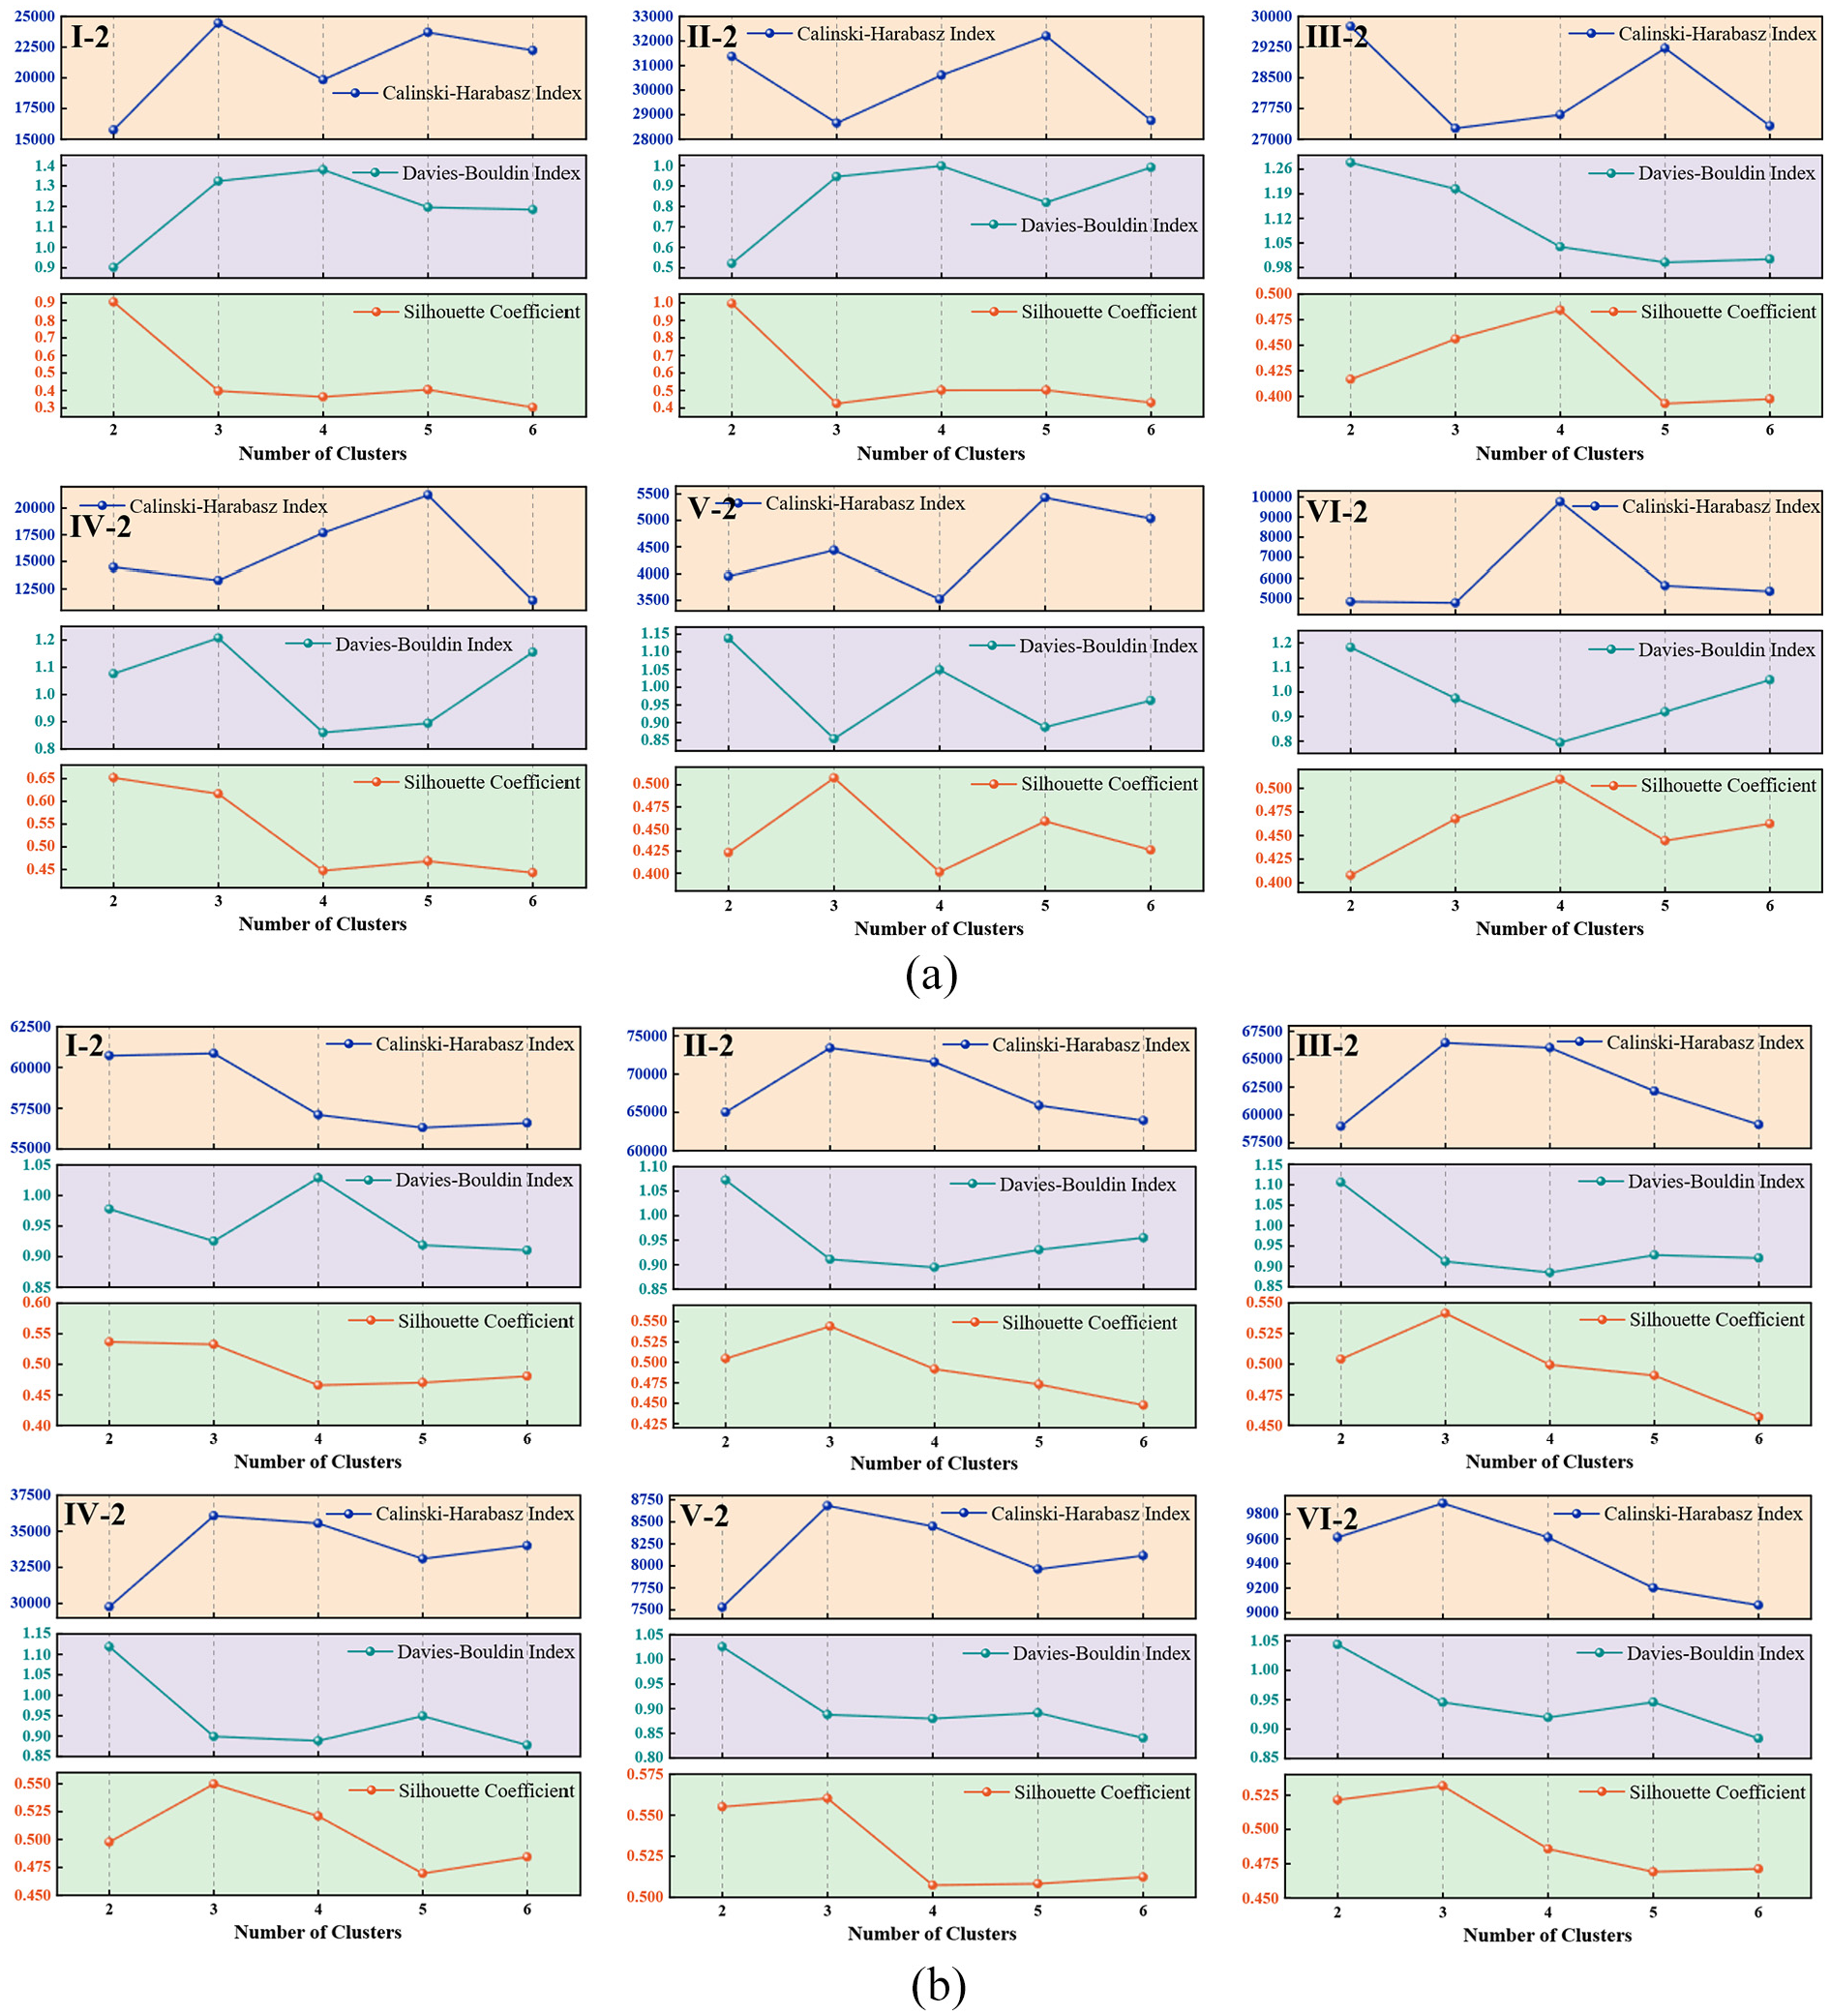
Clustering evaluation metrics for five aging state specimens: (a) LS algorithm and (b) Imp-LS algorithm. LS: Laplacian score; Imp-LS: improved Laplacian score.
It is challenging to ascertain the precise number of clusters from the AE data selected by the LS algorithm as shown in Figure 9(a). The results for specimens I-2 and II-2 indicate that the optimal number of clusters can be determined to be 2, based on the SI and DBI metrics. In contrast, these two metrics suggest that the number of clusters is 4 for specimen III-2 and 3 for specimen V-2. For specimen IV-2, the CHI and DBI metrics collectively indicate that the appropriate number of clusters is 5, whereas for specimen VI-2, the three metrics converge to suggest that the number of clusters is 4. Consequently, determining a consistent number of clusters for the feature subset selected by the LS algorithm proves to be challenging.
In contrast, the computational results of the feature subset data obtained from the Imp-LS algorithm, as shown in Figure 9(b), provide a clear indication of the number of clusters. Calculations of each specimen data consistently indicate that k = 3 is the most appropriate number of clusters. Notably, for specimen I-2, although the SI does not reach its absolute maximum at k = 3, the SI value at this point closely approximates the global peak. Beyond this, a marked decline in SI values is observed, indicating that k = 3 is a statistically robust choice for the optimal number of clusters.
In summary, the feature subsets selected by the LS and Imp-LS algorithms exhibit distinct clustering performances, wherein the feature subset derived from the Imp-LS algorithm significantly outperforms that of the LS algorithm, particularly regarding clustering visualization and the determination of cluster numbers. Consequently, the improvements made to the LS algorithm have resulted in significant outcomes.
Given the superiority of the Imp-LS algorithm, the mechanical behavior of composites will be monitored using the feature subset data derived from the Imp-LS algorithm. The relationship between AE data and composite damage modes will be examined through clustering, while further investigations will focus on the characterizations of composite mechanical behavior through AE data of damage modes.
Association of AE data clustering results with damage modes
The principal component data and the number of clusters clustered for each specimen were determined as described in “Feature selection results and effectiveness of the improved algorithm” section. The principal component data, which encapsulates the primary information, was categorized into three classes using thek-means algorithm, as illustrated in Figure 10. To investigate the correlation properties of composite damage modes with AE data clusters, the clustering centers of AE data for each specimen were redefined based on the feature subset selected by Imp-LS, as depicted in Figure 11. Cluster 1 corresponds to low amplitude and frequency characteristics, cluster 2 exhibits high amplitude characteristics coupled with low-to-moderate frequency components, while cluster 3 exhibits medium amplitude and high frequency characteristics.
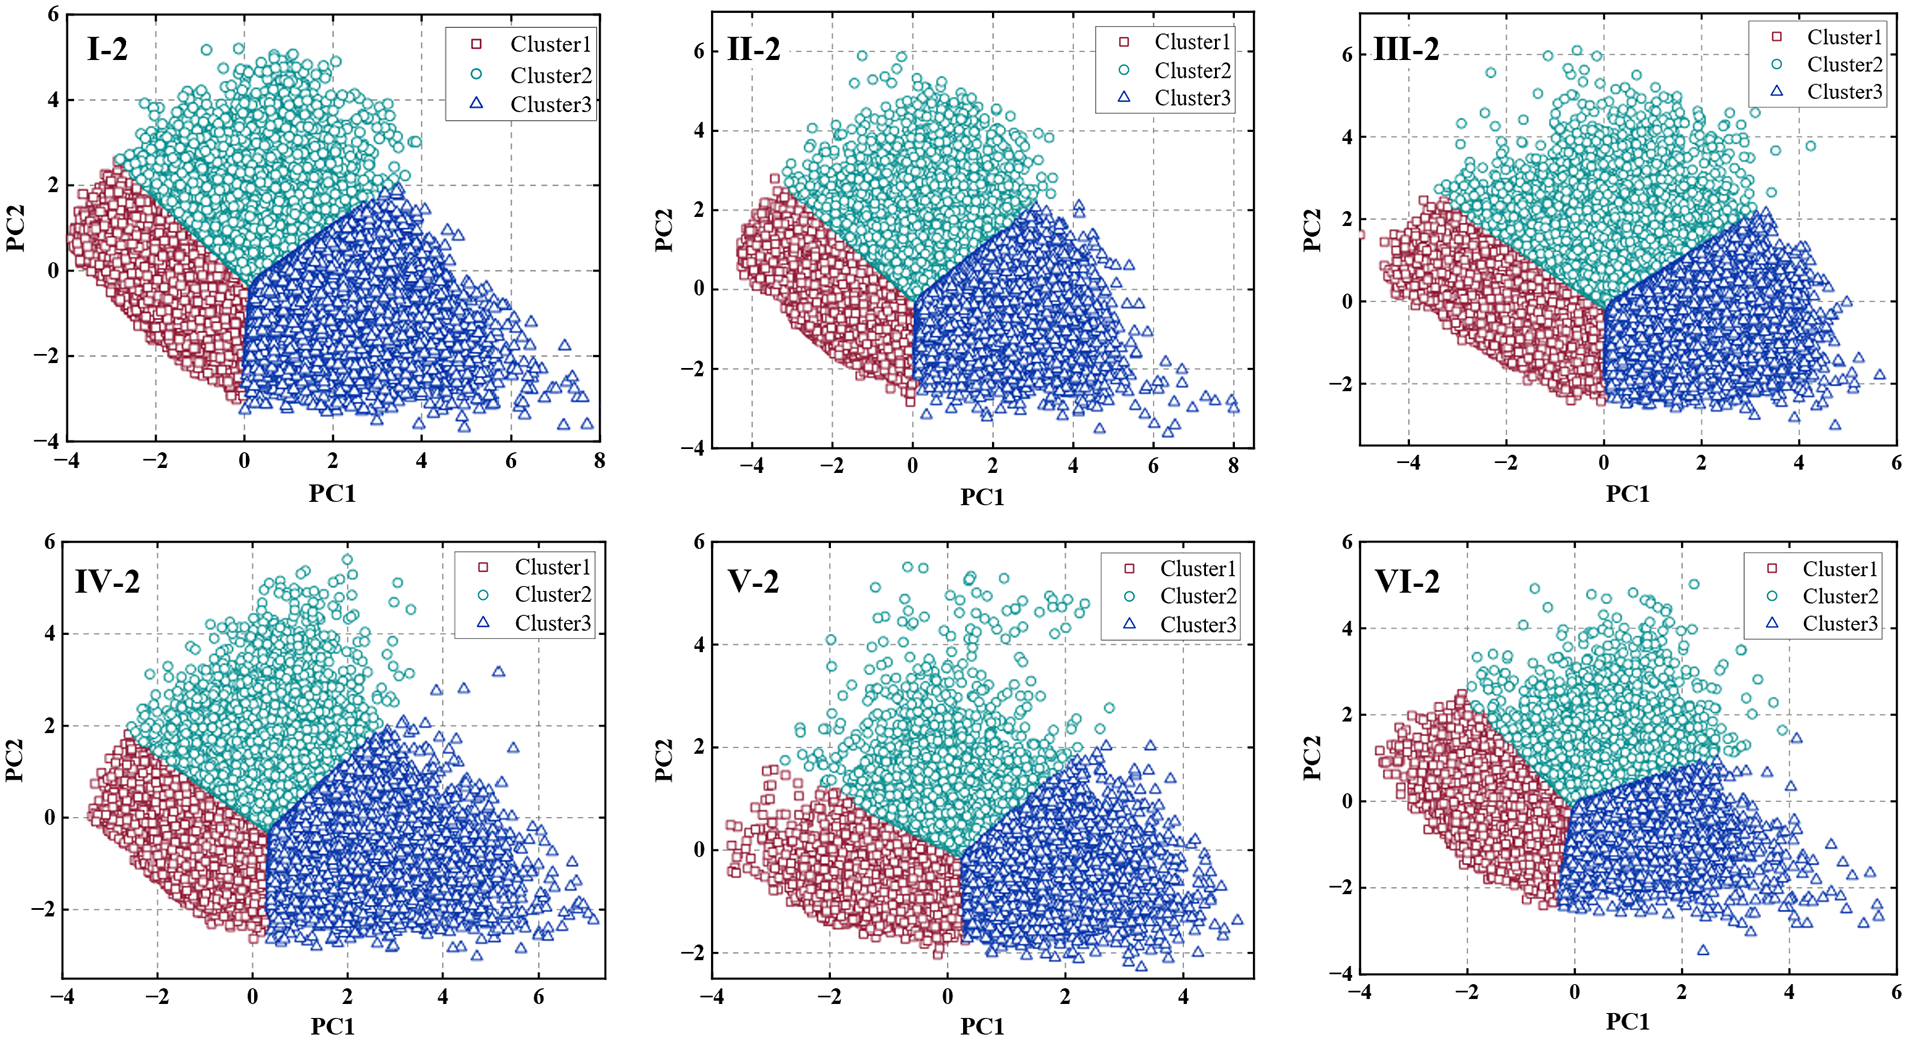
Cluster distribution of AE principal component data for each specimen. AE: acoustic emission.
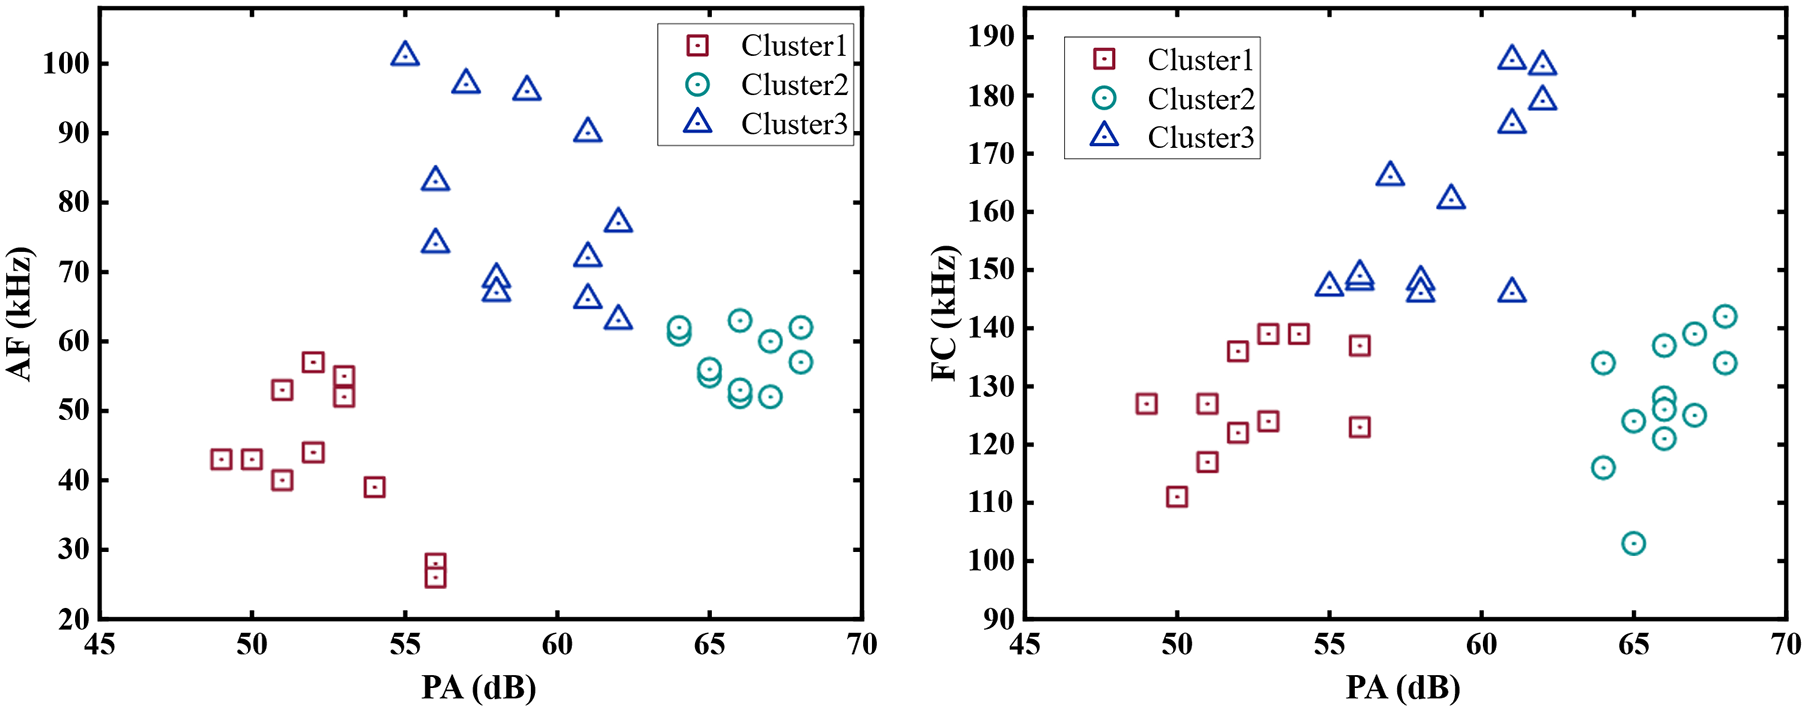
Description of cluster center distribution for each specimen.
The resultant images from microscopic observations of the damaged specimens following the test are presented in Figure 12, where three damage modes were identified: matrix damage, delamination, and fiber damage. Previous studies23,35,36 have demonstrated that matrix damage correlates with lower amplitude and frequency, whereas both delamination and fiber damage are associated with higher amplitude, with fiber damage specifically correlating to higher frequency. However, as depicted in Figure 11, clusters 1 and 2 exhibit similarities in terms of frequency characteristics. Regarding the amplitude, cluster 1 is predominantly distributed in the low-amplitude range, while cluster 2 is distributed in the high-amplitude range. In the DCB testing, the specimen first exhibits localized matrix damage, followed by delamination caused by the sudden release of stress concentration. This indicates that delamination results from significant separation of the matrix, with some stresses transferred to the fibers during this process. Consequently, delamination is always accompanied by both matrix damage and fiber damage, as illustrated in Figure 12. Delamination and matrix damage exhibit similar characteristics, making it challenging to distinguish them based solely on frequency characteristics. In summary, cluster 1 corresponds to matrix damage, cluster 2 correlates with delamination, and cluster 3 is associated with fiber damage characterized by higher frequency components.
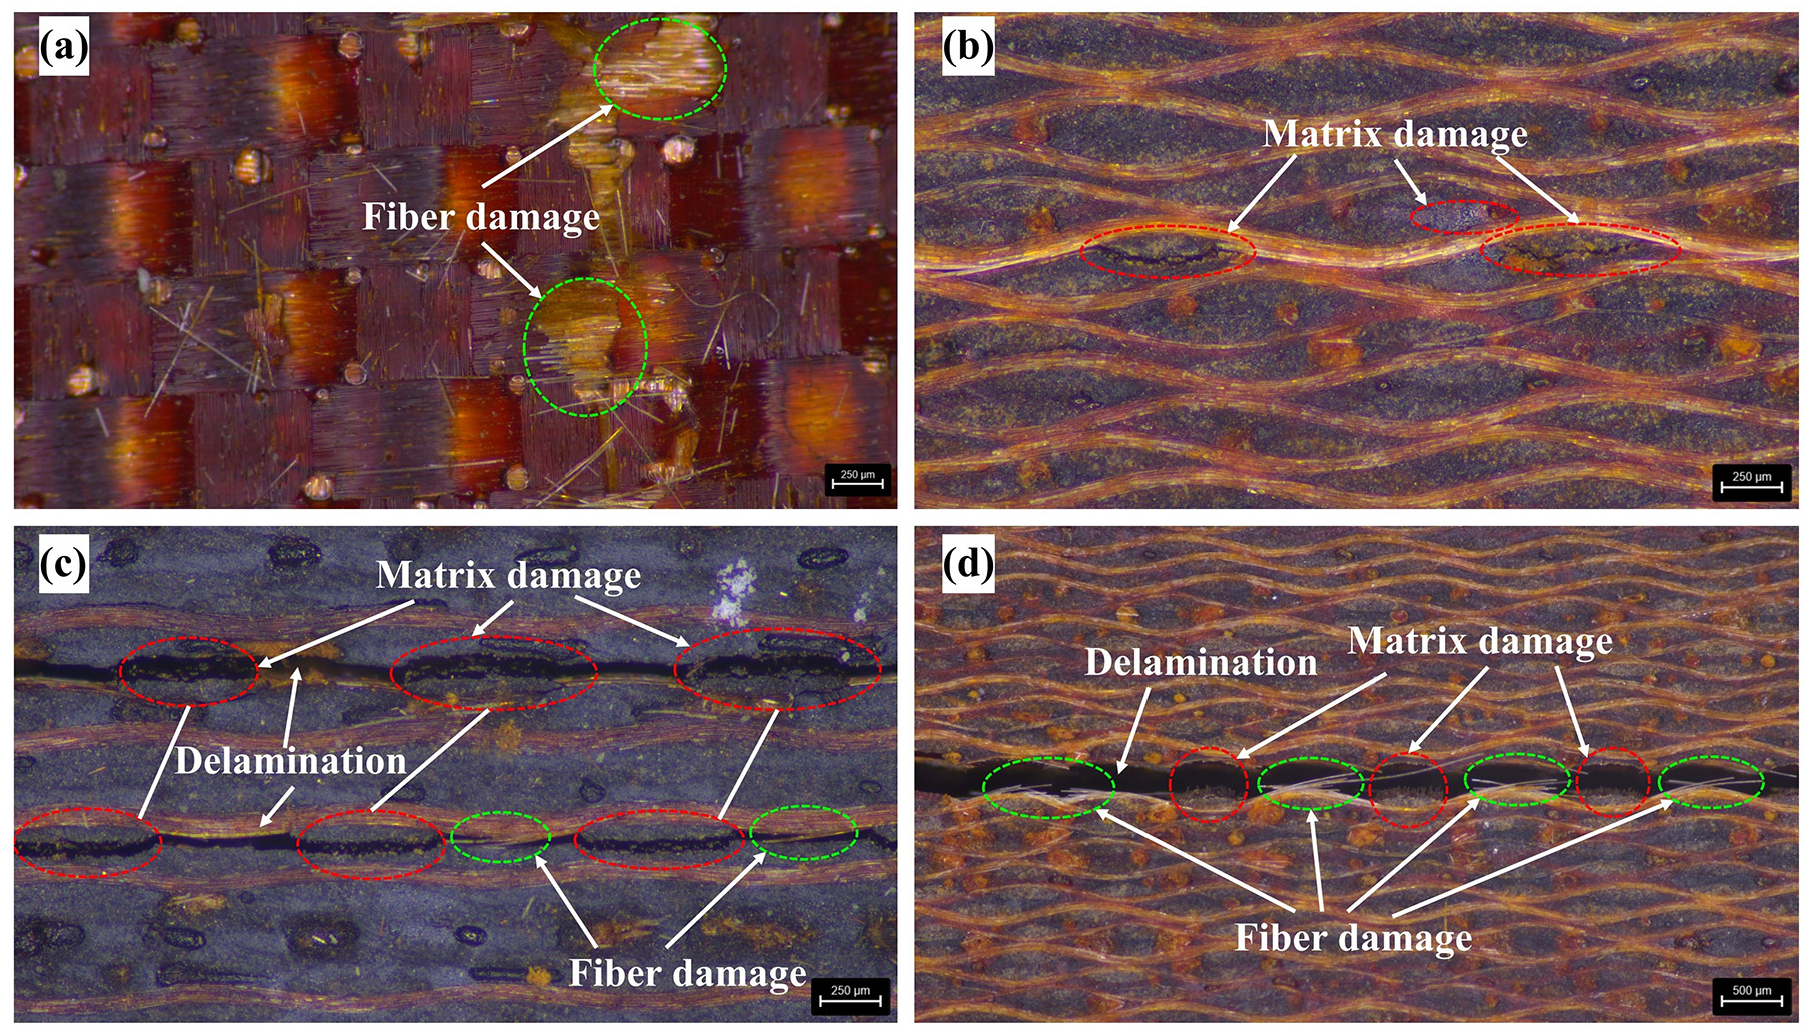
Microscopic observation of damaged specimens: (a) fiber damage, (b) matrix damage, and (c) and (d) multiple damage coupling.
Monitoring of the mechanical behavior of composites
In DCB testing, mode-I fracture is the primary damage mechanism that significantly affects the mechanical properties of the material. 37 Delamination, which is a damage mode closely associated with mode-I fracture, is critical for accurately monitoring the mechanical behavior of composites. Consequently, effective monitoring relies on a precise characterization of the developmental activity of delamination. The energy of AE signals serves as an effective parameter for characterizing signal activity. By accurately classifying the AE signals corresponding to each damage mode, the progression of damage was assessed by calculating the cumulative AE energy associated with each damage mode.
Monitoring the mechanical behavior of composites in a single aging state
Specimen IV-2 was selected to monitor the mechanical behavior of composites under a single aging state, while specimens from other aging states will be analyzed in the following section. Figure 13(a) illustrates the proportion of the cumulative AE energy associated with various damage types in specimen IV-2. The proportion of the cumulative AE energy of delamination reaches 77.6%, which validates that the mode-I fracture behavior is highly correlated with delamination damage. The mechanical development of the specimen and the corresponding cumulative AE energy for each mode of damage are depicted in Figure 13(b), with green arrows indicating the correlation between mechanical behavior and delamination progression. During the phase of linear load increase from 0 s to approximately 420 s, the various types of AE energies remain relatively steady, approaching zero. When the specimen’s load-carrying capacity drops suddenly for the first time, the cumulative energy curve corresponding to delamination exhibits a concurrent jump, as indicated by the first green double-arrow solid line in the figure. The connection is not coincidental; when the load curve remains steady or gradually increases (the black wireframe in the figure), the cumulative energy of the delamination curve concurrently exhibits a gradual increase (the orange wireframe in the figure). Additionally, when a drop occurs in the load curve, the cumulative energy of delamination also demonstrates a rapid increase almost simultaneously. There is no significant correlation observed between the cumulative energies of the other two types of damage.
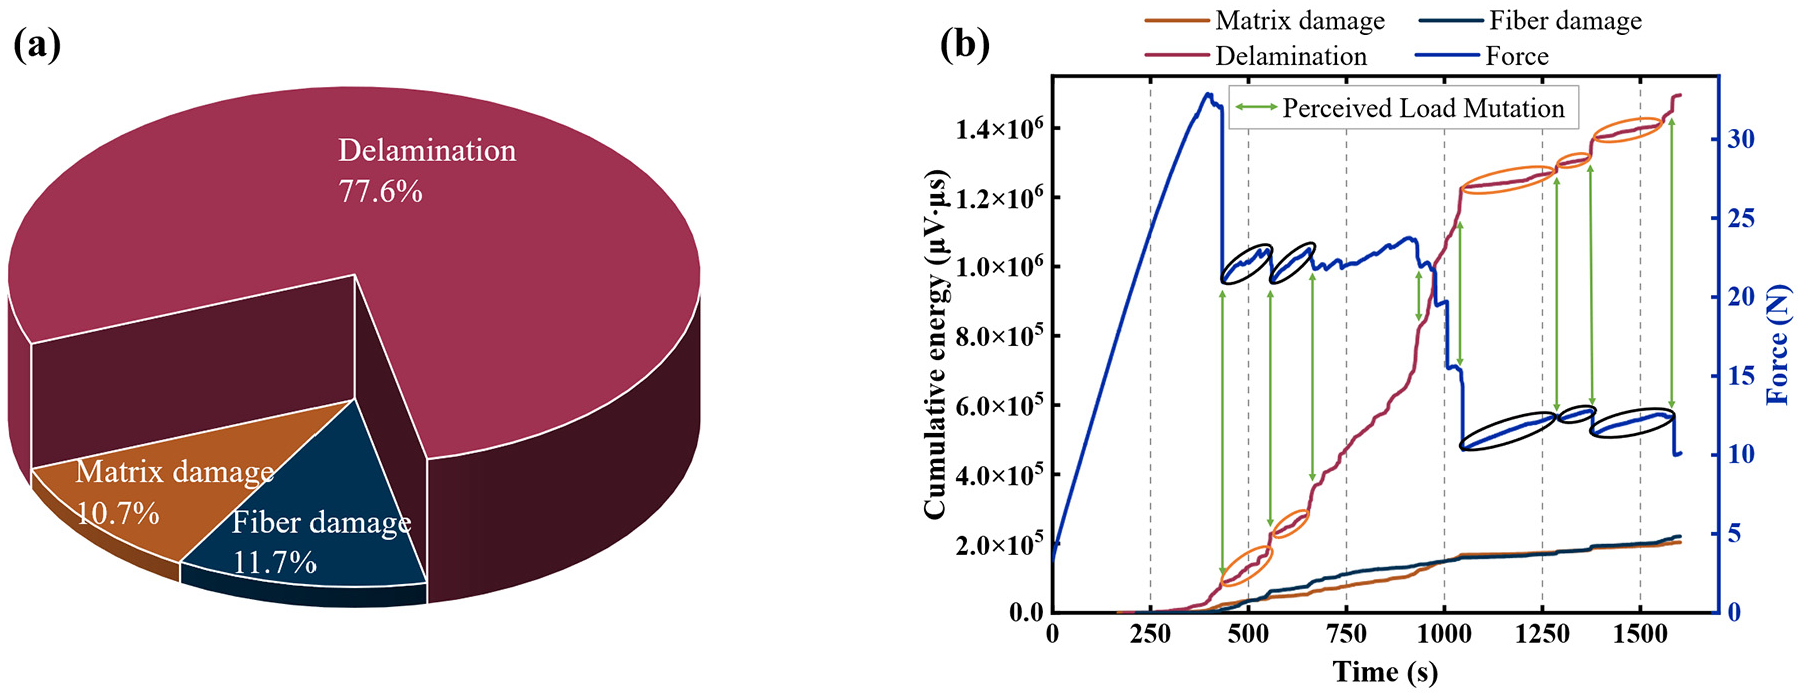
Development of damage cumulative AE energy for specimen IV-2: (a) indicates the final percentage of cumulative AE energy for each type of damage and (b) plots the cumulative AE energy of damage versus the mechanical curve. AE: acoustic emission.
The correlation reflects the accuracy of the classification of delamination damage, thereby further validating the effectiveness of the Imp-LS algorithm. The utility of AE for the health monitoring of composites is substantiated by the successful monitoring of their mechanical behavior. The sudden change in cumulative delamination energy can accurately and qualitatively indicate a drastic degradation of the mechanical properties of the material; however, it remains challenging to accurately and quantitatively assess the degree of degradation of these properties. Furthermore, to address the monitoring needs throughout the entire life cycle of composite structures, it is essential to monitor the mechanical behavior of these composites under various aging states using AE to validate its applicability for health monitoring over their lifespan.
Monitoring the mechanical behavior of composites in different aging states
The monitoring of the mechanical behavior of a single aged specimen using AE demonstrated the validity of the features selected by the Imp-LS algorithm; furthermore, further verification of the robustness through the monitoring of the mechanical behavior of specimens with varying ages is still required.
As demonstrated in Figure 14, the figure illustrates the proportion of the average cumulative AE energy associated with each damage mode across specimens subjected to various aging conditions. Notably, the cumulative AE energy attributed to delamination exceeds 75%, corroborating the observation that mode-I fracture predominantly involves delamination damage. It suggests that the subset of features selected by Imp-LS retains the accuracy and robustness of subsequent AE data classification for specimens with different aging states. Figure 15 illustrates the cumulative AE energy development curves for the three types of damage, plotted against mechanical change curves for specimens with varying aging states. Similar to the analysis of specimen IV-2 in “Monitoring the mechanical behavior of composites in a single aging state” section, the cumulative AE energy associated with delamination qualitatively reflects significant changes in the mechanical properties of the specimen. This warning regarding mechanical behavior provides a reference for assessing the residual load-carrying capacity of composites.
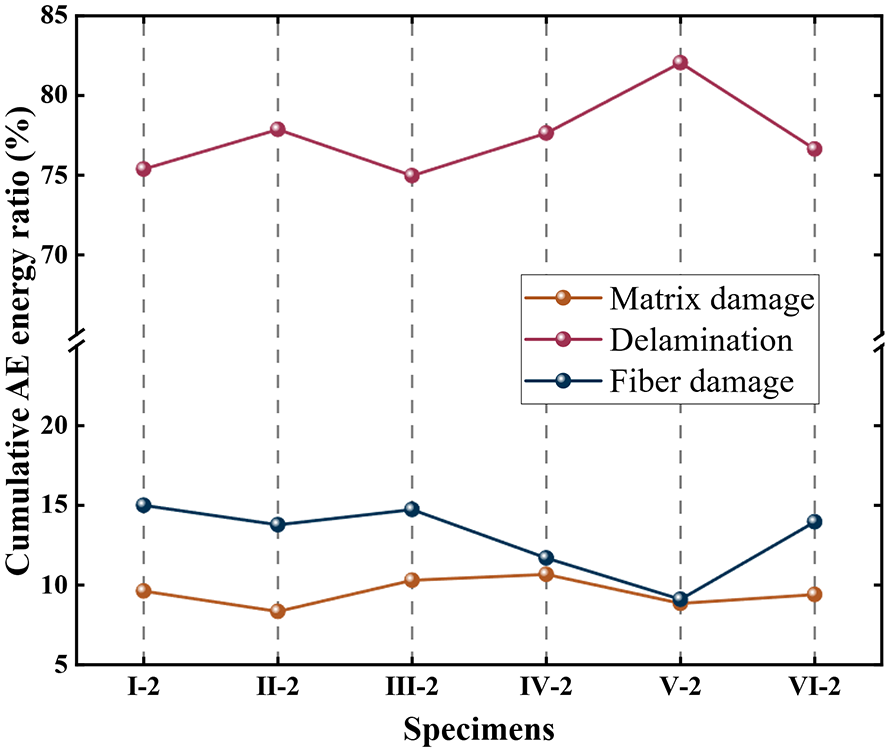
Cumulative AE energy ratio of three types of damage for specimens with different aging states. AE: acoustic emission.
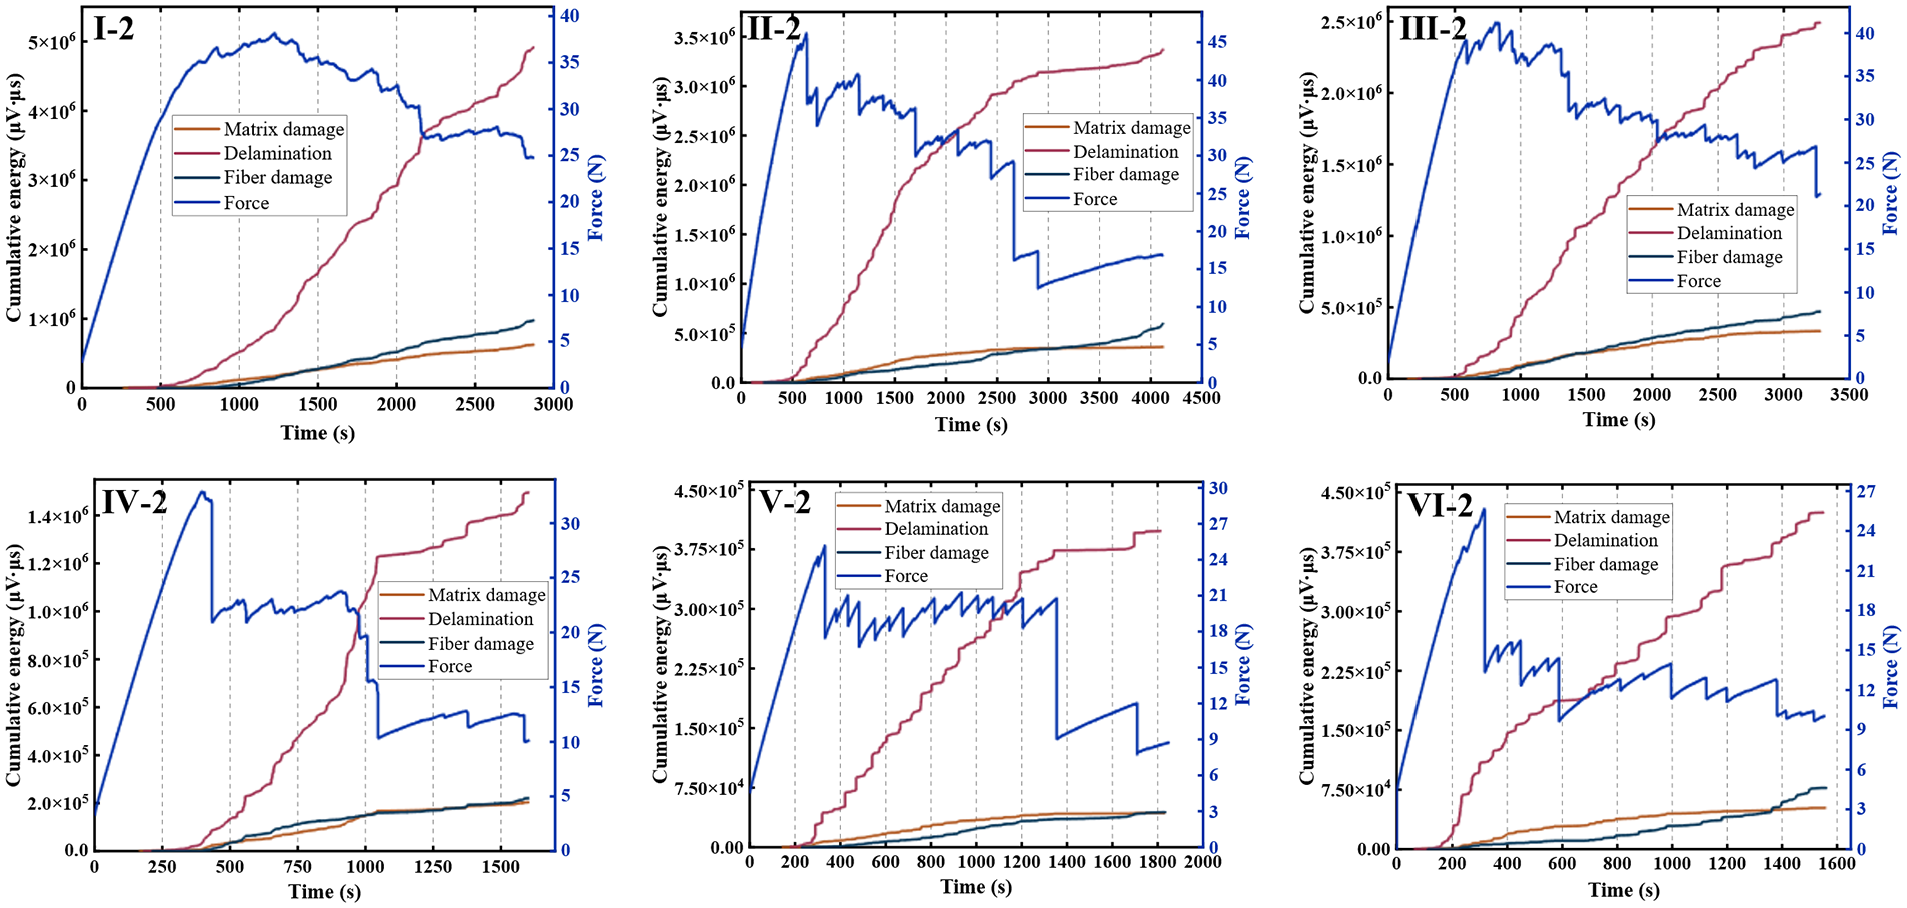
Cumulative AE energies and mechanical curves for three types of damage in specimens with different aging states. AE: acoustic emission.
Successful monitoring of the mechanical behavior of specimens in various aging states confirms the effectiveness of AE for whole-life health monitoring of composites. The robustness and accuracy of the Imp-LS algorithm for screening and retaining valid features of AE data provide substantial support for AE monitoring.
Conclusion
In this article, an improved feature selection algorithm based on the LS algorithm is proposed. The feature selection effects of both the LS algorithm and the Imp-LS algorithm are compared using DCB testing data from GFRP composites with various aging states. The effectiveness of the Imp-LS algorithm in feature selection and the applicability of AE for whole-life health monitoring of composites are validated through the successful monitoring of the degradation behavior of the mechanical properties of composites resulting from mode-I fracture. It can be succinctly summarized as follows:
The Imp-LS algorithm not only excludes redundant features but also enhances robustness. The Imp-LS algorithm incorporates a feature correlation identification component to eliminate redundant features and enhances the robustness of the improved algorithm by integrating a feature selection algorithm.
The clustering visualization ability of the feature subset selected by the Imp-LS algorithm is enhanced, and the clustering performance is more stable. The feature subset of the Imp-LS algorithm can retain the main information with fewer principal components, and the optimal clustering evaluation strategy with multiple clustering evaluation metrics illustrates that the feature subset selected by the Imp-LS algorithm has stronger clustering stability.
The Imp-LS algorithm selects a subset of features that can be utilized to monitor the mechanical behavior of composites in various aging states. For various aging specimens, the AE features selected using the Imp-LS algorithm exhibit a significant clustering effect. Moreover, the delamination energy serves as an indicator of the degradation of the mechanical properties of the composites resulting from mode-I fracture.
The effectiveness of AE for whole-life health monitoring of composites was verified. Using aging tests to simulate the state of composites in different service periods, and the effectiveness of AE to qualitatively reflect the degradation of mechanical properties of composites in whole-life service is demonstrated through the effective monitoring of the mechanical behaviors of composites with different aging states under DCB testing.
The damage monitoring of DCB specimens validates the effectiveness of the Imp-LS algorithm. Additionally, the research into monitoring the mechanical behavior of materials through the damage state provides a novel perspective for the structural health monitoring of composites. In the future, this method will be further validated through diversified testing of composites subjected to a broader spectrum of aging states, with promising prospects for practical application in engineering contexts.
Footnotes
Declaration of conflicting interests
The author(s) declared no potential conflicts of interest with respect to the research, authorship, and/or publication of this article.
Funding
The author(s) disclosed receipt of the following financial support for the research, authorship, and/or publication of this article: This work was supported by the Chinese National Natural Science Fund (no. 12072005, U23A2067) and the Project of High-Level Talents Introduction of Hebei Province (2021HBQZYCSB009).
Data availability
The data that has been used is confidential.