
Abstract
This study proposes a strain-based methodology for decoupling, localizing, and quantitatively diagnosing bearing faults. Multiple strain gauges are circumferentially and evenly arranged on the bearing’s outer surface using precision-machined housing notches for optimal placement. Spall-type faults can be effectively classified and localized through time-domain analysis of strain-drop pulses in the acquired signals. Fault width estimation is achieved by combining three key parameters: fault transit time extracted from strain signals, relative contact velocity and rolling contact semi-width. To validate the proposed methodology, controlled experiments were conducted using bearings with artificially induced spall-like faults (0.5–2 mm in width) located on rollers, outer raceways, and inner raceways under varying rotational speeds. The elevated signal-to-noise ratio and array test of the strain signals show promising decoupled diagnostic potential for compound spall-like faults in the test bearings. Experimental results reveal that the mean estimated fault width deviates from actual measurements by less than 5% in most test cases, confirming the method’s estimation accuracy.
Keywords
Introduction
Bearings constitute one of the most critical components in rotating machinery systems, requiring sustained high performance under severe operating conditions. Despite their importance, rolling element bearings remain highly vulnerable to defects under demanding operational stressors, including heavy loads, excessive vibrations and inadequate lubrication. 1 Industry statistics 2 indicate that 40% of motor failures originate from bearing malfunctions. Consequently, it is imperative to undertake precise, reliable and efficient diagnostic techniques for bearing fault detection.
Extensive research over recent decades has focused on advanced signal detection and processing methodologies for bearing fault diagnosis.3–6 Diverse sensing technologies – including vibration,7–9 acoustic noise, 10 temperature 11 and current12,13– have been systematically investigated. While vibration analysis remains the dominant approach,4,14 its effectiveness is fundamentally constrained by the global nature of vibration signals. 15 Mechanical interactions between adjacent components introduce signal contamination, where bearing-specific fault signatures are often masked by extraneous vibrations. Consequently, significant research efforts have concentrated on advanced signal processing algorithms to isolate fault-related features from background noise and enhance diagnostic resolution. 15 Machine learning, 16 deep neural networks 14 and transfer learning frameworks 17 have undergone significant improvement in feature extractions and classifications of bearing fault diagnosis. However, most diagnosis algorithms were trained by some classical public rolling bearing datasets from Pronostia, Case Western Reserve University, Paderborn University and so on. 4 The application effectiveness and diagnostic accuracy of these algorithms in real-life complex scenarios, such as drivetrains in high-speed trains and wind turbines, are yet to be verified. Moreover, while existing methods excel at binary fault detection and classification, quantitative assessment of fault dimensions – essential for predictive maintenance – remains an open challenge.
Initial attempts to quantify spall dimensions leveraged nonlinear dynamic models of defective bearings. The seminal work by Epps and McCallion 18 established a foundation by correlating outer race spall length with time intervals between entry/exit vibration pulses. Subsequent advancements by Sawalhi and Randall 8 enabled clearer separation of entry-exit events through specialized signal processing techniques. Recent innovations, including variational mode decomposition 7 and modified energy value analysis, 9 have further refined spall size estimation. Although all of these works have proved the accuracy of their method for fault size estimation based on the public database or their test rigs, the complex global nature of the vibration response limits the development and application of the method based on time-domain analysis of vibration signals in scenarios such as multi-source fault coupling and complex vibration environment.
Signal fidelity directly governs diagnostic reliability, 19 motivating the exploration of strain sensing as an alternative modality. Unlike vibration signals, strain responses inherently reflect localized bearing deformations, minimizing contamination from external mechanical noise. Building on this principle, Alian et al. 15 pioneered fibre-optic strain sensing embedded in bearing housings, reporting preliminary success in raceway spall sizing. However, critical limitations persist: the absence of external loading (a key determinant of strain response) during testing compromises method validity, and the approach lacks validation for roller defects or concurrent multi-fault diagnosis.
This work addresses these gaps by introducing a novel strain-gauge-array methodology for simultaneous fault localization and dimensional quantification. The proposed system enables decoupled diagnosis of spall-type defects across outer/inner raceways and rollers through optimized circumferential strain gauge placement. The article is structured as follows: section ‘Strain based measurement principle for detecting bearing fault location and size’ details the strain-based measurement principles; section ‘Experiment’ describes experimental protocols, including prefabricated fault specifications and test configurations; section ‘Results and discussions’ presents diagnostic results for fault position, width, and coupling effects; section ‘Conclusion’ provides concluding remarks and future directions.
Strain-based measurement principle for detecting bearing fault location and size
An instrumented bearing methodology employing circumferential strain gauge arrays has been successfully implemented for radial load distribution monitoring in roller bearings, 20 with field applications in high-speed train gearbox and axlebox bearings.21,22 As illustrated in Figure 1(a), precision-engineered notches are machined into the housing’s inner surface to accommodate the spatially optimized strain gauge array, enabling high-fidelity strain detection on the bearing outer ring. The angular spacing between adjacent strain gauges precisely matches the roller pitch angle, with position identifiers (0, 1L, 1R, 2L, 2R, 3L, 3R) marked in Figure 1(a) corresponding to specific monitoring zones. Critical mechanical validation through combined finite element analysis and experimental testing confirmed that the notch configuration preserves both radial load distribution integrity and roller kinematic behaviour. 20
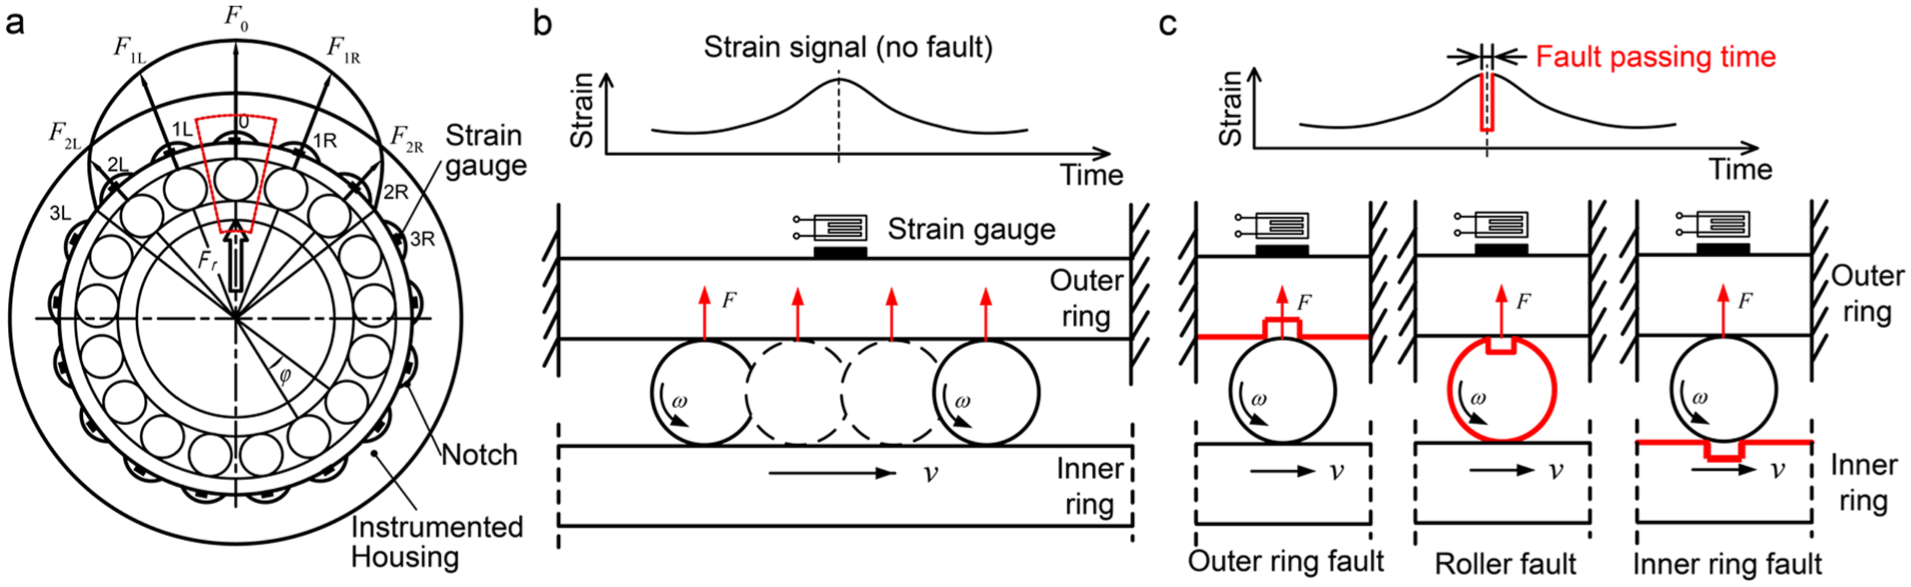
Measurement principle of strain-based detection for fault location and size of roller bearings, (a) instrumented bearing, (b) typical strain signal without fault in contact and (c) typical strain signal without fault in contact.
Building on this foundation, we propose a novel strain-based diagnostic framework for simultaneous fault localization and dimensional characterization. The operational principle leverages distinct strain signatures:
Intact bearing condition (Figure 1b): Roller passage generates a quasi-sinusoidal waveform with single-cycle periodicity at the sensing position.
Fault-induced response (Figure 1c): Sudden contact load variations – caused by defective rollers/raceways interacting with fault zones produce characteristic drop-pulse anomalies in strain signals.
Indeed, the strain pulse width in the cycle domain, which is called fault passing time Δtfault in this paper, is proportional to the fault size. In principle, the fault width should be equal to the product of the fault passing time Δtfault and the relative velocity between roller and raceways. Specifically, the estimation of outer raceway fault (OF) width wfault,o and inner raceway fault (IF) width wfault,i has been given by Alian et al. 15 as illustrated in Equations (1) and (2). Similarly, the estimation equation of roller fault (RF) width wfault,r is given in this paper as shown in Equation (3):


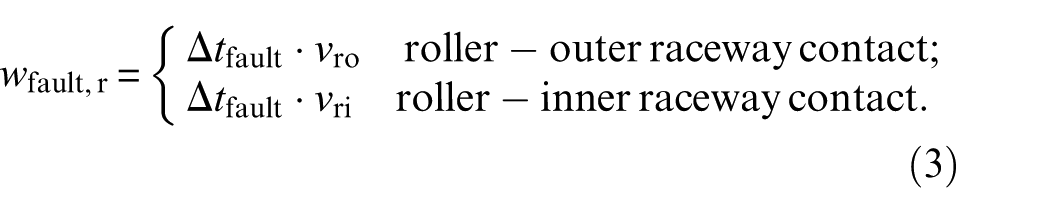
where vro and vri are respectively the relative velocity of roller-outer raceway contact and roller-inner raceway contact. Under pure rolling conditions, the relative velocity vro and vri in the bearing with a fixed outer ring and rotational inner ring is determined as follows 23 :
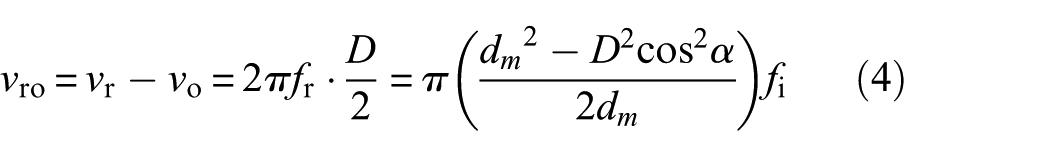
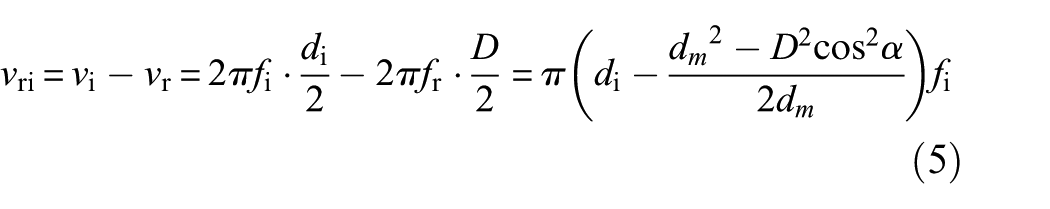
where fr is the roller rotation frequency and fi is the inner ring rotation frequency. D, d m and di are respectively the diameters of roller, pitch and inner raceway. α is the contact angle.
The spatially distributed strain gauge array provides multi-azimuth strain monitoring within the bearing’s load zone, enabling precise fault localization through phase-domain analysis of strain signatures. Distinct temporal features of the strain-drop pulses, including pulse initiation timing and azimuthal propagation characteristics, encode critical spatial information about spall-type defects. Leveraging this spatial resolution capability, the azimuth position of faults can be triangulated by correlating the strain-drop pulse arrival times across multiple sensing nodes.
For OF on a non-rotating outer ring of bearing, the fault localization mechanism relies on fixed spatial relationships between the defect and strain gauge array. As rollers sequentially traverse the stationary OR defect, only the strain gauge aligned with the fault azimuth exclusively manifests the characteristic drop pulse. This phenomenon is exemplified in Figure 2(a) for a 17-roller bearing. When the OF coincides with sensing position 0, cyclostationary analysis reveals persistent drop pulses precisely at the strain signal’s peak positions (Figure 2(b)). Adjacent sensing positions (1L-3R) exhibit unperturbed quasi-sinusoidal waveforms, with fault signatures conspicuously absent.
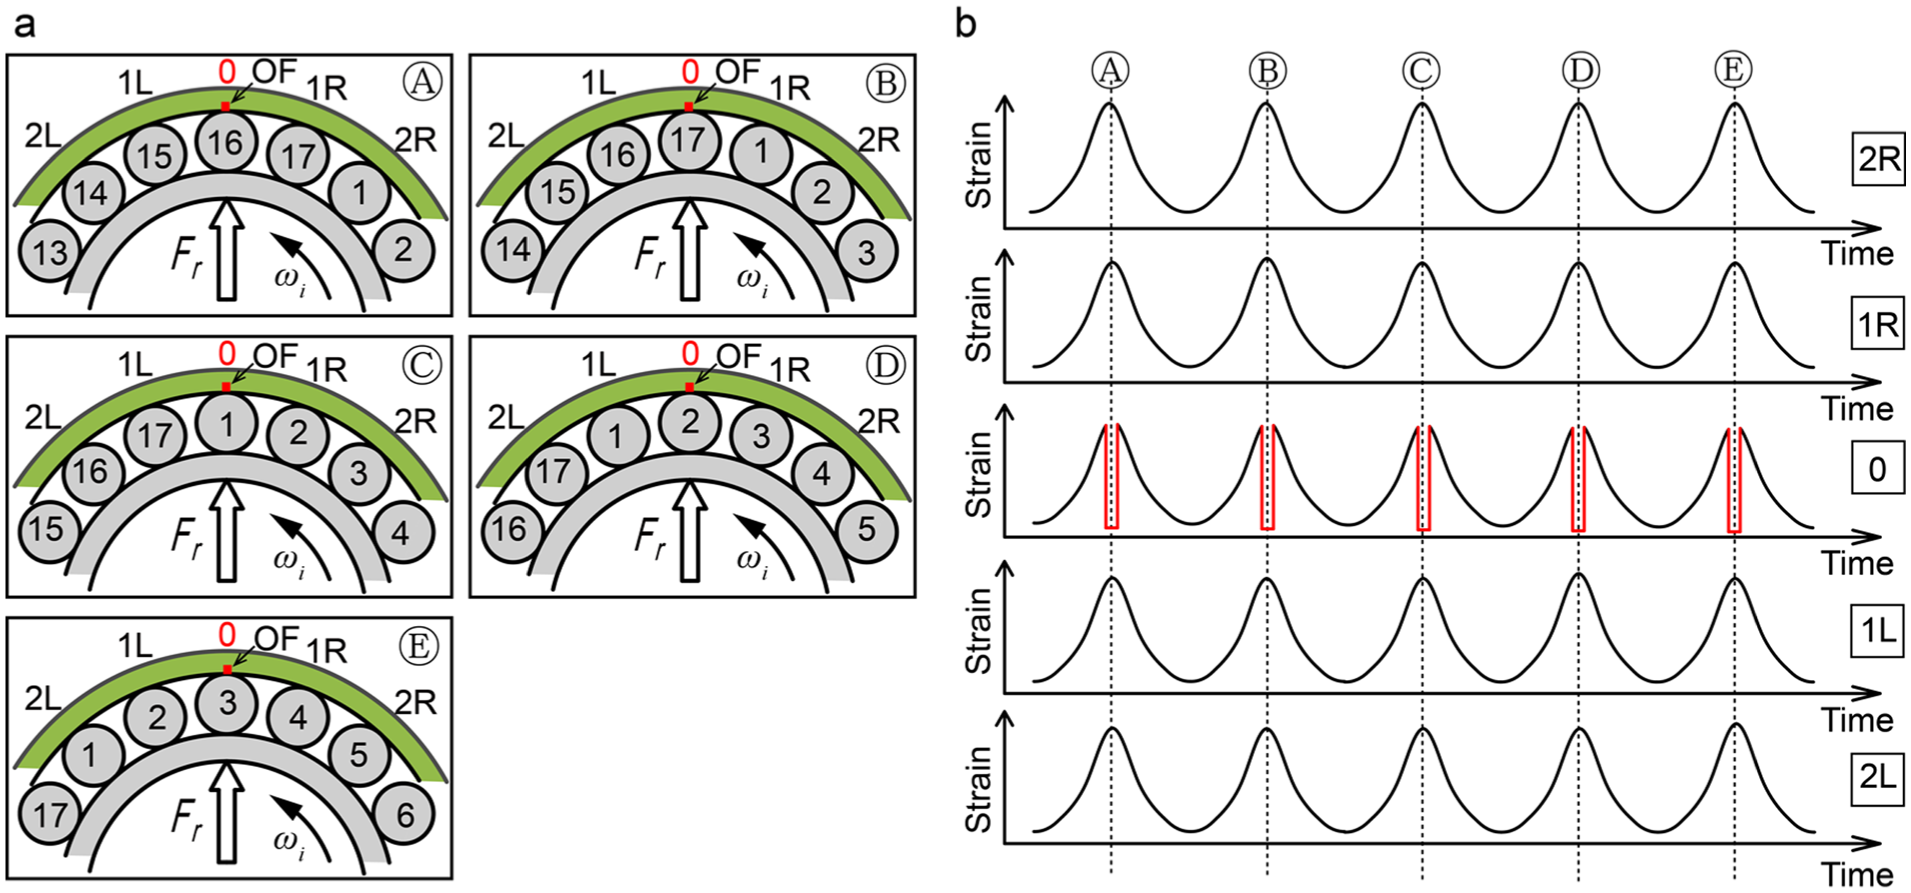
Dynamic strain responses distributed on the outer surface of the bearing with outer raceway fault in principle, (a) sketch map of rollers rolling through the outer ring fault and (b) dynamic strain signals from 5 strain gauges.
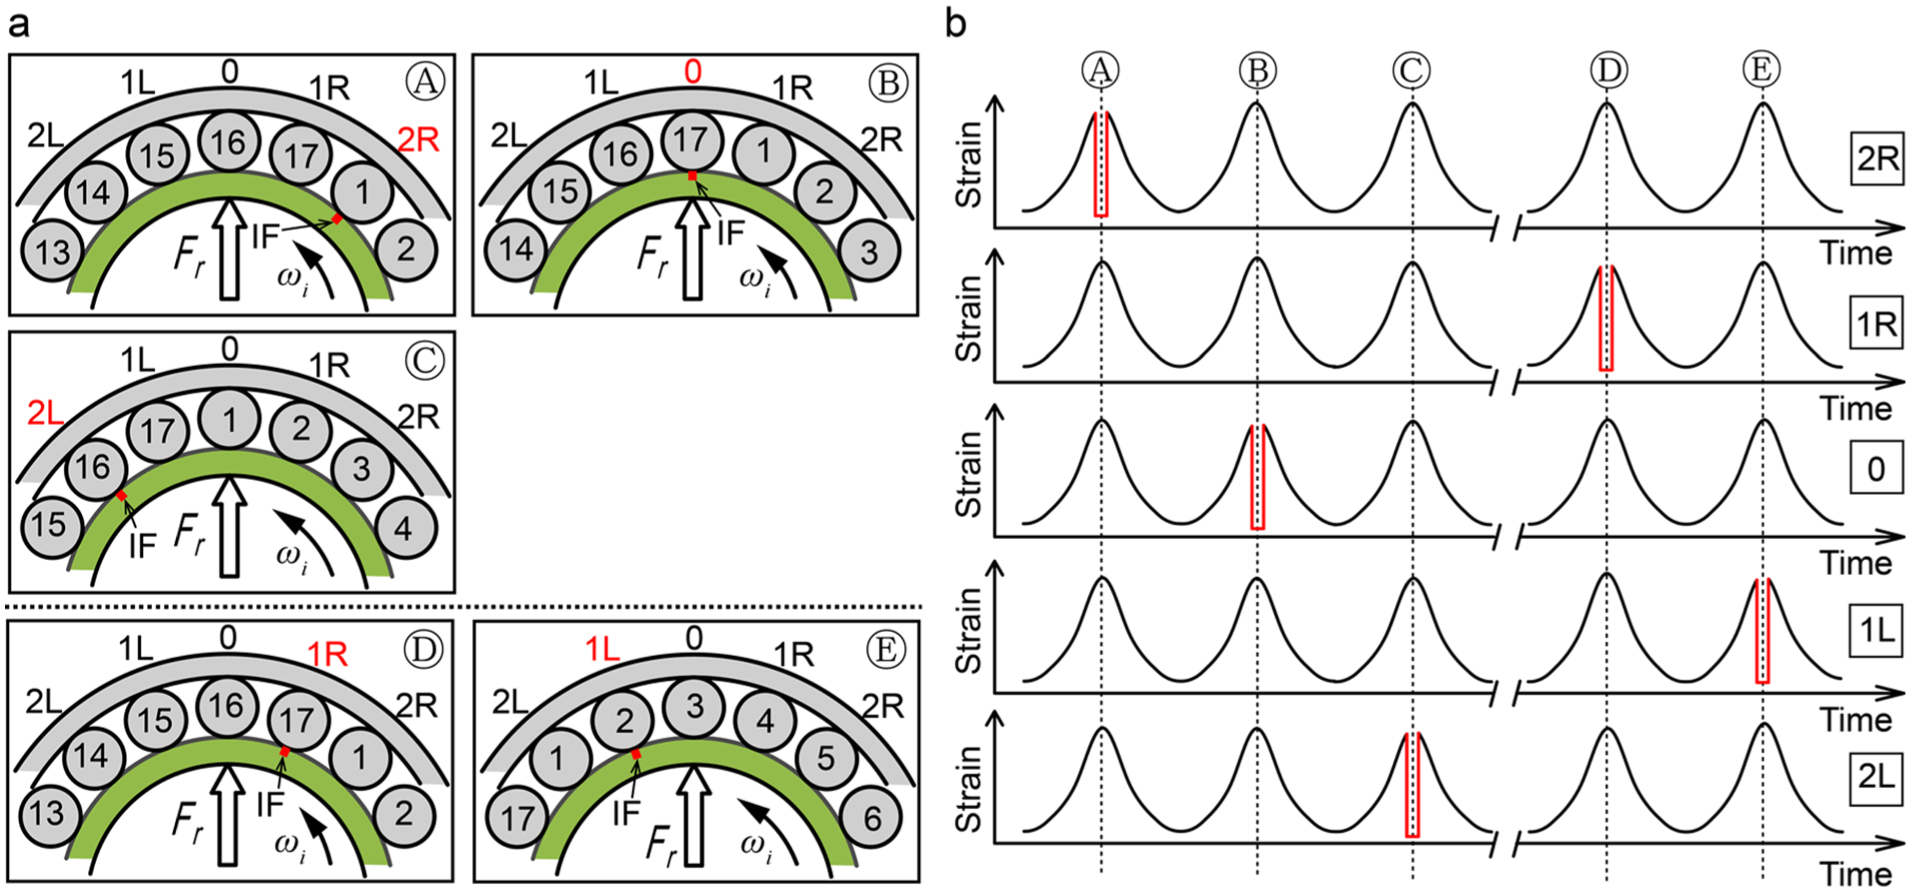
In the case of the IF on a rotating inner ring of bearing, the strain-drop pulse detection mechanism is governed by the kinematic interplay between inner ring rotation and roller revolution. The strain-drop pulse can be detected by the strain gauge array only when the IF is in contact with a roller. In pure rolling conditions, the kinematic relationship between the roller revolution speed n re and the inner ring rotation speed n i is given as follows 23 :
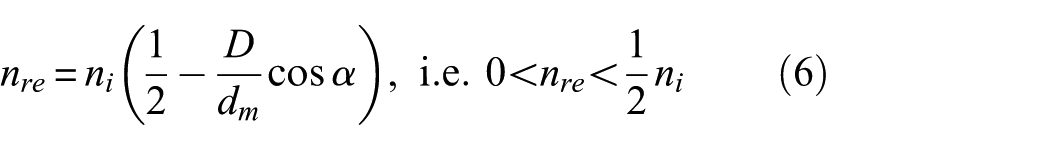
This differential motion creates a phase-shifted fault signature propagation:
Initial contact (Figure 3(a), moment A): IF engages Roller #1 at position 2R, generating a characteristic strain-drop pulse as shown in Figure 3(b).
Subsequent engagements exhibit non-adjacent position jumping due to the velocity ratio nearly 2:1 (n i ≈ 2n re when assuming D is significantly smaller than d m in this bearing):
Moment B: Roller #1 reaches position 1R while IF contacts Roller #17 at position 0.
Moment C: IF-Roller #16 interaction at position 2L.
Moments D–E: Fault signature migrates from position 1R to position 1L through equivalent kinematic phase shifts.
Dynamic strain responses distributed on the outer surface of the bearing with an inner raceway fault in principle, (a) sketch map of faulty inner ring rolling process and (b) dynamic strain signals from 5 strain gauges.
The resultant strain pulses manifest as azimuthally hopping transients whose spatial-temporal patterns encode both IF location and bearing kinematics.
For RF, the diagnostic signature manifests through alternating raceway contact events during roller rotation. The strain sensing position and moment at which the strain-drop pulse is detected depend on the relative speeds of the rotation and the revolution of rollers. In pure rolling conditions, the kinematic relationship between the roller rotation speed n r and the revolution speed n re is given as follows 23 :
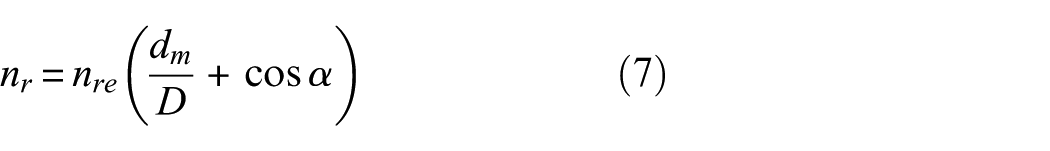
The optimal range of d m /D, which is contingent upon the optimal design of the bearing geometry with the objective of long fatigue life, is situated between four and eight for roller bearings of varying dimensions.24,25 It indicated that the RF tends to traverse each strain sensing position in turn during the rolling process, while the RF point-raceway contact tends to alternate between the outer and inner raceways. For example, as depicted in Figure 4(a), a faulty roller purely rolls in a cylindrical roller bearing (CRB) of 17 rollers and d m /D = 7.5, that is, n r = 8.5 n re . In this bearing, the roller exactly completes a rotation of π as it traverses the distance between successive strain-sensing positions. Therefore, the following features of strain-drop pulses can be found:
Moment A: RF engages outer raceway at position 2R.
Moment B: Roller advances to position 1R, and RF switches to inner raceway contact.
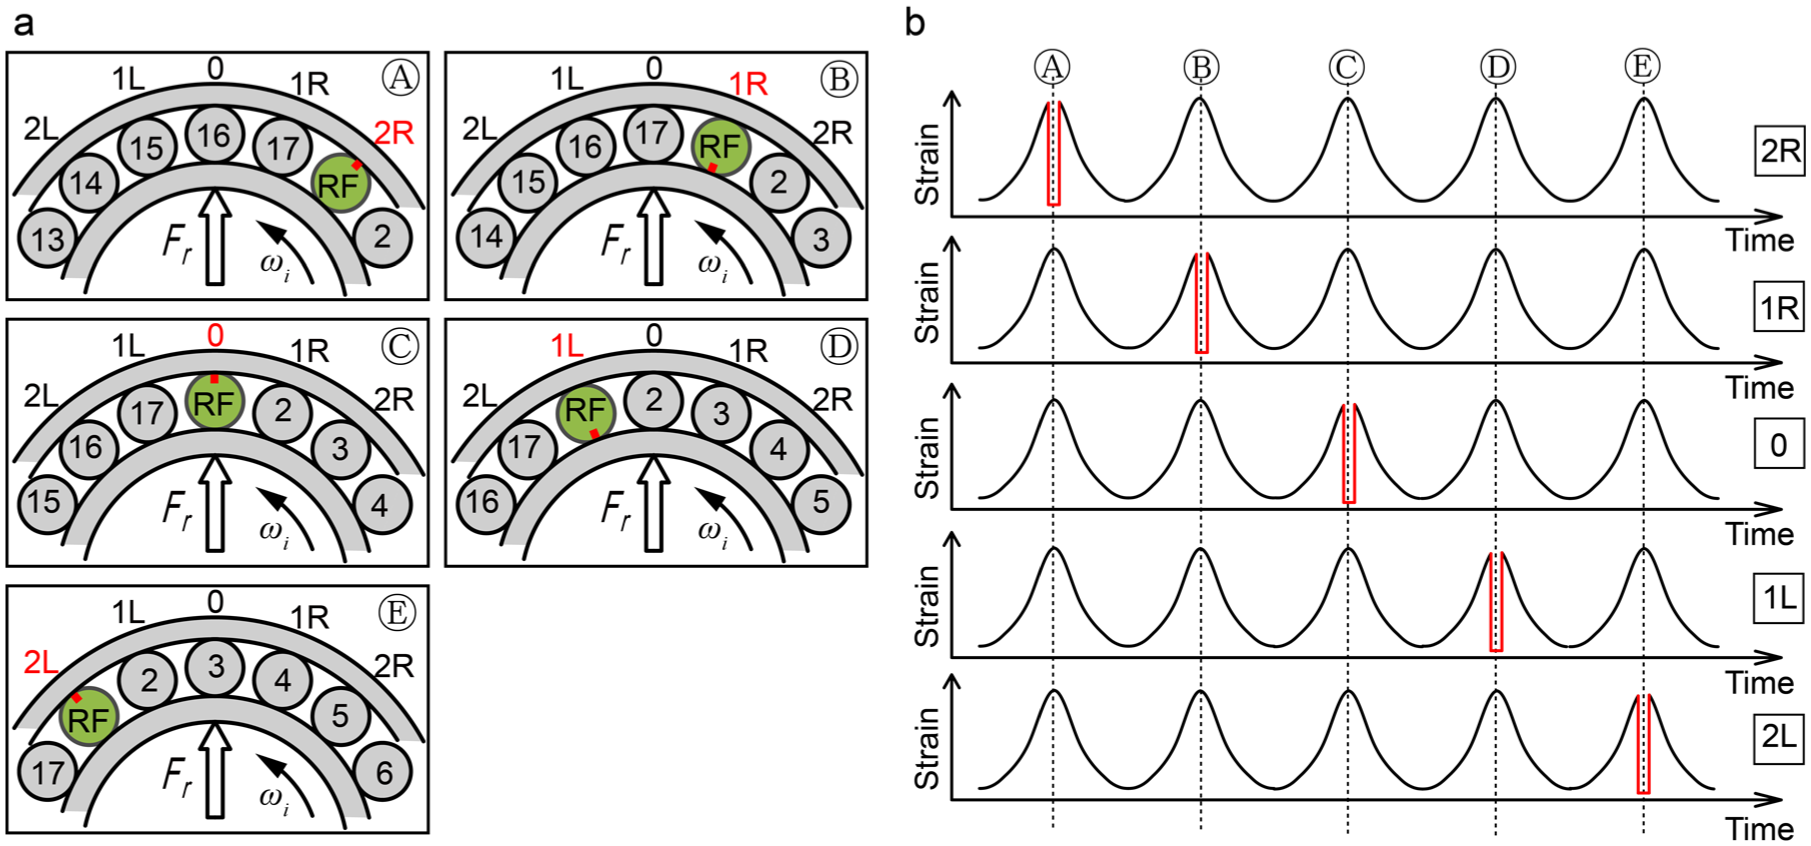
Dynamic strain responses distributed on the outer surface of the bearing with roller fault in principle, (a) sketch map of faulty rollers rolling through the sensing position and (b) dynamic strain signals from 5 strain gauges.
Subsequent cycles (from positions 0 to position 2L) exhibit periodic contact alternation.
The resultant strain signatures are shown in Figure 4(b) reveal sequential drop pulses across five contiguous gauge positions, forming a characteristic ‘staircase’ spatiotemporal pattern.
In summary, the strain-drop pulse occurring at the same sensing position within two adjacent roller passing cycles is indicative of an OF response. The strain-drop pulse occurring at a single sensing position apart corresponds to an IF response. The strain-drop pulse occurring at two sensing positions in sequence is indicative of an RF response. It should be noted that the occurrence of a strain-drop pulse in a cycle domain is not necessarily aligned with the strain peak point. The timing of the strain-drop pulse is contingent upon the relative circumferential position between the strain gauge and the fault-roller/raceway contact point. Besides, in the case of IF and RF, the specific time interval between two neighbouring strain faulty pulses is mainly dependent on the bearing geometry and is not necessarily equal to the roller passing cycle time.
Experiment
A comprehensive experimental campaign was conducted to systematically evaluate the diagnostic efficacy of the multi-channel strain gauge array in (1) spall-type fault localization, (2) dimensional quantification across all critical bearing components (outer/inner raceways; rollers), and (3) decoupling of compound faults in bearing under controlled operational conditions.
Test bearing with prefabricated fault
Two SKF NU214ECML CRBs were used in the experiment. The specification of the test bearing is shown in Table 1. One bearing was faultless, while some faults were prefabricated in the other bearing. Figure 5 shows the precision-machined axial faults on the outer ring, inner ring and rollers. Each type of precision-machined faults contains four widths of 0.5, 1.0, 1.5 and 2.0 mm. According to the location and width of these faults, they are respectively numbered as OF1, OF2, OF3, OF4 on the outer ring in Figure 5(b)–(e), IF1, IF2, IF3, IF4 on the inner ring in Figure 5(f)–(i), and RF1, RF2, RF3, RF4 on the rollers in Figure 5(j). All prefabricated spall-like faults have a depth of 0.5 mm.
Specifications of the test bearing.
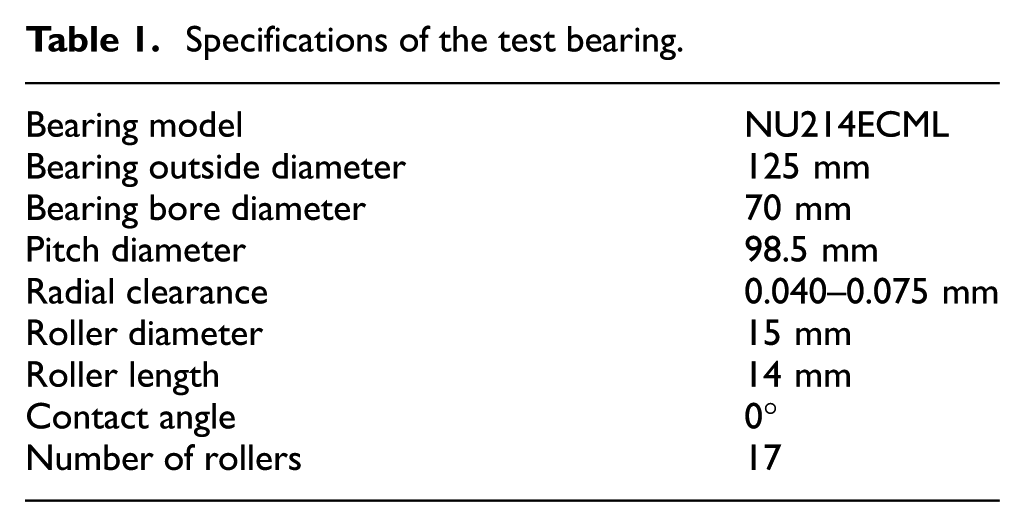
Photos of test bearing, (a) overview of the faulty components, (b–e) outer ring fault with four widths from 0.5 to 2 mm, (f–i) inner ring fault with four widths from 0.5 to 2 mm, (j) roller fault with four widths from 0.5 to 2 mm.
Experimental setup
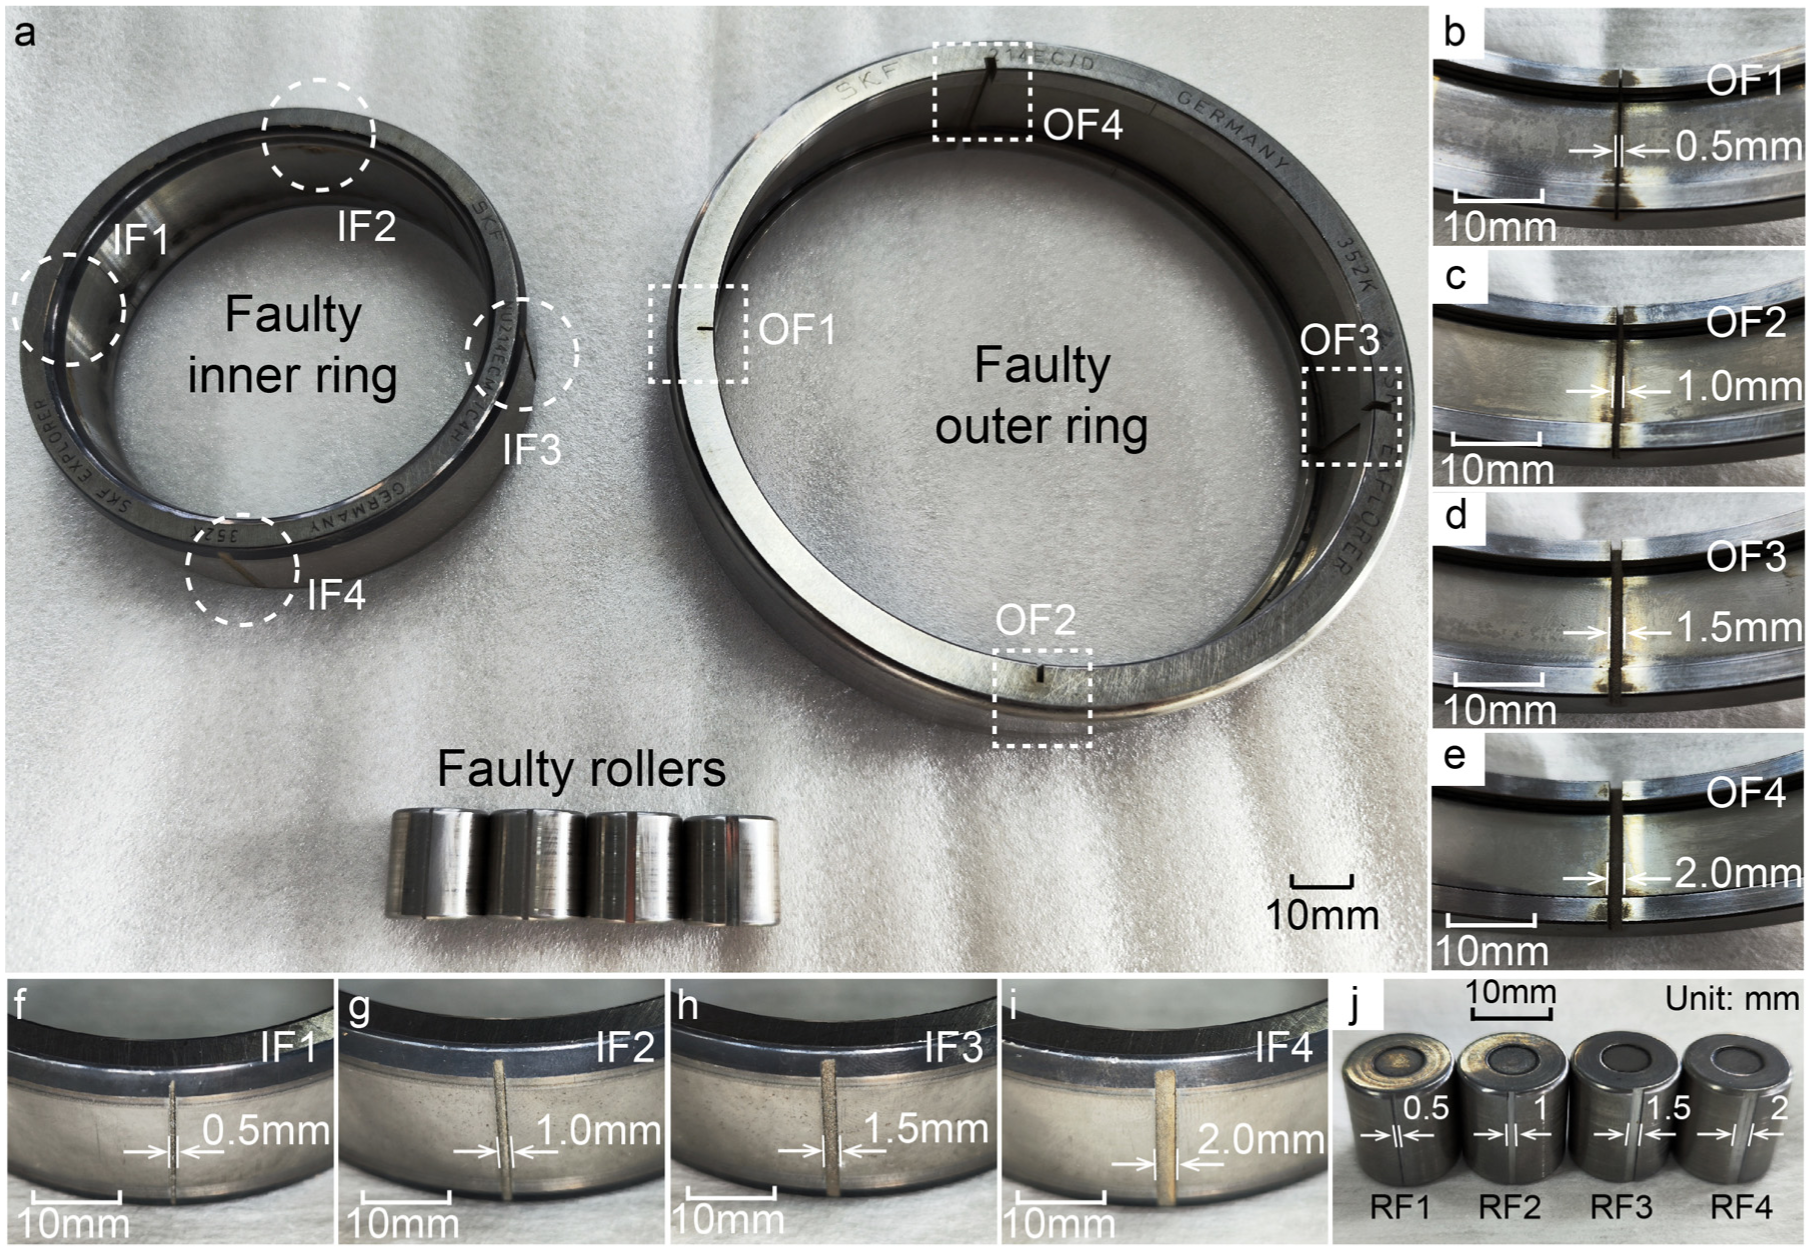
Figure 6(a) and (b) show the test rig used in this experiment. The inner ring of the test bearing is fitted with a shaft that is supported by two support bearings. The shaft is connected to a variable-frequency motor via a coupling. A hydraulic radial loading system, equipped with a calibrated force sensor (±0.03% accuracy), applies and monitors radial loads. The bearing assembly, integrated with a precision-notched housing as shown in Figure 6(c), features a circumferentially distributed 7-gauge array (KYOWA KFG-1-120-C1-1 1L1M2R) bonded to the outer surface of the bearing using strain-gauge-grade epoxy. The top strain sensing position is numbered as 0, and the others are numbered as 1L, 1R, and so on, respectively. The strain gauges are interfaced with an HBM eDAQ-5488 data acquisition system through full Wheatstone bridge configurations and shielded coaxial cables to ensure high-fidelity signal transmission and synchronized multi-channel sampling.
Photos of test rig (a) overview, (b) loading part of the test rig, (c) assembly of instrumented housing and bearing, and (d) strain gauges on the test bearing.
Experimental conditions
The experimental protocol employed a systematic fault matrix encompassing 10 operational scenarios, constructed through modular assembly of defective and pristine bearing components. Combining the faulty outer ring with non-faulty rollers and inner ring, the strain-based diagnosis of the OF with four sizes was investigated in the test cases 1–4. As depicted in Figure 7(a)–(d), OF1, OF2, OF3 and OF4 are respectively located on the most heavily loaded position within the load zone. The positive clearance of the test bearing allows for a load zone range of less than 180°, thereby ensuring that each of cases 1–4 corresponds to a single size of OF in the load zone. Case 5 shown in Figure 7(e) is the IF case. IFs in the four widths are evenly distributed on the inner raceway and diagnosed simultaneously in test case 5. Test cases 6–9 given in Figure 8(a)–(d), respectively correspond to the RF1–RF4 cases. One faulty roller is combined with 16 non-faulty rollers and non-fault rings in the test bearing in each of cases 6–9. Case 10 shown in Figure 9 is the compound fault case. In case 10, the OF1 is situated in the most heavily loaded position within the load zone of the bearing, while four faulty rollers are positioned three or four non-faulty rollers apart. The OF1, IF1–IF4 and RF1–RF4 are diagnosed simultaneously in case 10. Besides, the strain signals from the test bearing with no fault were measured as reference.
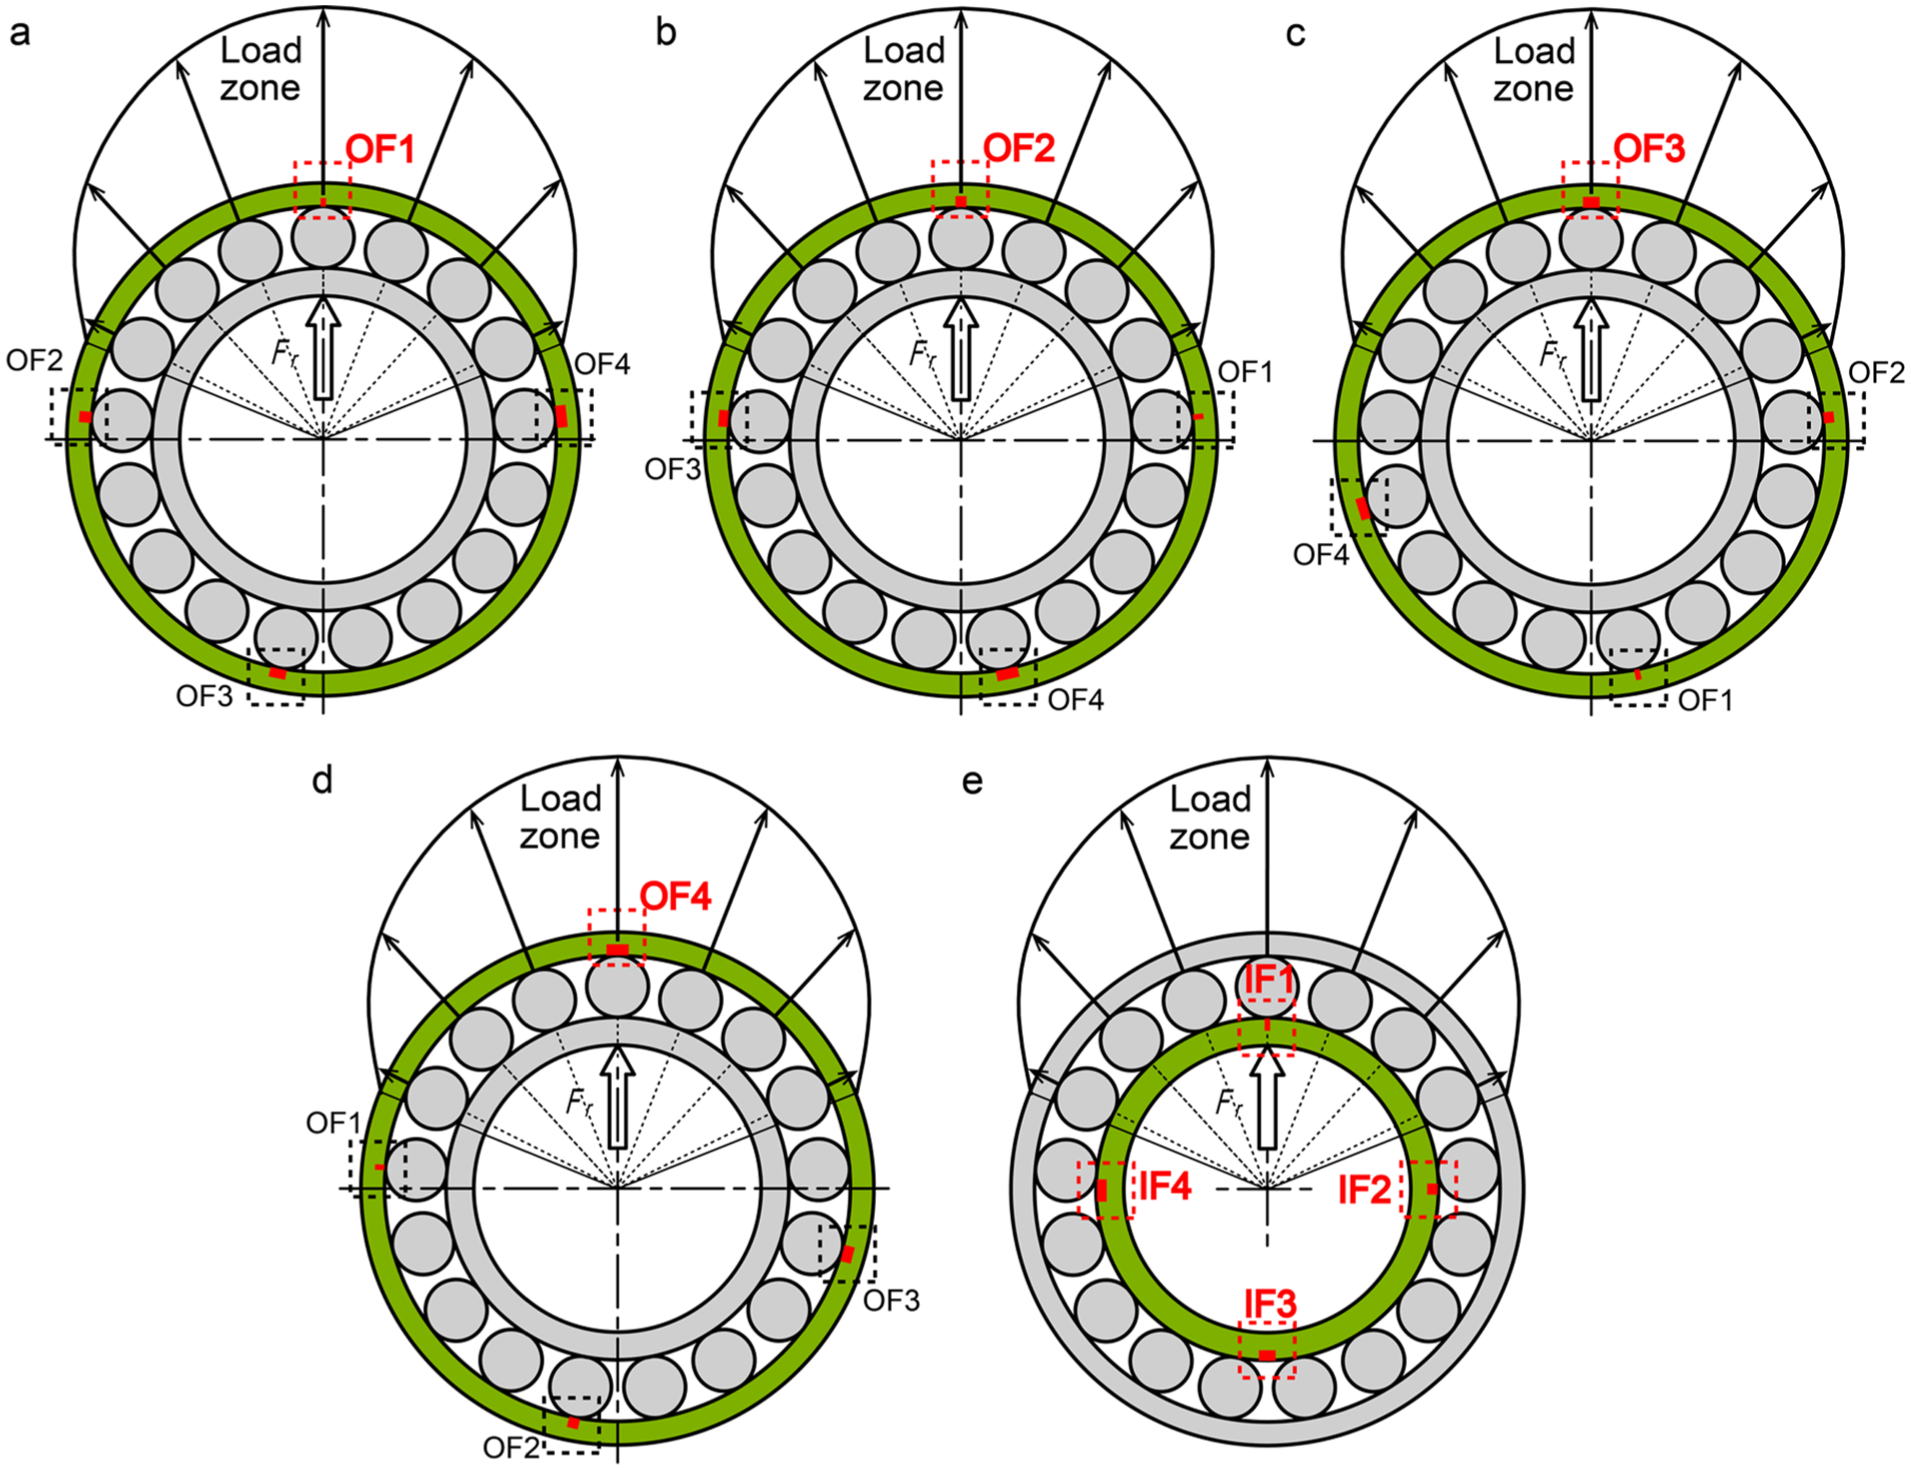
Test cases for faulty outer and inner ring (a–d) test cases for faulty outer ring with four different fault widths, (e) test case for faulty inner ring.
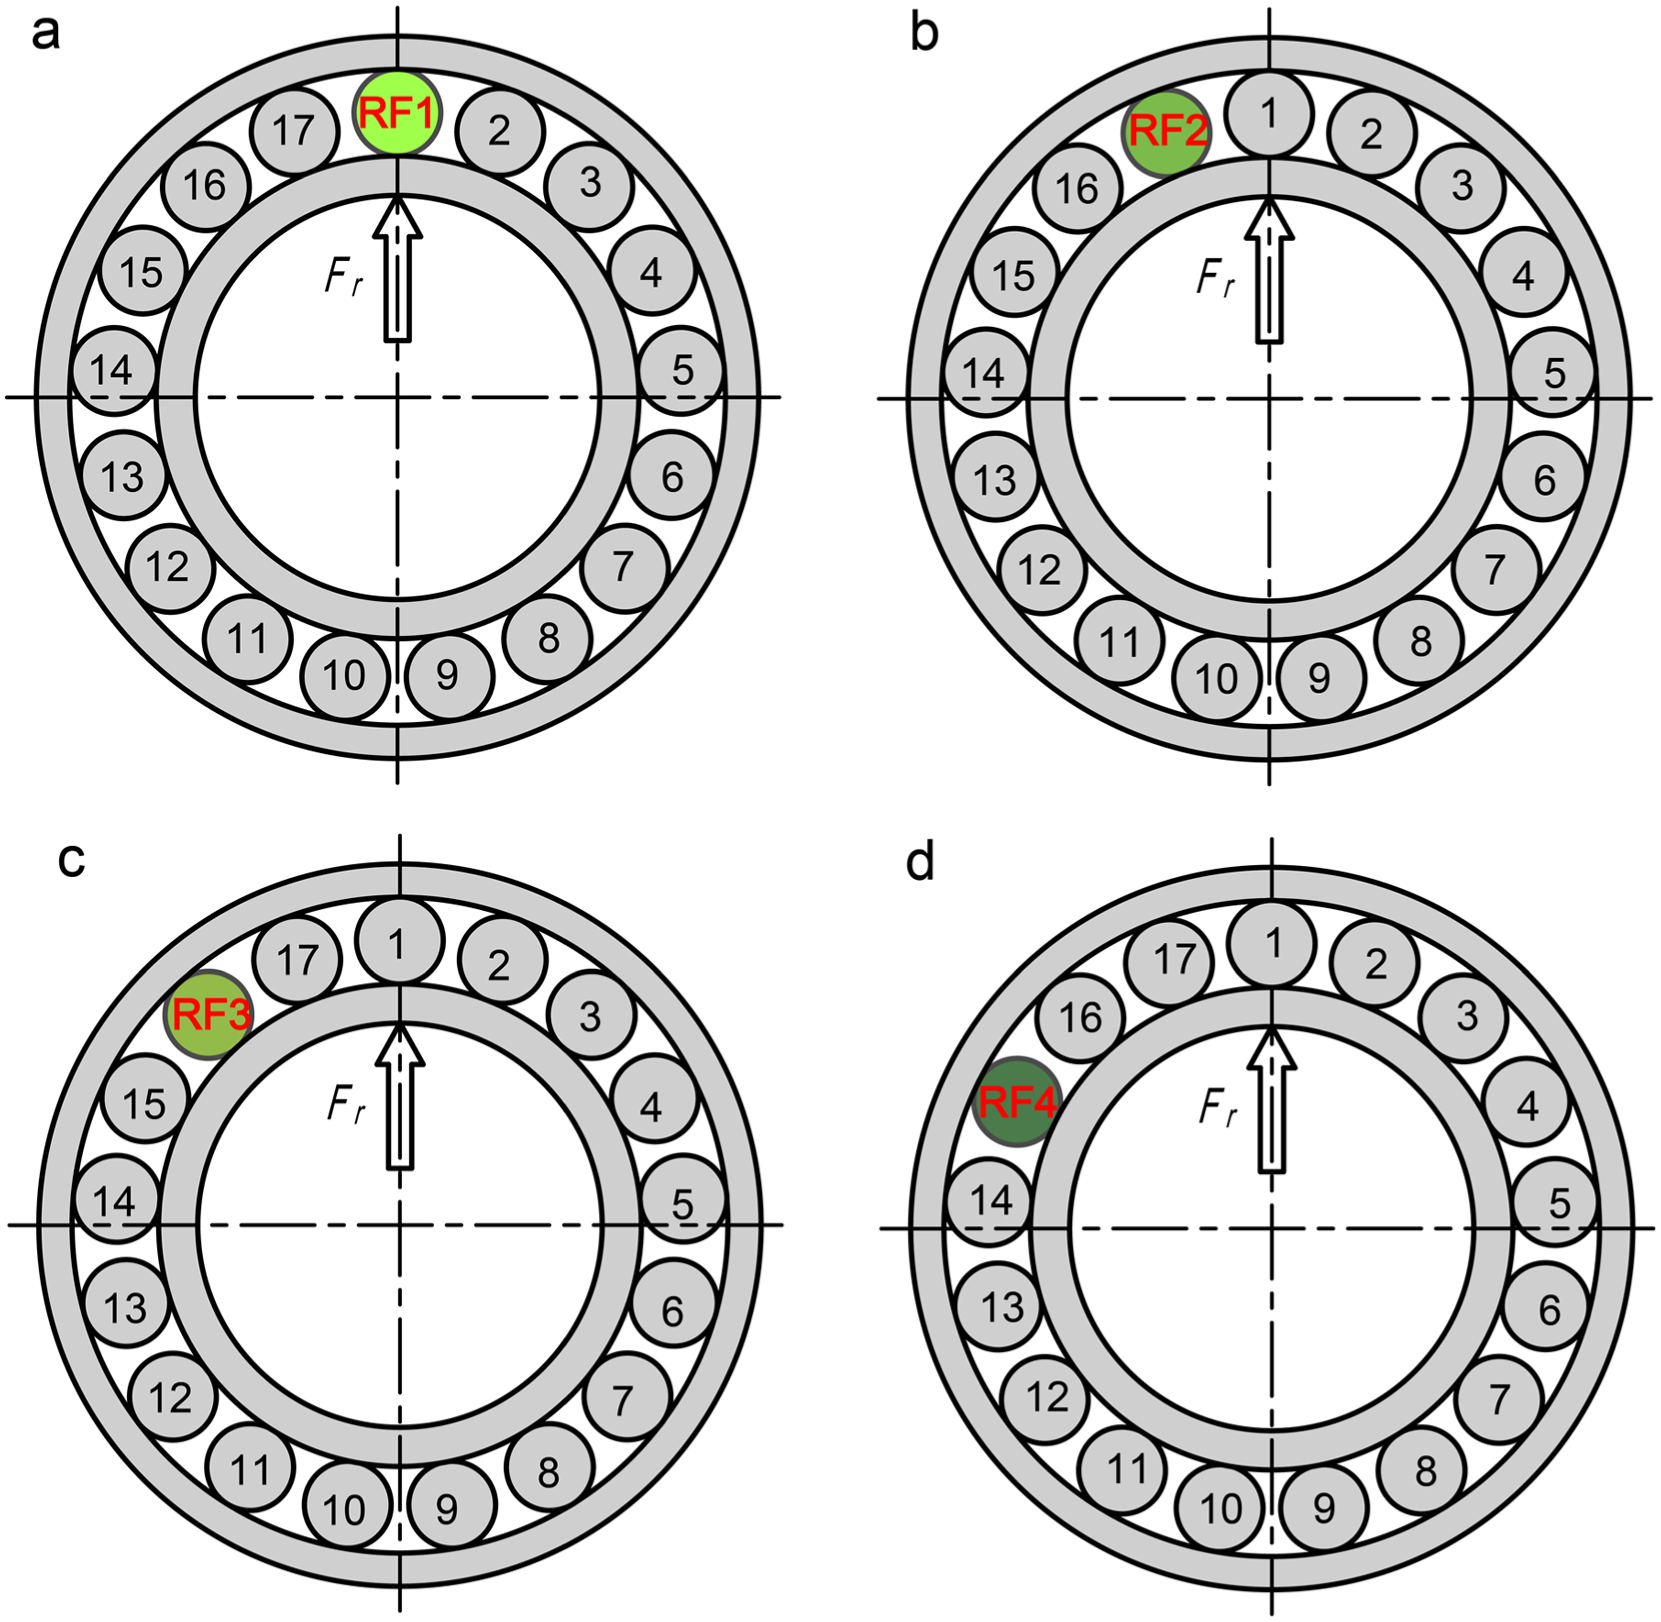
(a–d) Test cases for faulty rollers with four different fault widths.
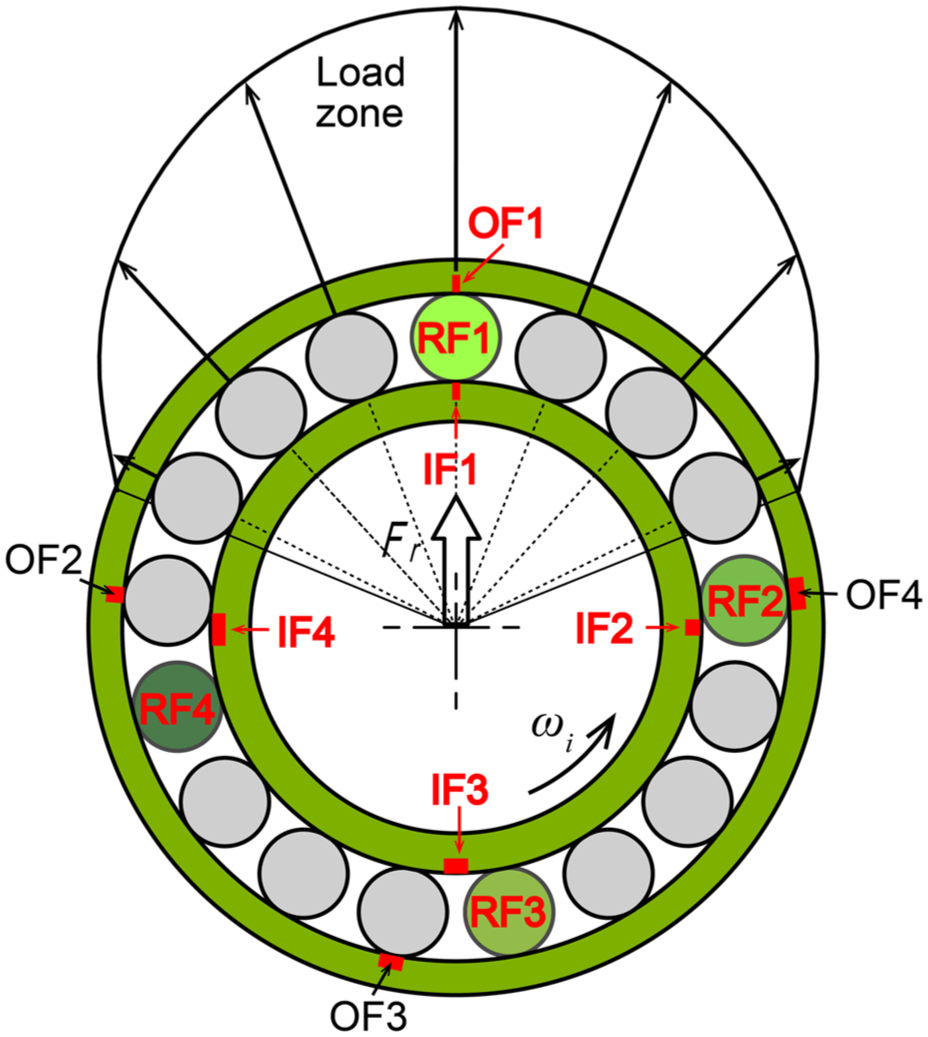
Test case for compound faults.
The experimental parameters replicated real-world high-speed train gearbox conditions, maintaining a constant radial load of 12.0 kN – representative operational loading for SKF NU214ECML bearings per industry specifications. 26 The inner ring underwent counterclockwise rotation, causing rollers to sequentially traverse strain-sensing positions 3R → 2R → 1R → 0 → 1L → 2L → 3L in kinematic synchronization. Three shaft rotation speeds of 312, 624 and 936 rpm were performed. The sampling frequency of the strain signals is 25 kHz during the experiment.
Results and discussions
Strain responses across all sensing positions were systematically recorded in each fault scenario. It should be emphasized that all strain signals presented in this study consist of raw, unprocessed measurements. Owing to the inherently high signal-to-noise ratio of strain from the bearing outer ring, these signals can be used directly for fault diagnosis without requiring filtering, noise reduction, or other preprocessing techniques. Figure 10(a) displays the measured nonzero strain signals from the test bearing with no fault under test conditions of shaft speed 312 rpm. Under the applied radial load of 12 kN, the strain signals from five of seven sensing positions (0, 1L, 1R, 2L, 2R) vary sensitively with the applied load during the loading process and fluctuate obviously during the rotation of the bearing. The number of strain-sensing positions with a significant response was determined by the range of radial load distribution within the bearing. The radial load distribution depends on the applied load and the radial clearance of the bearing, while bearing speed has few effects on this distribution. Accordingly, the strain signals from five of the seven sensing positions (0, 1L, 1R, 2L, 2R) were employed in the diagnosis of faults in all test cases.
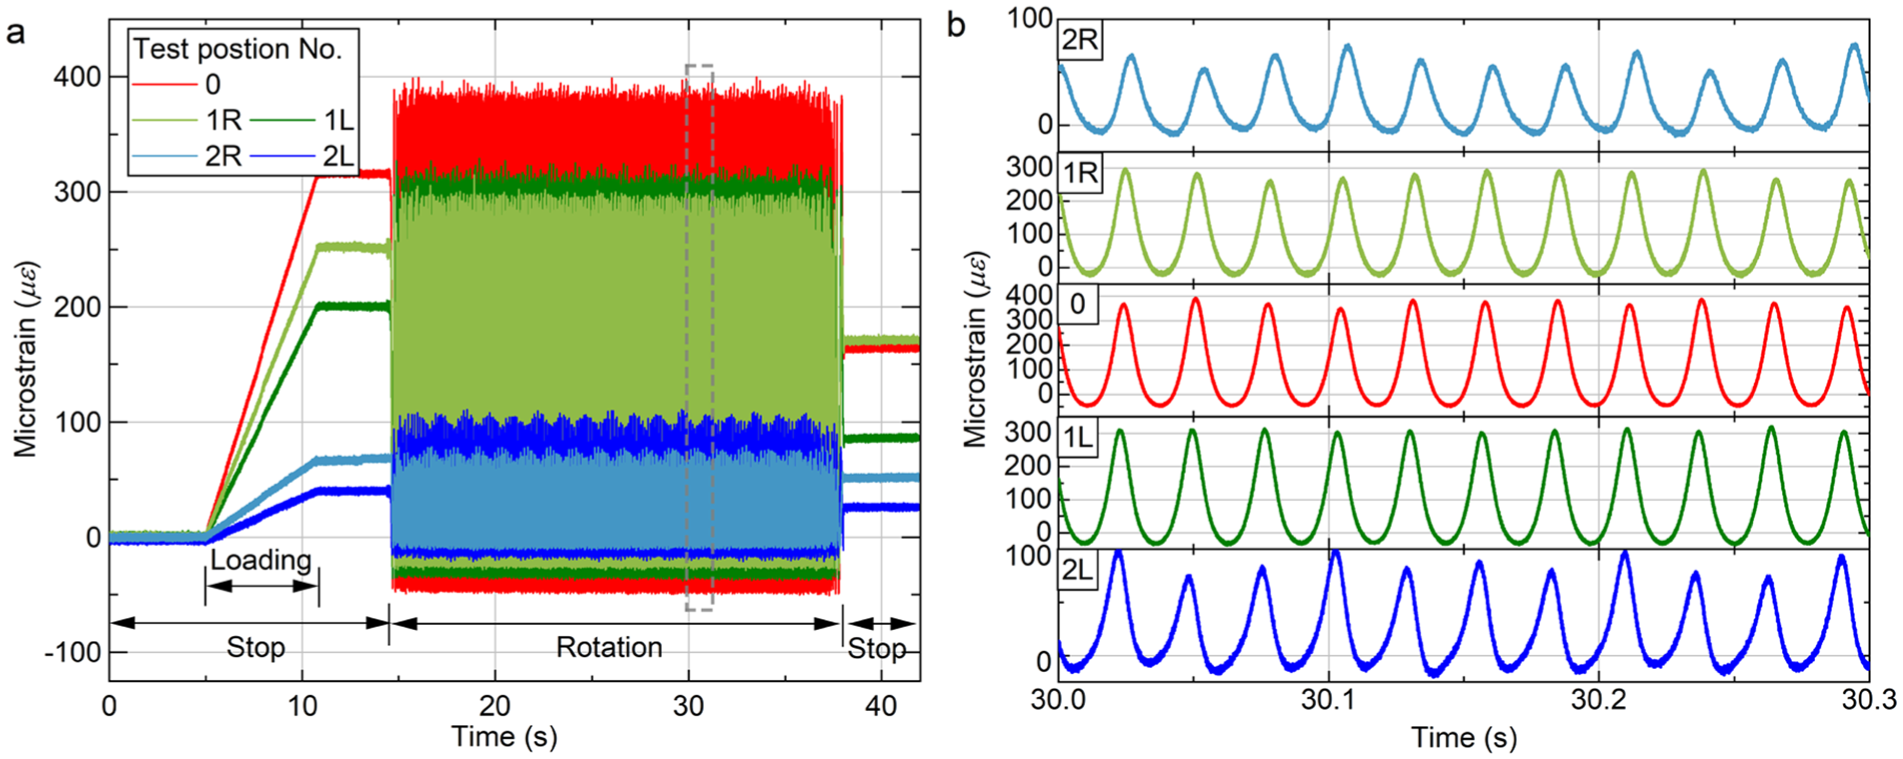
(a) Measured strain signals from the test bearing without fault (shaft speed 312rpm) and (b) magnitude view of the strain signals.
Strain-based diagnosis of bearing fault location
Figure 11(a)–(d), respectively display the strain signals of test cases 1–4, that is, OF1–OF4, under a shaft speed of 312 rpm. The strain signals corresponding to five consecutive cycles of roller passing through the outer ring are intercepted here as examples. It can be observed in Figure 11(a)–(d) that the fault characteristics, strain-drop pulses, manifest exclusively at strain sensing position 0 for successive cycles of roller passing through the outer ring. Additionally, the strain-drop pulse occurs precisely at the strain peak in each strain cycle domain. It can thus be concluded that the fault lies on the outer surface of the bearing, situated directly below the strain-sensing position 0. It is noteworthy that the drop pulse in strain response at sensing position 0 is accompanied by a rising pulse at the other sensing positions, with a comparatively smaller varying amplitude than the drop pulse. These rising pulses in strain signals from sensing positions except position 0 are caused by the redistribution of dynamic loads within the bearing at the moment of OF-roller contact.27,28 Furthermore, as can be seen from Figure 11(a)–(d), wider faults result in a more pronounced redistribution of dynamic loads within the bearing, thereby leading to greater amplitudes in the drop or rising pulses among the strain signals. As illustrated in Figure 11(e), a wider fault also leads to a longer fault passing time Δtfault, which will be used for fault size estimation in section ‘Strain-based estimation of bearing fault width’.
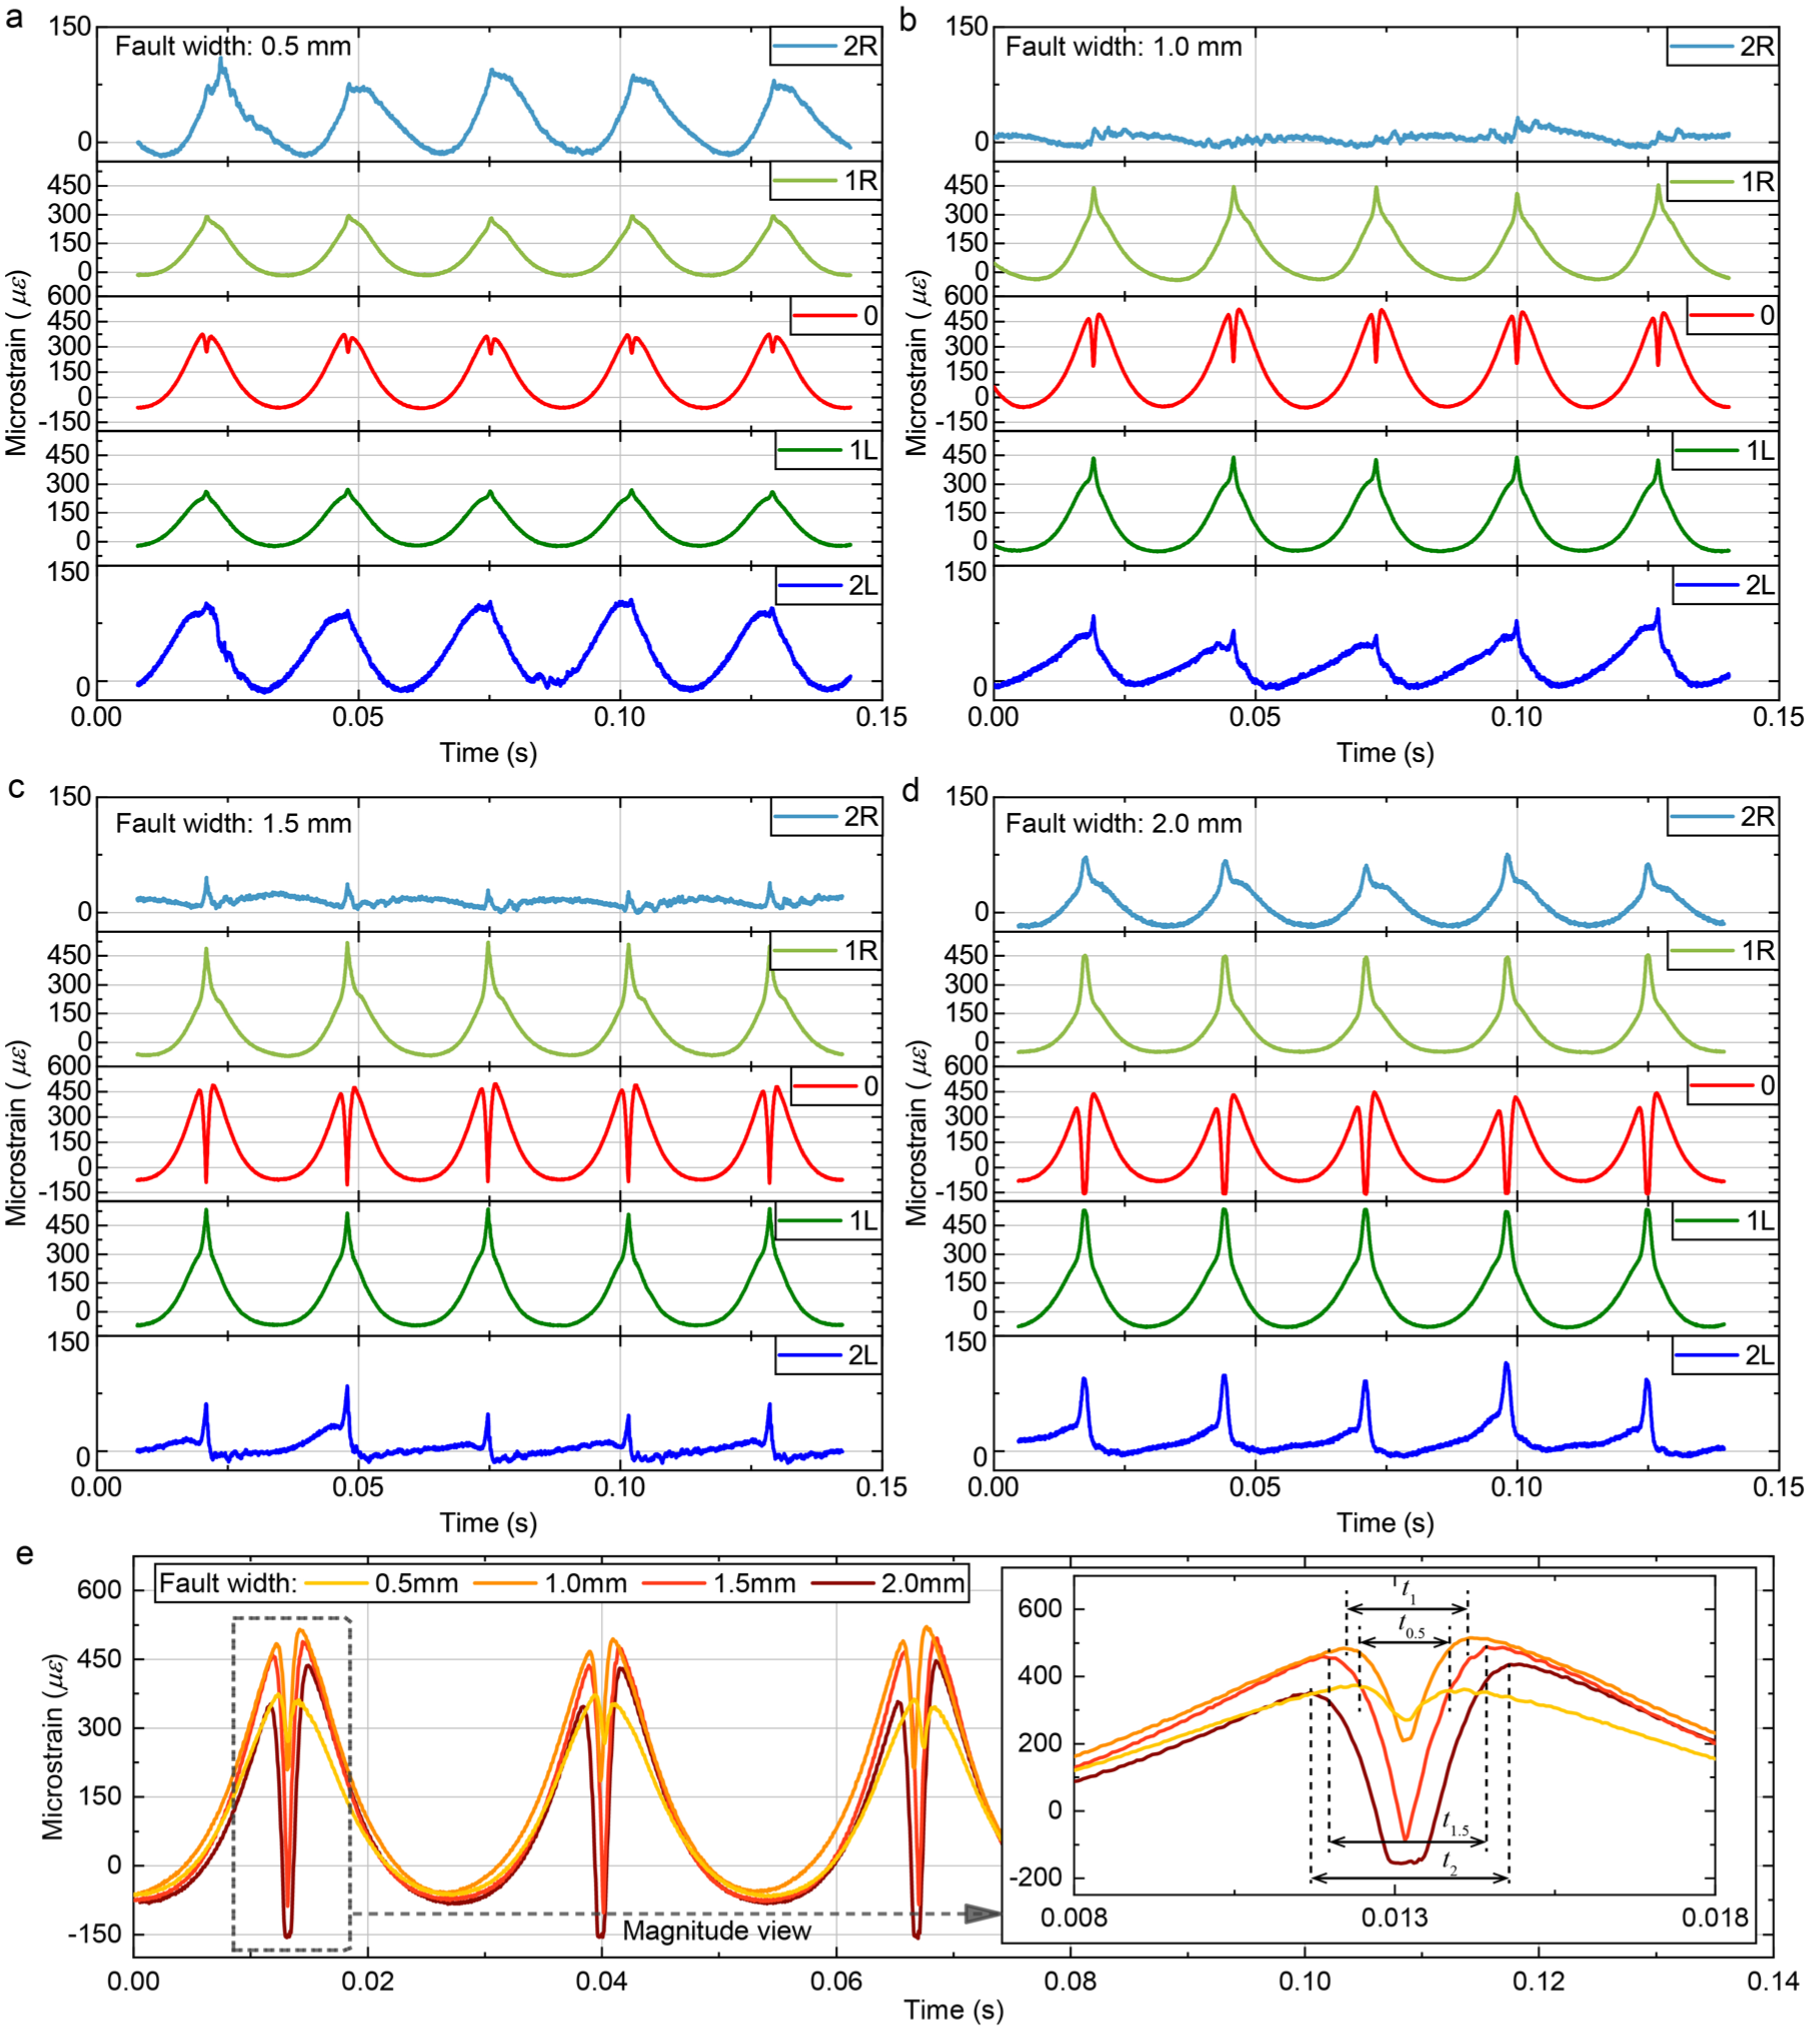
Measured strain signals from the test bearing with a faulty outer ring (shaft speed 312 rpm). (a) Strain signals from bearing with OF1, (b) strain signals from bearing with OF2, (c) strain signals from bearing with OF3, (d) strain signals from bearing with OF4, and (e) variation in strain signals corresponding to roller passing through the outer ring fault.
Figure 12(a) displays strain gauge array responses from test case 5 (IF1–IF4 diagnosis) under pure rolling conditions 29 at 312 rpm rotational speed and 12 kN radial load, with over 17 consecutive strain cycles captured. The period of inner ring rotation is 0.192 s, and the period of roller revolution containing 17 strain cycles is 0.453 s according to the bearing geometry and Equation (6). Due to the counterclockwise rotation of the inner ring and equidistant placement of IF1–IF4 defects, strain-drop pulses sequentially and cyclically propagate through sensing positions. The positive correlation between Δtfault and fault width allows for the precise identification of the fault represented by the strain-drop pulse in Figure 12(a). Consequently, the initial fault to manifest within the load zone in Figure 12(a) is IF 3. Subsequently, IF4 establishes contact with Roller #1 in the vicinity of the sensing position 2R at the instant T1. The motion state of the inner ring and rollers in the bearing at this juncture is illustrated in Figure 12(b). Then, during the subsequent roller passing cycle, the strain-drop pulse, corresponding to IF4, manifested in strain sensing position 0 at the instant T2. The time interval between T1 and T2 is 0.0202 s, which is smaller than the roller passing period of 0.0266 s. In consideration of the disparate velocity between the roller revolution and the inner ring rotation, it is evident that, at the instant T2, IF4 is in contact with Roller #17 in lieu of Roller #1. Furthermore, the instantaneous position of IF4 at the instant T2 can be ascertained as shown in Figure 12(c) by determining the relative time between the strain-drop pulse and the strain peak. The subsequent occurrence of the strain-drop pulse representing IF4 is evident in the strain signal 2L at the instant T3. At this juncture, IF4 is in contact with the Roller #16 and is situated approximately midway between the sensing positions 1L and 2L, exhibiting a slight bias towards the sensing position 2L. Similarly, as illustrated in Figure 12(a), the strain-drop pulse representing IF2 initially manifests in strain signal 1R at the instant T4, followed by position 1L at the instant T5 during the subsequent roller passing cycle. It is feasible to ascertain the instantaneous positions of the inner ring and rollers at the instants T4 and T5, as illustrated in Figure 12(e) and (f), respectively.
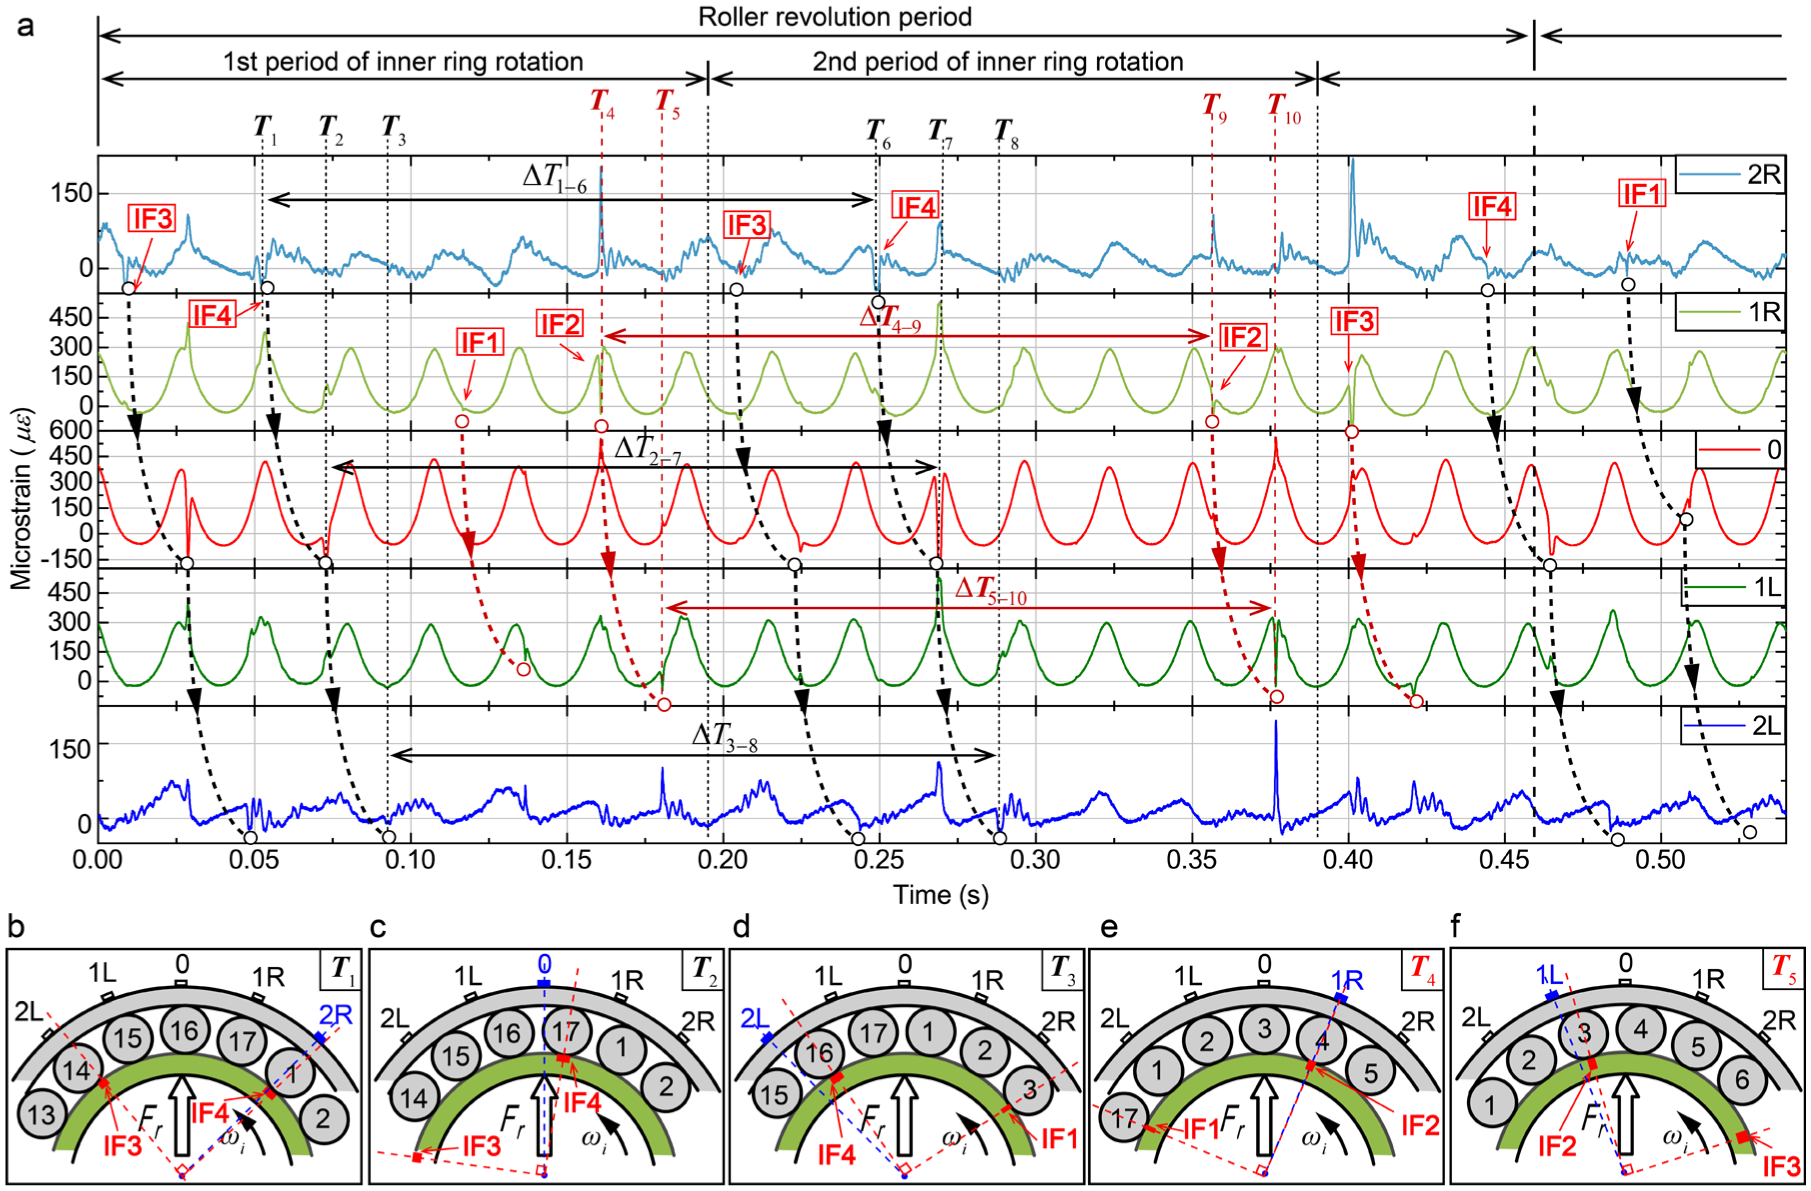
(a) Measured strain signals from the test bearing with a faulty inner ring (shaft speed 312 rpm), and (b–f) motion states of the faulty inner ring at different fault passing moments.
As for the roller fault cases 6–9, that is, cases of RF1–RF4, the strain signals corresponding to five consecutive cycles of roller passing under a shaft speed of 312 rpm are intercepted in Figure 13(a)–(d). It can be observed that at a constant rotational speed, the strain-drop pulses indicative of RF manifest in a sequential manner at each sensing position over the course of several consecutive roller passing cycles. In this test bearing, according to Table 1 and Equation (7), the relationship between the rotation and revolution of the roller is n r ≈ 7.57 n re . It is indicated that the roller rotation of π is slower than the roller revolution of 2π/17. Thus, it can be observed in Figure 13(a)–(d) that the time interval between successive strain-drop pulses is longer than a roller passing period. By utilizing the time differential between the strain-drop pulse and the strain peak within a roller passing cycle, the instantaneous location of the faulty roller revolution and the roller fault rotation can be accurately determined. Furthermore, as illustrated in Figure 13(e), the fault passing time Δtfault shows a positive relationship with the width of the roller fault.
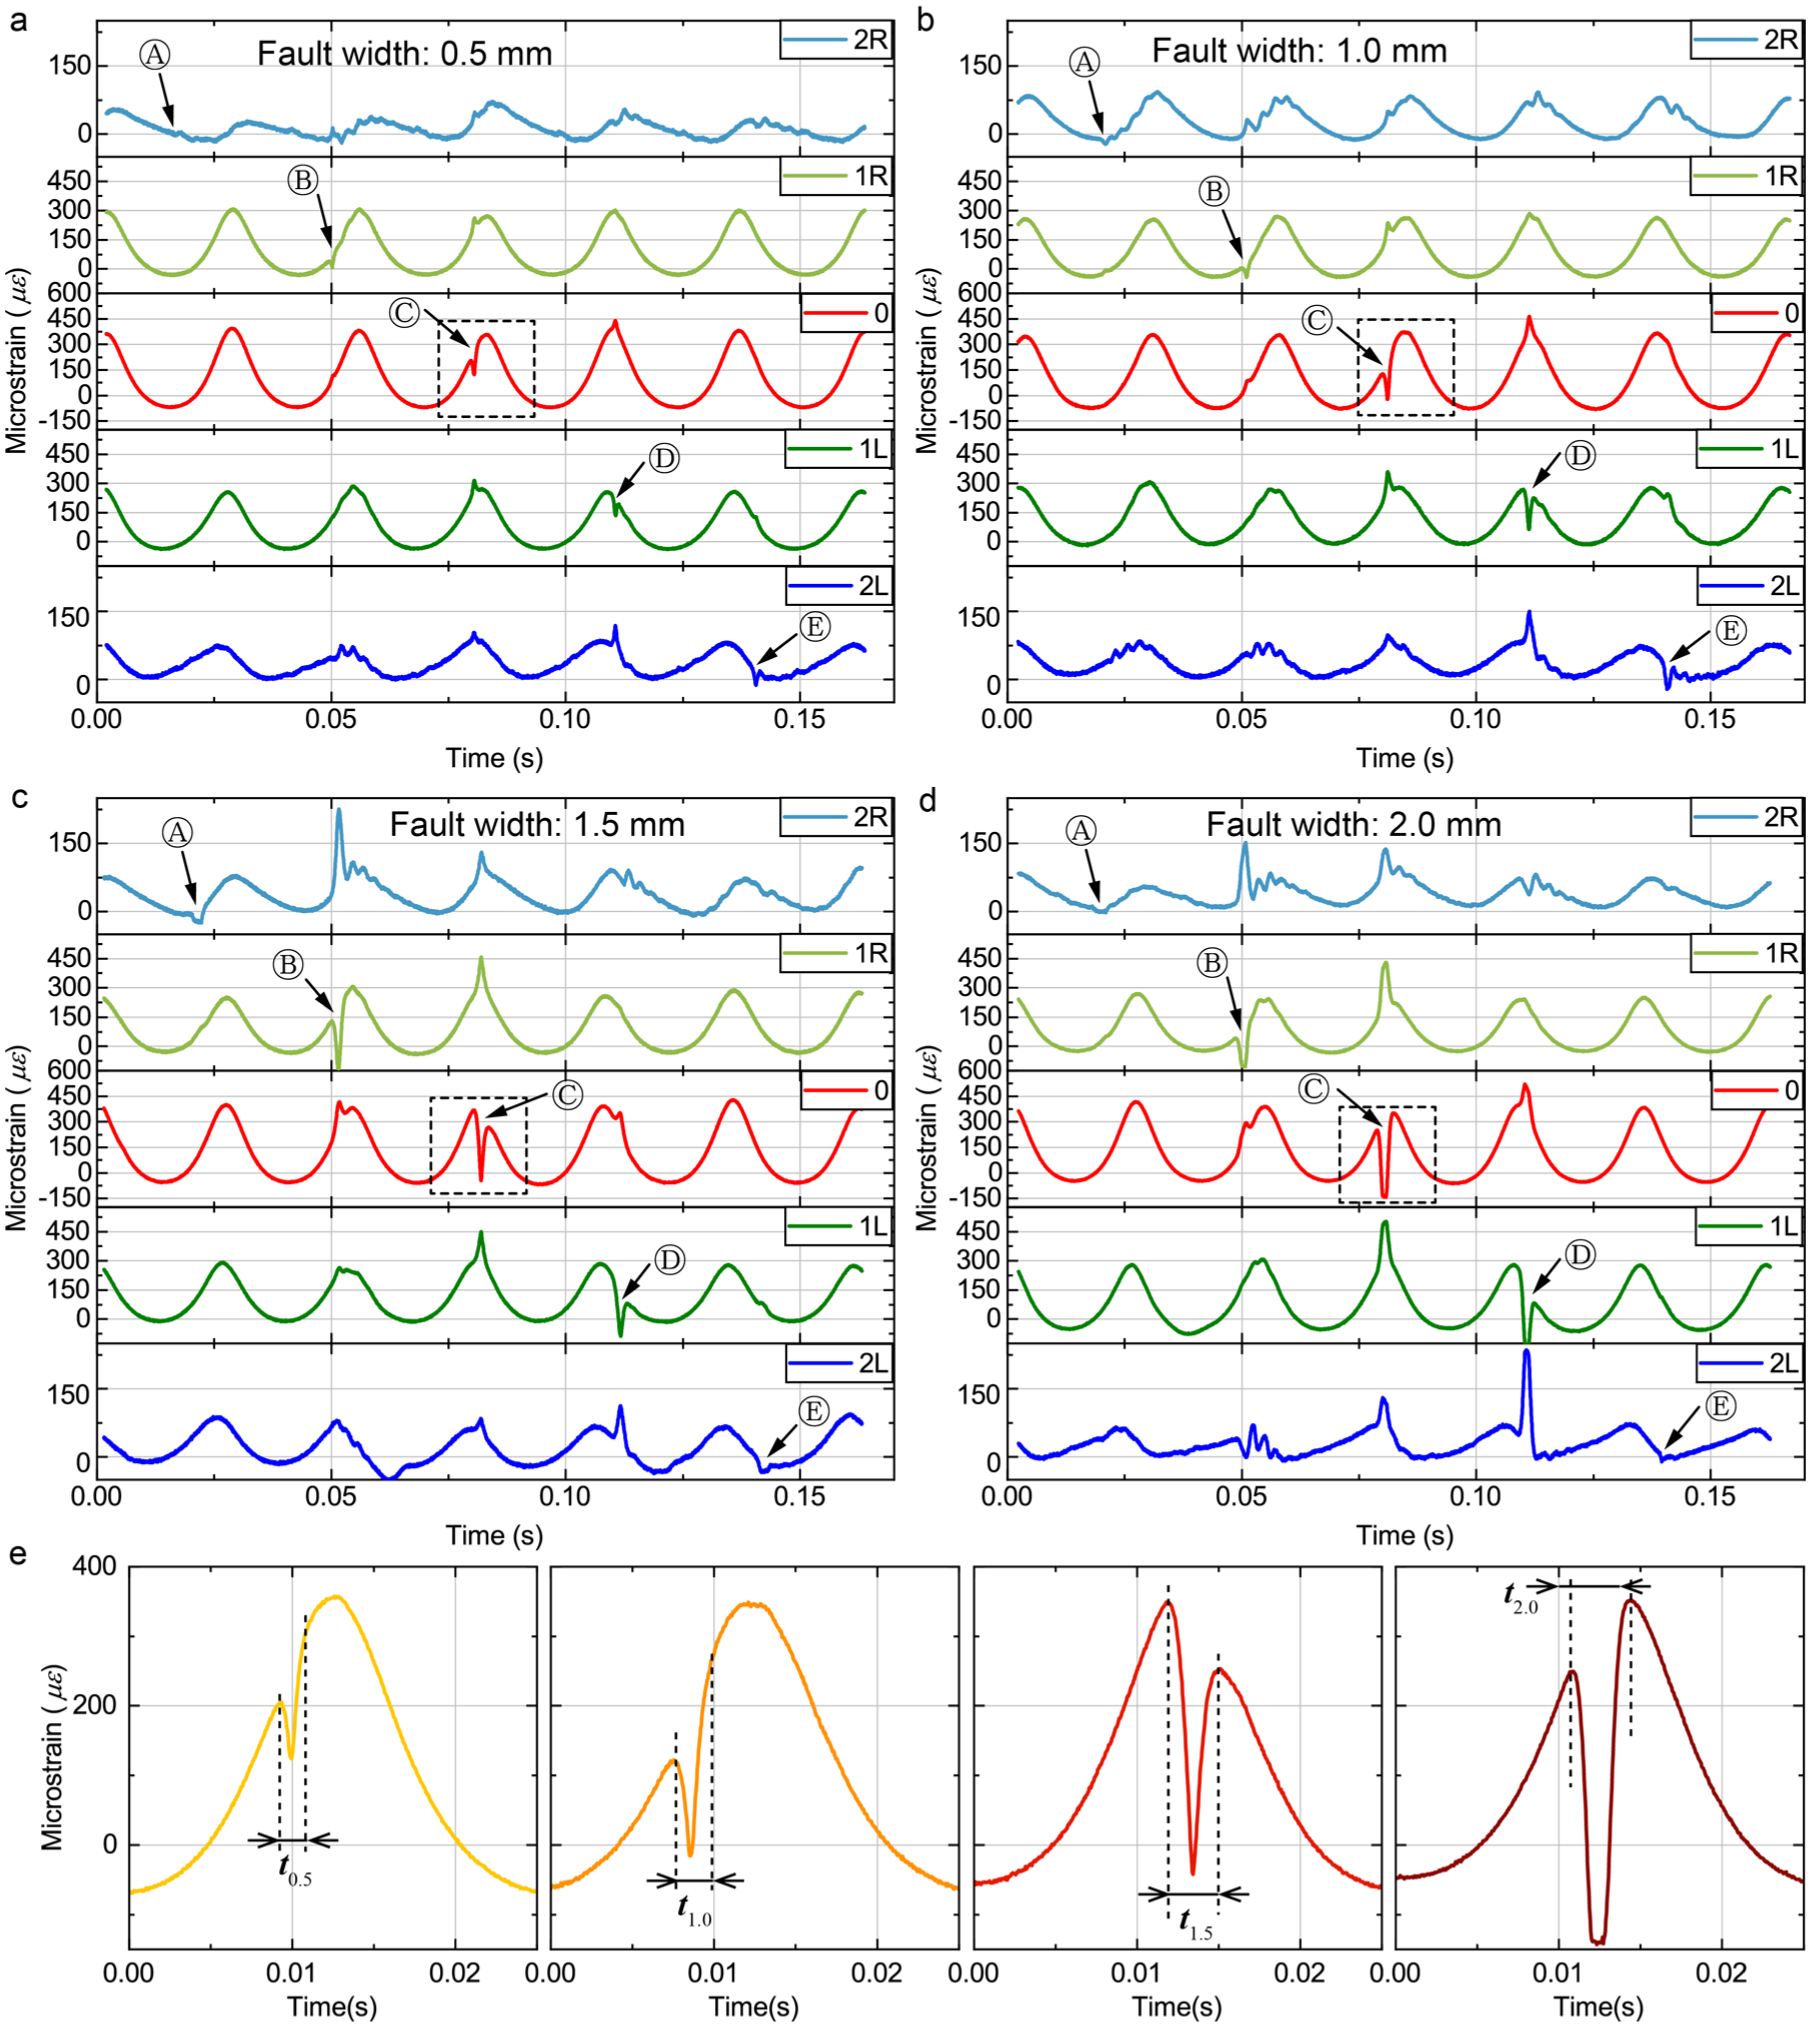
Measured strain signals from the test bearing with faulty rollers (shaft speed 312 rpm). (a) Strain signals from bearing with RF1, (b) strain signals from bearing with RF2, (c) strain signals from bearing with RF3, (d) strain signals from bearing with RF4, and (e) variation in strain signals corresponding to a faulty roller passing through the strain sensing position.
The test results of the aforementioned single class of faults serve to corroborate the veracity of the fault localization diagnostic principle outlined in section ‘Strain based measurement principle for detecting bearing fault location and size’. A diagnosis of fault decoupling in the test bearing with compound faults can be achieved by utilizing the three distinct patterns observed in strain-drop pulses across several adjacent roller passing cycles.
Figure 14(a) presents strain signals from the compound-fault bearing at 312 rpm, capturing more than 17 consecutive roller-pass cycles as examples. Analysis of sensing position 0 reveals persistent strain-drop pulses (red squares) with near-constant amplitude and phase-synchronized with strain peaks, confirming OF1 localization beneath sensing position 0. Concurrently, inner raceway faults (IF1–IF4) are identified through three diagnostic markers: (1) IF1, IF2, IF3 and IF4 roll through the bearing load zone counterclockwise, sequentially and cyclically, (2) the strain-drop pulses corresponding to the inner ring faults appear one sensing position apart, and (3) the time interval between two adjacent strain drop pulses of an IF is less than the roller-pass period. Consequently, the four inner ring faults are respectively identified and marked by green circles in Figure 14(a), with their movement highlighted by green dotted arrows. Similarly, roller faults (RF1–RF4) are diagnosed via three characteristics: (1) RF1–RF4 migrate counterclockwise through the load zone sequentially and cyclically, (2) strain-drop pulses appear sequentially across two sensing positions, and (3) the time interval between adjacent pulses exceeds the roller-pass period. The four roller faults are respectively identified and marked by blue triangles in Figure 14(a), with blue dotted arrows indicating their trajectory.
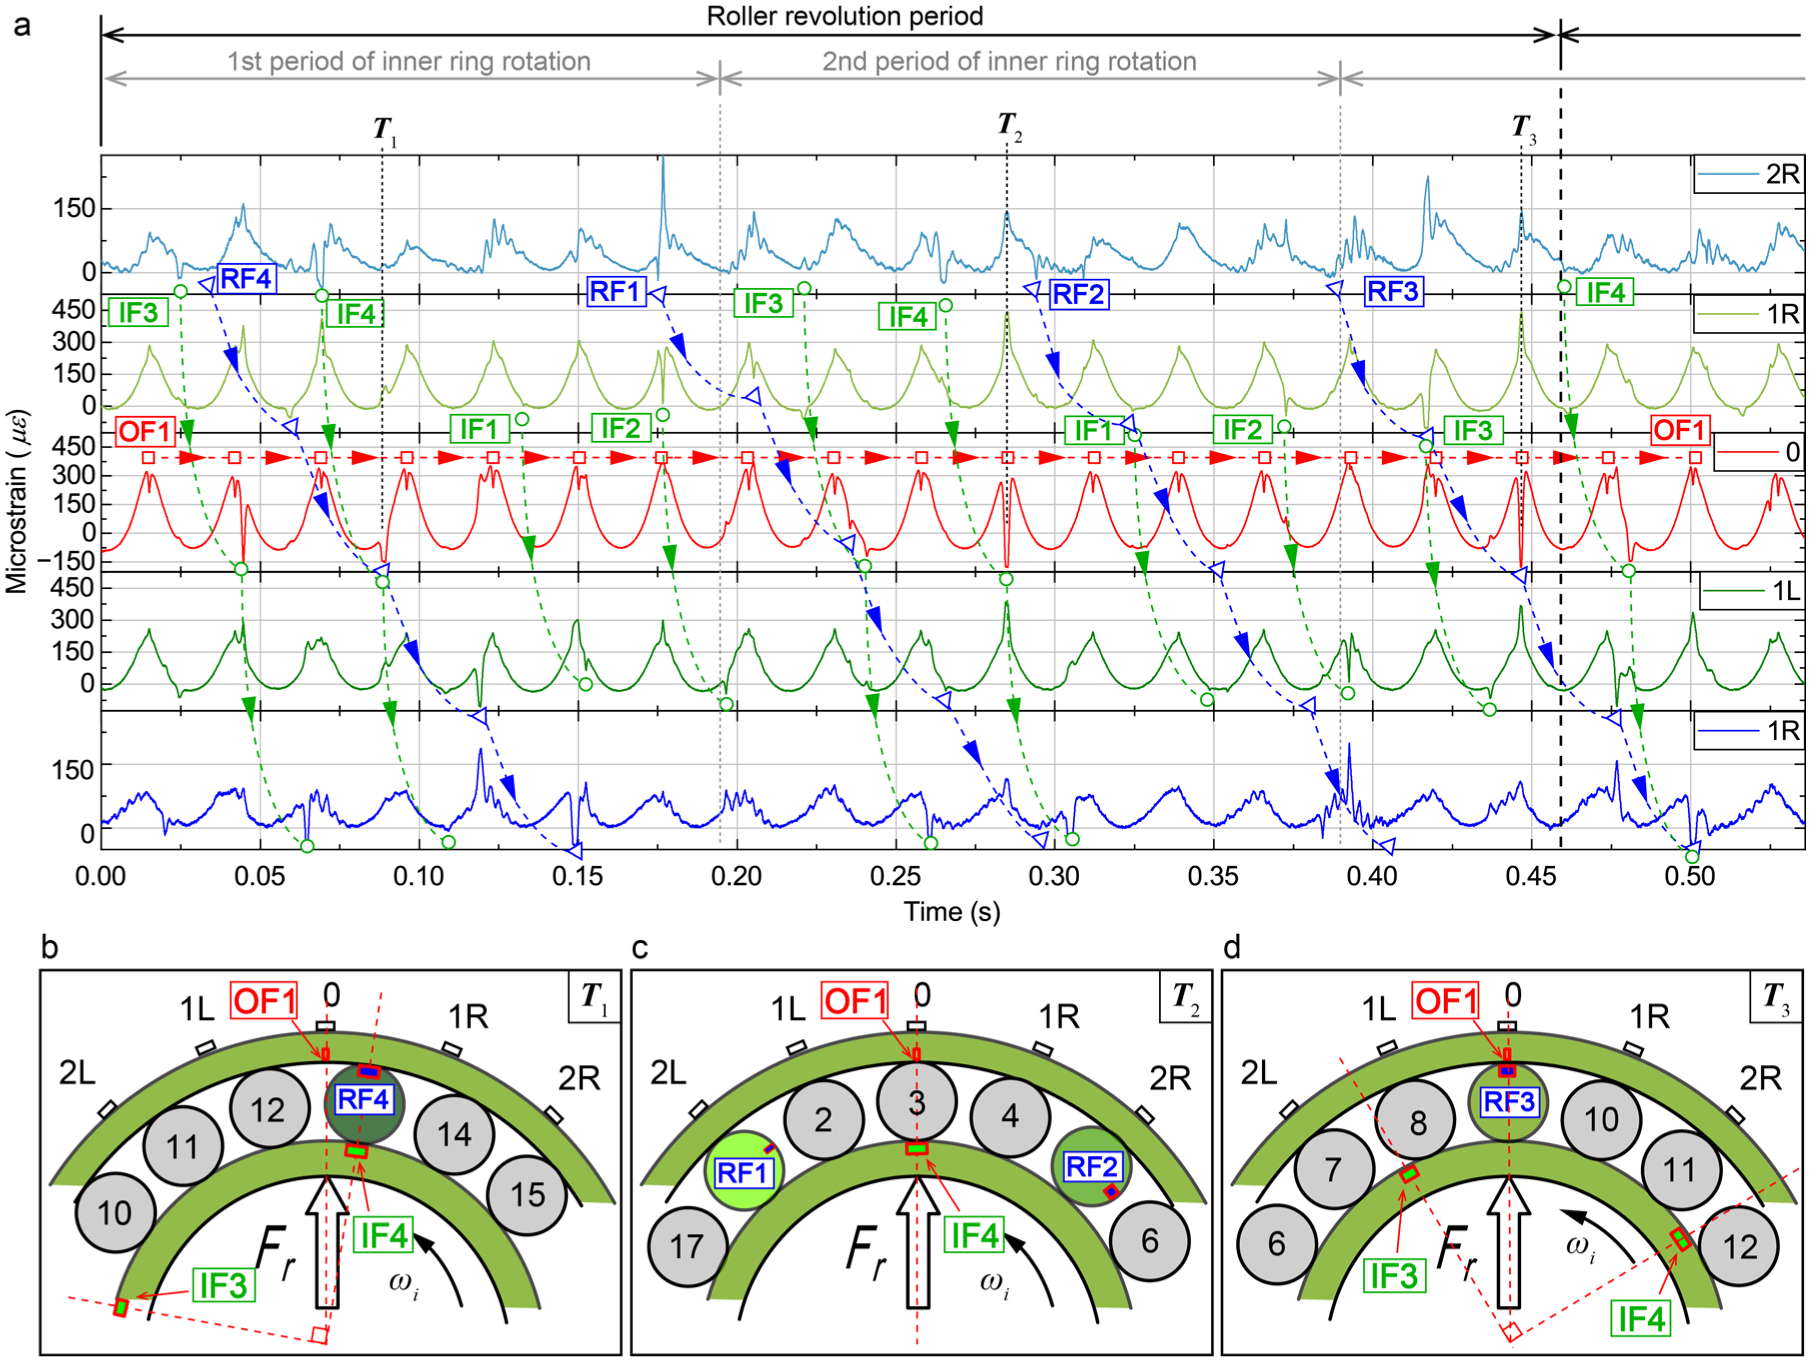
(a) Measured strain signals from the test bearing with compound faults (shaft speed 312 rpm) and fault decoupling identification results, (b) instantaneous locations of compound faults in the test bearing at time T1, (c) instantaneous locations of compound faults in the test bearing at time T2, and (d) instantaneous locations of compound faults in the test bearing at time T3.
Notably, compound fault scenarios may involve concurrent defect interactions across multiple bearing components, resulting in overlapping fault signals as demonstrated at the moment T1, T2 and T3 in Figure 14(a). The separation of overlapping fault signals follows as a logical outcome after the successful decoupling identification of the bearing component fault type and location. Taking the identification near time T1 as an example, strain-drop pulses ①②③④ exhibit the following characteristics: (1) they sequentially appear at adjacent strain sensing positions over five consecutive roller passing periods; (2) the time interval between consecutive strain-drop pulses is consistent and slightly exceeds the roller passing period. These characteristics conform to the temporal and spatial patterns of pure roller fault-induced strain-drop pulses demonstrated in Figure 13, indicating that strain-drop pulses ①②③④ originate from a single faulty roller. Conversely, strain-drop pulses ⑤,② and ⑥ demonstrate: (1) sequential appearance at sensing position 2R, 0, and 2L over three adjacent roller passing periods, exhibiting an alternating spatial pattern; (2) a consistent time interval between consecutive strain-drop pulses shorter than the roller passing period. These behaviours align with the characteristics of a pure inner ring fault shown in Figure 12, signifying that strain-drop pulses ⑤,② and ⑥ stem from a single inner ring fault. Following the decoupled identification of one roller fault and one inner ring fault, strain-drop pulse ② is observed in both identification processes. It is indicated that the strain-drop pulse ② at time T1 corresponds to the simultaneous occurrence of the roller fault RF4 and the inner ring fault IF4 at the same azimuthal position along an identical radial line. Kinematic analysis shown in Figure 14(b) reveals simultaneous contacts: IF4 engages the defective roller while RF4 interacts with the outer raceway, both approximately localized midway between the sensing positions 1R and 0, exhibiting a slight bias towards the sensing position 0. Similarly, according to the decoupling identification process of IF4 and OF1 around the moment T2, the strain-drop pulse ⑧ represents the overlap of IF4 and OF1 at the sensing position 0 at the moment T2 in Figure 14(a). Instantaneous position of the inner ring and rollers of the test bearing at the moment T2 can be recognized as shown in Figure 14(c). Besides, it can be determined that at the moment T3, the roller fault RF3 and the outer ring fault OF1 are in contact at the sensing position 0 as illustrated in Figure 14(d). These results highlight the methodology’s capacity to decouple and locate the compound faults in bearings.
Strain-based estimation of bearing fault width
To evaluate the width of spall-like faults in rolling bearings using measured strain signals, the fault passing time Δtfault must first be determined from strain-drop pulses. For strain signals where the drop pulse coincides with the strain peak, single-sensor derivative analysis suffices to calculate Δtfault. As shown in Figure 15 for the OF1 case at sensing position 0, the derivative of the strain signal in Figure 15(b) exhibits zero-crossings at the start and end of the pulse decline, with Δtfault defined as the interval between these crossings. When strain-drop pulses occur during strain rise/fall phases, Δtfault is determined by analyzing derivatives from adjacent sensors. Figure 16 demonstrates this using signals from sensing positions 0 and 1R: the initial zero-crossing of the drop pulse derivative at sensing position 0 marks fault entry time tin, while the subsequent zero-crossing of the rise pulse derivative at sensing position 1R indicates fault exit tout. Thus, Δtfault = tout − tin captures the full defect transit duration.
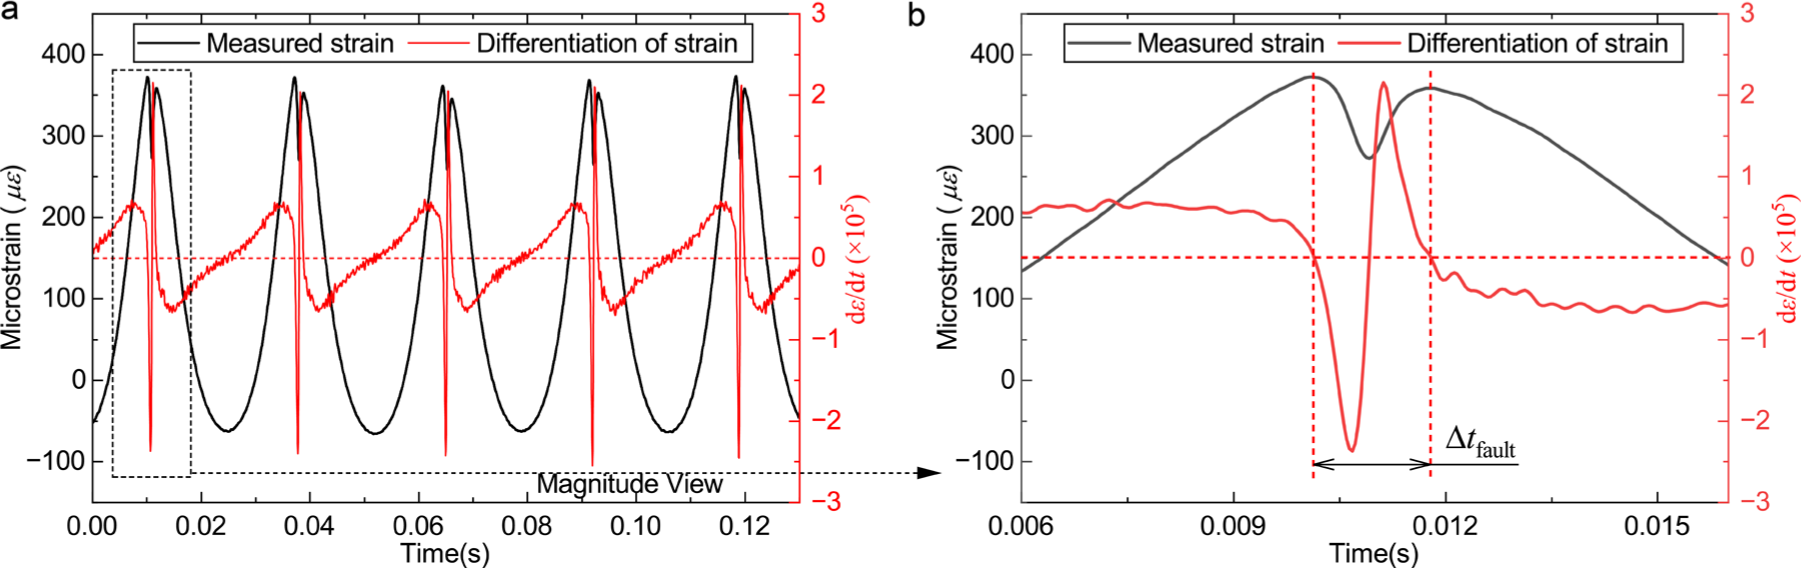
Determination of the fault passing time while the fault signature appears at the peak position of strain signals, (a) measured strain and its differentiation, (b) magnitude view.
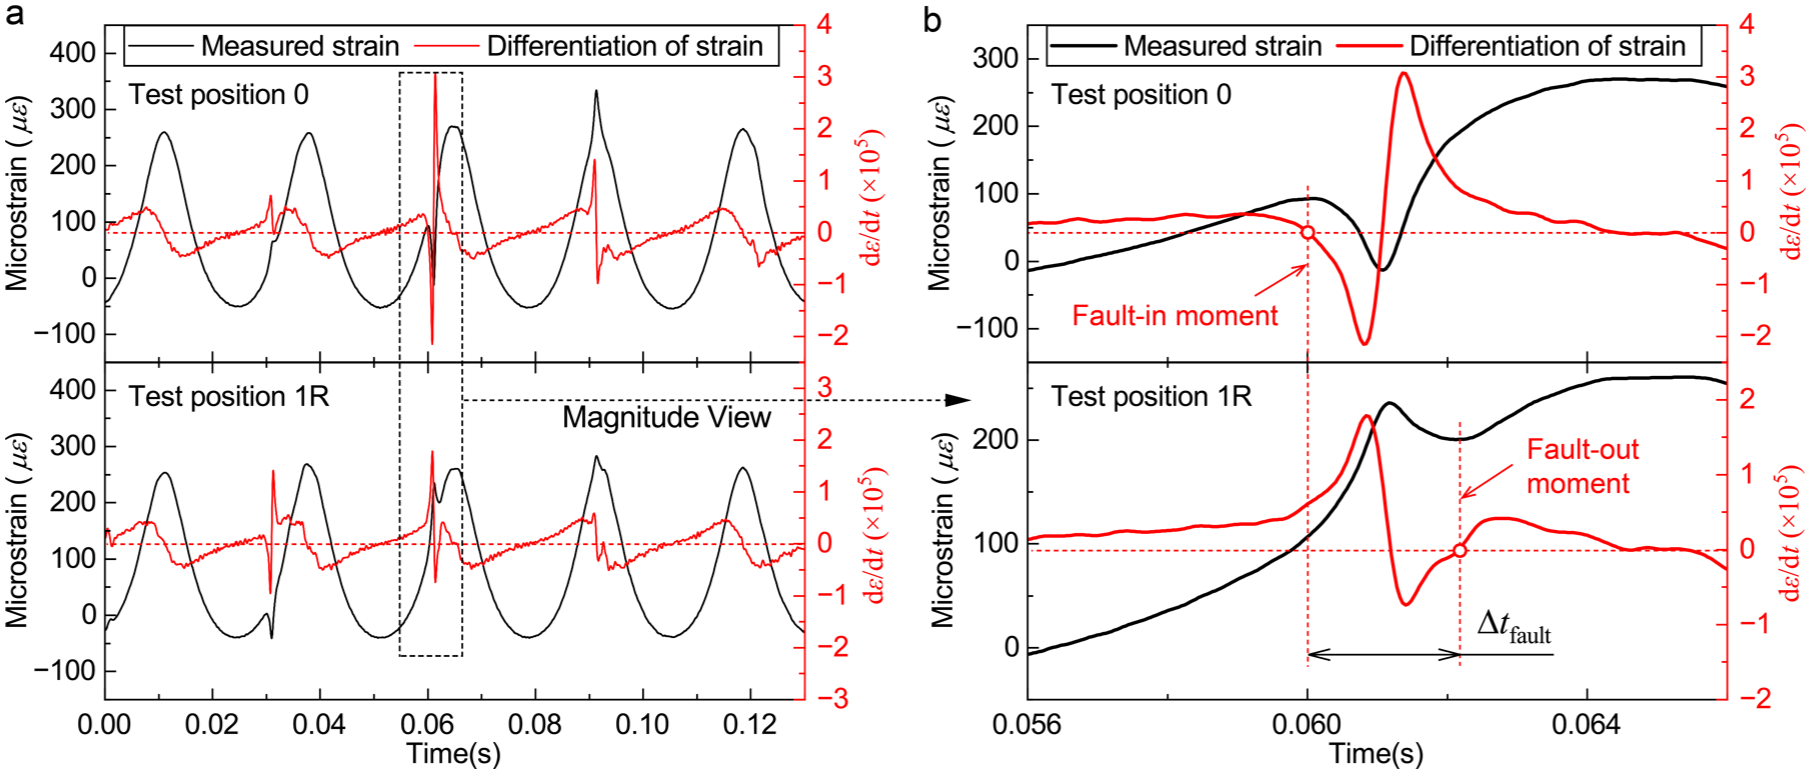
Determination of the fault passing time while the fault signature appears during the rising or falling phase of strain signals, (a) measured strain and its differentiation, (b) magnitude view.
Once the Δtfault of the strain-drop pulse is determined, the width of the spall-like fault can be evaluated using the relative velocity between rollers and raceways according to Equations (1)–(3). In this experiment, vro = 784.5 and vri = 577.1 mm/s under a shaft speed of 312 rpm were calculated for the test bearing using Equations (4) and (5) and bearing geometry. Figure 17 illustrates fault width evaluation results under test conditions with a fixed external load and varying shaft speeds. For each test case and speed condition, Δtfault was extracted from 100 strain-drop pulses and converted to estimated fault widths. In Figure 17, data points and error bounds represent the mean values and minimum-to-maximum ranges of the estimated fault widths, respectively, while curves to the right of the points depict distribution trends across the 100 data points.
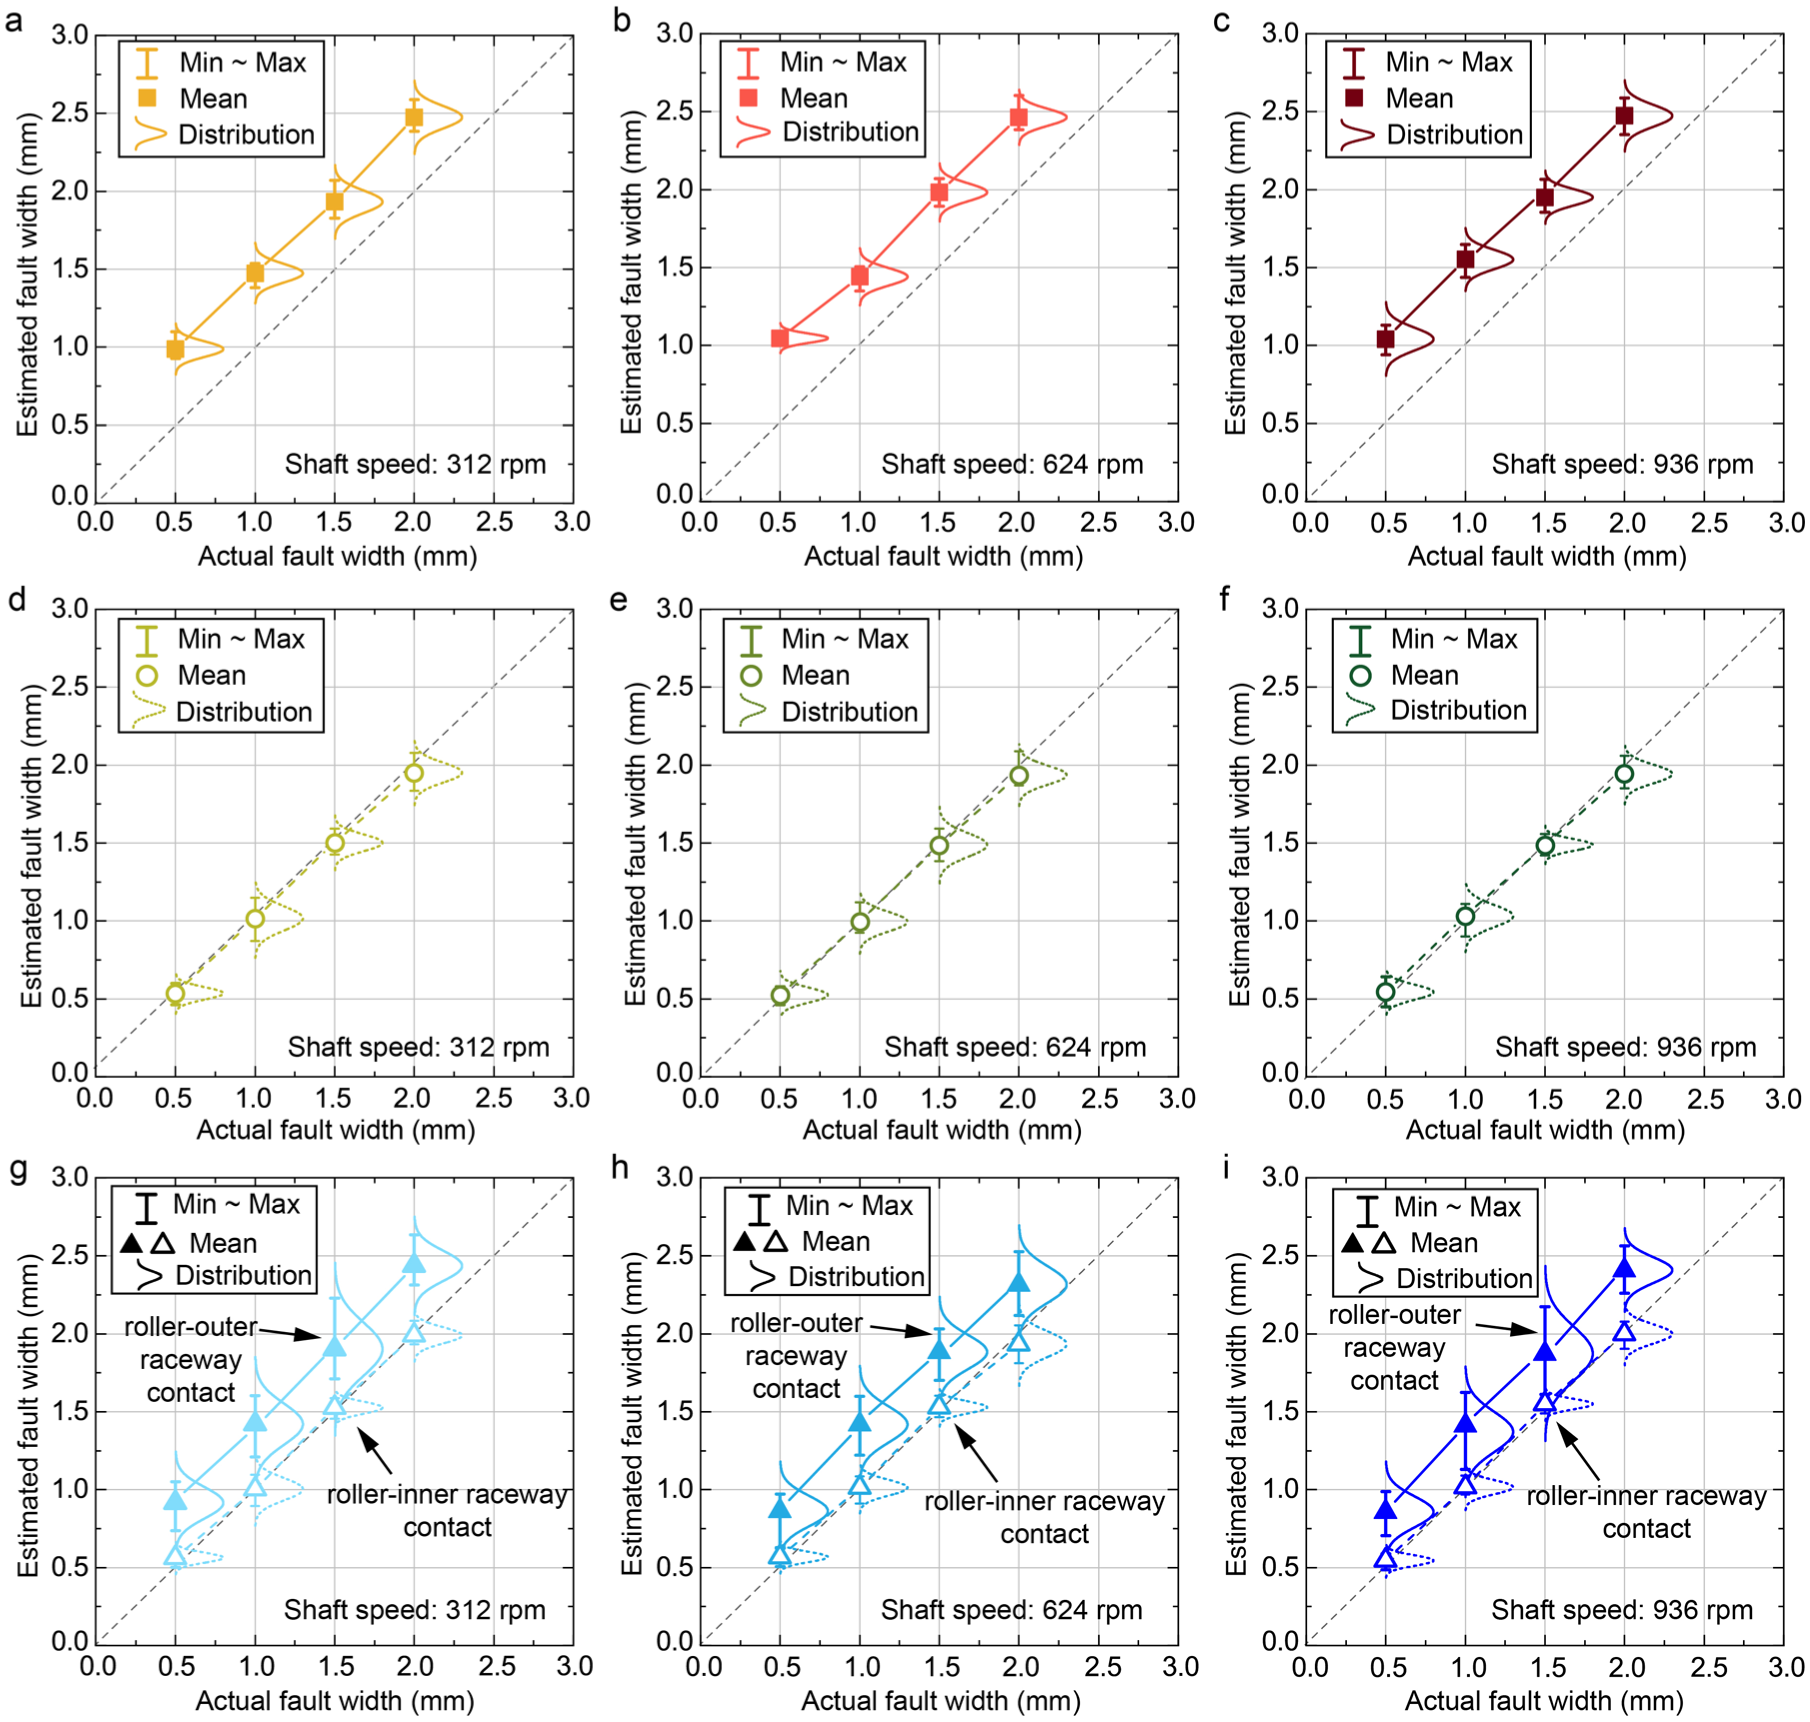
Fault size estimation results based on the product of the fault passing time and the relative velocity of the roller-raceway, (a)-(c) OFs under shaft speed 312 rpm, 624 rpm and 936 rpm respectively, (b)-(f) IFs under shaft speed 312 rpm, 624 rpm and 936 rpm respectively, (g)-(i) RFs under shaft speed 312 rpm, 624 rpm and 936 rpm respectively.
As shown in Figure 17, the evaluation performance of the method – which calculates fault width as the product of Δtfault and interfacial relative velocity – varies depending on fault type. For OFs shown in Figure 17(a)–(c), the mean estimated fault widths exceed actual widths by approximately 0.5 mm. Conversely, estimation of inner raceway faults shown in Figure 17(d)–(f) exhibits high accuracy, with mean estimated widths closely matching actual dimensions. Interestingly, these two kinds of evaluation performance co-exist with the cases of RFs displayed in Figure 17(g)–(i). The mean values of the evaluated widths of RFs occurring in the roller-outer raceway contact are approximately 0.3–0.4 mm greater than the actual RF widths, while the mean values of the evaluated widths of RFs occurring in the roller-inner raceway contact are almost identical to the actual RF widths. Overall, the method demonstrates high accuracy for spall-type faults at roller-inner raceway interfaces. However, for roller-outer raceway faults, Equations (1) and (3) systematically overestimate widths, necessitating empirical correction factors to improve precision.
Alian et al. 15 first employed fibre-optic sensors to collect strain signals from the housing of a faulty bearing. The evaluation method of spalling fault width, which posits that the width of the OF and IF is equal to the product of the fault passing time extracted from the strain signals and the relative velocity between the roller and raceways, was validated in their experiment. However, in Alian’s experiment, no external load was applied on the test bearing, which plays a crucial role in the strain response features of the bearing or its housing. In this work, the external radial load applied on the test bearing was 12 kN. Thus, it can be reasonably deduced that the load is a factor that should be taken into account when undertaking a quantitative failure assessment based on the bearing strain response. Moreover, the following evidence from the theory of bearing radial load distribution and Figure 17 strongly suggest that the width evaluation result of faults occurring in the roller-outer raceway contact is related to the magnitude of the roller-raceway contact load:
As shown in Figure 1(a), the radial load distribution within a roller bearing is circumferentially uneven. The distributed load on a fixed position on the outer ring remains essentially unchanged as every roller rolls through this position, while the distributed load on a specific roller is in a state of constant change during the roller’s revolution. It is indicated that the mean value of the contact load applied on a roller is smaller than that applied on the top position on the outer raceway.
For each fault size, the mean value of the evaluated RF width from the roller-outer ring contact pair is observed to be less than that of the evaluated OF width, which is similar to the difference in the mean values of contact load on one roller and the top position of the outer raceway.
For each fault size, the distribution of the evaluated RF width from the roller-outer ring contact pair is more discrete than that of the evaluated OF width, which is consistent with the difference in load distribution within the load zone between one roller and the top position of the outer raceway.
In order to correct the strain-based evaluation method, it is necessary to establish the relationship between the evaluated fault width and the roller-raceway contact load. This relationship can be built by considering the semi-width b of the roller-raceway contact surface as a bridge. For steel roller bearings, the semi-width b (unit: mm) of the roller-raceway contact surface may be approximated by Harris and Kotzalas. 23
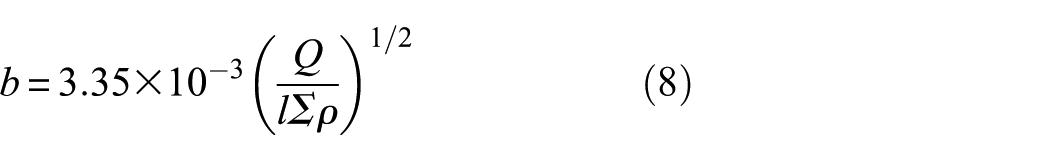
where Q is the roller-raceway contact load (unit: N). l is the roller effective length (unit: mm) and is equal to 14 mm for the test bearing. ∑ρ is the curvature sum of the contact pair (unit: mm−1) and is equal to 0.116 mm−1 for the roller-outer raceway contact. In the test bearing, Q is contingent on the radial load distribution within the bearing, as well as the azimuth of the faulty roller-raceway contact pair. The dynamic radial load distribution of all the test cases can be obtained from the measured strain signals based on Hou’s measurement method for the inversion of roller-raceway contact load. 20 The time histories of the measured dynamic roller-raceway contact load of the test bearing with no fault are given in Figure 18(a) as an example. Accordingly, the radial load distribution within the bearing is determined and shown in Figure 18(b). The points and bounds in Figure 18(b) represent, respectively, the mean value and minimum to maximum range of dynamic roller–raceway contact loads shown in Figure 18(a). Besides, the load distribution curve in Figure 18(b) is fitted based on the points according to the Harris theory of bearing radial load distribution. 23 Under this specified condition, the contact load distributed on the outer raceway position 0 fluctuates around 4300 N. Meanwhile, the contact load exerted on a single roller during the bearing rotation depends on the roller’s orientation, with a range between 0 N and about 4300 N. Consequently, according to Equation (8), the semi-width b of the roller-raceway contact surface has a range of 0–0.173 mm within the test bearing.
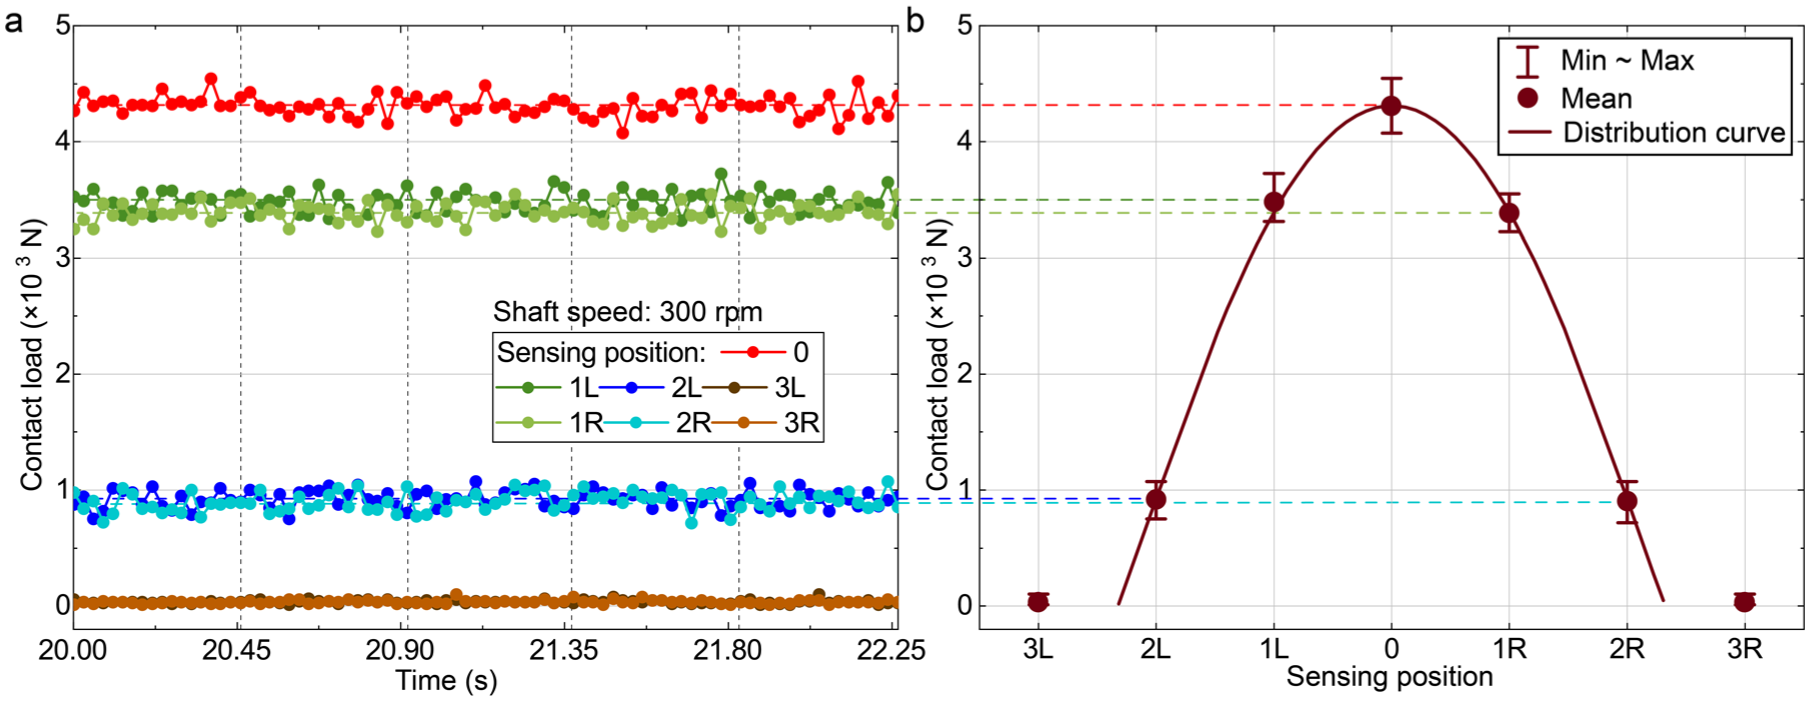
(a) Measured dynamic roller-raceway contact load and (b) radial load distribution of the test bearing with no fault under a shaft speed of 300 rpm.
In the event of a spall-like fault occurring at the contact between the roller and the outer ring, by comparing the product Δtfault·vro, the instantaneous contact semi-width b, and the real width of the prefabricated fault, it is found that the width of faults occurring in the roller-outer raceway contact wfault,ro can be estimated as follows.

When the fault is in the roller-outer raceway contact, the corrected estimates of the OF and RF widths from three shaft speed conditions are obtained by using Equation (9) and concluded in Figure 19(a) and (b), respectively. It can be seen that after eliminating the effects of contact semi-width due to contact loads, the mean values of the estimated fault width agree well with the real widths of the prefabricated faults. During the width estimation of fault on the outer ring at the contact interface, the fault is consistently situated at the fixed position of maximum distributed load. At this position, the dynamic fluctuation range of the contact load is substantially smaller than its mean value, as suggested in Figure 18(b). Consequently, the distributions of corrected and uncorrected fault width estimations show statistically negligible differences, while the mean value of the corrected fault width estimation is consistently smaller than the uncorrected mean, as evidenced by the comparison between Figures 19(a) and 17(a)–(c). As for fault width estimation on rollers, the roller fault contacts the outer raceway at varying azimuthal positions. The bearing radial clearance causes the roller-raceway contact load to cyclically vary between zero and the maximum distributed load about 4300 N across different azimuths. Consequently, both the distribution and mean value of corrected fault width exhibit significant reduction compared to uncorrected estimations, as clearly demonstrated by the comparison between Figures 19(b) and 17(g)–(i).
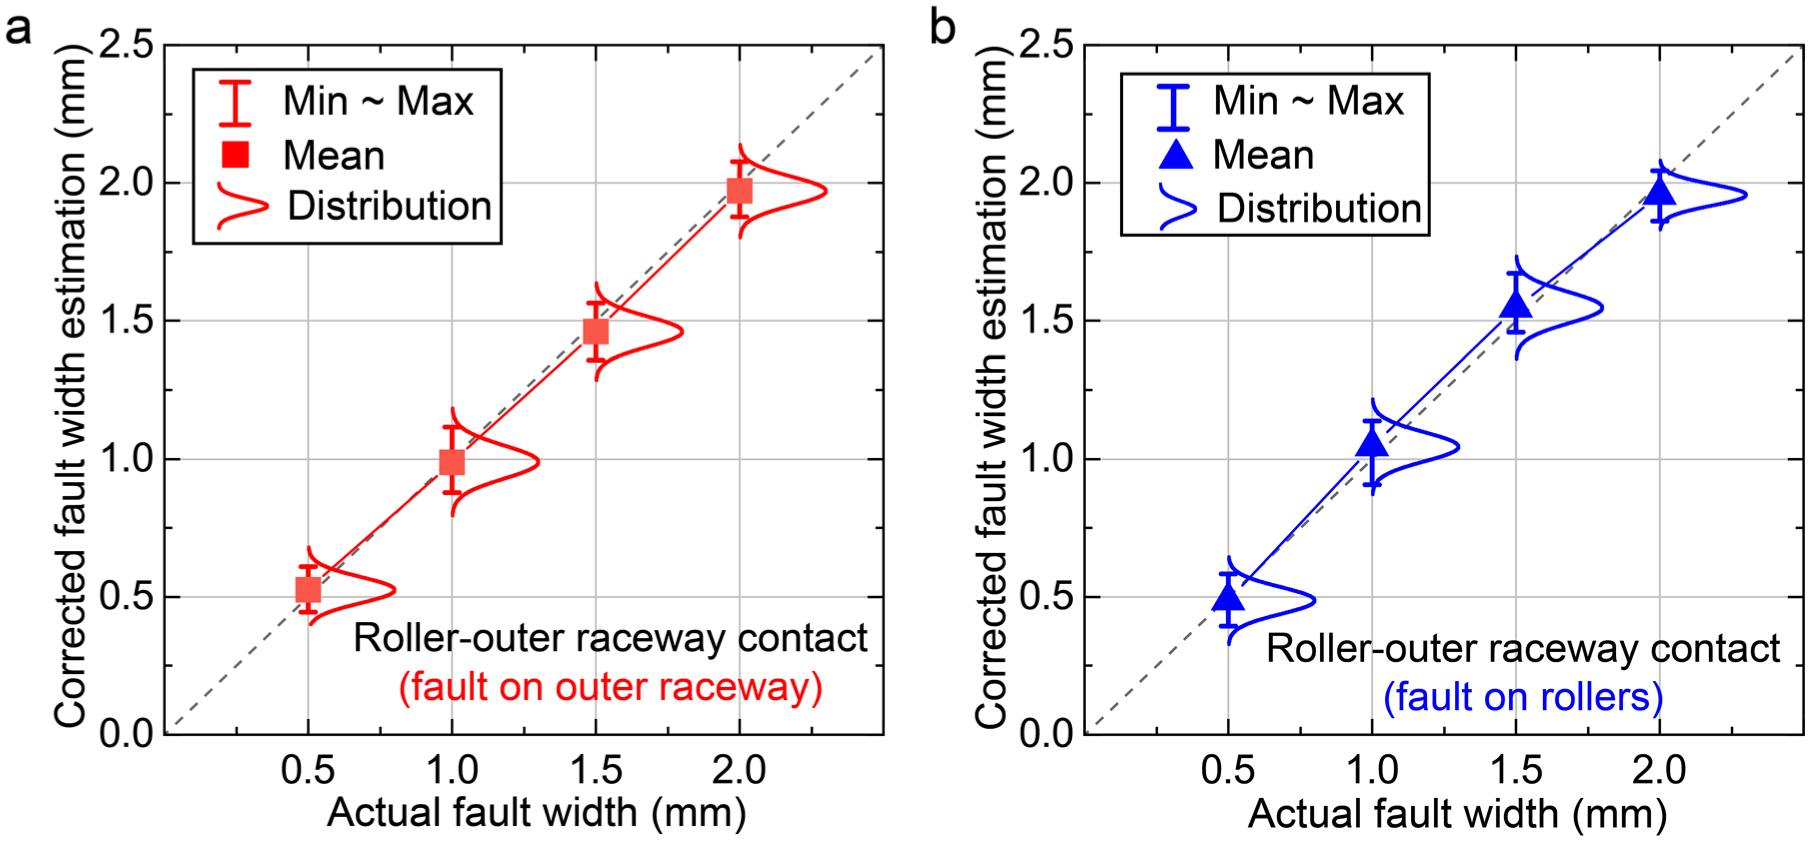
Corrected fault size estimation results considering the removal of roller-outer raceway contact widths (a) outer ring fault, (b) roller fault.
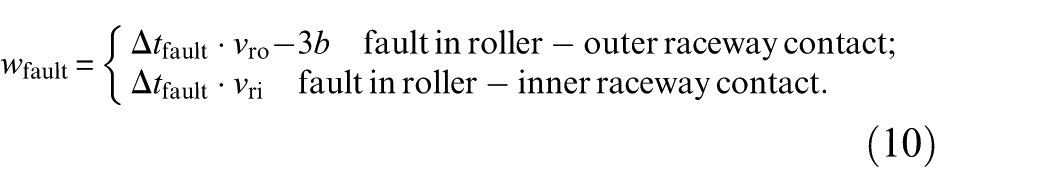
Overall, the strain-based method for the width estimation of spall-like faults within bearings can be concluded as shown in Equation (10). The product of the Δtfault extracted from strain signals and the relative velocity of the contact pair allows an accurate width estimation of faults appearing in the roller-inner ring contact. However, the influence of the contact load must be considered and eliminated when the fault occurs in the roller-outer raceway contact. The mechanism underlying Equation (10) likely relates to the influence of roller-raceway contact deformation on the deformation of the bearing outer ring’s outer surface. When a notch exists on the inner surface of the bearing housing, the contact-induced deformation generated at the roller-outer raceway interface directly affects the strain response on the outer surface of the bearing outer ring due to its limited thickness. Conversely, contact deformation arising from roller-inner raceway interaction is poorly transmitted to the bearing outer ring. Consequently, fault width assessment requires no correction for faults occurring at the roller-inner raceway contact interface.
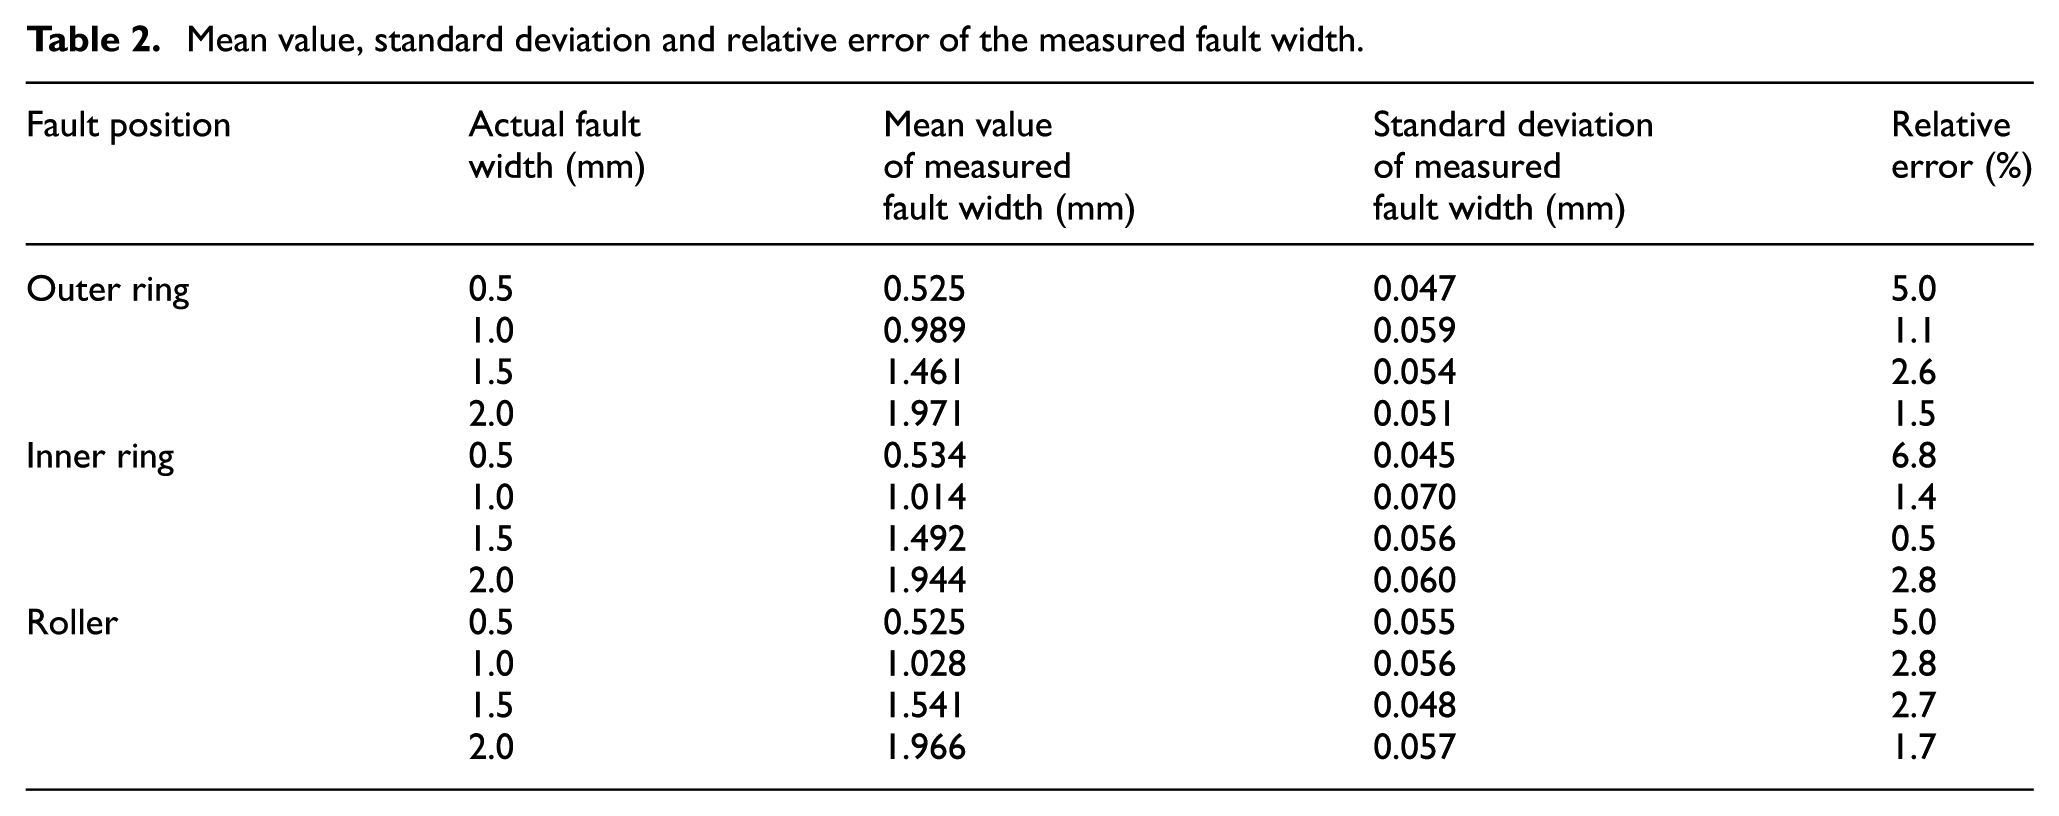
The mean values, standard deviations and relative errors of the estimated width of all prefabricated faults in the experiment are obtained according to Equation (10) and listed in Table 2. The relative error refers to the difference between the mean of the estimated width and the actual width. The maximum relative error is 6.8%, while in most cases the relative error does not exceed 5%, which highlights the accuracy of the strain-based method for fault width estimation proposed in this article.
Mean value, standard deviation and relative error of the measured fault width.
To highlight the advantages of the proposed strain-based method for quantitative decoupling fault diagnosis, the diagnostic results presented herein are compared with those from several vibration-based diagnostic methods reported in the literature.7–9 Table 3 summarizes the comparison results. It can be clearly seen that the vibration-based methods employed in the work of Refs.7–9 are limited to diagnosing independent outer ring or inner ring faults. In contrast, the strain-based method proposed in this work effectively achieves independent identification of outer ring, inner ring and roller faults, as well as decoupled identification of compound faults. Furthermore, under comparable sampling frequencies and within the same operational range of bearing rotational speeds, the maximum relative error (6.8%) for the minimum detectable fault width achieved by the present method is substantially lower than that reported in the other studies (20%, 10.9% and 25.6%). These results collectively demonstrate the significant advancement and superior potential of the proposed strain-based method over vibration-based approaches for the quantitative decoupling identification of bearing faults.
Comparison results of the proposed method and state-of-the-art methods.
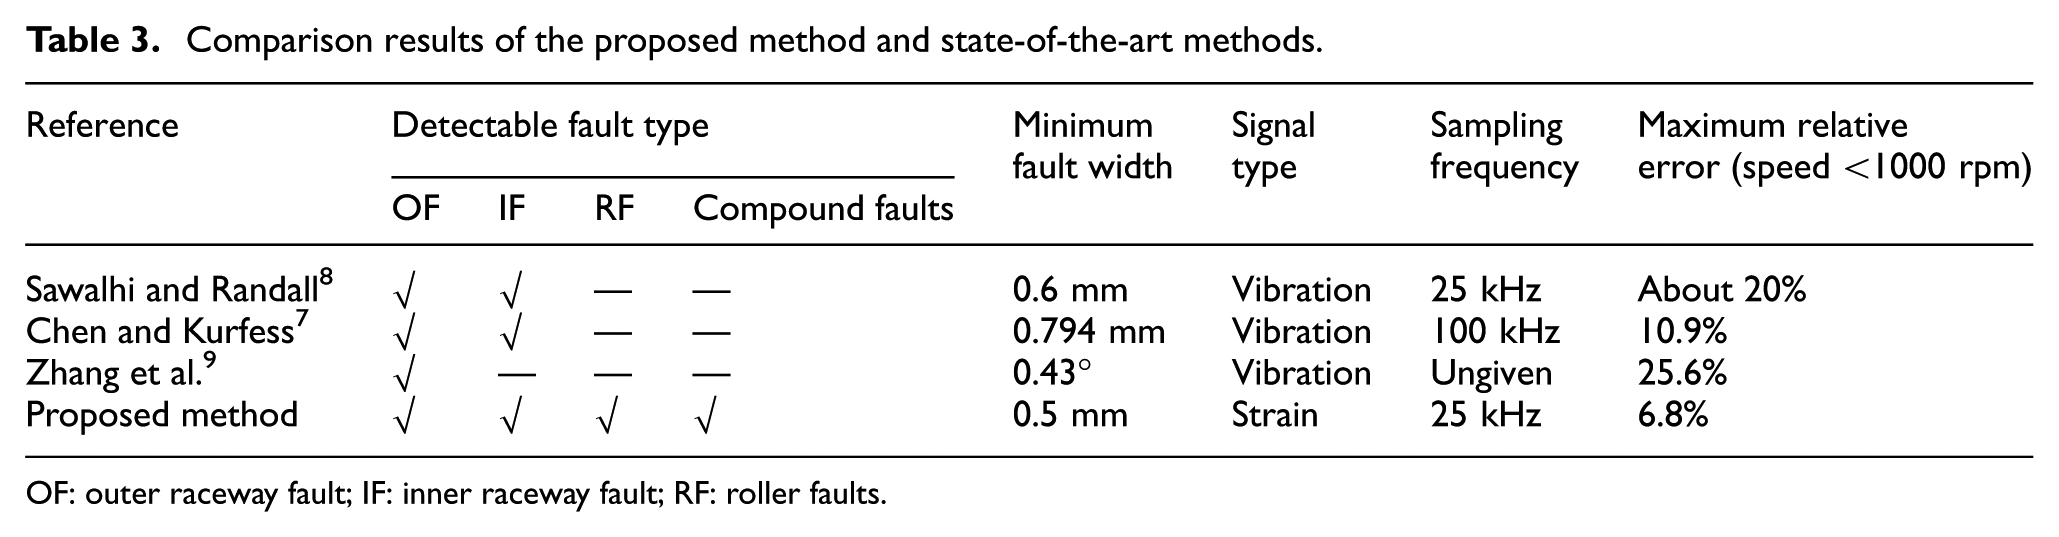
OF: outer raceway fault; IF: inner raceway fault; RF: roller faults.
Influence of sampling frequency and rotational speed on fault width detectability
Two primary factors influence the detectability of a fixed-width fault: bearing rotational speed and sampling frequency of the strain signal. Theoretically, provided the sampling frequency is sufficiently high, the strain signal can accurately capture the complete strain-drop pulse induced by a spall-like fault, thereby yielding an accurate fault passage time Δtfault, regardless of the bearing speed. Besides, rotational speed and sampling frequency exhibit an inversely proportional relationship regarding their impact on the total number of data points capturing the strain drop pulse morphology for a fixed fault width.
The influence of data sampling frequency on fault width detection accuracy is examined using the representative case of the strain signal corresponding to a 0.5-mm wide outer ring fault. This signal was captured at a rotational speed of 312 rpm with a sampling frequency of 25 kHz. Figure 20(a) presents the original signal measured at a 25 kHz sampling frequency. Black circular markers denote strain sampling points, while red square markers represent the time derivative of the strain signal. Figure 20(b)–(e) display the resampled strain signals at 10, 5, 2.5 and 1.25 kHz, respectively, along with their corresponding derivatives. According to the definition of fault passing time Δtfault, the fault passing times Δtfault across different sampling frequencies are marked in Figure 20. Analysis reveals that identified fault passing times Δtfault remain essentially consistent at sampling frequencies of 5 kHz and higher. However, as the sampling frequency decreases further, the progressively diminishing number of data points inadequately preserves the complete strain-drop pulse morphology induced by the fault. This degradation leads to increasingly overestimated fault passing times Δtfault, thus substantially compromising the accuracy of fault width identification.
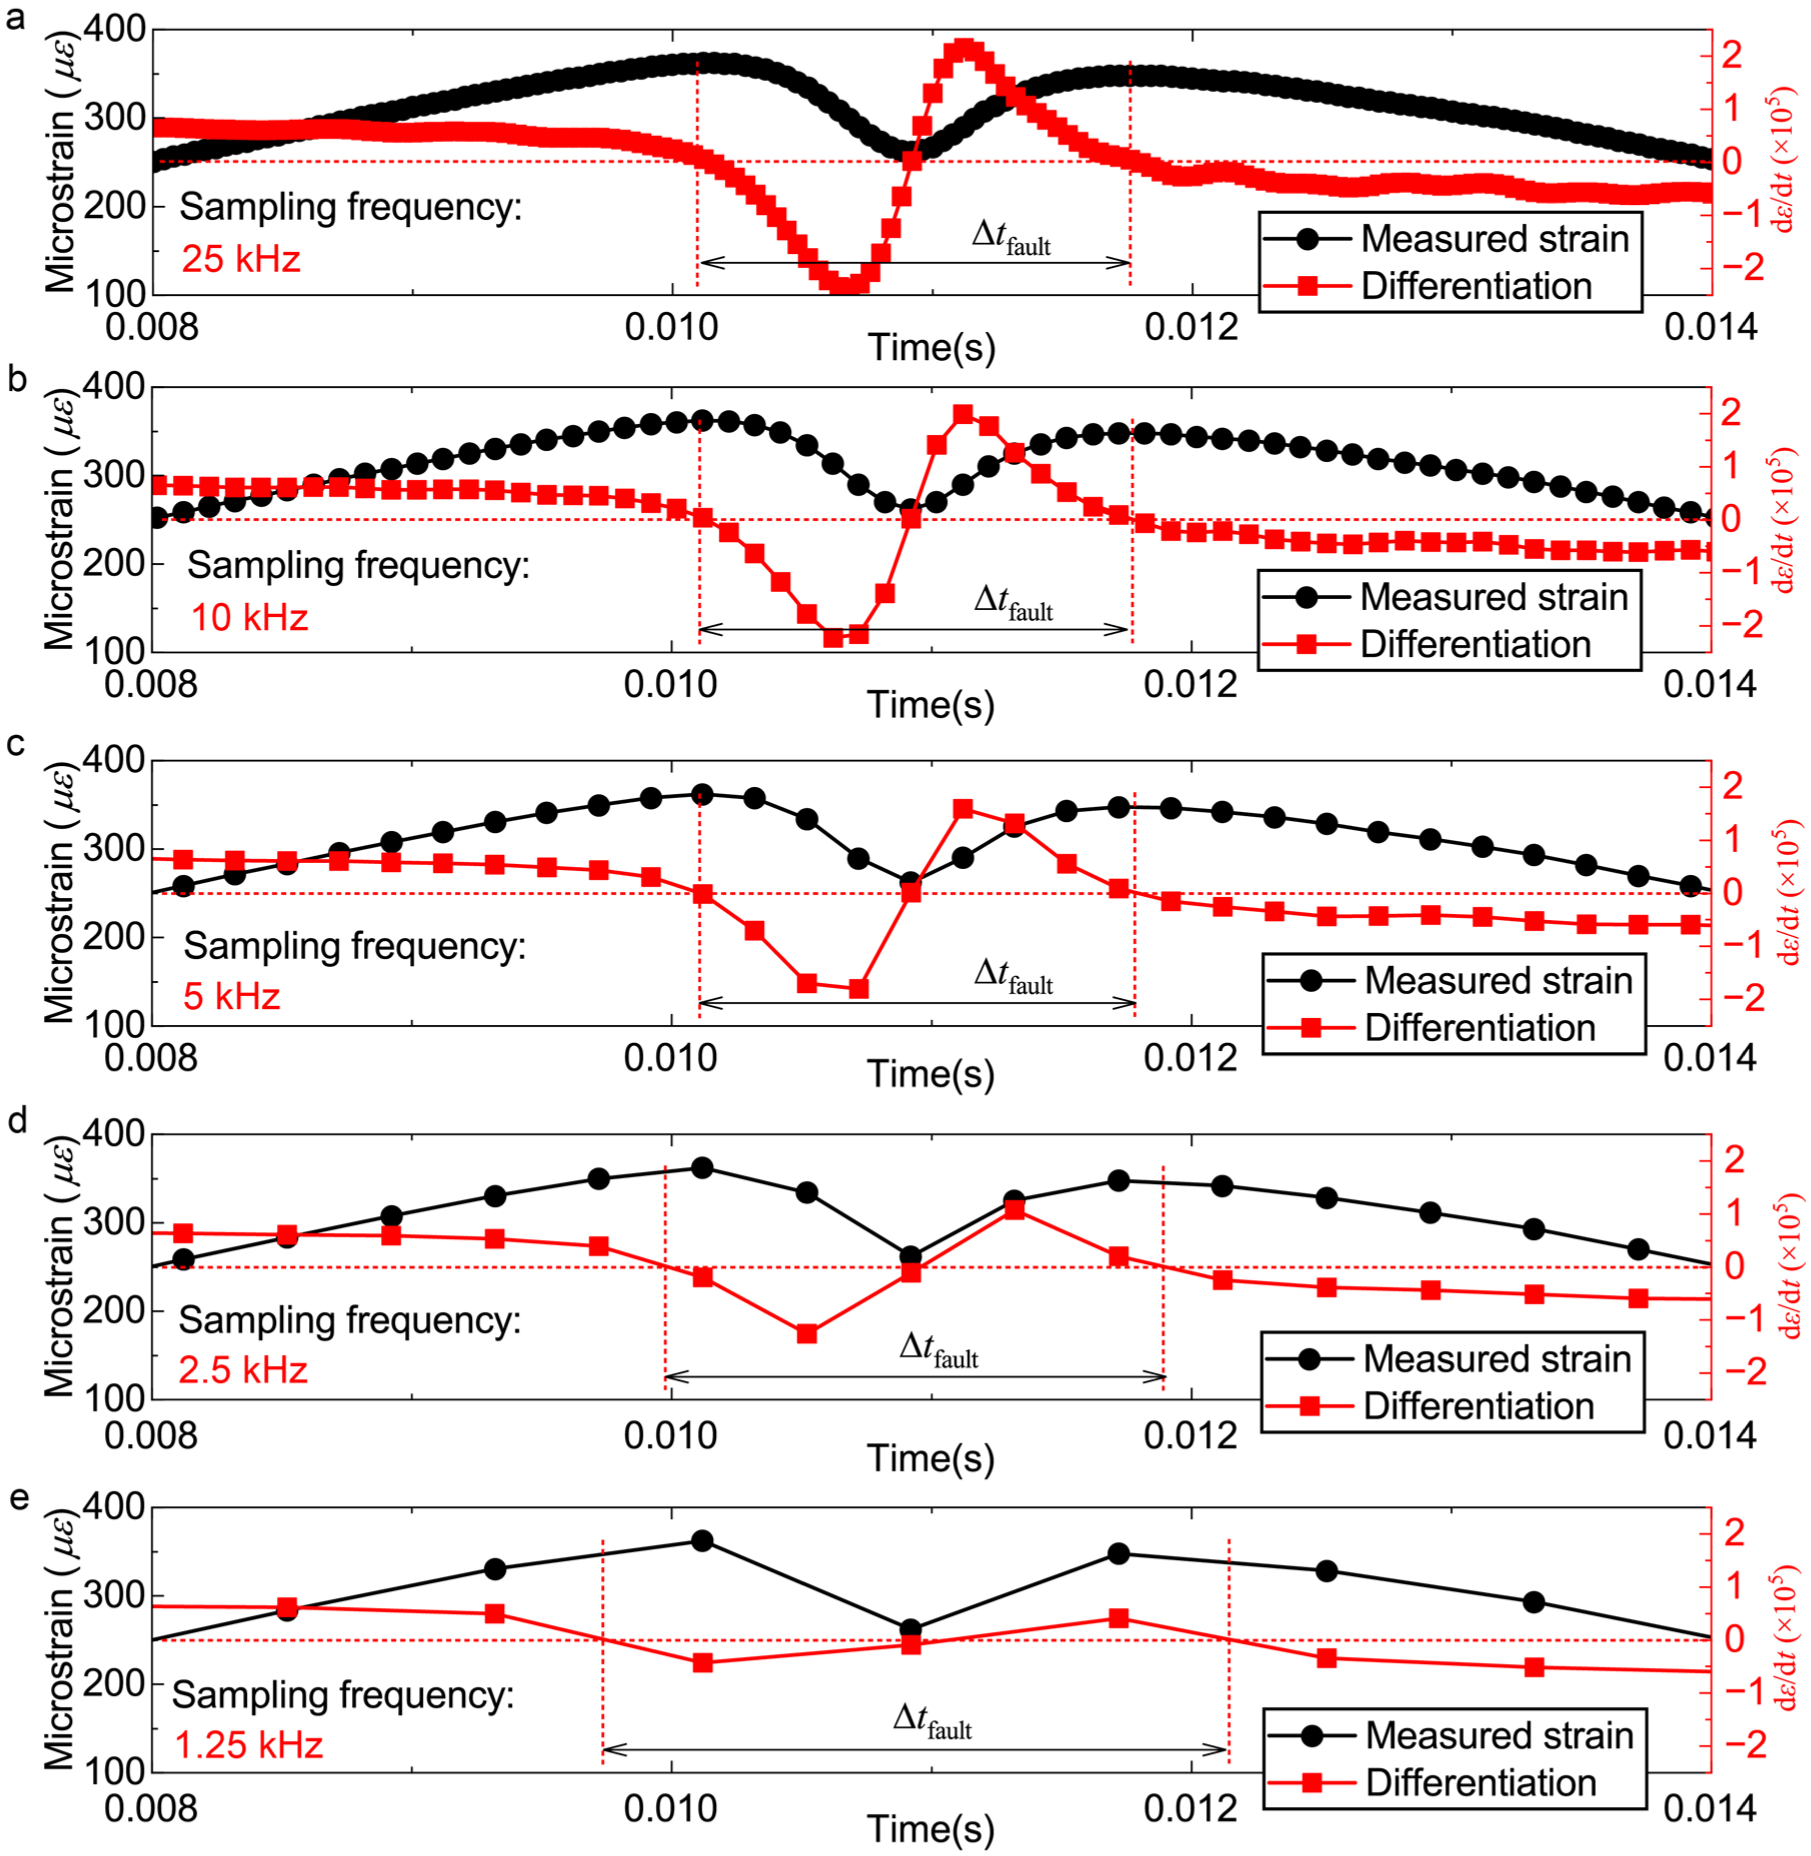
Determination of the fault passing time under conditions of fixed outer ring fault width 0.5 mm, fixed rotational speed 312 rpm and different sampling frequencies: (a) 25 kHz, (b) 10 kHz, (c) 5 kHz, (d) 2.5 kHz, (e) 1.25 kHz.
By implementing additional resampling frequencies, Figure 21(a) illustrates the relationship between sampling frequency and identification error of fault passing time Δtfault. Here, error is defined as the difference between the Δtfault identified at a given sampling frequency and that identified at 25 kHz, divided by the Δtfault identified at 25 kHz. As demonstrated in Figure 21(a), for quantitative identification of a 0.5 mm wide outer ring fault at a fixed rotational speed of 312 rpm, a sampling frequency exceeding 4250 Hz is required to ensure the identification error of Δtfault remains below 5%.
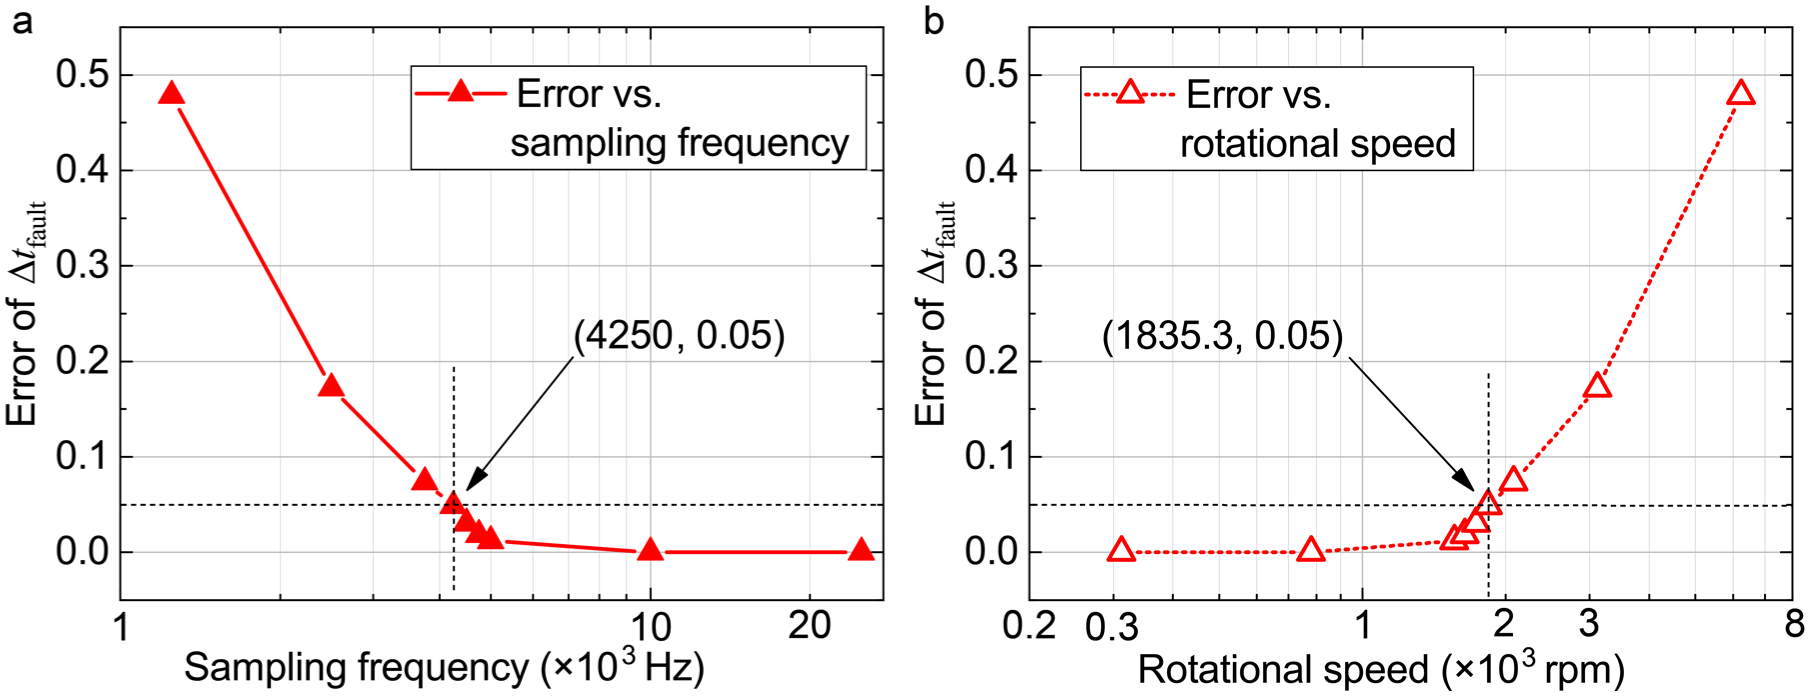
Influence of sampling frequency and rotational speed on the error of fault passing time during detection of fixed outer ring fault width 0.5 mm. (a) Error versus sampling frequency under fixed rotational speed of 312 rpm, (b) error versus rotational speed under a fixed sampling frequency of 25 kHz.
Considering the inverse impact of rotational speed and sampling frequency on the data points measurement, the quantitative influence of sampling frequency on identification error is established in Figure 21(a) enables the derivation of the relationship between identification errors and rotational speeds at a fixed sampling frequency of 25 kHz, as presented in Figure 21(b). Examination of Figure 21(b) indicates that for quantitative identification of a 0.5 mm wide outer ring fault at a fixed 25 kHz sampling frequency, the rotational speed during strain signal acquisition should not exceed 1835.3 rpm to maintain an error of Δtfault below 5%. Consequently, accurate identification of narrower-width faults necessitates comprehensive consideration of the capabilities of data acquisition equipment and bearing operating conditions, mandating a proportional increase in sampling frequency of the strain signal or a decrease in rotational speed of bearing.
Limitations
The implication of the proposed approach in fault diagnosis of in-service bearing has a number of limitations.
To measure strain responses on the bearing’s outer surface, circumferential notches were introduced into the test bearing housing. Studies confirm that the number and geometry of these notches can alter localized bearing stiffness and thereby modify load distribution. 30 To acquire strain signals without perturbing actual load distribution, notch implementation must adhere to two principles 26 : (1) Roller-number equivalence: For bearings under loads of indeterminate direction, the number of notches must equal the number of rollers. (2) Geometric uniformity: All notches must possess identical dimensions and be evenly spaced according to roller positions, ensuring uniform material removal and neutral load distribution effects. Additionally, circumferential notches (rather than axial notches) are recommended for split housings to minimize stiffness reduction in the bearing-housing assembly.
It should be noted that in this paper, Equation (9) is an experimental data-driven result. The rationale behind the adoption of three times the contact semi-width in Equation (9), as opposed to other multiples, remains to be elucidated. The strain response on the outer surface of the bearing is influenced by a variety of factors such as constraints from the bearing housing and fault morphology. Further simulation or analytical works will be given in the future to illustrate the mechanism behind Equation (9) in the context of these influencing factors.
Notwithstanding these limitations, the strain-based method has been validated to enable intuitive and accurate decoupling of bearing compound faults – a capability not yet achievable with conventional vibration acceleration-based methods. Furthermore, quantitative fault size identification via strain signals eliminates the need for complex feature extraction or intelligent clustering/regression algorithms, significantly streamlining the diagnostic workflow. As for the application of this strain-based method in actual engineering, two more steps may be required. Firstly, an integrated flexible sensor is required to be developed for the integration of strain gauge array, efficient acquisition and transmission of strain data. Secondly, the reliability of long-term testing of the instrumented bearing needs to be verified by in-field tests.
Conclusion
This article presents a pioneering research on the positioning and quantitative diagnostics of spall-like fault in bearings by using a strain gauge array. These gauges are circumferential and evenly placed on the outer surface of the bearing with the help of notches on the bearing housing. The elevated signal-to-noise ratio and array test of the strain signals on the outer surface of the bearing facilitate the decoupling identification of faults within the bearing and the quantitative estimation of the fault size. Major conclusions are given below:
A database of the multi-source strain signals from the outer surface of the faulty bearing has been experimentally established by carrying out rolling tests using the bearing with multiple locations and sizes of faults.
The spall-like faults can be classified and located according to the time-domain characteristics of the strain-drop pulse in the cycle domain of the strain signals from the strain gauge array. The strain-drop pulse occurring at the same sensing position within two adjacent roller passing cycles indicates an OF. The strain-drop pulse occurring at a single sensing position apart corresponds to an IF. The strain-drop pulse occurring at two sensing positions in sequence is indicative of an RF.
The width of faults appearing in the roller-inner ring contact is equal to the product of the Δtfault extracted from strain signals and the relative velocity of the contact pair. The effect of the contact load must be considered and eliminated by introducing three times the contact semi-width when the fault occurs in the roller-outer raceway contact. Experimental results reveal that the mean estimated fault width deviates from actual measurements by less than 5% in most test cases, confirming the method’s estimation accuracy.
Footnotes
Declaration of conflicting interests
The authors declared no potential conflicts of interest with respect to the research, authorship, and/or publication of this article.
Funding
The authors disclosed receipt of the following financial support for the research, authorship, and/or publication of this article: This research was supported by the National Natural Science Foundation of China (Grant Nos. 12302238, U2368215) and the Fundamental Research Funds for the Central Universities (Science and technology leading talent team project, Grant No. 2022JBQY007).