
Abstract
As a recently proposed signal decomposition method, spectral denoising random feature decomposition (SDRFD) has been proven feasible in extracting fault components from non-stationary signals induced by actual gear faults. However, the accuracy of SDRFD in frequency band segmentation is susceptible to interference components, and its frequency domain denoising effect is also limited by the fixed threshold. To address these bottleneck issues, this paper proposes a novel spectral editing random mode decomposition (SERMD) method. Initially, SERMD constructs the random feature energy spectrum of the given signal using sparse random feature expansion as a bridge. Following this, by progressively adjusting the amplitude of the spectrum, a spectral editing strategy is developed to finely attenuate noise components in the spectrum and enhance the diversity of the spectrum. Subsequently, a bandwidth-constrained spectral trend segmentation technique is proposed to accurately divide the frequency bands of spectra obtained through spectral editing, thereby ensuring the integrity of frequency band fault information. Finally, an adaptive mode extraction strategy with frequency band compensation is formulated to obtain mode components with rich periodic fault information from segmentation results of different spectra and complete the decomposition of the given signal. The effectiveness of SERMD is verified through the gear fault simulation signal and experimental signals. Moreover, compared to existing prevalent methods, SERMD has more outstanding performance in accurately diagnosing gear faults.
Keywords
Introduction
As one of the core transmission components of rotating machinery, the operating status of gears directly affects the reliability and service life of the equipment. 1 However, gears often operate under harsh conditions over extended periods, rendering them exceptionally prone to diverse localized faults. If these faults are not promptly detected and addressed, they may result in substantial economic losses or catastrophic safety incidents.2,3 Consequently, conducting research on gear fault diagnosis holds significant importance for ensuring the safe and reliable operation of equipment.
Vibration signals serve as a crucial carrier for equipment condition monitoring, containing abundant information about the dynamic characteristics of machinery.4,5 However, when collecting gear fault vibration signals, high-sensitivity sensors inevitably capture both fault-related signatures and noise interference. 6 Consequently, signal processing methods are essential for extracting fault components from the acquired vibration signals, thereby enabling accurate fault diagnosis.
Empirical mode decomposition (EMD), 7 as a classical parameter-free adaptive signal processing method, fundamentally decomposes given signals into multiple analyzable mode components through a recursive filtering process, thereby achieving multi-scale analysis of signals. The strengths of EMD lie in its fully data-driven attribute and the elimination of the requirement for preset basis functions. Owing to its exceptional performance in processing nonlinear and non-stationary signals, EMD has been extensively applied in various fields, including mechanical fault diagnosis,8,9 biomedical signal processing,10,11 and so on. However, EMD has certain limitations, such as mode mixing, endpoint effect, and insufficient noise robustness. To mitigate these issues, researchers have proposed the ensemble EMD (EEMD) 12 method based on the concept of noise-assisted decomposition. Although EEMD enhances the decomposition performance of EMD to some extent, it still exhibits several limitations, including incomplete mathematical theory, high computational complexity, and the inability to completely eliminate noise residue.
Variational mode decomposition (VMD) 13 is a non-recursive signal processing method based on a variational framework. Its core principle is to transform the signal decomposition problem into a constrained variational optimization problem. By solving this optimization problem, the original signal is decomposed into a set of components with specific center frequencies and finite bandwidths. In contrast to EMD, VMD not only possesses a rigorous mathematical foundation and superior noise robustness but also effectively overcomes the endpoint effect and mode mixing issues. Since its introduction, VMD has become an essential tool for analyzing non-stationary signals induced by mechanical faults.14,15 However, VMD is highly sensitive to the settings of the number of modes and the penalty factor. To address this, researchers have proposed various parameter optimization schemes from different perspectives. For instance, Nassef et al. 16 employed the sailfish optimization algorithm and the Gini index as the criterion to adaptively select the parameters of VMD, thereby achieving effective separation of bearing fault information. Similarly, Gao et al. 17 incorporated the impulse diversity entropy metric and utilized the sparrow search algorithm to optimize the parameters of VMD, thereby improving the fault feature extraction capability of the original VMD. Although parameter optimization can improve the adaptability of VMD, this approach still faces problems such as the optimization process being prone to falling into a local optimum and the objective function being sensitive to interference components.
Empirical wavelet transform (EWT), proposed by Gilles, 18 is a non-stationary signal processing method that integrates the theoretical framework of wavelet transform (WT)19,20 with the adaptability of EMD. Its core idea is to automatically divide the frequency spectrum of the signal in a data-driven way and construct a local wavelet filter bank within the divided frequency bands, thereby decomposing the original signal into multiple mode components. Compared to WT and EMD, EWT overcomes the limitation of fixed basis functions and mitigates mode mixing through frequency-domain segmentation. Leveraging its advantages in data-driven frequency band partitioning and localized wavelet filtering, Chegini et al. 21 and Zhang et al. 22 have successfully applied EWT for denoising and fault feature extraction of rotating machinery vibration signals. However, EWT is susceptible to noise and uneven amplitude distribution in the frequency spectrum, which may lead to improper spectrum segmentation. In addition, the transition phases of the wavelet filter bank in EWT complicate the separation of closely spaced frequency components in the spectrum. To address these issues, Zhou et al. 23 proposed the empirical Fourier decomposition (EFD) method. Benefiting from improved segmentation technique and the construction of zero-phase filter bank, EFD can effectively handle multi-component signals with closely spaced modes, and its decomposition results have higher accuracy. Nevertheless, similar to EWT, the segmentation technique of EFD also relies on local extrema of the spectrum, thereby making the accuracy of the segmentation boundary set highly susceptible to noise amplitude in the spectrum.
Sparse random mode decomposition (SRMD), recently developed by Richardson et al., 24 is an emerging signal processing method that mainly consists of signal representation and clustering decomposition. Specifically, SRMD first uses the sparse random feature expansion 25 to approximately represent the signal as the sum of a series of random time-frequency features. Subsequently, a density-based clustering algorithm 26 is employed to cluster the localized time-frequency features into multiple mode components, thereby accomplishing the decomposition of the given signal. Through the analysis of Richardson et al., 24 it has been demonstrated that SRMD can mitigate mode mixing while exhibiting superior mode separation performance and less Gibbs phenomenon. Benefiting from its characteristics and advantages, SRMD can be applied for signal representation, decomposition, outlier removal, and so on. However, SRMD still has some key issues, such as the dependence of clustering parameters on experience and the difficulty in effectively decomposing noisy signals. In view of this, Liu et al. 27 introduced a spectral denoising random feature decomposition (SDRFD) method by integrating the ideas of spectrum segmentation and frequency-domain filtering, and successfully extracted the fault-related components from the non-stationary signals induced by actual gear faults using it. However, the accuracy of frequency band segmentation in SDRFD is easily affected by interference components in the spectrum. Meanwhile, the threshold of the frequency domain denoising strategy in SDRFD is fixed, which can lead to incomplete attenuation of noise components or erroneous filtering of fault feature components in the segmented frequency band. Constrained by these bottleneck issues, the performance of SDRFD in practical applications remains limited.
To overcome the limitations of SDRFD, this paper proposes a novel spectral editing random mode decomposition (SERMD) method. First, this method constructs the random feature energy spectrum of the given signal by leveraging the sparse random feature expansion as a bridge. Second, to finely suppress noise components in the spectrum and enhance the diversity of the spectrum, a spectral editing strategy is designed. Next, to obtain accurate segmentation boundaries of spectral editing results and ensure the integrity of frequency band fault information, a bandwidth-constrained spectral trend segmentation technique is proposed. Subsequently, to obtain mode components with rich periodic fault information from segmentation results of different spectra and complete the decomposition of the given signal, an adaptive mode extraction strategy with frequency band compensation is developed. Ultimately, the analysis of simulated and experimental signals demonstrates that SERMD can effectively extract gear fault components, thereby achieving the goal of accurately diagnosing gear faults.
The key contributions of this paper are outlined below:
A spectral editing strategy is designed, which finely attenuates noise components in the spectrum and enhances the diversity of the spectrum by progressively adjusting the amplitude of the spectrum.
A bandwidth-constrained spectral trend segmentation technique is proposed, which ensures the integrity of frequency band fault information while obtaining accurate segmentation boundaries for spectral editing results.
An adaptive mode extraction strategy with frequency band compensation is developed, which not only avoids the loss of fault frequency bands but also achieves accurate separation of signal components with rich periodic fault information.
A novel signal decomposition algorithm, namely SERMD, is put forward for gear fault diagnosis, and its effectiveness and superiority are comprehensively validated via simulation and different experimental cases.
The remainder of this paper is structured as follows. The second section presents the proposed SERMD method. The third section establishes a simulation signal to verify the performance of SERMD. The fourth section further assesses the performance of SERMD using experimentally measured signals. Concluding remarks are presented in the fifth section.
The spectral editing random mode decomposition method
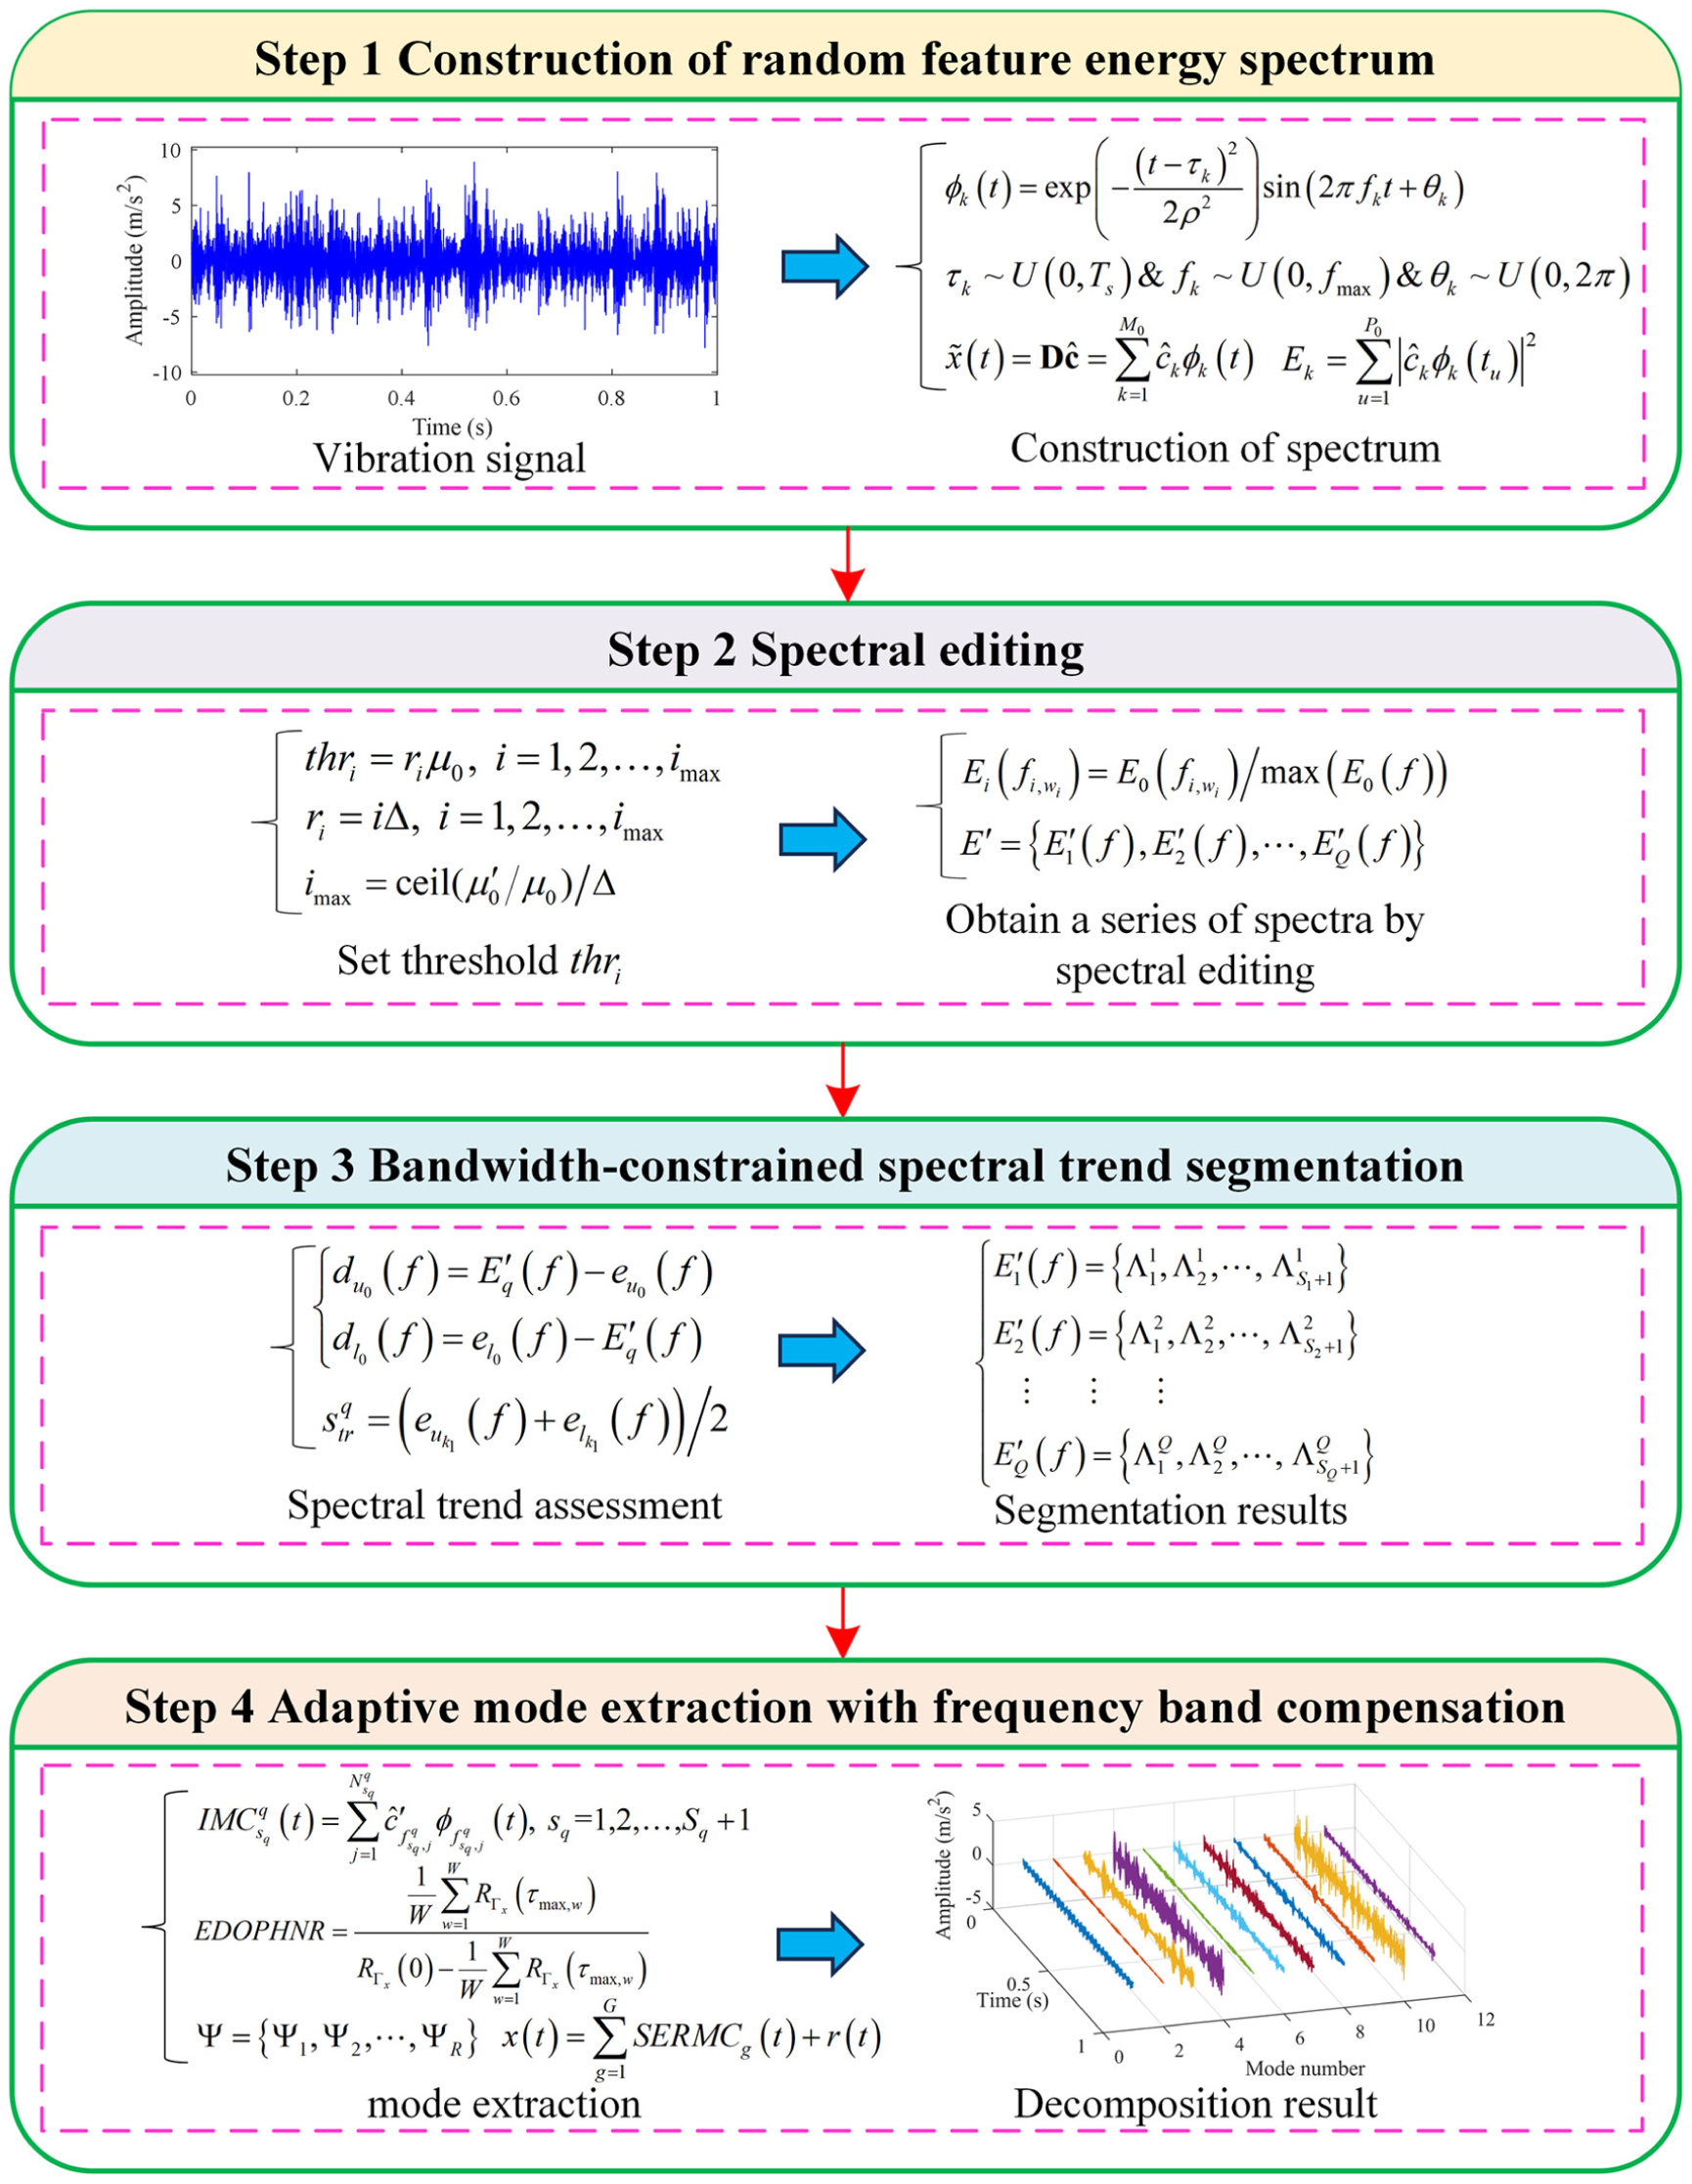
This section elaborates on a novel signal decomposition method, namely SERMD, which principally encompasses four critical steps: construction of random feature energy spectrum, spectral editing, bandwidth-constrained spectral trend segmentation, and adaptive mode extraction with frequency band compensation. The detailed principle of SERMD is described as follows.
Construction of random feature energy spectrum
By utilizing the continuous short-time Fourier transform (STFT) and its inverse transform, a given signal
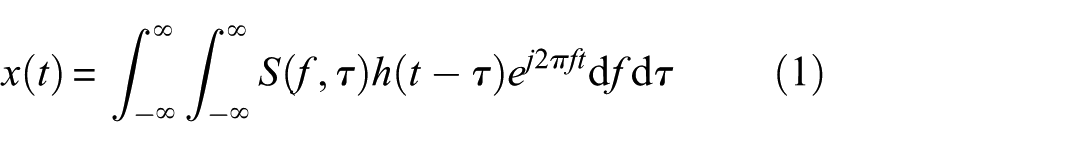
where
Based on sparse random feature expansion,25,28 we can approximate Equation (1) using
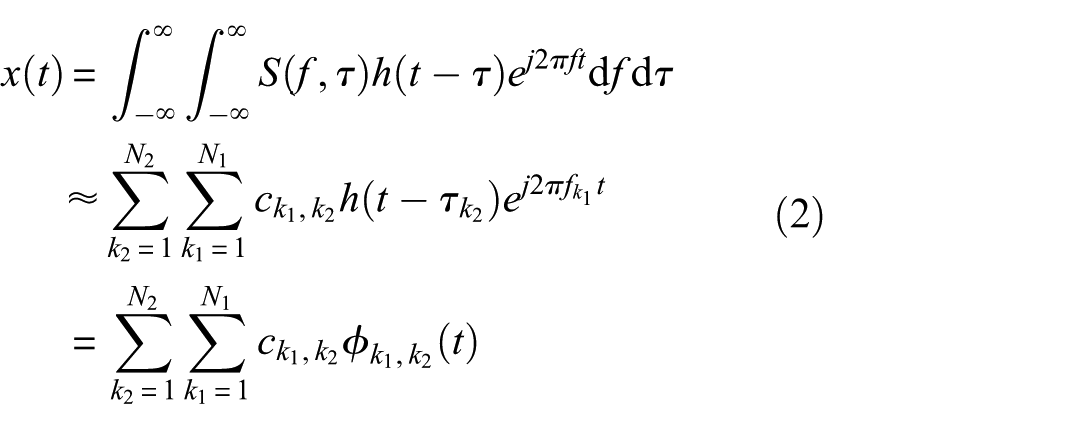
where
After reindexing

Simplifying the complex exponential in Equation (3) to a sinusoidal function with random phase
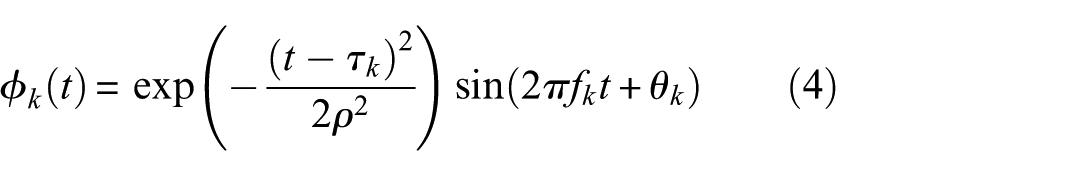
where the random variables

where
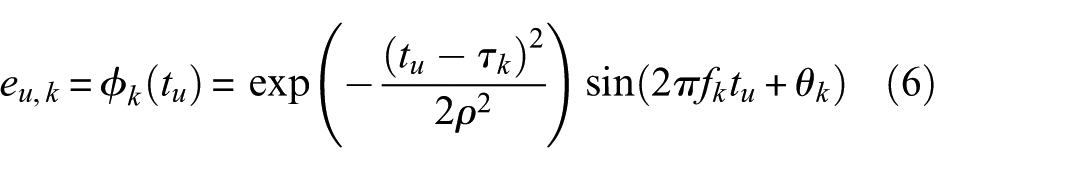
For discrete time points
Then, for obtaining the sparse random feature approximation of Equation (2), the that is, basis pursuit denoising (BPDN)29,30 model in Equation (7) is employed to learn a sparse coefficient vector
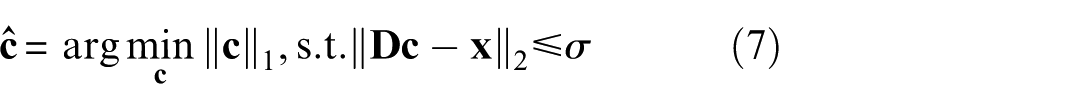
where
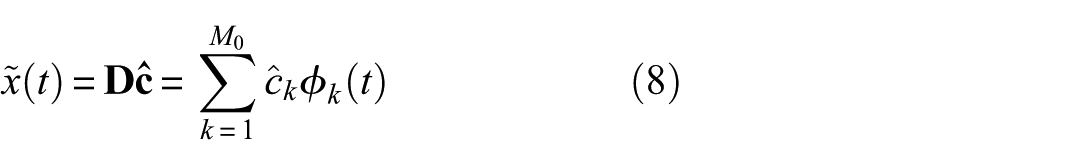
Subsequently, the energy of signal components characterized by random features with non-zero coefficients can be computed as:
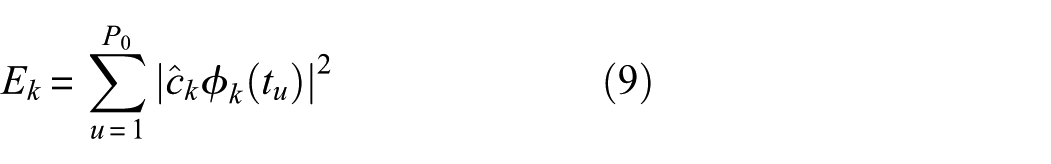
From Equations (4) and (5), it can be observed that each random feature
Spectral editing
Leveraging the obtained E(f), the given signal can be decomposed via a spectrum segmentation mechanism. However, due to the influence of strong background noise, the entire E(f) of the measured gear vibration signal is typically contaminated with numerous interference frequency components. If only the original E(f) is directly segmented, there will still be redundant noise in the obtained frequency bands, which will result in inaccurate separation of feature components. In view of this, this paper proposes a spectral editing strategy by gradually adjusting the amplitude of the spectrum to finely weaken the noise components in the spectrum and increase the diversity of the spectrum, and its process is outlined below:
First, the original E(f) of the signal is denoted as
Subsequently, the average of
Using the average value

where

Due to the modulation effect caused by gear faults, the energy of the modulation regions of the vibration signal in the frequency domain will significantly increase. Then, by editing the frequency components with amplitudes lower than the threshold

where
For the ith threshold
The frequency points in

where
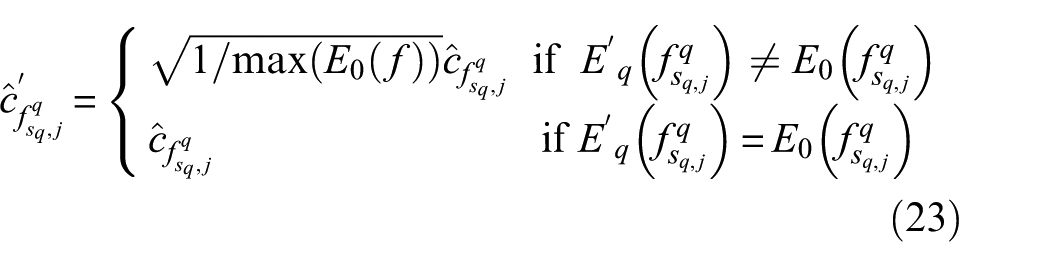
The amplitudes corresponding to the frequency points in

where
From Equation (14), it can be seen that by applying corresponding weights to the amplitudes of frequency points
On the basis of setting a series of different thresholds
The spectra corresponding to the positions recorded above are removed from the spectral editing results obtained by a series of different thresholds
Finally, the different spectra obtained through spectral editing are recorded as:
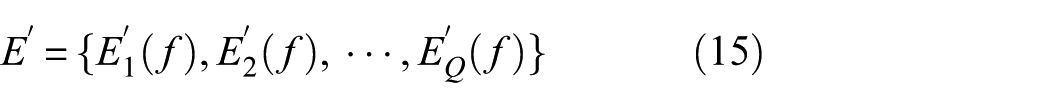
where Q represents the number of different spectra obtained by spectral editing. The flowchart of spectral editing is shown in Figure 1.
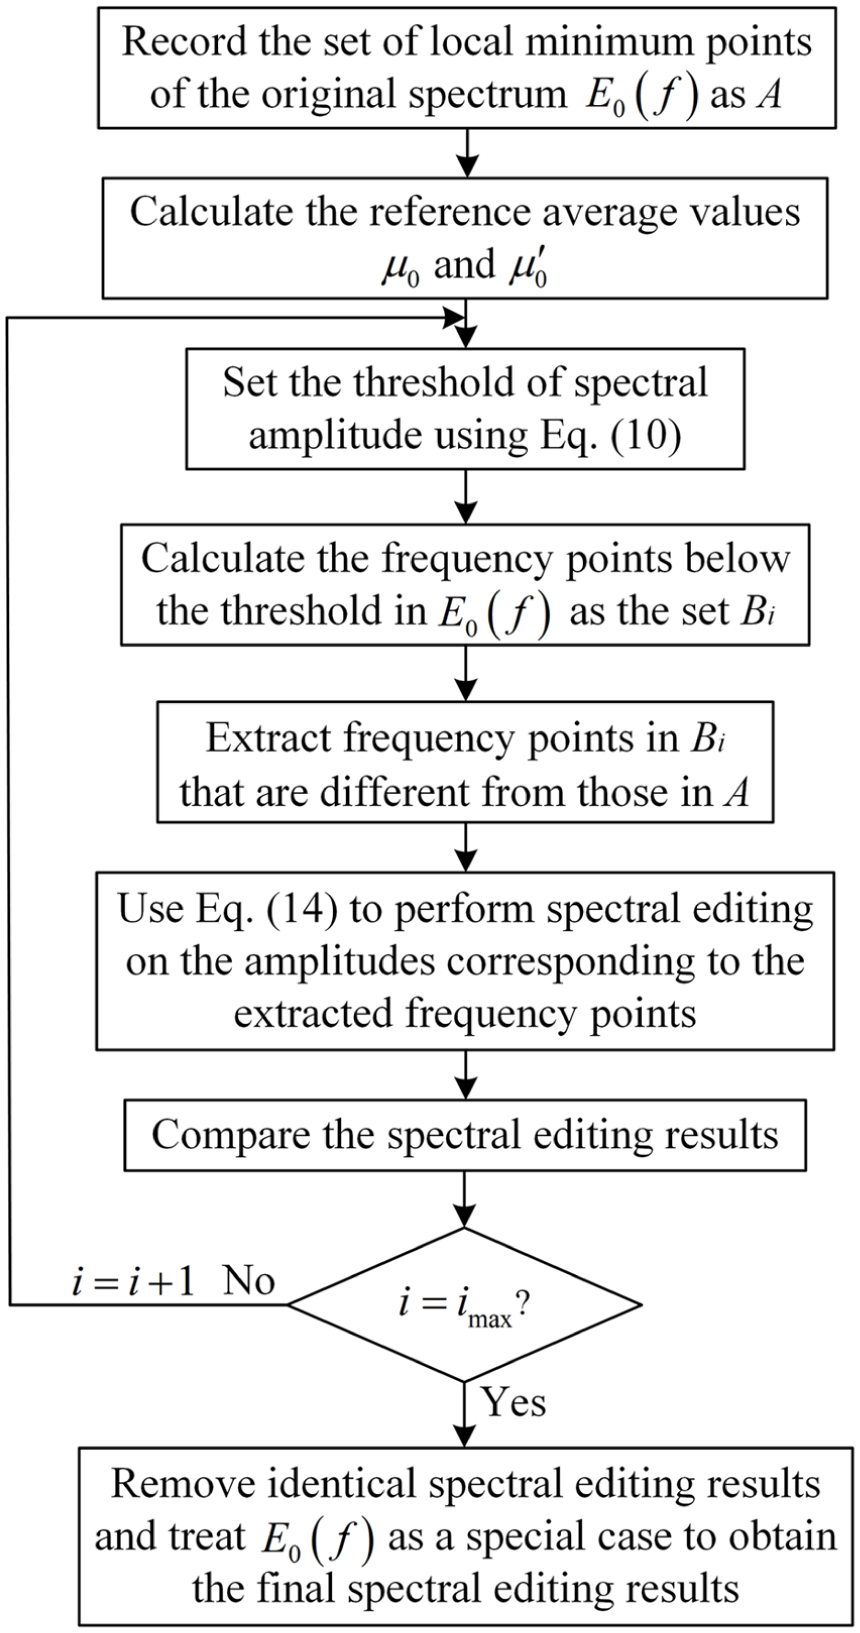
Flowchart of spectral editing.
Bandwidth-constrained spectral trend segmentation
By implementing the above spectral editing strategy, a series of spectra with varying intensity distributions and extremum points can be obtained, thereby providing a basis for subsequently dividing frequency bands with rich fault information. However, for measured signals, the amplitude edited spectra still contain numerous local extrema. Directly using these local extrema as boundaries for frequency band division would result in an over-segmentation problem, thereby compromising the integrity of the frequency band fault information. To reduce the number of extrema in different spectra and achieve accurate frequency band division, based on an empirical optimal envelope, 32 this paper proposes a bandwidth-constrained spectral trend segmentation technique, and its process is outlined below:
For the qth spectrum
The upper envelope distance
All local maxima of
Repeat steps (2) and (3)
Based on
All local minima of
The local minimum points of the final

where H is the number of local minima on the final
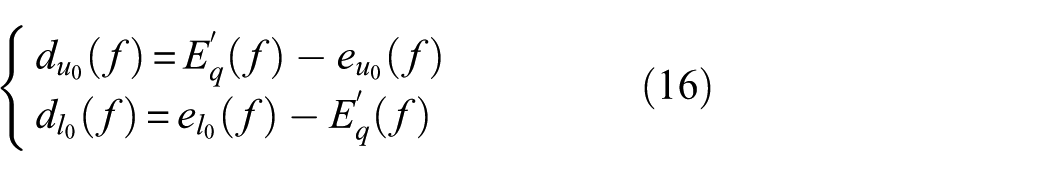
The left and right endpoints of the frequency interval of
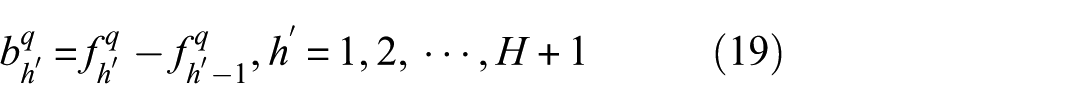
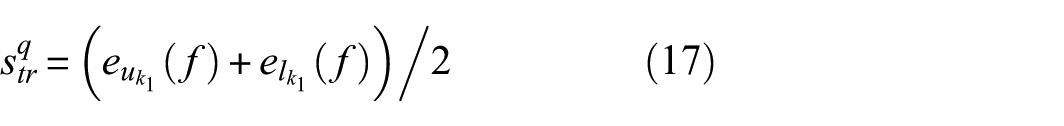
The minimum value in different bandwidths is calculated as
Based on step (9), the segmentation boundaries of
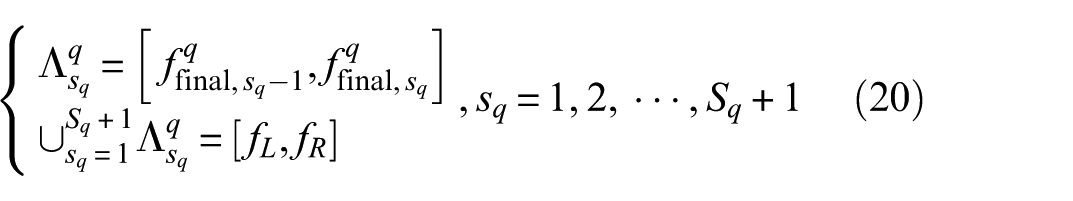
where
By adopting the above steps to segment different spectra in
The flowchart of bandwidth-constrained spectral trend segmentation is shown in Figure 2.
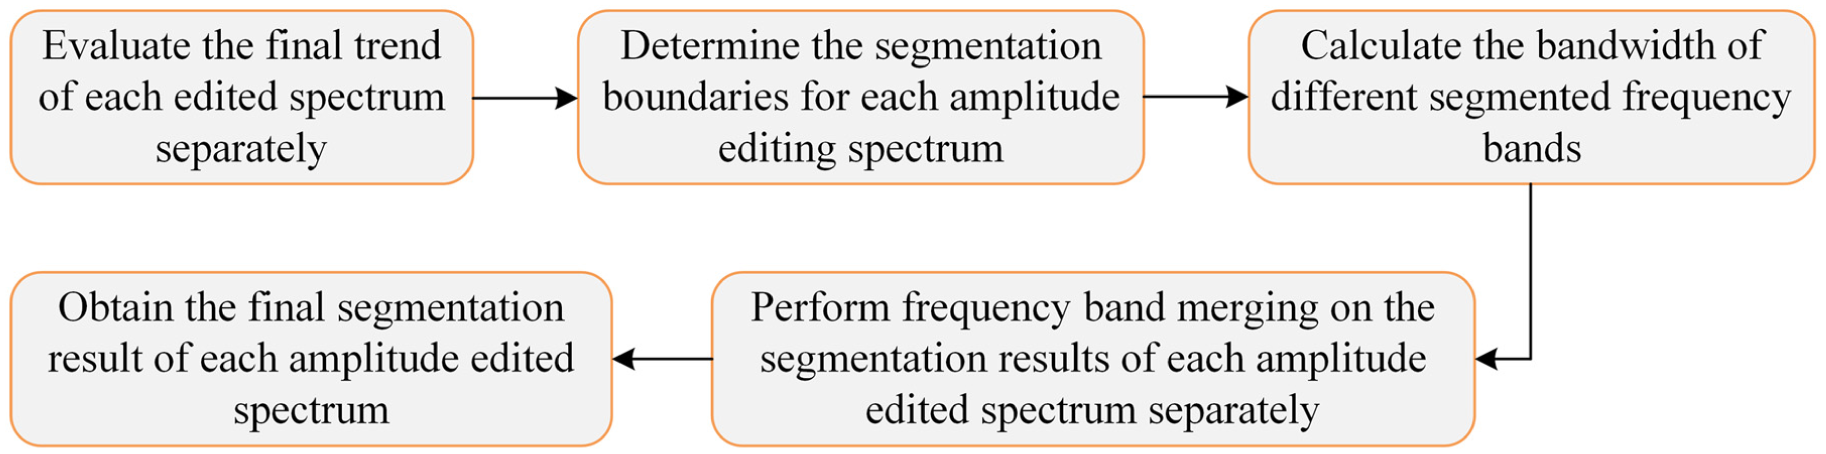
Flowchart of bandwidth-constrained spectral trend segmentation.
Adaptive mode extraction with frequency band compensation
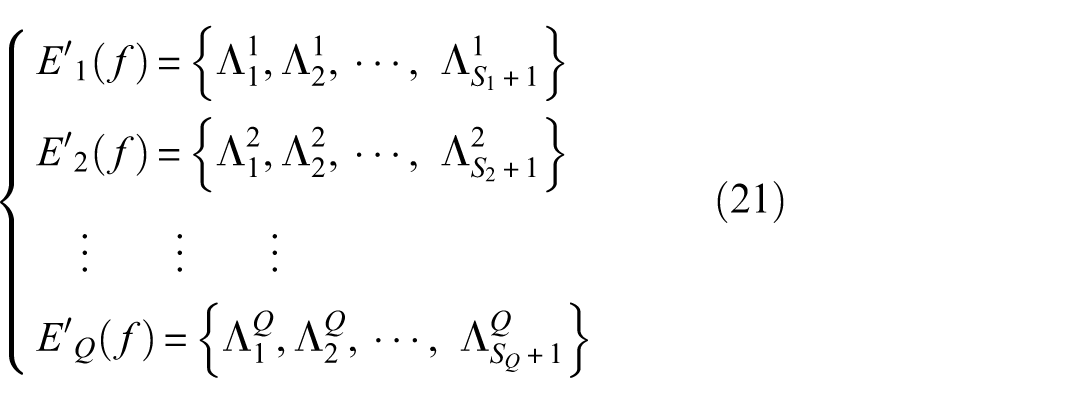
For the segmentation results in Equation (21), they can be regarded as frequency-domain filtered signals obtained by constructing zero-phase filter banks on different spectra in
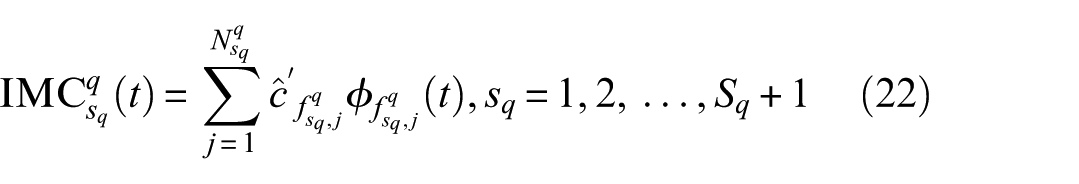
where
where
The segmentation results in Equation (21) are obtained by performing frequency band division on multiple spectra with the same frequency interval, which implies that the recovered IMCs are excessively redundant for the components required for the decomposition of a given signal. Thus, to obtain a set of final mode components with mutually independent frequency bands and ensure the accurate separation of mode components containing rich periodic fault information, this paper proposes an adaptive mode extraction strategy with frequency band compensation, and its process is outlined below:
(1) The envelope-derivative operator periodic harmonic-to-noise ratio (EDOPHNR) metric is introduced to evaluate the intensity of periodic components contained in the IMCs. The construction process of EDOPHNR is as follows:
First, for a given signal

where
Then, the direct current component in
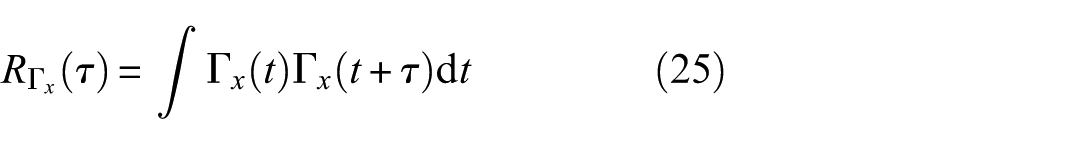
Based on Equations (24) and (25), the definition of EDOPHNR metric is as follows:
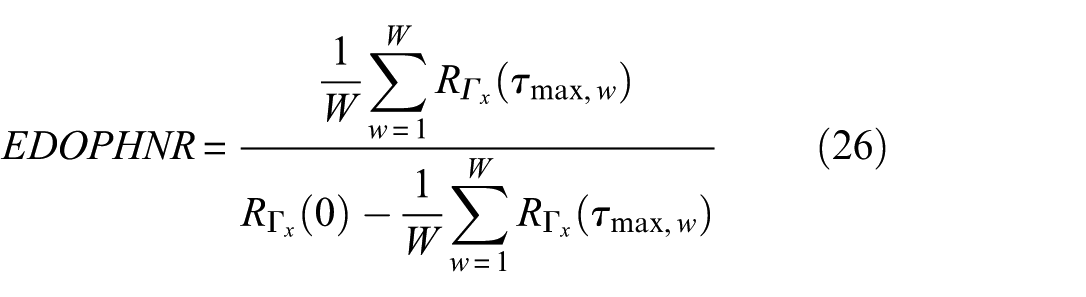
where
(2) The mode component with the maximum EDOPHNR value in the IMCs is selected as the first final component of signal decomposition. Here, the final signal components are defined as spectral editing random mode components (SERMCs).
(3) In the segmentation results of Equation (21), the frequency bands overlapping with SERMC1 are identified. Subsequently, both the first final component SERMC1 and the mode components corresponding to the overlapping bands are removed from the IMCs. Then, IMCs are updated. If the updated IMCs remain non-empty, the algorithm reverts to step (2) using the updated IMCs to extract the next SERMC until there are no remaining IMCs.
(4) Based on step (3), multiple SERMCs with independent frequency bands can be adaptively extracted from the IMCs. Subsequently, based on the frequency bands corresponding to SERMCs, the unextracted frequency bands within the frequency interval
First, the bandwidths of the
Second, based on
Then, the frequency bands requiring compensation are denoted as
Furthermore, the EDOPHNR values of the recovered time-domain signal components are computed, and the component with the maximum EDOPHNR value is extracted as the SERMC
r
corresponding to frequency band
Finally, by adaptively performing mode extraction on
(5) Based on steps (2)–(4), the SERMCs used to complete the decomposition of the given signal can be obtained, and they are rearranged in ascending order based on the center frequencies of their corresponding frequency bands. Then, the decomposition result of the signal is denoted as:
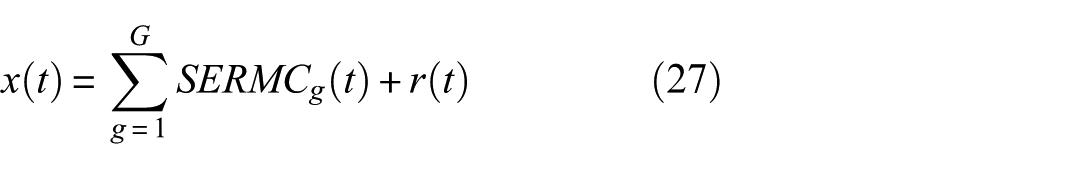
where G denotes the number of SERMCs in the final decomposition result, and
Flowchart of SERMD. SERMD: spectral editing random mode decomposition.
Simulation analysis
This section employs a simulated gear fault signal to validate the effectiveness and superiority of SERMD. Generally, since gear faults can cause modulation effect in vibration signals and the actual collected signals are prone to noise contamination, the model of gear fault simulation signals can be mathematically formulated as34,35:
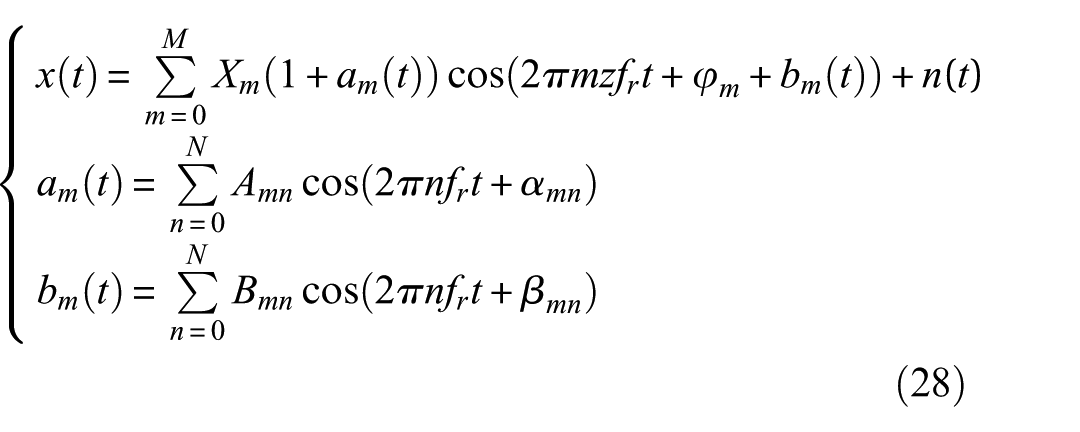
where
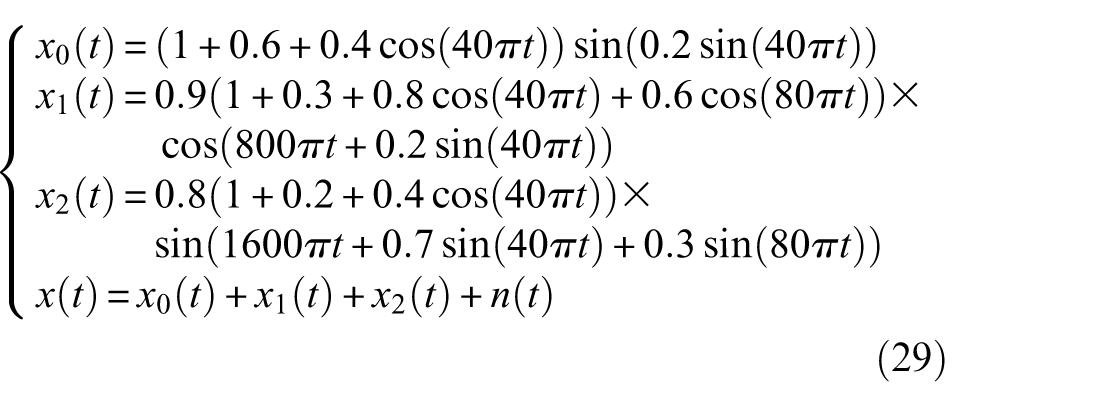
where z is set to 20, f r is set to 20 Hz, and x0(t), x1(t), and x2(t) are the components of the 0th to 2nd order meshing harmonics, respectively. In addition, the fault characteristic frequency of the gear is f r , while the sampling frequency and signal-to-noise ratio of x(t) are specified as 2048 Hz and −10 dB, respectively. Figure 4 illustrates the waveform of x(t) and its envelope spectrum (ES). In Figure 4(a), the periodic modulation characteristics of the gear fault are entirely masked by noise, making direct identification impossible. In Figure 4(b), the f r and its harmonics are likewise overwhelmed by numerous interfering frequency components.
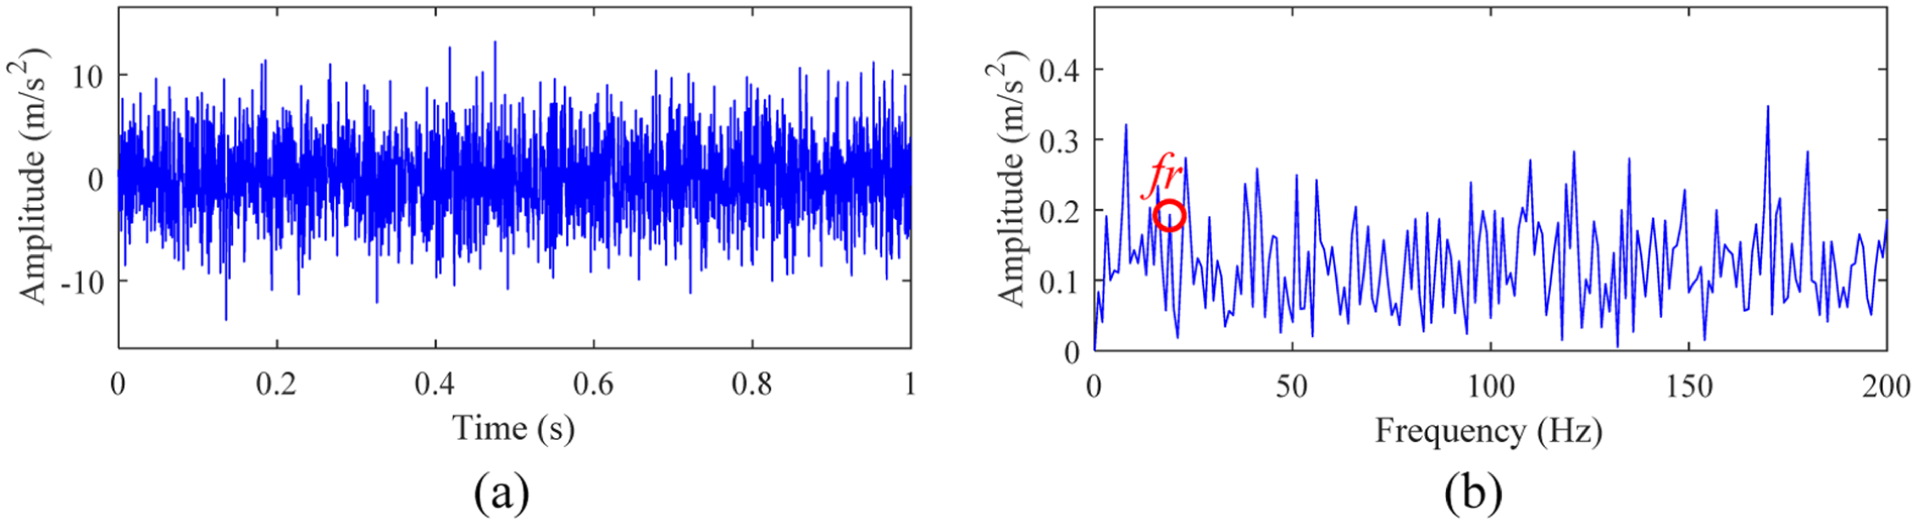
Simulation signal: (a) waveform and (b) ES. ES: envelope spectrum.
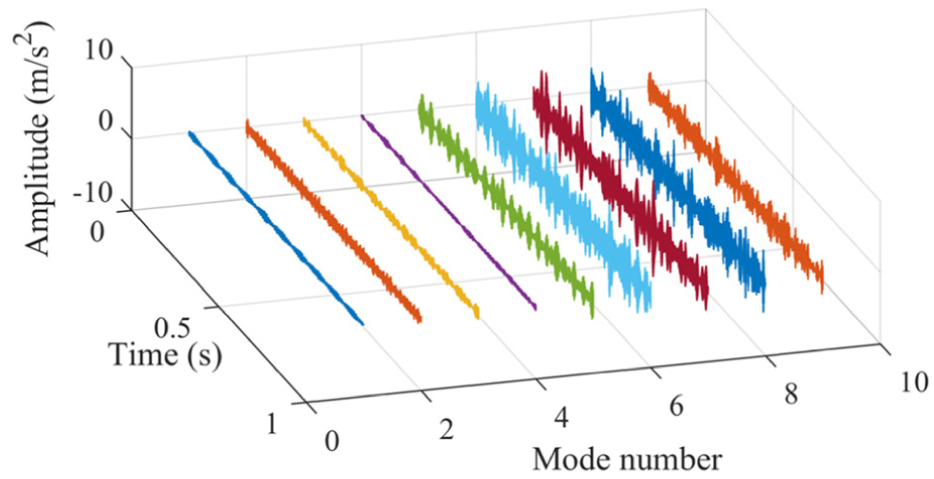
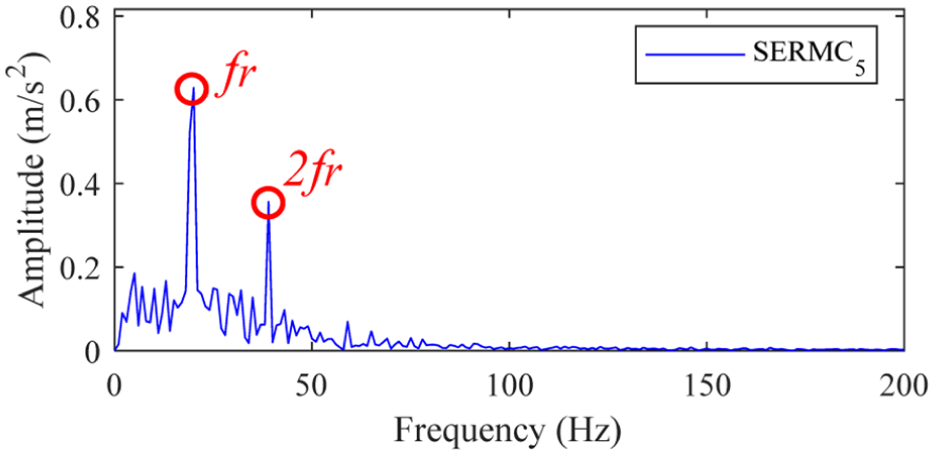
First, SERMD is employed to extract fault components from the established simulation signal. Figure 5 shows the waveforms of the mode components obtained via SERMD. From Figure 5, it can be readily observed that certain mode components exhibit relatively distinct periodic modulation characteristics. To further verify whether these characteristics originate from gear fault, ES analysis is conducted on the mode components shown in Figure 5. Figure 6 presents the ES of the dominant component of SERMD with obvious fault frequencies. As observed in Figure 6, the f r and its harmonics are distinctly identifiable, with no extraneous interfering spectral lines in their vicinity. This demonstrates the capability of SERMD to effectively separate fault components from the simulated signal. Ultimately, by combining these extracted fault frequency features, we can accurately diagnose gear fault.
Waveforms of the mode components obtained via SERMD. SERMD: spectral editing random mode decomposition.
ES of the dominant component of SERMD. ES: envelope spectrum; SERMD: spectral editing random mode decomposition.
Furthermore, to validate the effectiveness of the spectral editing strategy designed in SERMD, Figures 7 and 8 present the decomposition result of SERMD without the spectral editing strategy and the ES of its dominant component, respectively. As shown in Figure 7, the mode components obtained via SERMD without spectral editing exhibit no discernible periodic modulation characteristics. Moreover, in the ES of the dominant components displayed in Figure 8, the f r and its harmonics remain obscured by numerous interference spectral components.
Waveforms of the mode components obtained via SERMD without spectral editing. SERMD: spectral editing random mode decomposition.
ES of the dominant component of SERMD without spectral editing. ES: envelope spectrum; SERMD: spectral editing random mode decomposition.
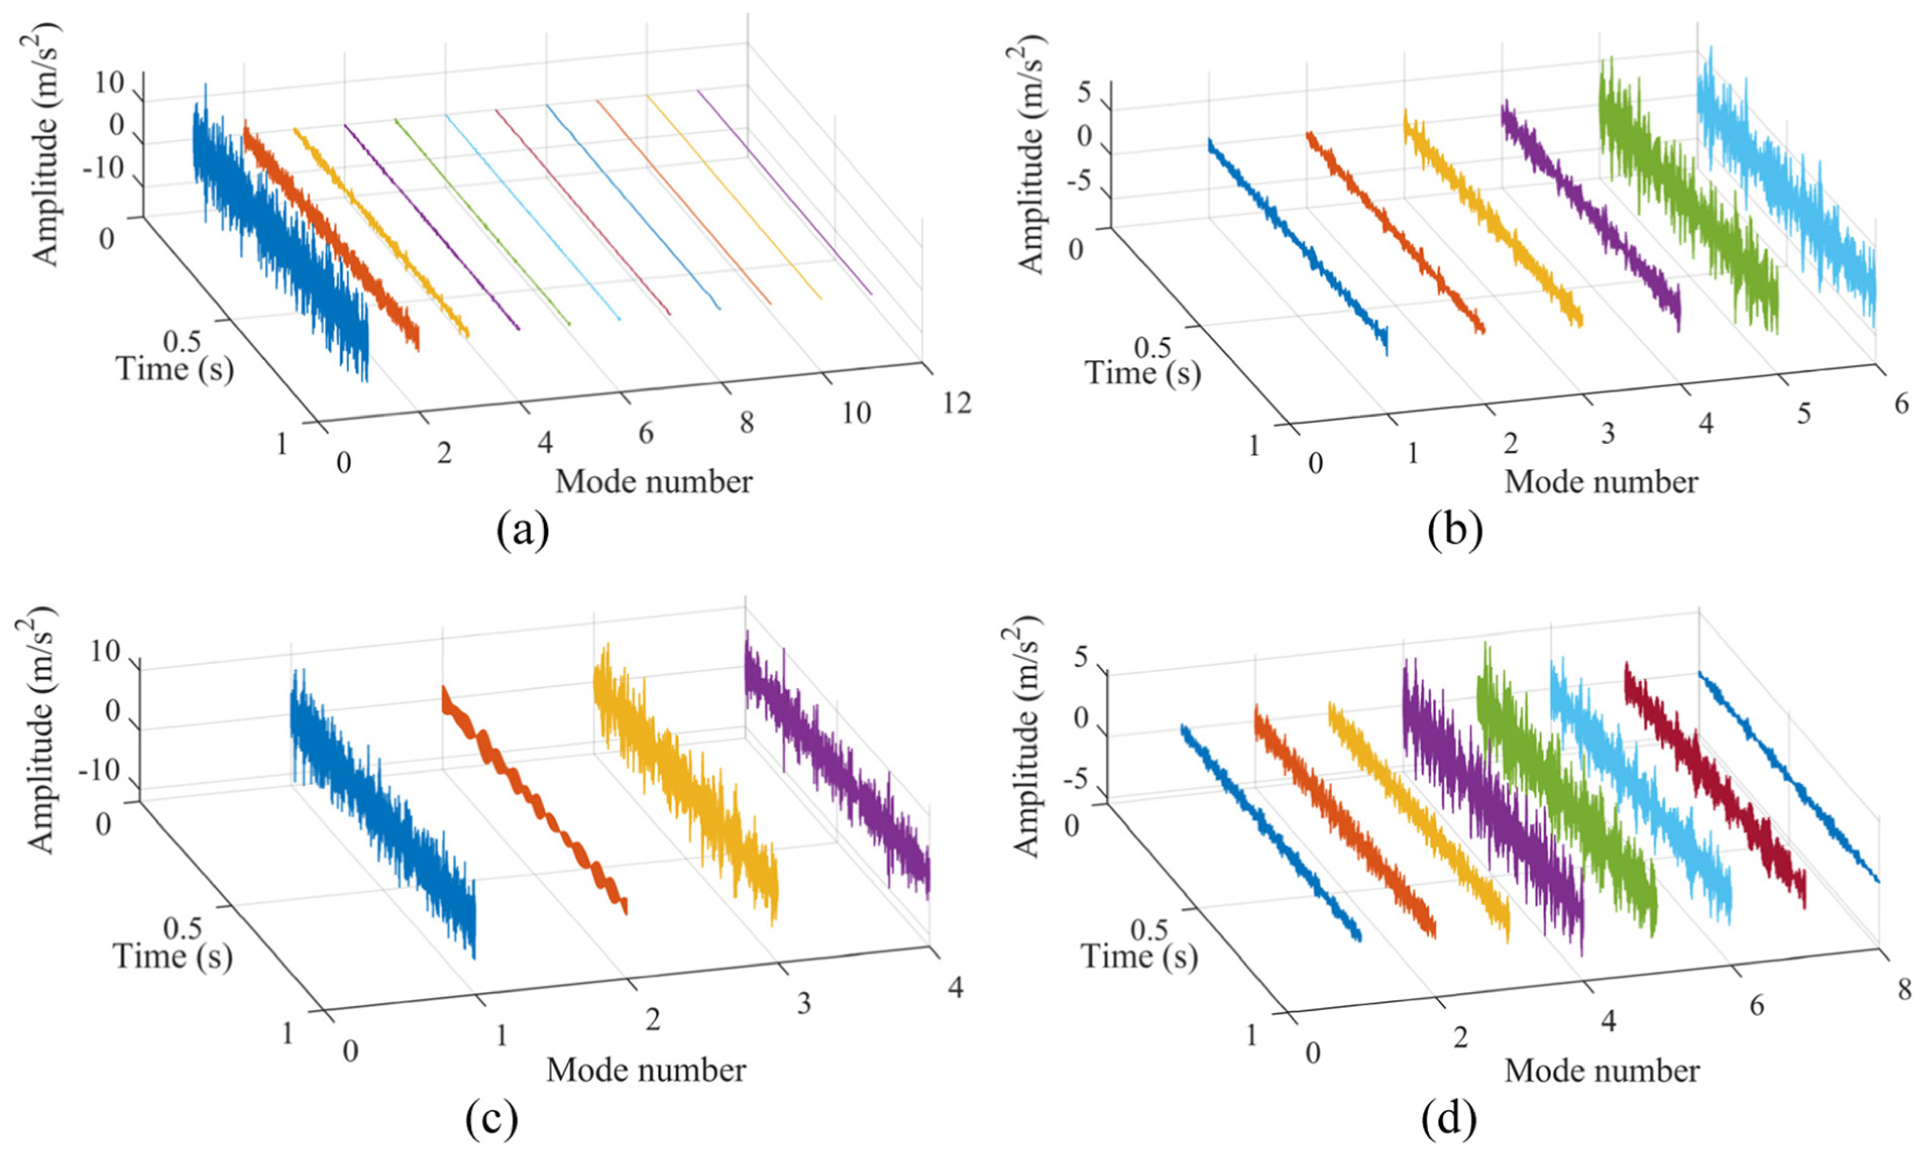
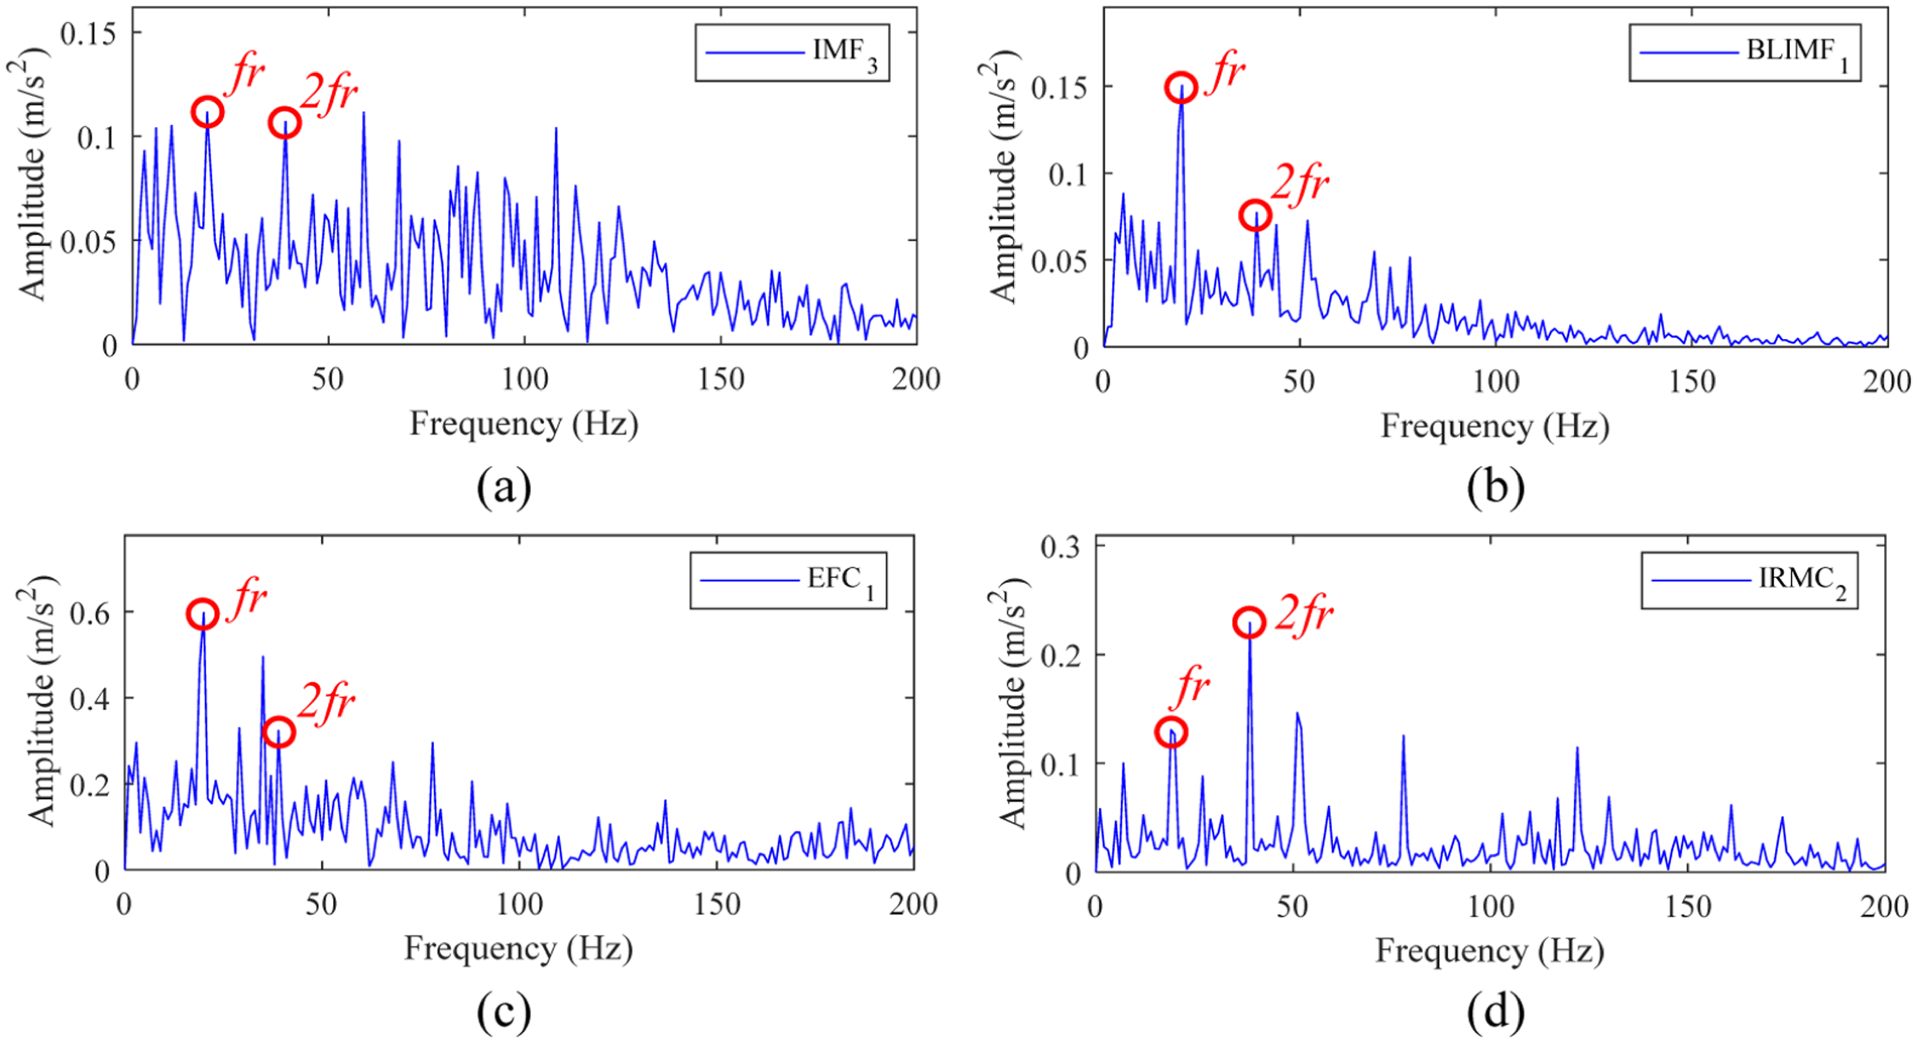
As a comparison, the EEMD, VMD, EFD, and SDRFD methods are individually employed to analyze the simulated signal. First, by setting the noise level and ensemble number of EEMD to 0.15 and 100, respectively, the waveforms of the mode components termed as intrinsic mode functions (IMFs), are shown in Figure 9(a). Second, through multiple trials, the number of mode components for VMD and EFD is preset, with the penalty factor of VMD selected as 2000. The waveforms of the mode components termed as band-limited intrinsic mode functions (BLIMFs) and empirical Fourier components (EFCs) obtained by the two methods are displayed in Figure 9(b) and (c). Then, maintaining consistency with the sparse random features adopted in SERMD to approximate the signal, the waveforms of the intrinsic random mode components (IRMCs) obtained via SDRFD are presented in Figure 9(d). Furthermore, by conducting ES analysis on the mode components obtained above and observing the fault frequency features in different envelope spectra, the envelope spectra of the dominant components of the four approaches are shown in Figure 10(a) to (d), respectively. From Figure 10(a), it can be observed that the f r is not successfully extracted, and significant spectral lines persist around 2f r . As illustrated in Figure 10(b), the region to the left of f r exhibits many prominent interference spectral lines, while 2f r remains indistinct. In Figure 10(c), the f r remains obscured by noise components, while the ES exhibits significant noise contamination. In Figure 10(d), although the f r can be clearly identified, prominent interference spectral lines persist within the localized frequency range to the right of 2f r . This indicates that SDRFD fails to accurately separate the gear fault components. The comprehensive analysis above proves that SERMD exhibits superior performance in gear fault diagnosis.
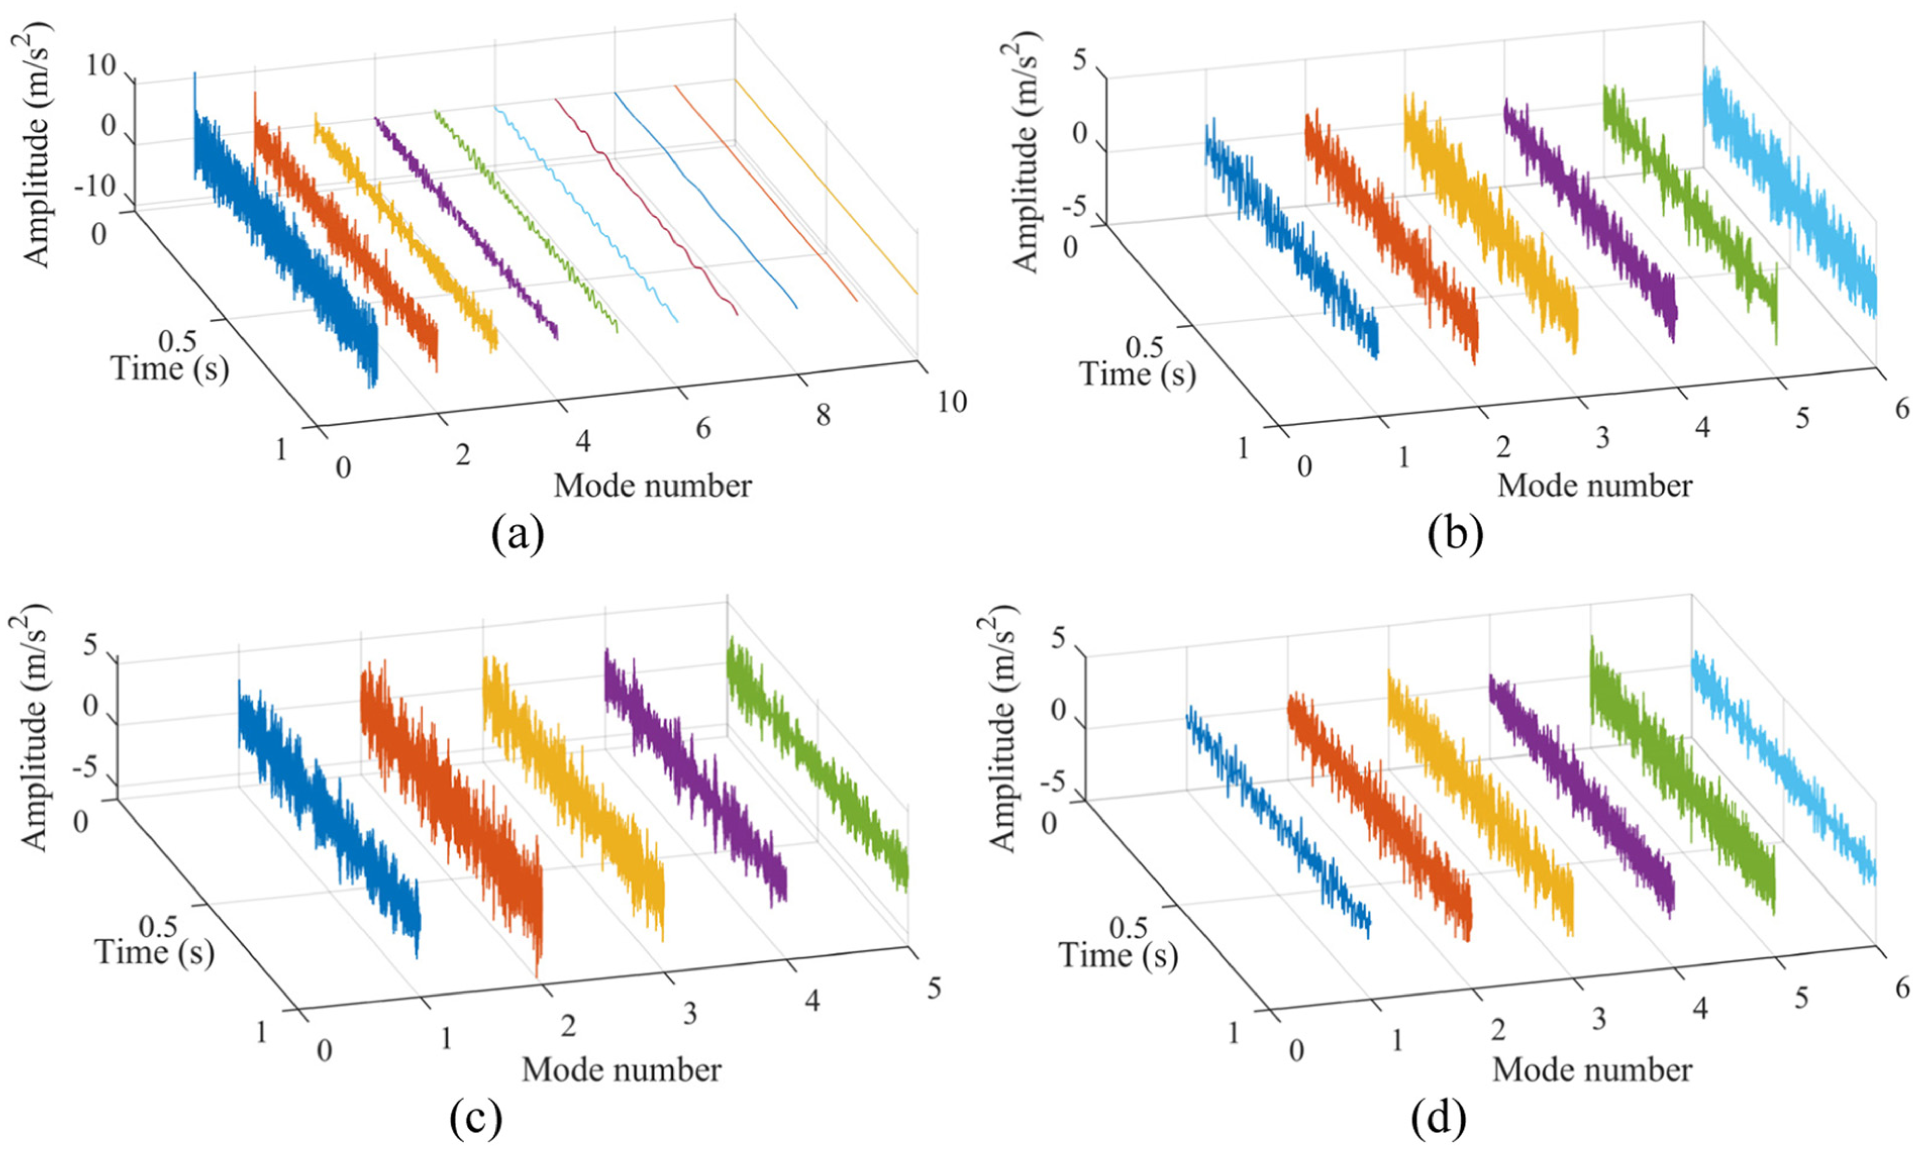
Waveforms of the mode components obtained via different methods: (a) EEMD, (b) VMD, (c) EFD, and (d) SDRFD. EEMD: ensemble empirical mode decomposition; VMD: variational mode decomposition; EFD: empirical Fourier decomposition; SDRFD: spectral denoising random feature decomposition.
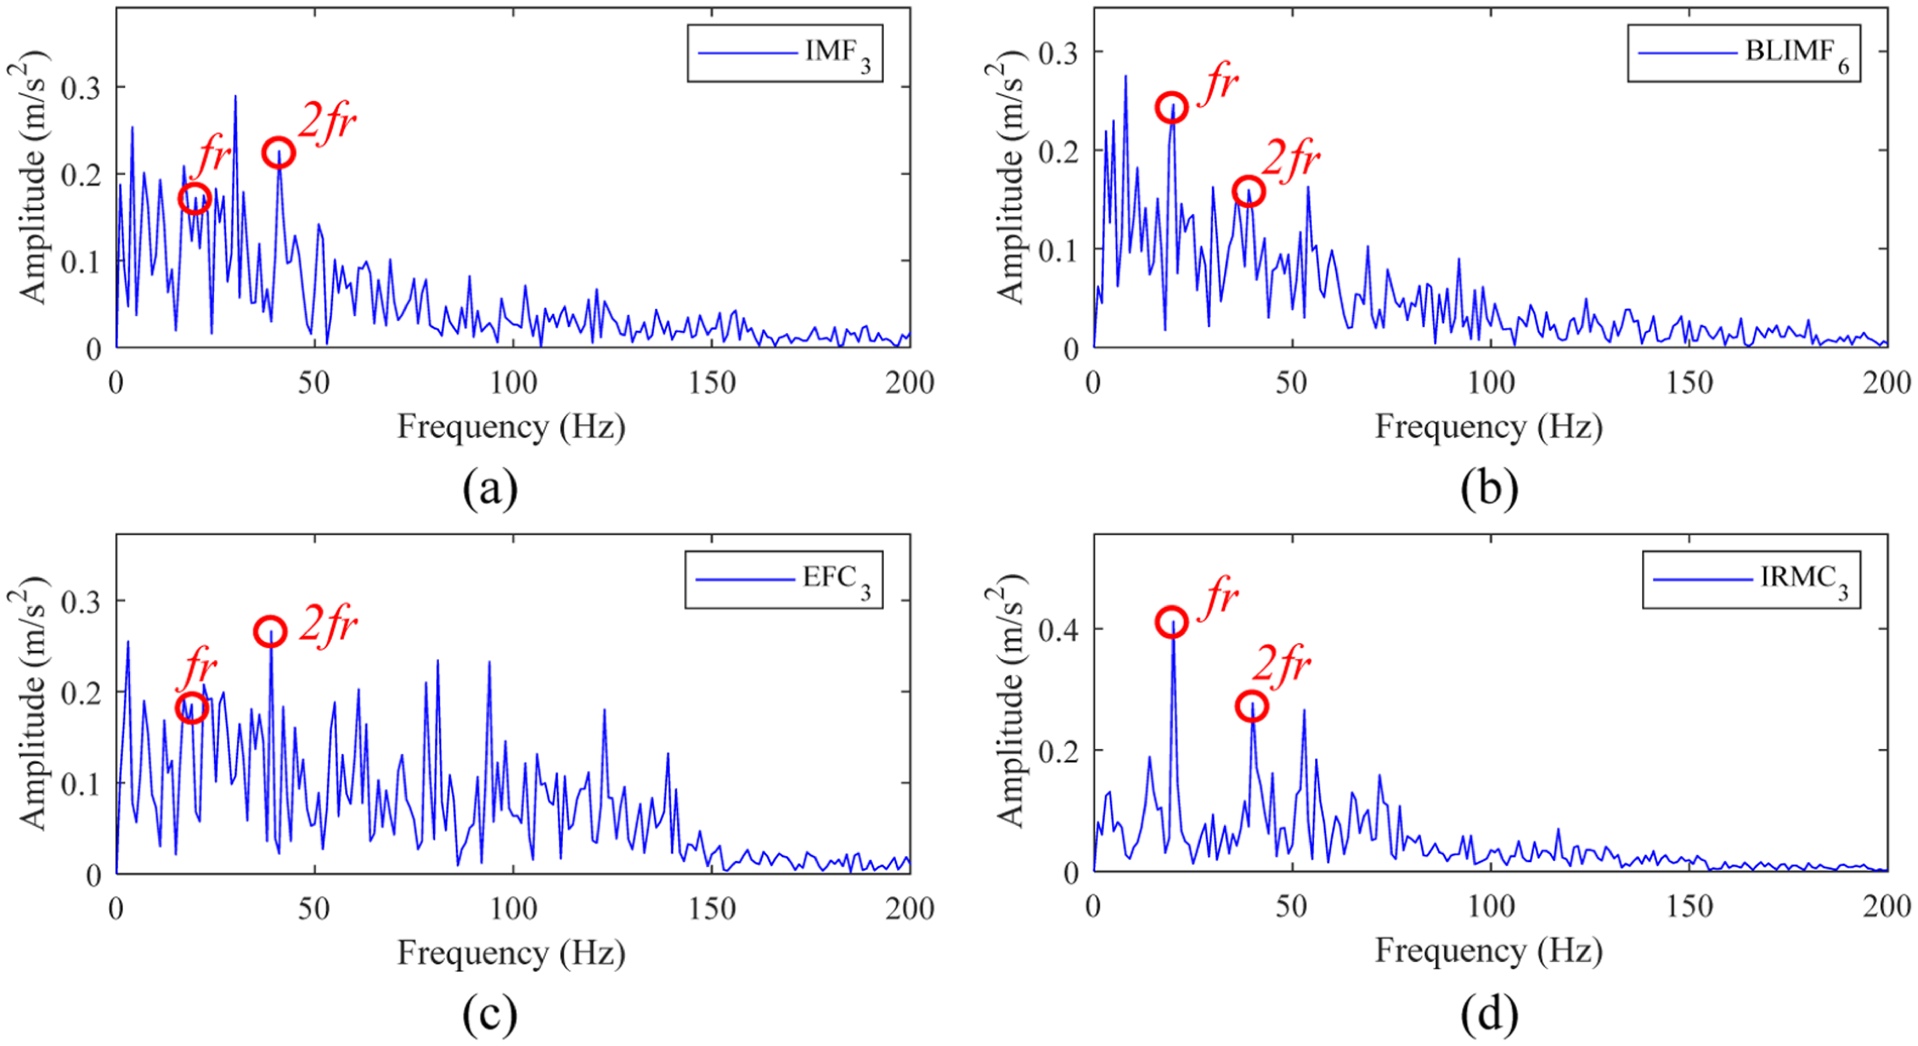
Envelope spectra of the dominant components of different methods: (a) EEMD, (b) VMD, (c) EFD, and (d) SDRFD. EEMD: ensemble empirical mode decomposition; VMD: variational mode decomposition; EFD: empirical Fourier decomposition; SDRFD: spectral denoising random feature decomposition.
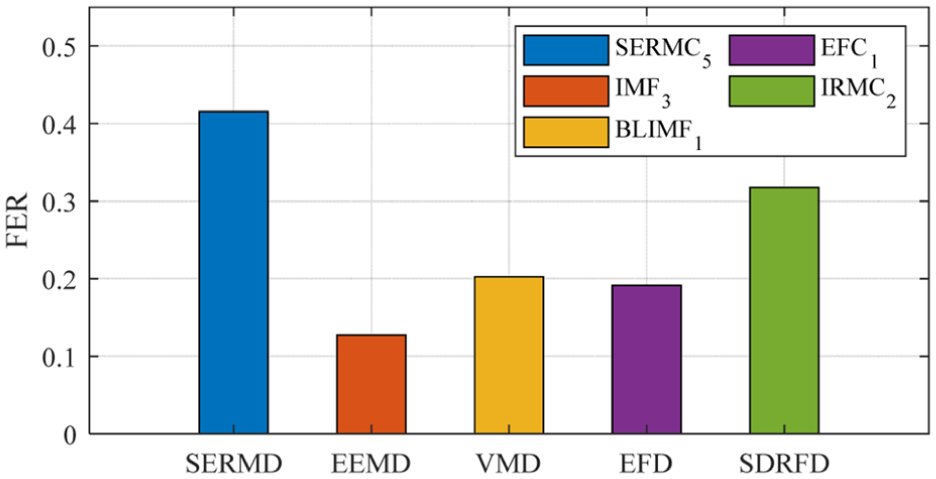
To achieve a more specific quantitative comparison, this study selects the feature energy ratio (FER) 36 as the evaluation metric, and its mathematical formulation is as follows:

where
Eventually, the FER of the diagnostic result of each method in Figures 6 and 10 are presented in Figure 11. Notably, SERMD yields the highest FER, indicating its superior performance in accurately extracting gear fault components compared to the other four approaches.

FER of the diagnostic result of each method. FER: feature energy ratio.
Experiment verification
Case 1
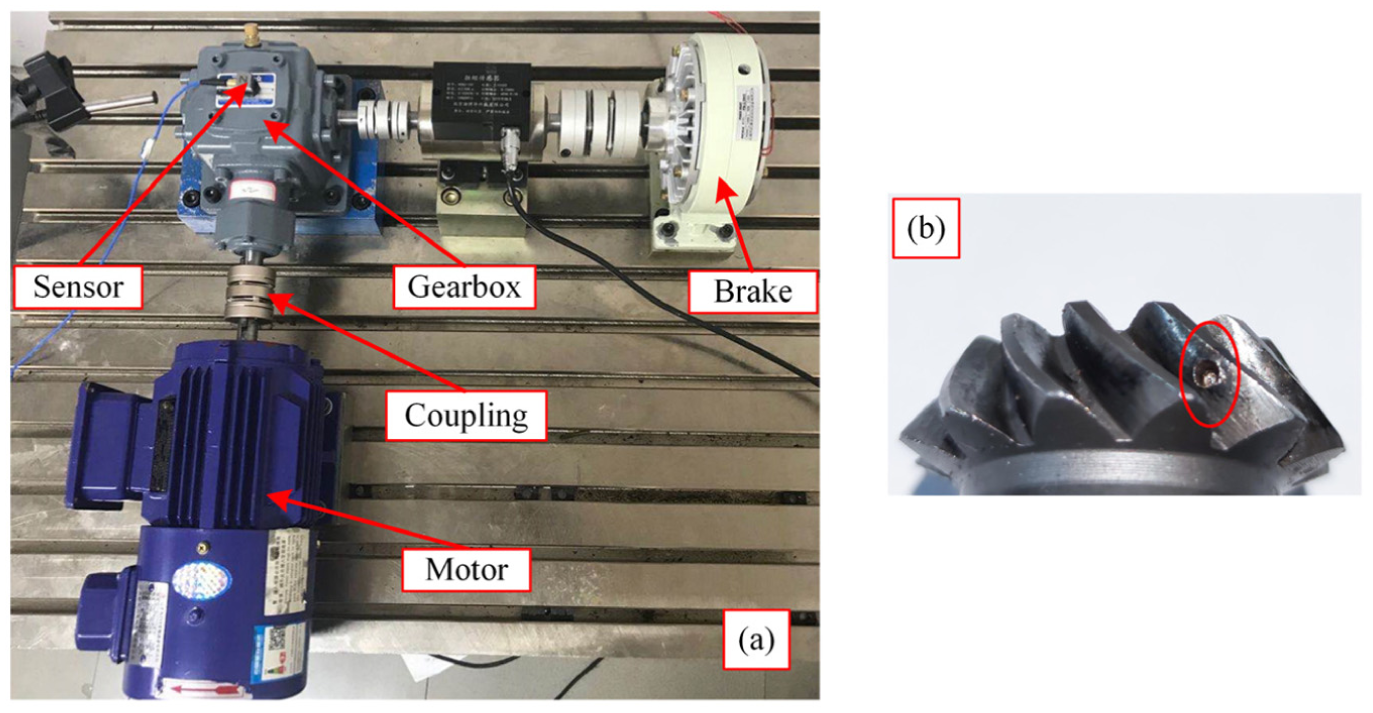
This section further validates the effectiveness and superiority of SERMD using the vibration signal acquired from the spur bevel gear experimental platform. The experimental platform and the faulty gear are shown in Figure 12. In the experimental platform, the driving gear and driven gear have 18 and 36 teeth, respectively. During testing, the driving gear is seeded with a crack fault, while the motor speed is maintained at 1200 rpm. In addition, multiple acceleration sensors are mounted on the bearing housing to acquire vibration signals at a sampling frequency of 4096 Hz. On this basis, the acquired signals are transmitted to the PC via the LMS SCM09 data acquisition system made by Siemens. In this section, we analyze the signal collected by the sensor positioned near the driving gear, as indicated by the red arrow in Figure 12(a).
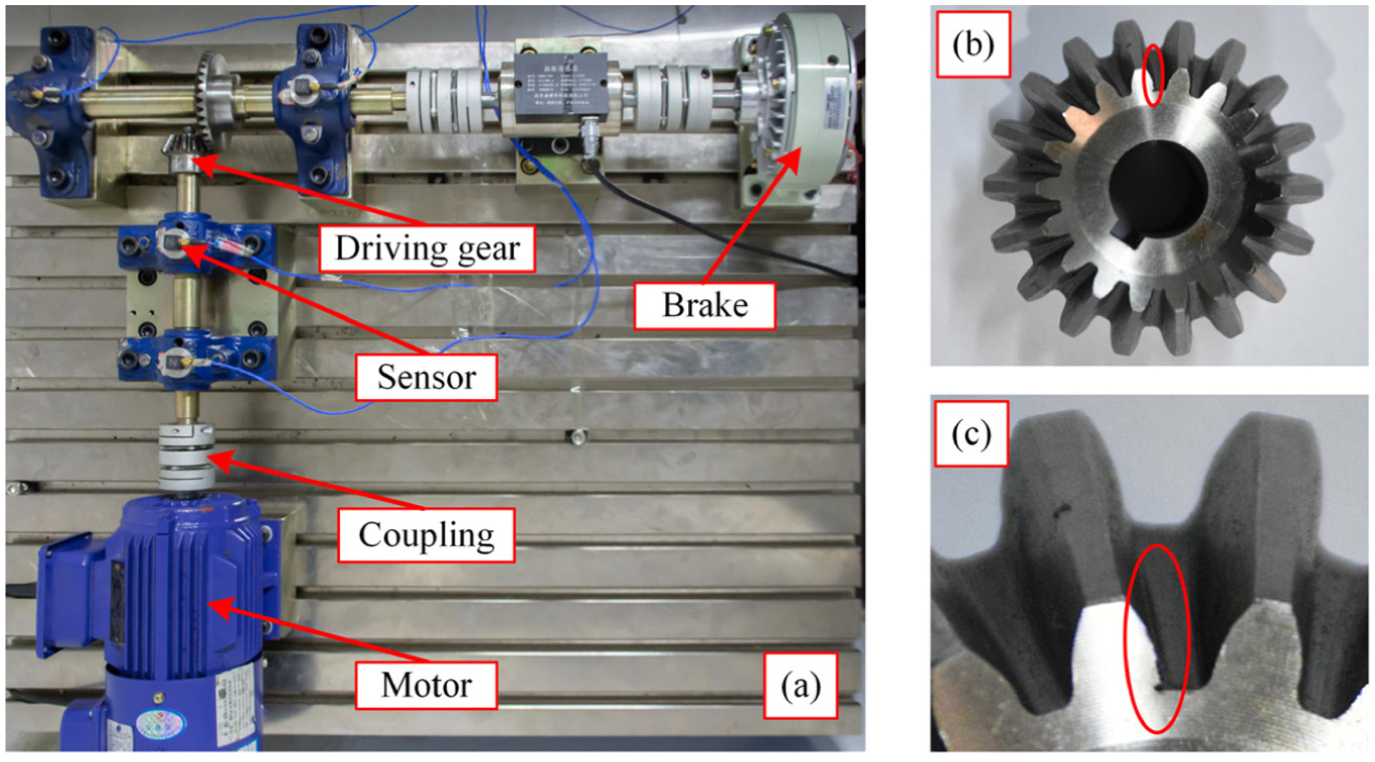
(a) Spur bevel gear experimental platform, (b) driving gear with crack fault, and (c) local enlargement of (b).
According to the calculation, the fault characteristic frequency f r of the gear is determined to be 20 Hz. Figure 13 displays the waveform and ES of the gear fault signal acquired during testing. Notably, the waveform and ES of the raw signal are dominated by substantial interference components, leaving no identifiable fault-related features.
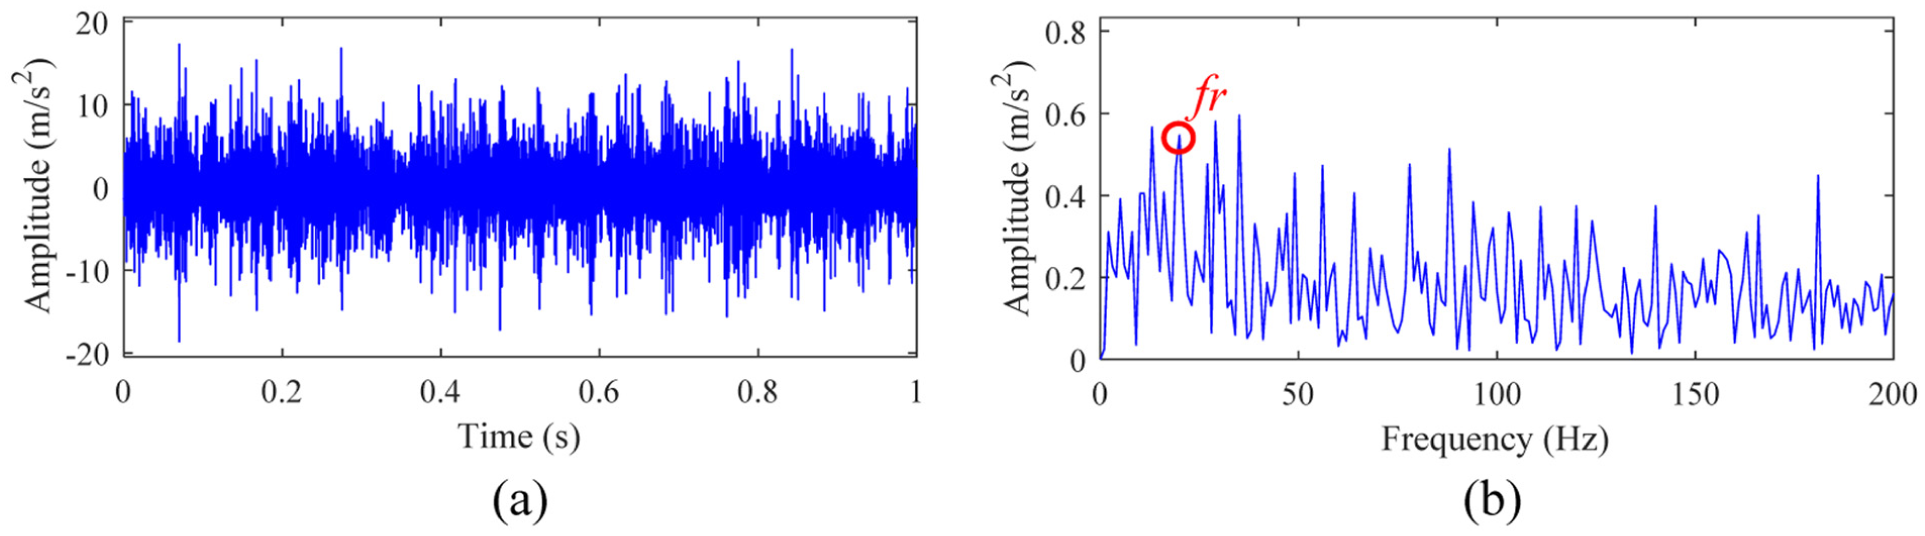
Experimental signal: (a) waveform and (b) ES. ES: envelope spectrum.
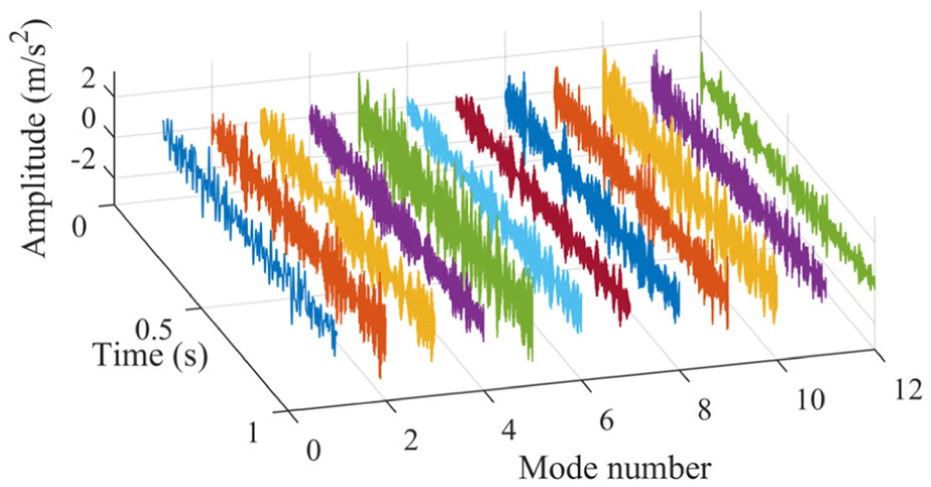
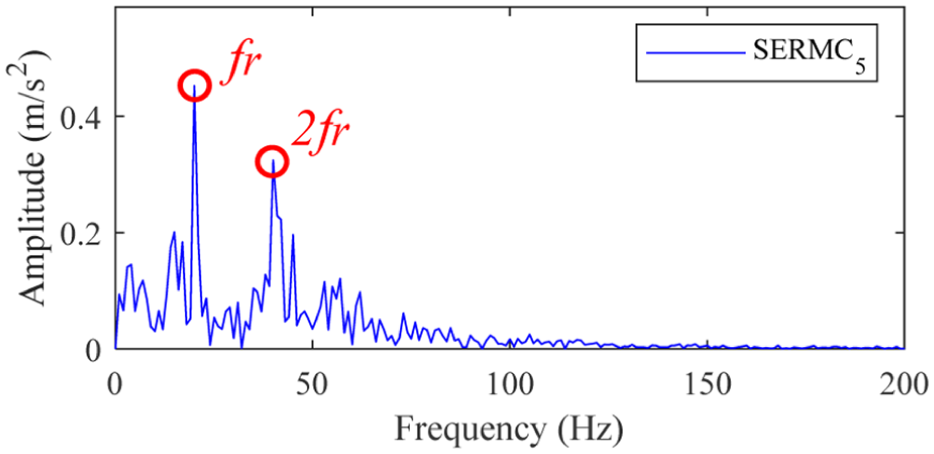
First, SERMD is employed to analyze the acquired vibration signal, and the resulting waveforms of the mode components are presented in Figure 14. Evidently, certain components exhibit relatively distinct periodic modulation characteristics. To further ascertain whether these characteristics stem from gear fault, ES analysis is conducted on the mode components shown in Figure 14. Subsequently, the ES of the dominant component with obvious fault frequencies is displayed in Figure 15. Notably, the f r and 2f r are extremely prominent, while irrelevant spectral components are effectively removed. This conclusively validates the effectiveness of SERMD in extracting gear fault components. Ultimately, by combining the obtained fault frequency features, we can precisely diagnose gear fault.
Waveforms of the mode components obtained via SERMD. SERMD: spectral editing random mode decomposition.
ES of the dominant component of SERMD. ES: envelope spectrum; SERMD: spectral editing random mode decomposition.
As a comparison, the EEMD, VMD, EFD, and SDRFD methods are employed to analyze the acquired vibration signal, with the waveforms of their mode components shown in Figure 16(a) to (d), respectively. Building upon this, by conducting ES analysis on the mode components in Figure 16 and observing the fault frequency features in different envelope spectra, and the envelope spectra of the dominant components of four approaches are presented in Figure 17(a) to (d). From Figure 17(a), it can be observed that the frequency bands on the left side of the f r and the right side of 2f r remain contaminated by significant interfering spectral lines, demonstrating that EEMD fails to accurately extract fault components. In Figure 17(b), while the f r is clearly identifiable, the 2f r remains indistinguishable, indicating that VMD fails to comprehensively extract fault information. Similarly, Figure 17(c) reveals that although f r is detectable, substantial interfering components persist on the left side of 2f r . In Figure 17(d), the amplitude of the f r is relatively weak, with numerous prominent interference lines still present throughout the spectrum. The comprehensive analysis above proves that SERMD exhibits superior performance in gear fault diagnosis.
Waveforms of the mode components obtained via different methods: (a) EEMD, (b) VMD, (c) EFD, and (d) SDRFD. EEMD: ensemble empirical mode decomposition; VMD: variational mode decomposition; EFD: empirical Fourier decomposition; SDRFD: spectral denoising random feature decomposition.
Envelope spectra of the dominant components of different methods: (a) EEMD, (b) VMD, (c) EFD, and (d) SDRFD. EEMD: ensemble empirical mode decomposition; VMD: variational mode decomposition; EFD: empirical Fourier decomposition; SDRFD: spectral denoising random feature decomposition.
To quantitatively evaluate the performance of each method, the FER of the diagnostic result of each method in Figures 15 and 17 are presented in Figure 18. Notably, the diagnostic result of SERMD achieves the highest FER, demonstrating its superior capability in accurately extracting gear fault components compared to the other four approaches.
FER of the diagnostic result of each method. FER: feature energy ratio.
Case 2
This section validates the effectiveness and superiority of SERMD using the vibration signal acquired from the spiral bevel gear experimental platform. Figure 19 shows the experimental platform and faulty gear. The gearbox depicted in Figure 19(a) contains a driving gear with 12 teeth and a driven gear with 24 teeth. During testing, the driving gear is seeded with a pitting fault, while the motor speed is maintained at 900 rpm. In addition, the actual gear fault vibration signal is acquired by mounting an acceleration sensor on the gearbox housing with a sampling frequency set to 4096 Hz. Simultaneously, the collected signal is transmitted to the PC via the LMS SCM09 data acquisition system.
(a) Spiral bevel gear experimental platform and (b) driving gear with pitting fault.
According to the calculation, the fault characteristic frequency f r of the gear is determined to be 15 Hz. Figure 20 presents the waveform and ES of the gear fault signal recorded in the experiment. It is noteworthy that the waveform and ES of the raw signal exhibit significant background noise components, rendering gear fault-related features indistinguishable.
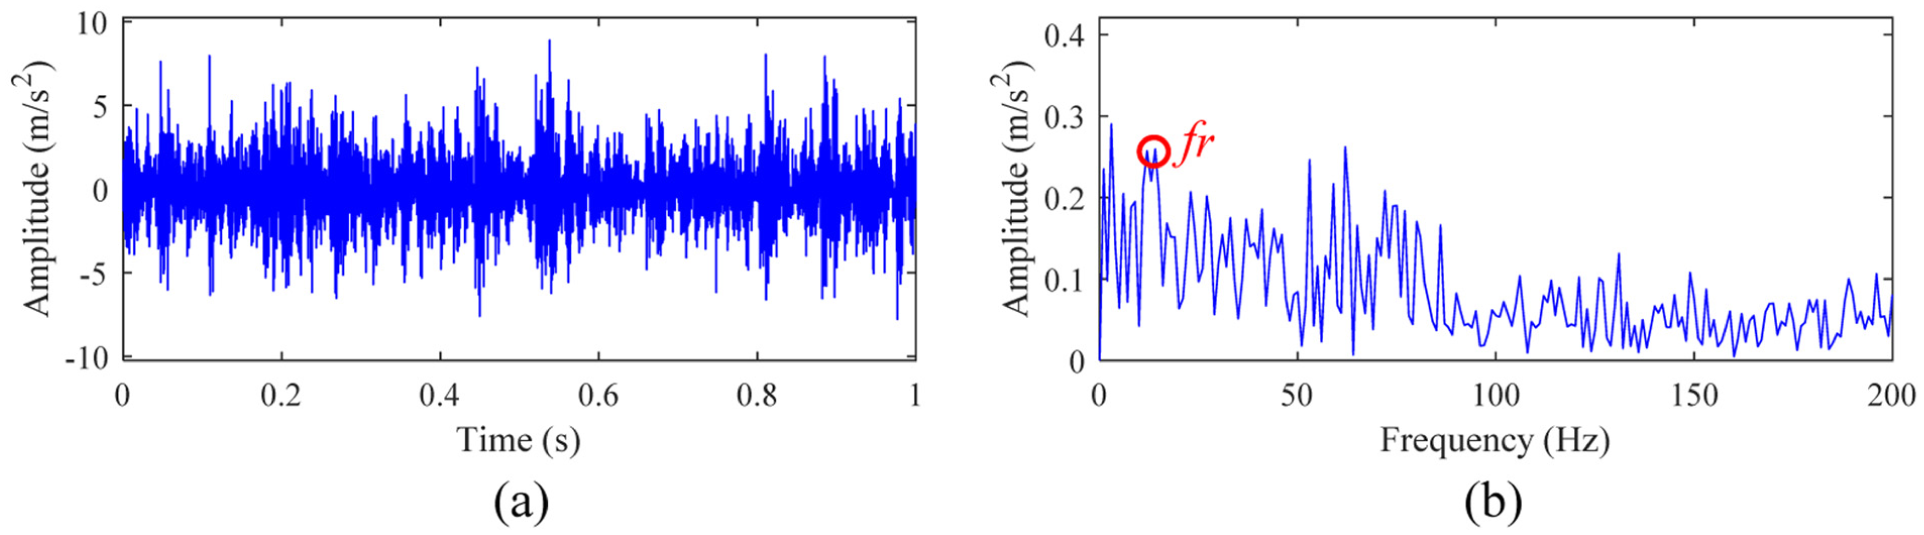
Experimental signal: (a) waveform and (b) ES. ES: envelope spectrum.
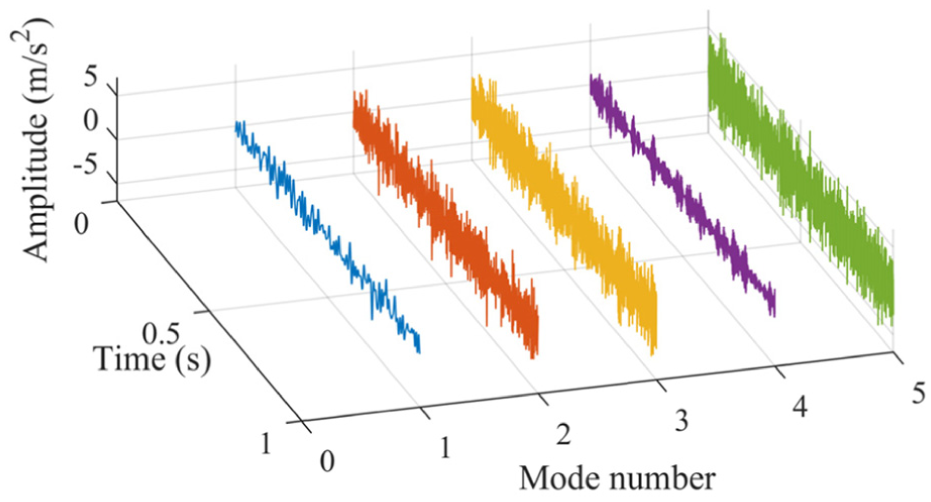
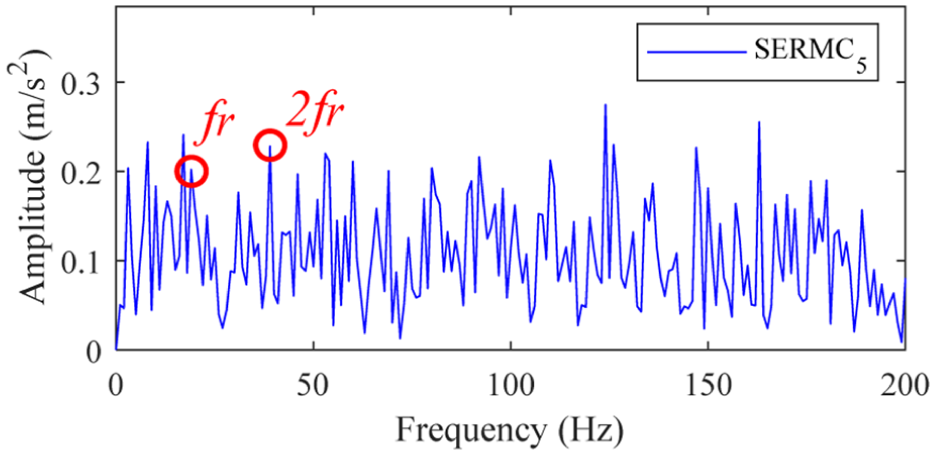
First, SERMD is employed to analyze the experimentally recorded vibration signal, and the resulting waveforms of the mode components are presented in Figure 21. Notably, certain components exhibit relatively distinct periodic modulation characteristics. Subsequently, to further determine whether these characteristics are related to gear fault, ES analysis is conducted on the mode components in Figure 21. The ES of the dominant component with prominent fault frequencies is plotted in Figure 22. It is noteworthy that the f r –3f r are extremely obvious and dominant in ES, indicating that SERMD effectively extracts the fault components. Ultimately, by combining these extracted fault frequency features, we can accurately diagnose gear fault.
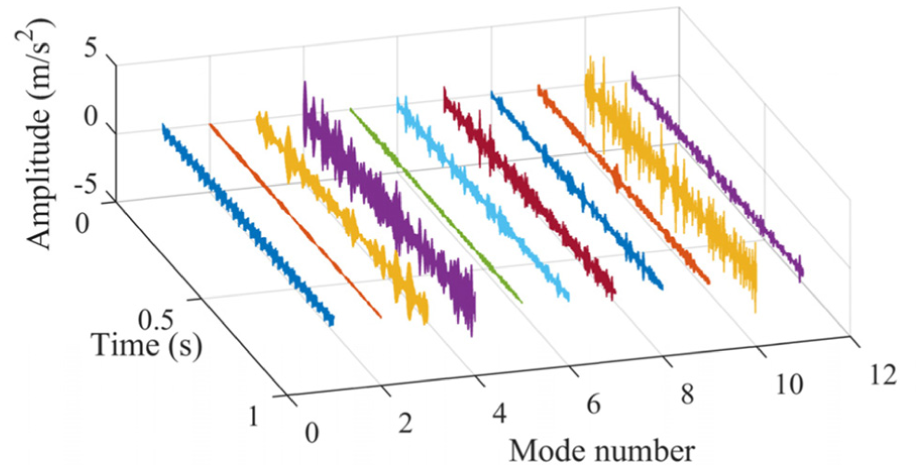
Waveforms of the mode components obtained via SERMD. SERMD: spectral editing random mode decomposition.
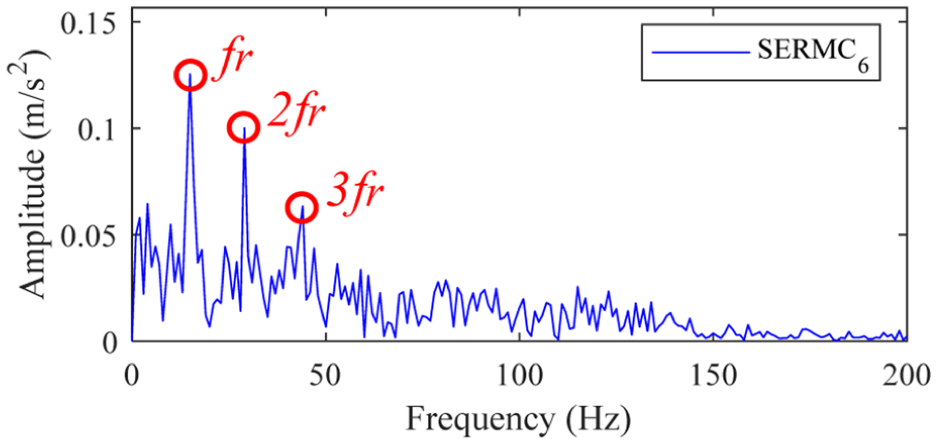
ES of the dominant component of SERMD. ES: envelope spectrum; SERMD: spectral editing random mode decomposition.
As a comparison, EEMD, VMD, EFD, and SDRFD are employed to process the experimentally recorded vibration signal, with the waveforms of their respective mode components presented in Figure 23(a) to (d). Subsequently, by conducting ES analysis on the mode components in Figure 23 and observing the fault frequency features in different envelope spectra, and the envelope spectra of the dominant components of four approaches are presented in Figure 24(a) to (d). From Figure 24(a), it can be observed that the f r –3f r remain obscured by interference frequency components, indicating that EEMD fails to accurately separate the fault components. In Figure 24(b), the 2f r and 3f r are undetectable, indicating that VMD fails to fully extract fault information. In Figure 24(c), numerous interference frequency components persist on the left side of the f r , while the 2f r and 3f r remain undetectable. Besides, the result is presented in Figure 24(d) exhibits similar limitations to those observed in Figure 24(b). The comprehensive analysis above proves that SERMD exhibits superior performance in gear fault diagnosis.
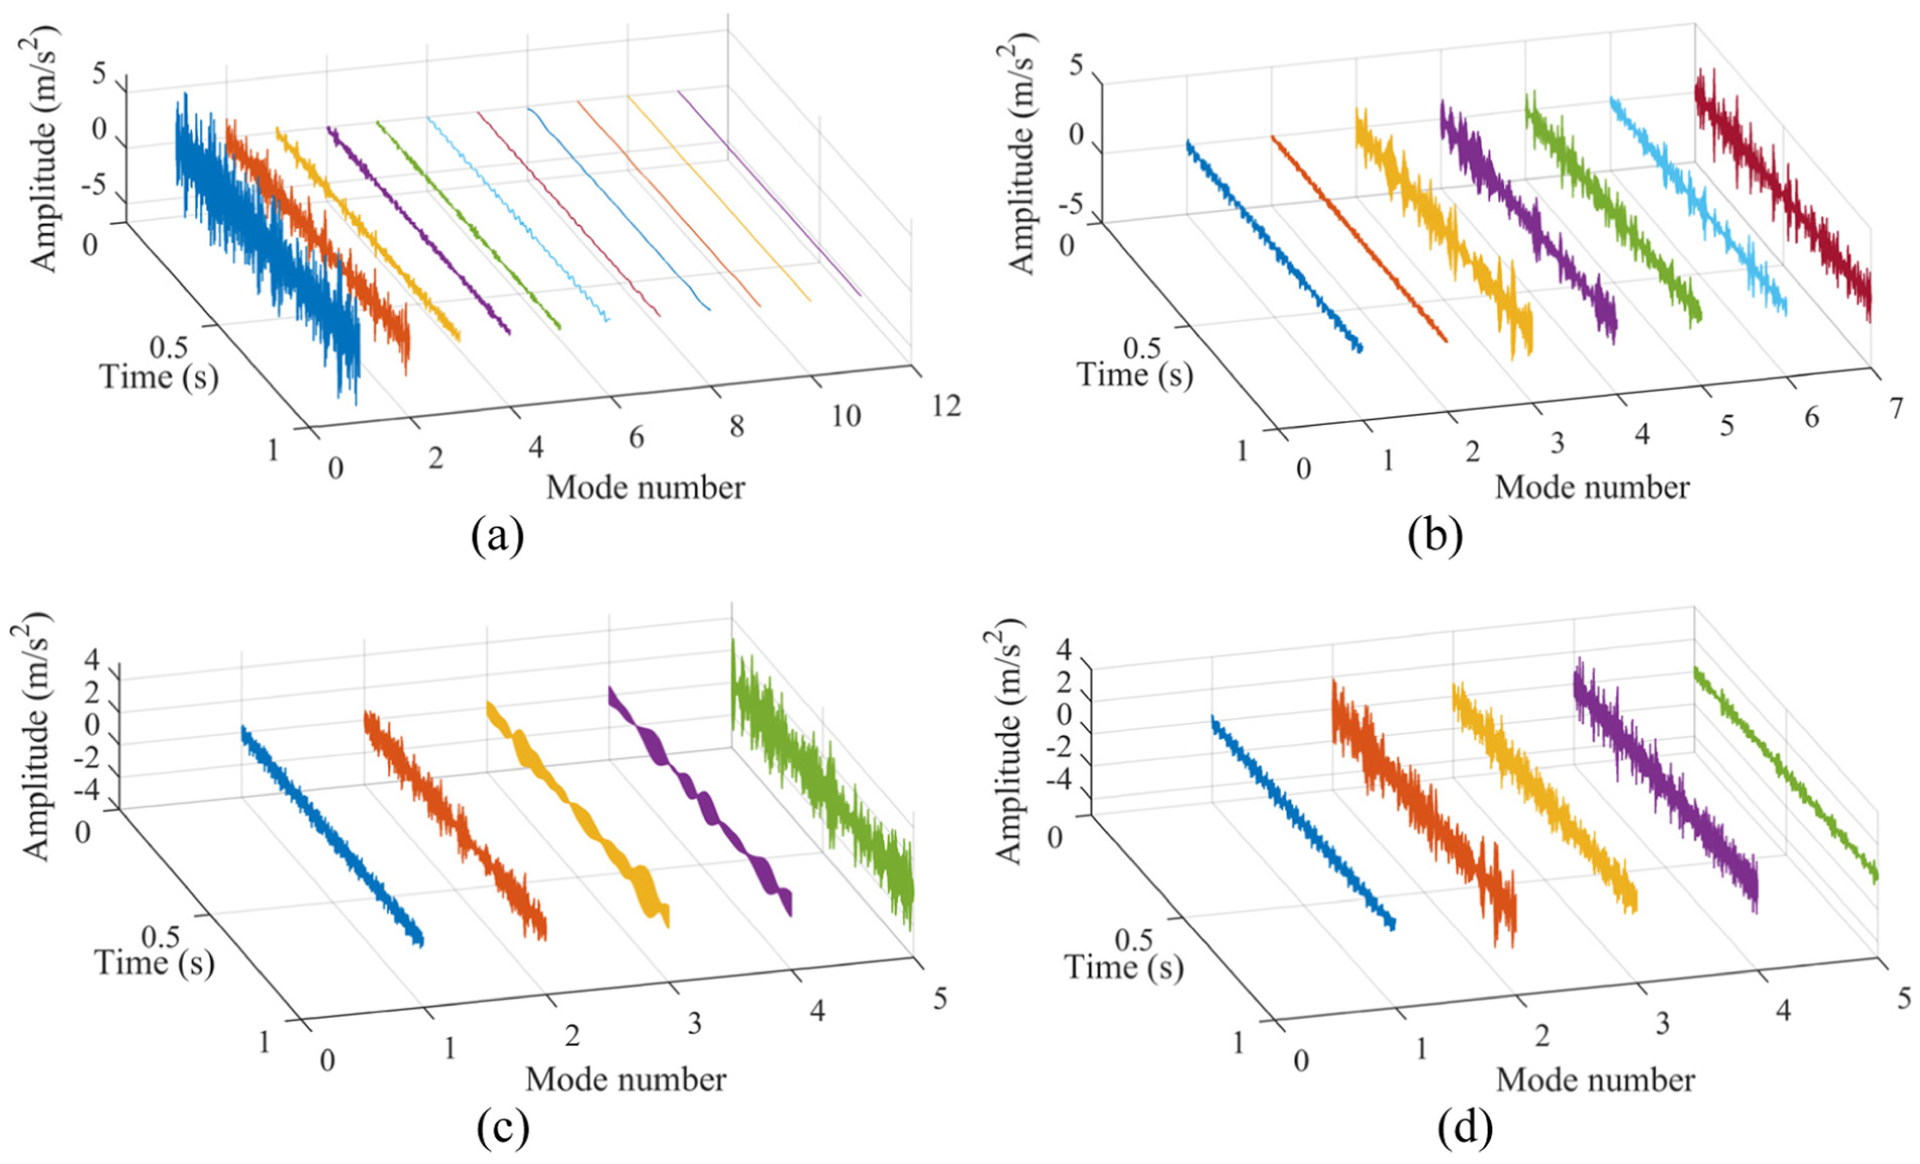
Waveforms of mode components obtained via different methods: (a) EEMD, (b) VMD, (c) EFD and (d) SDRFD. EEMD: ensemble empirical mode decomposition; VMD: variational mode decomposition; EFD: empirical Fourier decomposition; SDRFD: spectral denoising random feature decomposition.
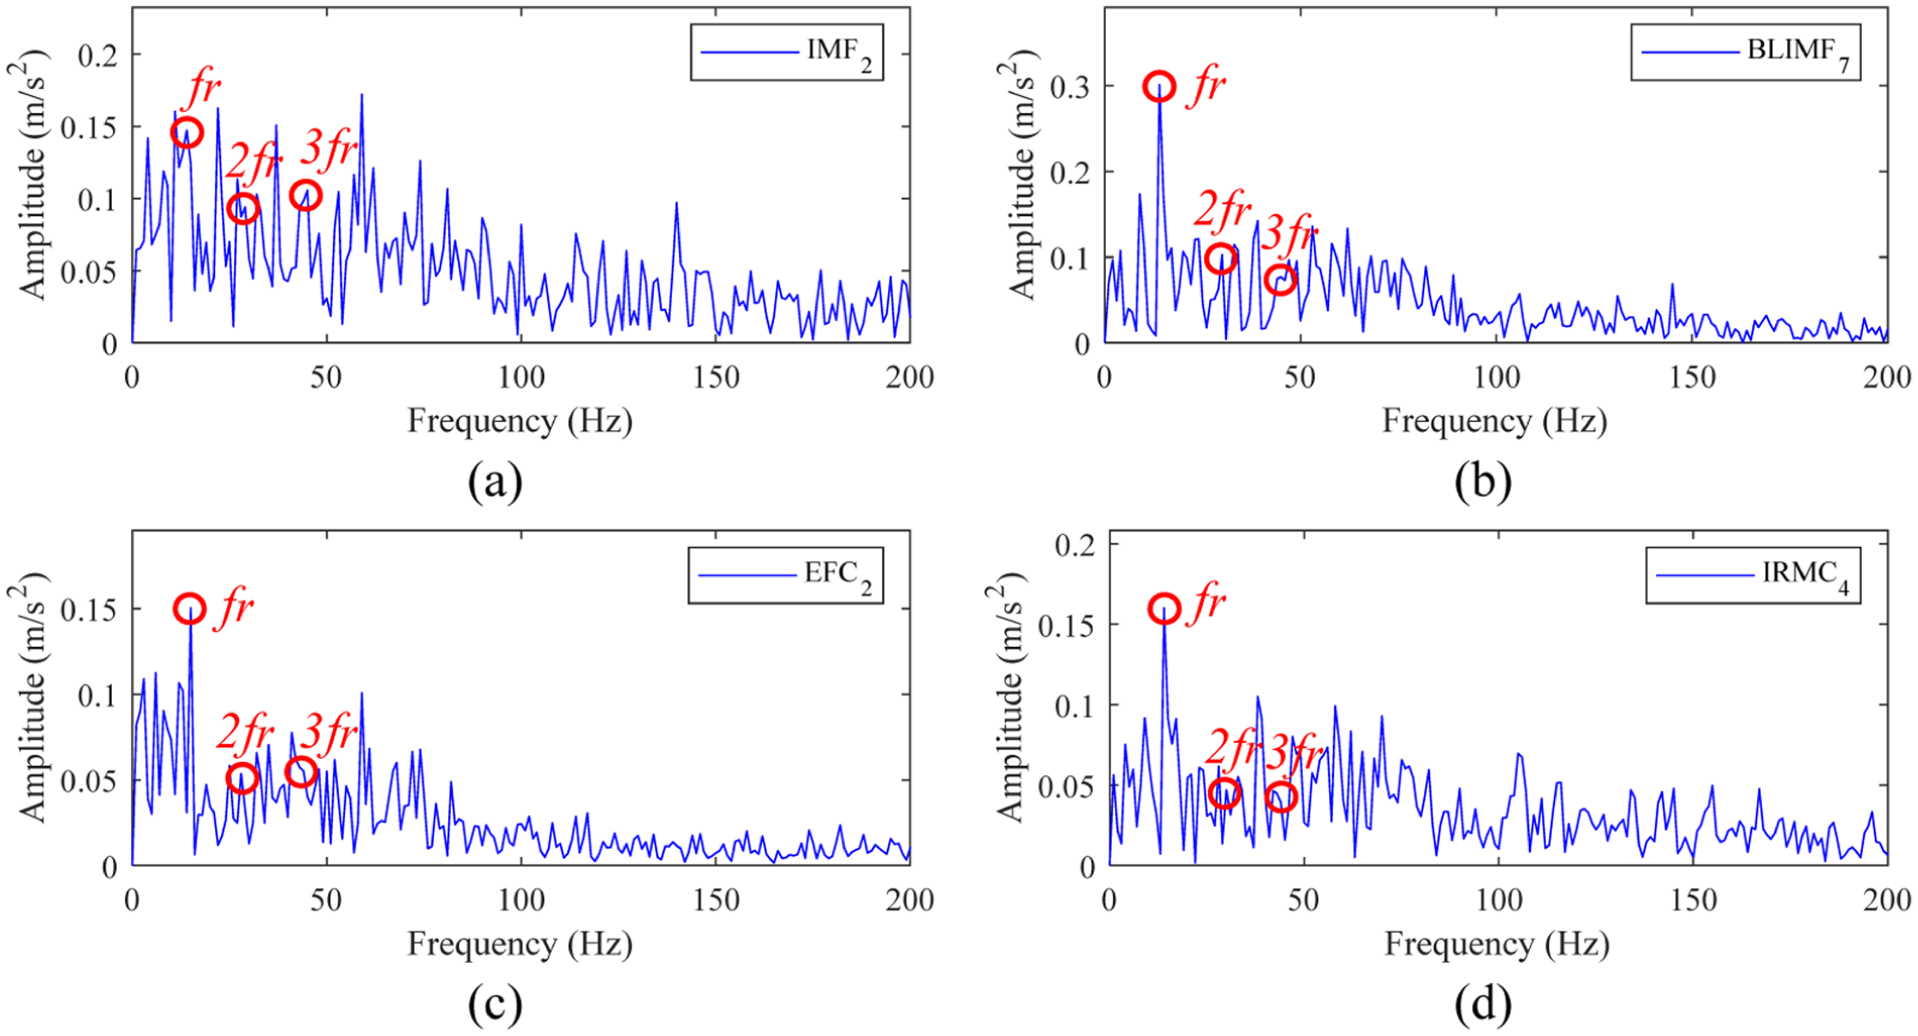
Envelope spectra of the dominant components of different methods: (a) EEMD, (b) VMD, (c) EFD and (d) SDRFD. EEMD: ensemble empirical mode decomposition; VMD: variational mode decomposition; EFD: empirical Fourier decomposition; SDRFD: spectral denoising random feature decomposition.
To quantitatively evaluate the performance of each method, the FER of the diagnostic result of each method in Figures 22 and 24 are presented in Figure 25. Notably, the diagnostic result of SERMD achieves the highest FER, demonstrating its superior capability in accurately extracting gear fault components compared to the other four approaches.
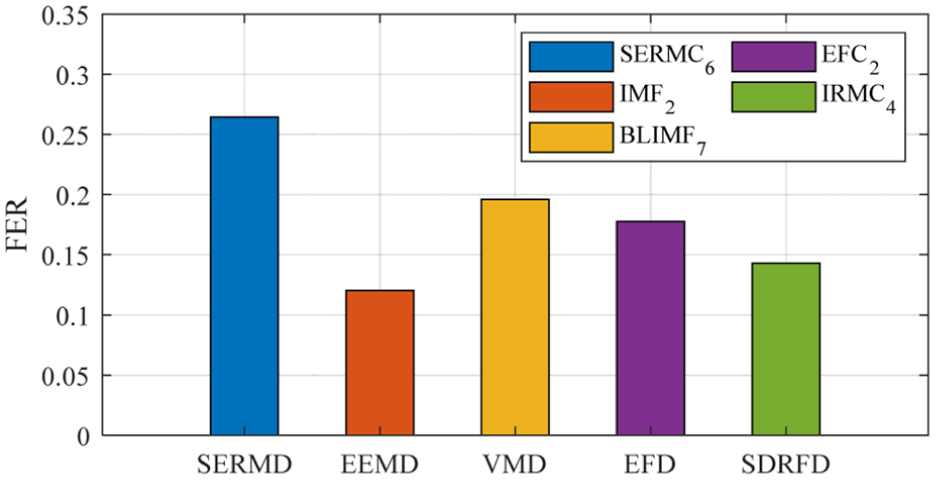
FER of the diagnostic result of each method. FER: feature energy ratio.
Conclusion
This study proposes a novel signal decomposition algorithm, namely SERMD, for gear fault diagnosis. This algorithm first constructs the random feature energy spectrum of the signal by leveraging sparse random feature expansion as a bridge, which completes the conversion of the signal from the time domain to the frequency domain from a new perspective. Second, the designed spectral editing strategy not only finely attenuates the noise components in the spectrum by gradually adjusting the amplitude of the spectrum but also enhances the diversity of the spectrum, thereby providing a basis for accurate division of the frequency bands of interest. Then, based on the empirical optimal envelope, the proposed bandwidth-constrained spectral trend segmentation technique can significantly reduce the number of extreme points in the spectrum and adaptively obtain accurate segmentation boundaries of the spectrum, thereby ensuring the integrity of fault information within the frequency bands. Building upon this foundation, the designed adaptive mode extraction strategy with frequency band compensation not only prevents the loss of fault-related frequency bands but also achieves accurate separation of components with rich periodic fault information. Finally, the effectiveness of SERMD is verified via simulated signal and experimentally acquired gear fault signals. Moreover, the comparative analysis demonstrates that SERMD exhibits superior performance in gear fault diagnosis.
In future work, we will further verify the feasibility and applicability of SERMD in other fault diagnosis tasks of rotating machinery and make corresponding adjustments to the framework of SERMD.
Footnotes
Declaration of conflicting interests
The authors declared no potential conflicts of interest with respect to the research, authorship, and/or publication of this article.
Funding
The authors disclosed receipt of the following financial support for the research, authorship, and/or publication of this article: This research is supported by the National Natural Science Foundation of China (grant no. 52275103) and Postgraduate Scientific Research Innovation Project of Hunan Province (grant no. CX20240398).