
Abstract
To enhance the efficiency and intelligence of bridge operation and maintenance (O&M), this study proposes and validates a digital twin (DT) framework for long-span cable-stayed bridges, in which O&M data are integrated into bridge information modeling (BrIM) to realize comprehensive digital management. The main contributions are as follows: (1) A DT framework is established based on automated geometric modeling and the deep integration of inspection and monitoring data, enabling the synchronization of multi-source physical data with the digital model; (2) An efficient bridge modeling method is developed using Dynamo visual programming to achieve parameterized modeling. Compared with manual modeling, the proposed method reduces modeling time from approximately 240 to 180 min while allowing flexible modification of model parameters; (3) To address the insufficient integration of inspection/monitoring information with BrIM digitalization, a dynamic correlation and visualization method for bridge inspection and monitoring data is introduced, enabling simultaneous fusion of inspection and monitoring data. For inspection data fusion, the processing time is approximately 2 min, with dynamic updating supported; for monitoring data fusion, the processing time is shortened from ≥10 min to approximately 1 min, while editable data are maintained, demonstrating significant improvements in both efficiency and flexibility. Finally, the feasibility and effectiveness of the proposed framework are validated through a case study of the Second Nanjing Yangtze River Bridge. The proposed modeling and data fusion approach optimizes the workflow for complex bridge structures, reduces human intervention, and provides a reference for intelligent O&M of long-span bridges.
Keywords
Highlights
A digital twin framework integrating inspection and monitoring data with building information modeling (BIM) for cable-stayed bridges.
Automated BIM modeling utilizing point cloud data and Dynamo visual programming.
Dynamic data correlation and visualization for bridge inspection and monitoring data in BIM.
Deep learning-driven automatic defect segmentation and quantitative analysis for bridges.
Real-time BIM integration with monitoring data and an automated early warning system.
Introduction
Bridges are essential infrastructure whose safety and functionality significantly influence socio-economic development. They are continuously exposed to environmental and operational loads, which induce fatigue, defect propagation, and material degradation, leading to gradual performance deterioration. In China, approximately one-third of expressway bridges have been reported to exhibit structural defects, 1 while in Japan, 39% of bridges have been in service for over 50 years, 2 and in the United States, 7.5% of bridges are classified as structurally deficient. 3 Therefore, the structural conditions of bridges must be inspected and monitored to determine the types, locations, and severity of defects, thereby providing a scientific basis for maintenance and management decisions. 4
In recent years, structural intelligent inspection and health monitoring technologies have attracted increasing attention. Traditional manual inspections, though labor-intensive and time-consuming, have provided a crucial basis for structural assessment. Recently, rapid non-contact inspection methods have been developed, including unmanned aerial vehicle (UAV) systems, 5 vision-based scanning robots, 6 and cable robots. 7 Intelligent inspection algorithms have primarily focused on deep learning-based recognition, 8 semantic segmentation, 9 and corresponding localization and quantification methods.10,11 The rapid advancement of structural health monitoring (SHM) technologies has enabled enhanced perception of bridge conditions. Traditional methods have primarily relied on contact-based sensors, including accelerometers, displacement sensors, and strain gauges, which are installed on or within structures to capture real-time responses. Recently, non-contact approaches such as visual monitoring,12–14 microwave radar, 15 and non-destructive testing16–18 have been increasingly applied. The integration of Internet of Things (IoT), cloud computing, and artificial intelligence has further facilitated intelligent management and real-time analysis of monitoring data. Despite these developments, research on the integrated use of SHM and inspection data remains limited.
Building information modeling (BIM) serves as a key platform for integrating bridge inspection and monitoring data. It has been increasingly applied in bridge engineering to support digital and automated information acquisition. 19 Defined by the National Institute of Building Sciences, BIM is a shared resource for managing bridge information throughout its lifecycle, providing a basis for decision-making from design to demolition. 20 Despite its widespread adoption, integrating multi-source inspection and monitoring data into bridge models remains challenging. BrIM digitalization has evolved from geometric modeling and collision detection 21 to construction management, four-dimensional/five-dimensional optimization,22,23 and intelligent operation and maintenance (O&M). Recent research focuses on combining BIM with point clouds, virtual reality (VR), finite element analysis, and digital twins (DTs) for automated modeling, structural assessment, and maintenance. Methods include slice-based object fitting for DT generation, 24 semantic segmentation for scanning-to-BIM frameworks, 25 and BIM with mixed reality for real-time damage localization. 26 Overall, BIM integration with IoT and DT technologies is advancing bridge engineering toward digital and intelligent transformation.
DT models integrating inspection and monitoring data have received increasing attention. BrIM digitalization technology has progressed from three-dimensional (3D) modeling and information integration to incorporating design details and real-time sensing information.27,28 Current research focuses on geometric information storage, monitoring data management, and inspection data management. BrIM digitalization demonstrates advantages in digitally representing architectural geometry, including length, width, shape, and surface characteristics. Automatic generation of steel structure BrIM digitalization from 3D point cloud data has been proposed to reduce manual intervention. 29 For monitoring data, integration with IoT and DT technologies has been explored to enable efficient management and intelligent analysis, supporting full lifecycle O&M platforms.30,31 In inspection data management, deep learning-based image segmentation and drone imagery have been used to generate BrIM digitalization and integrate 3D defect information automatically. 32 Centralized record management methods and semi-automatic visualization techniques using BrIM digitalization, Dynamo, and point cloud data have enhanced maintenance efficiency and decision-making support.33–35 Integrated defect management combining convolutional neural network (CNNs) and scan-to-BIM has further improved safety inspection reliability. 36 Shim et al. 37 developed a 3D DT for bridge maintenance, combining structural condition data with a geometric model. Nhamage et al. 38 reviewed the evolution from BrIM to bridge DTs, highlighting strategies for asset digitalization and real-time monitoring. Nhamage et al. 39 applied a DT to fatigue assessment in railway bridges, integrating monitoring data with BIM visualization for continuous model updates. These works illustrate the value of combining heterogeneous data in DTs to enhance maintenance and decision-making. Traditionally, bridge inspections and monitoring data have been documented separately, resulting in fragmented geometric, physical, and temporal information. Existing DT approaches mainly integrate only a single type of data and have not yet effectively incorporated both inspection and monitoring data into the DT model.
To address this problem, a novel DT framework for long-span cable-stayed bridges that integrates inspection and monitoring data with automated modeling was proposed in this paper. Through reverse engineering and Dynamo, the paper realizes the transition from bridge scanning to automated bridge information modeling (BrIM), subsequently associating bridge monitoring data and intelligent inspection data, respectively, achieving the fusion of multi-source information and dynamic updating of the BrIM digitalization. Finally, the feasibility of the proposed method is validated through a case study of the Second Nanjing Yangtze River Bridge. The results indicate that the proposed method achieves a deep integration of inspection and monitoring data with information models, and realizes the construction of a complete DT framework from data to models. The remainder of this paper is organized as follows: the first section introduces the research background; the second section presents the innovative concept of the proposed method; the third section describes the bridge DT method integrating inspection and monitoring data with the BrIM digitalization; the fourth section provides an overview of the Second Nanjing Yangtze River Bridge; the fifth section offers a detailed explanation of the proposed method in the context of long-span cable-stayed bridges; and the sixth section concludes the paper.
Proposed frameworks
To address data fragmentation and information silos in traditional bridge inspection and monitoring, this paper proposes a DT methodology for long-span cable-stayed bridges that integrates inspection and monitoring data with automated modeling. Using Dynamo for rapid BrIM digitalization, the approach achieves a deep integration of SHM and intelligent inspection data, supporting full lifecycle bridge management. First, an efficient modeling method in a visual programming environment is proposed: geometric information is obtained through parametric modeling based on bridge drawings, and Dynamo enables rapid BrIM digitalization, enhancing modeling efficiency and enabling digital bridge design and management. As shown in Figure 1, the process consists of automatic modeling and data collection. In the automatic modeling stage, control parameters extracted from bridge drawings are converted into a dot matrix defining geometric references. The points are connected to generate structural axes, followed by the setting of cross-sections based on predefined templates. Stretching and alignment operations are performed to construct the complete 3D geometry, and each component is automatically assigned its corresponding material and attribute information to form a parametric bridge model. In the data collection stage, real-time monitoring data are imported into the model as external control parameters, and system feedback and information correction are conducted to refine model accuracy and parameter integrity.
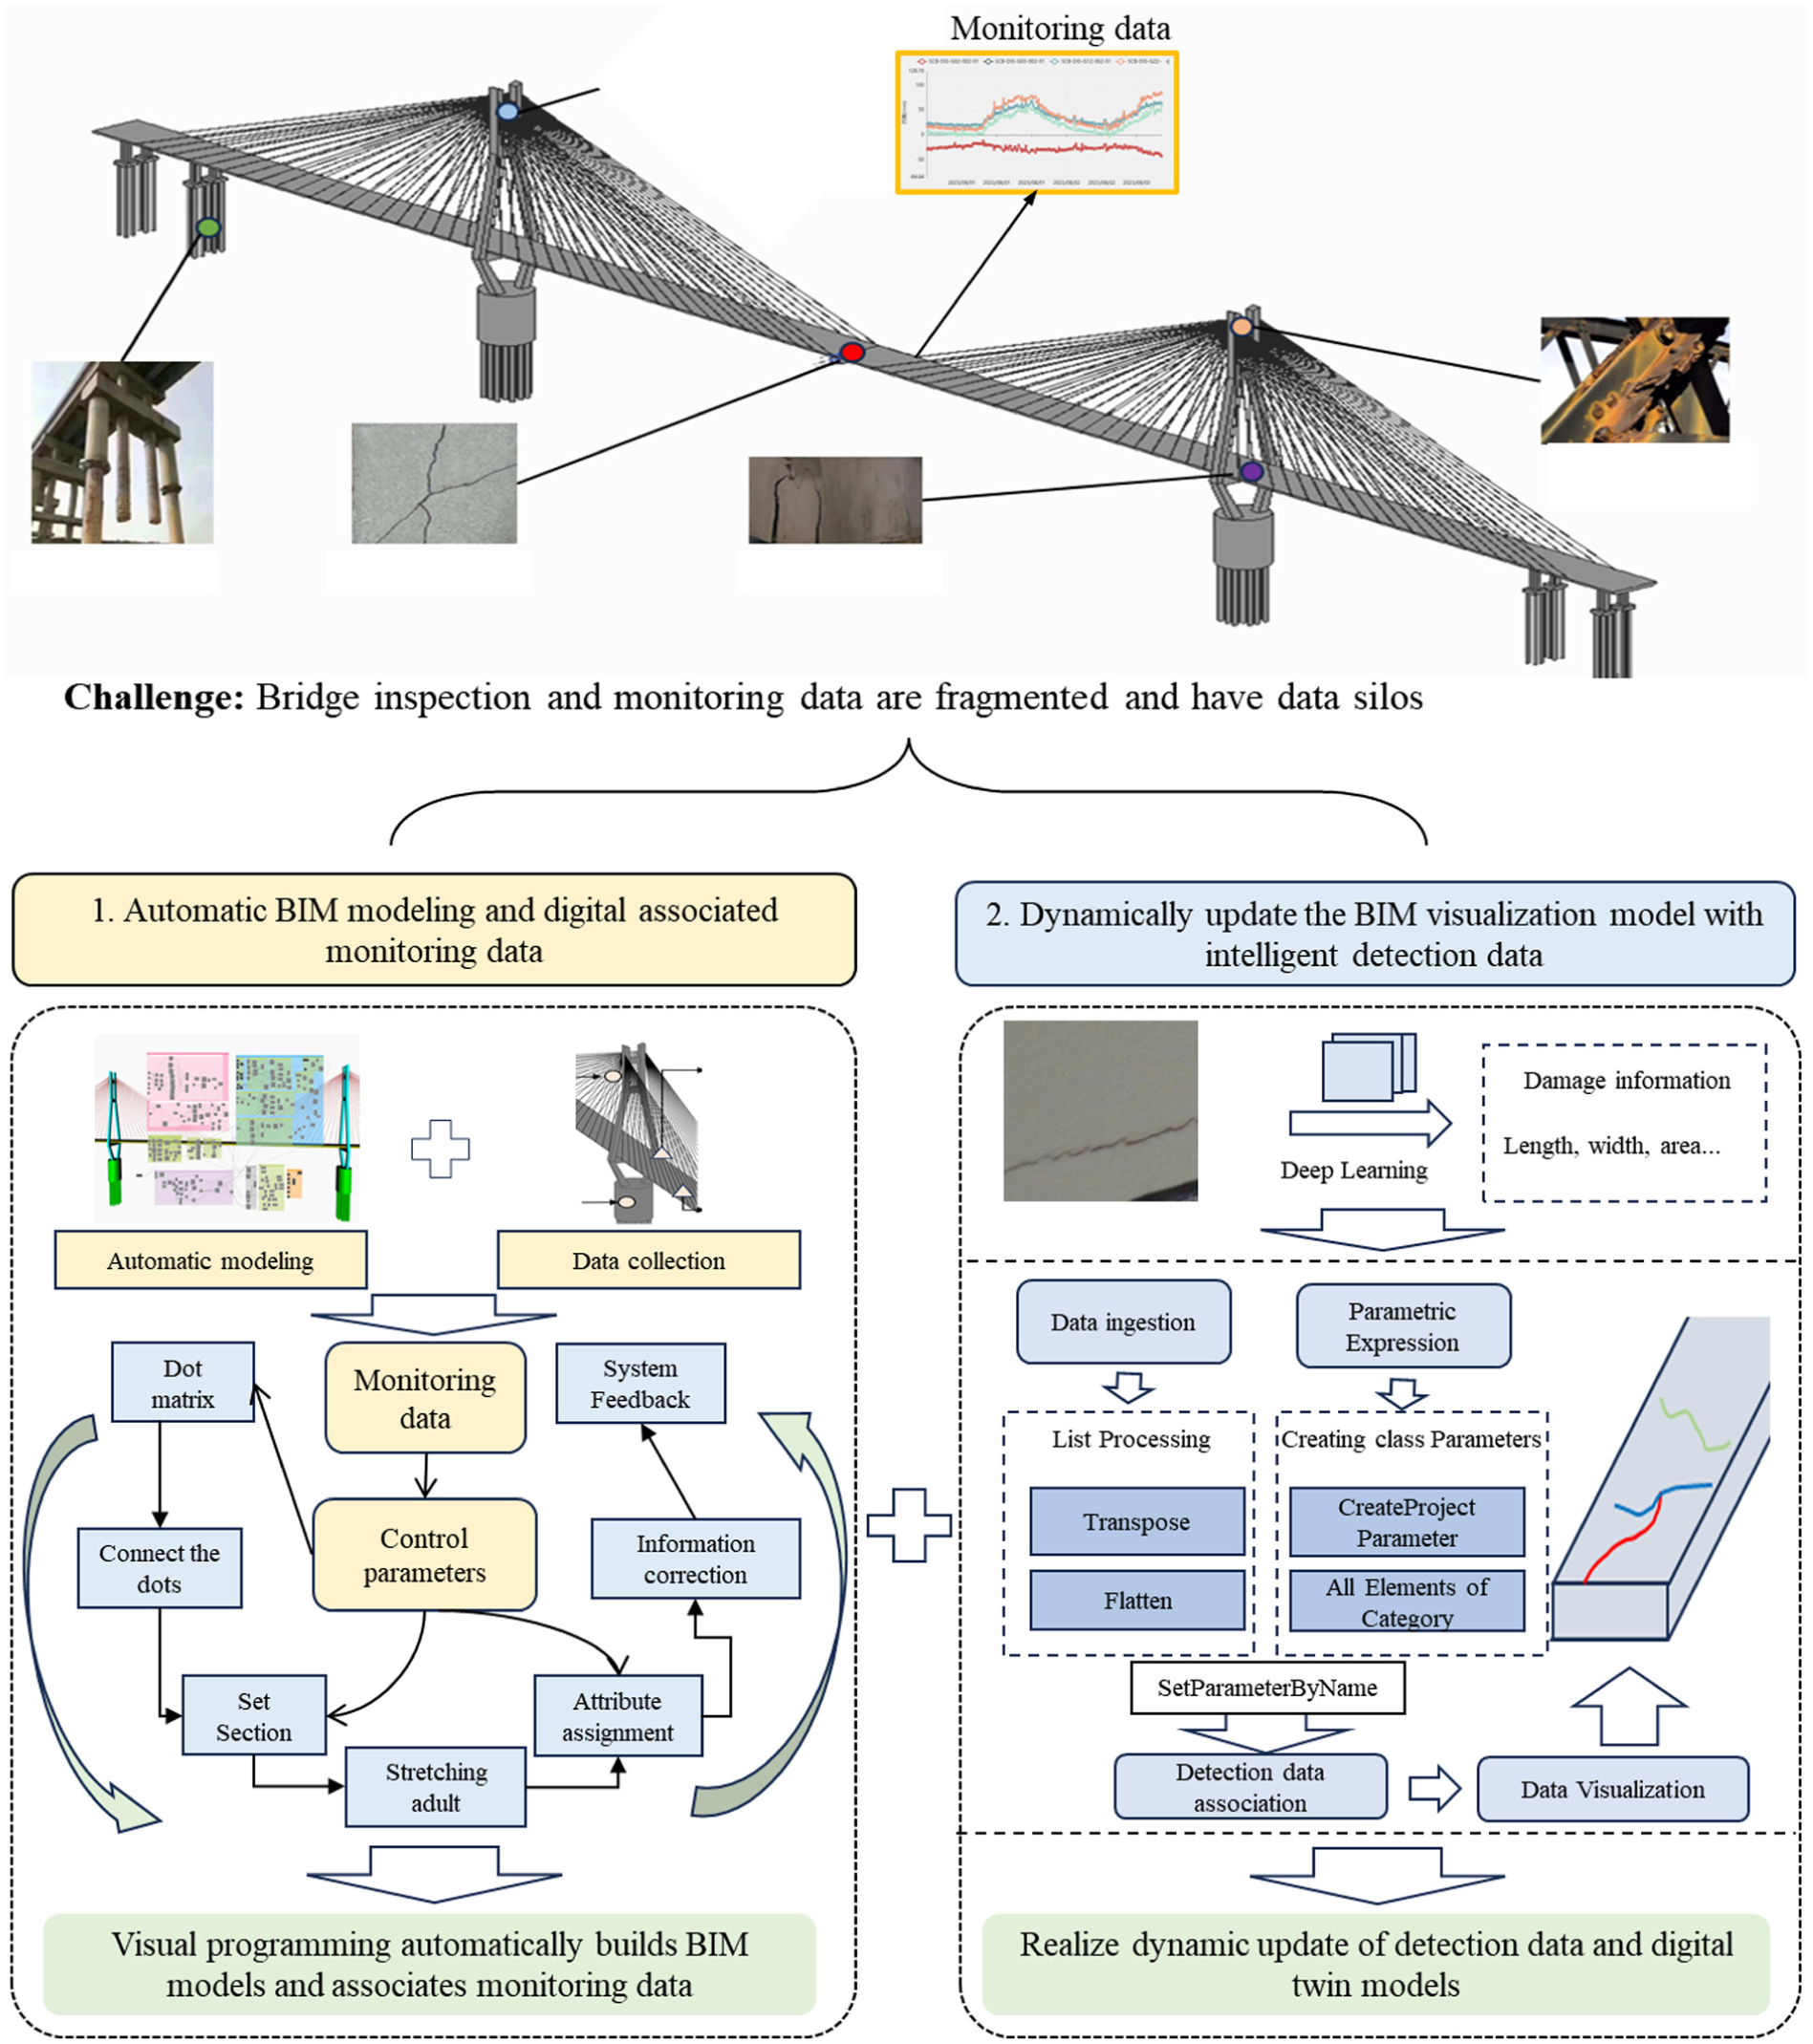
Basic idea of the proposed method.
Second, to link defect detection with inspection data, a dynamic updating and visualization method is introduced. Deep learning algorithms are first employed to extract defect features such as length, width, and area from inspection imagery. The extracted damage information is subsequently ingested into the digital model through a data pipeline in Dynamo. This process involves list processing operations, including data transposition and flattening, which ensure consistency between the structured detection dataset and the model parameters. Parametric expressions are then defined by creating class parameters within the BIM environment, where project-level parameters are automatically assigned to all relevant elements. The detection data are dynamically associated with their corresponding components, enabling synchronized updates and visual representation within the DT model. When crack propagation occurs, the system automatically maps and updates the corresponding parameters within the model, ensuring that the DT remains consistent with the actual structural condition. Finally, the visualized results allow intuitive tracking of defect evolution, realizing the dynamic update of inspection data and enhancing the DT’s capability for integrated perception and management.
In this study, the proposed integration goes beyond simple data aggregation within a shared platform. The bridge SHM data, such as displacement responses, are semantically linked with intelligent inspection data, such as surface cracks detected by computer vision. Through the automatically generated BrIM digitalization via Dynamo, these heterogeneous datasets are mapped to their corresponding bridge components, enabling spatial localization, temporal synchronization, and bidirectional querying. The method’s feasibility is validated through the Second Nanjing Yangtze River Bridge case study, offering a reference for DT applications in large-scale infrastructure. This integrated process realizes automated BrIM and establishes the foundation for associating monitoring data with the digital bridge model, significantly improving the efficiency, accuracy, and multi-source data integrity of bridge digitalization.
Method for dynamically associating inspection and monitoring data with the BrIM
As illustrated in Figure 2, the integration of BrIM digitalization with inspection and monitoring data follows a structured and sequential process. The procedure begins with automatic modeling, employing bridge drawings, Dynamo-based parametric modeling, and 3D modeling techniques to establish an accurate geometric representation of the bridge’s fixed components, thereby laying the groundwork for subsequent data integration. The workflow then progresses to intelligent inspection, where inspection data, particularly crack information obtained from visual assessments, are associated with the model. Deep learning algorithms are applied at multiple stages to automate and enhance inspection processes, enabling dynamic updates of defect representations within the DT framework. Following this, health monitoring sensor data, consisting of time-series signals from strategically deployed sensors, are incorporated into the model. This integration allows the DT to reflect structural responses and conditions in real time, facilitating early warning by detecting data exceeding predefined safety thresholds. Ultimately, the resulting comprehensive DT, enriched with both inspection and monitoring information, provides a robust foundation for supporting bridge maintenance and safe operation, thereby substantially improving the scientific rigor and operational efficiency of bridge management.
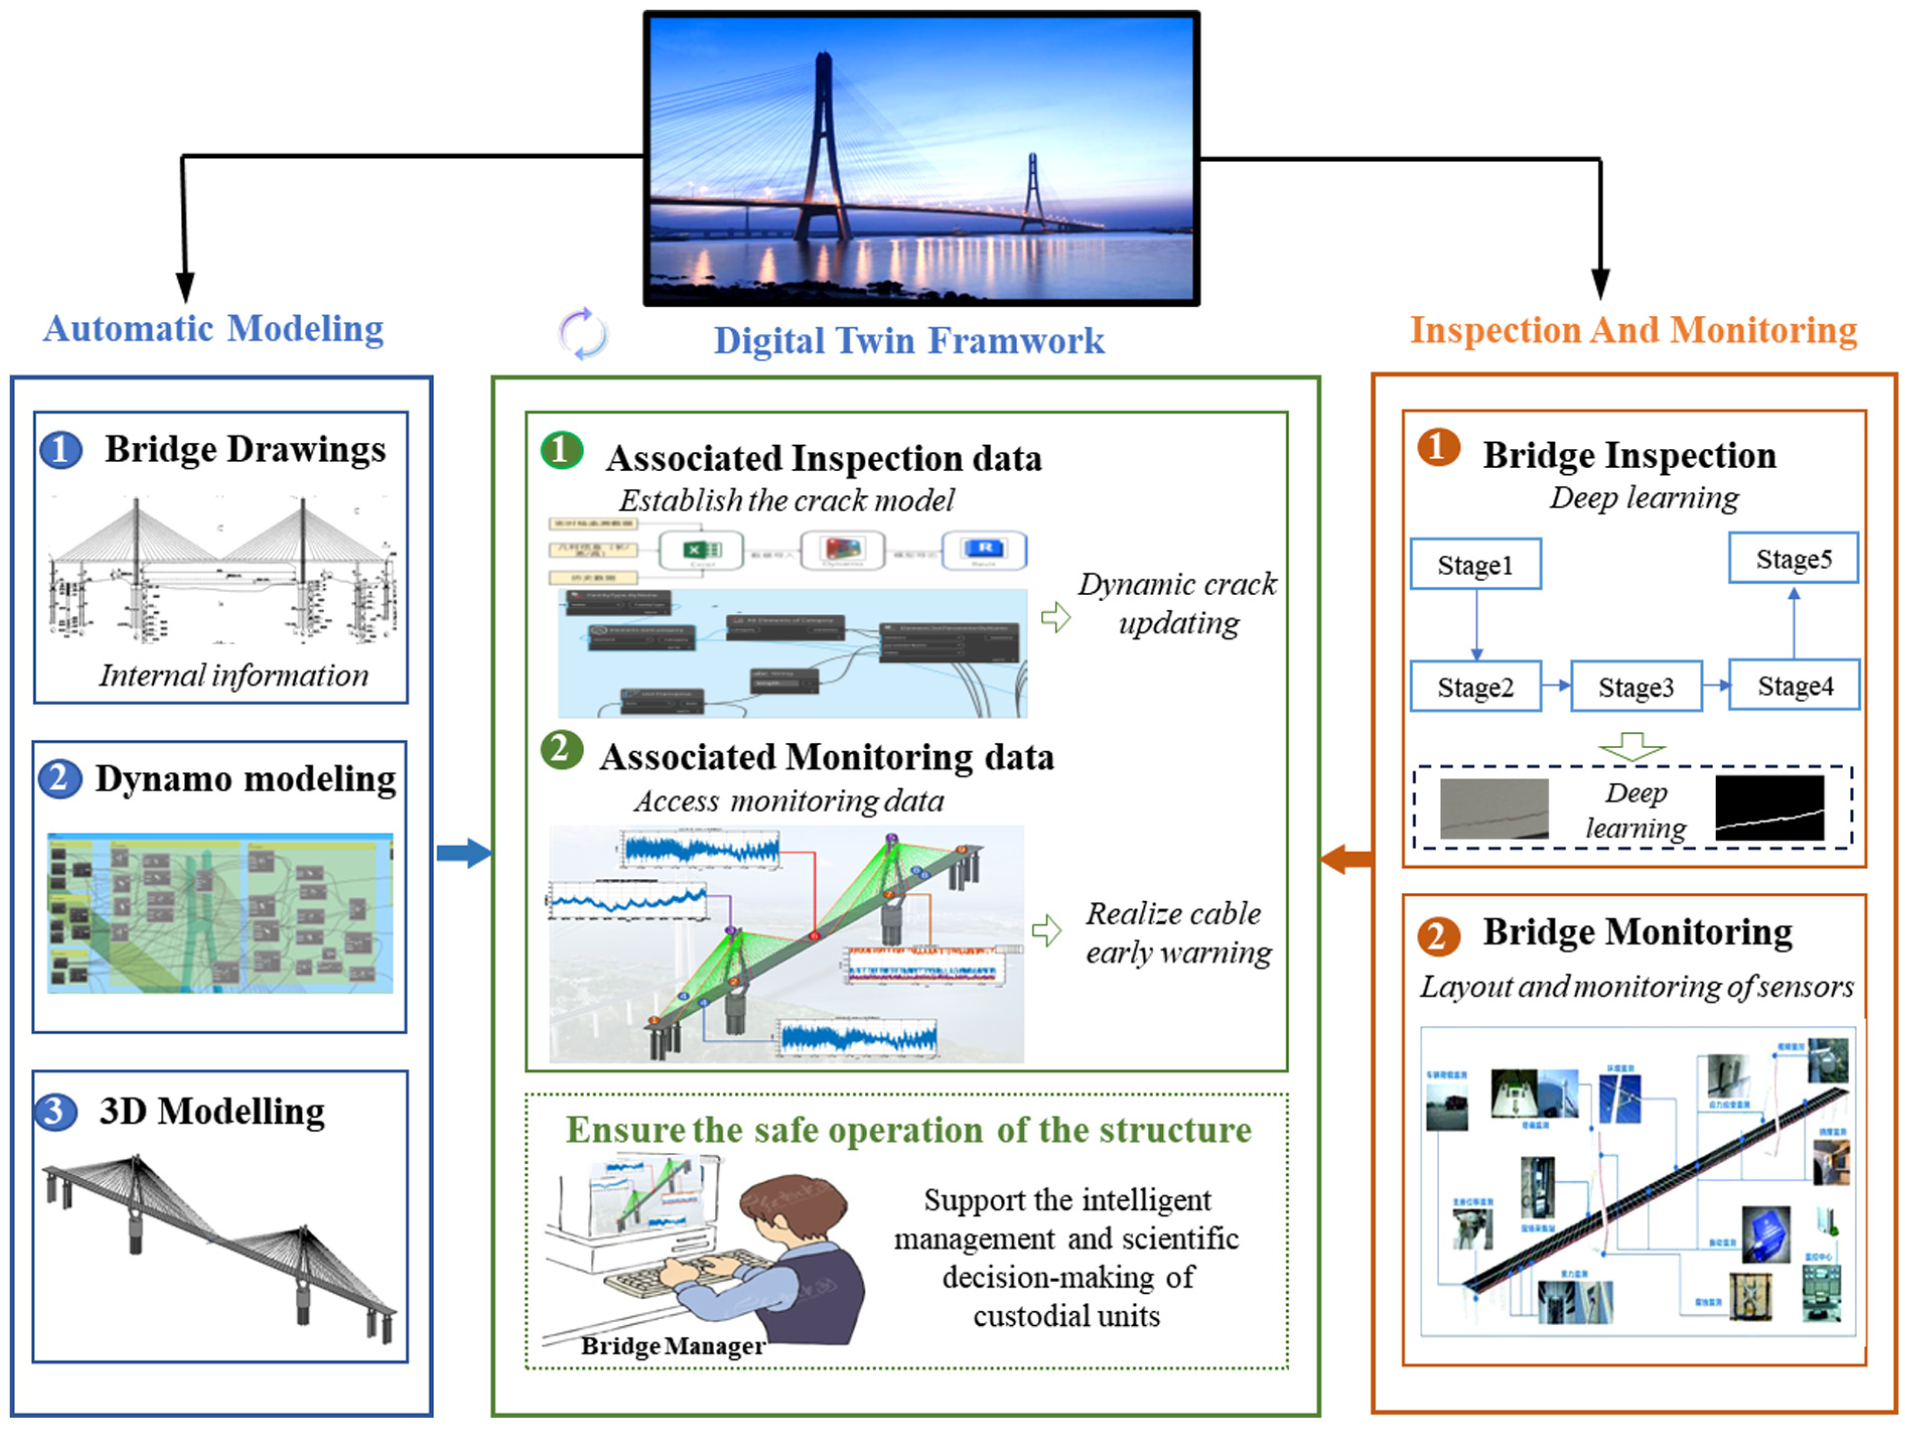
Flow of correlation between BrIM digitalization and inspection and monitoring data. BrIM: bridge information modeling.
Moreover, crack information extracted from visual inspection represents the inspection data, whereas the time-series signals collected from sensors correspond to the monitoring data. These two types of data characterize complementary aspects of bridge behavior—external surface conditions and internal structural responses. In this study, both data categories are integrated into a unified DT model based on the geometric representation of the bridge established within BIM software. Through this integration, heterogeneous information from inspection and monitoring is fused within a common framework, enabling comprehensive data representation and supporting intelligent bridge management.
Automated BrIM method based on visual programming
Dynamo, as a parametric modeling plugin, possesses robust visual programming capabilities that significantly expand the application potential of Revit in the field of building and BrIM. By enabling the definition of custom relationships and rules, Dynamo not only facilitates the generation of complex geometric models and data processing within a 3D space but also supports the automatic updating of data. In addition, Dynamo offers a rich set of application programming interface, empowering secondary development and customization of functionalities. This capability allows for batch processing of attribute modifications for model components based on specific rules, thereby markedly enhancing the efficiency of O&M management.
This paper proposes a Dynamo-based automated BrIM method for bridges, aiming to enhance the efficiency of bridge automated modeling. The overall framework for the automated BrIM is illustrated in Figure 3. For the geometric modeling of bridges, the bridge’s center point is taken as the origin. The initial bridge model is constructed through five modules: transition piers, steel box girders, cables, pylons, and piers. After addressing issues such as overlaps within the aggregation module, a preliminary geometric model is exported, with different components distinguished by colors.
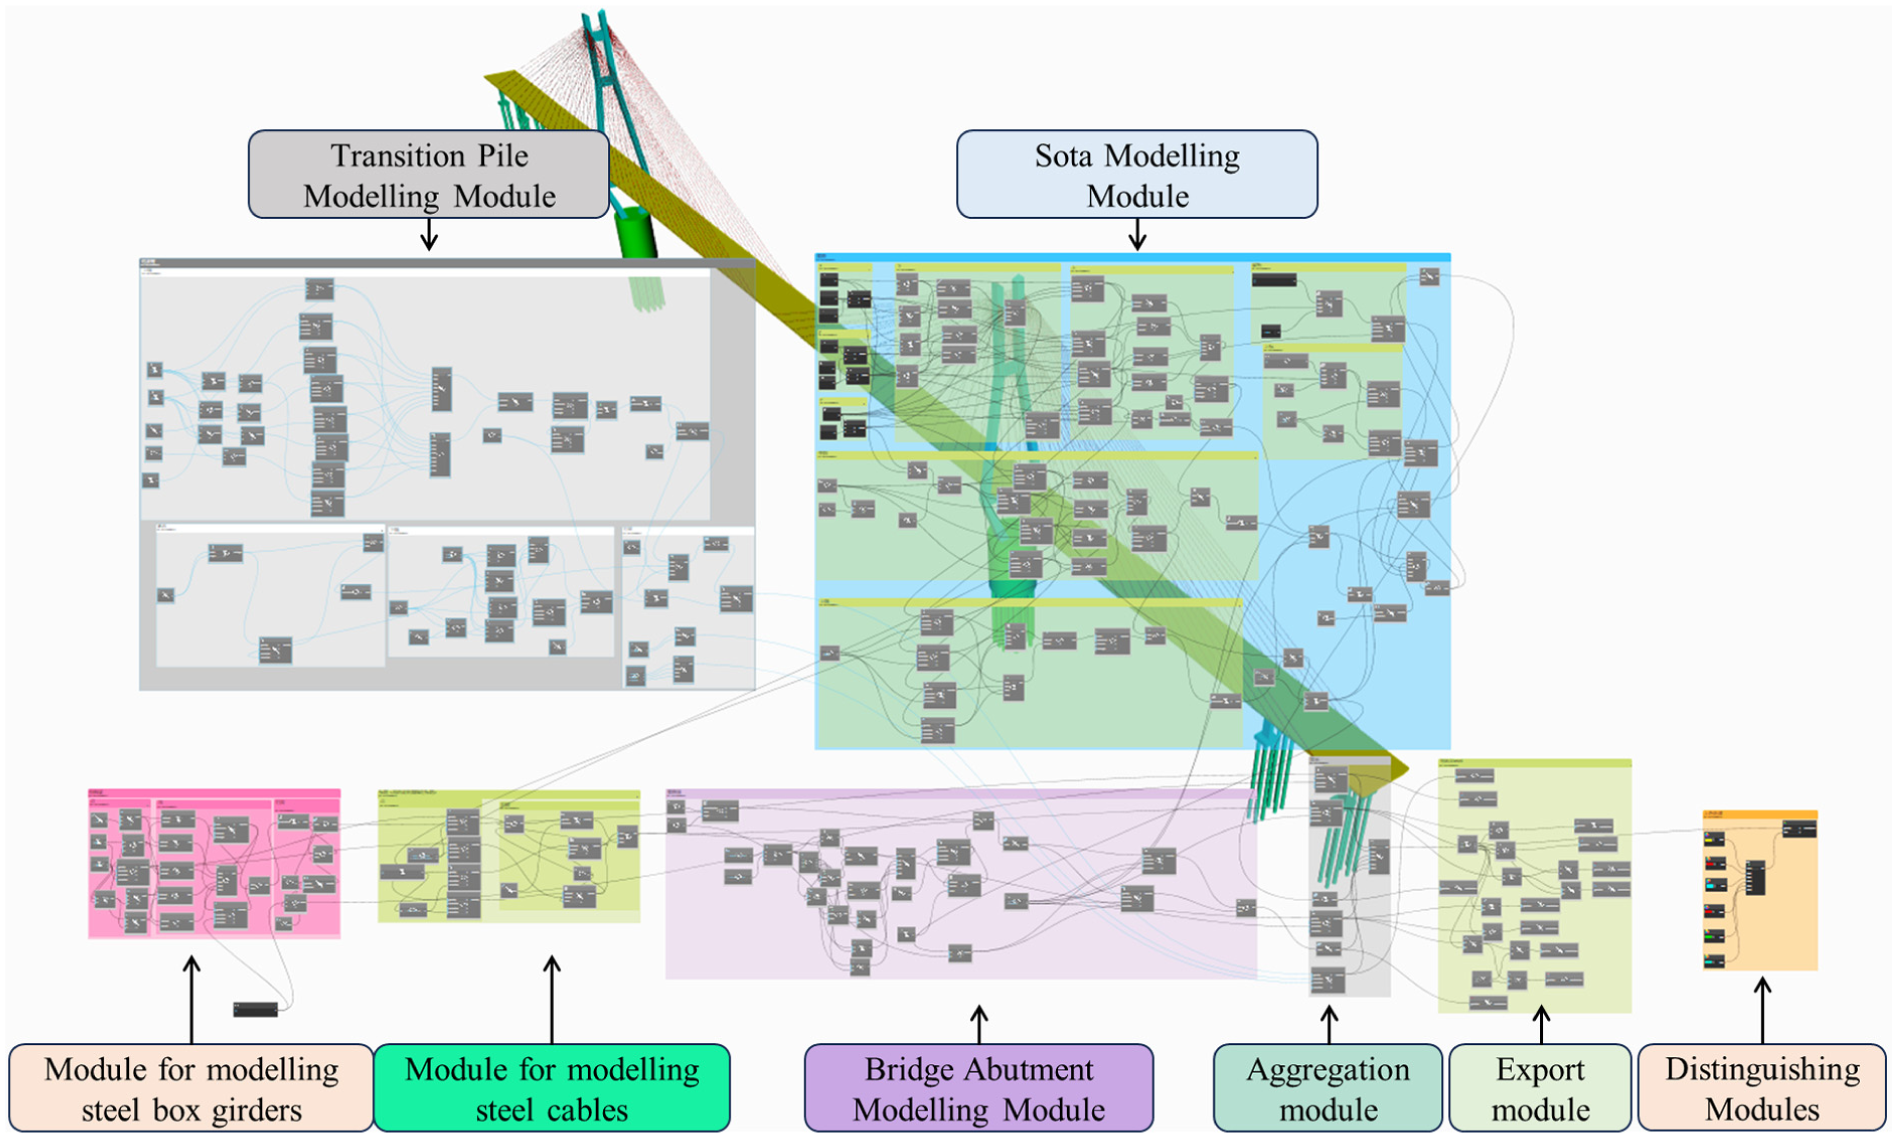
Framework diagram for the creation of a 3D model of the general layout. 3D: three dimensional.
Taking the bridge’s main girder as an example, the modeling workflow is described. As shown in Figure 4(a), the geometric model is constructed by reading node coordinates along the girder boundaries, enabling accurate parametric modeling. The model is then imported into Revit via FamilyType. ByName to instantiate a family component. Using Dynamo, real-time adjustments can be efficiently applied, improving modeling precision and efficiency. As shown in Figure 4(b), geometric data are extracted through Dynamo nodes, with Point.ByCoordinates generating key points, Line.ByStartPointEndPoint connecting them, and Polycurve.ByJoinedCurves forming closed boundaries. For solid modeling, Solid.ByLoft and Solid.Difference are used for extrusion and Boolean operations, ensuring a high-fidelity, non-overlapping model. This approach is also applied to bridge towers, stay cables, and piers.
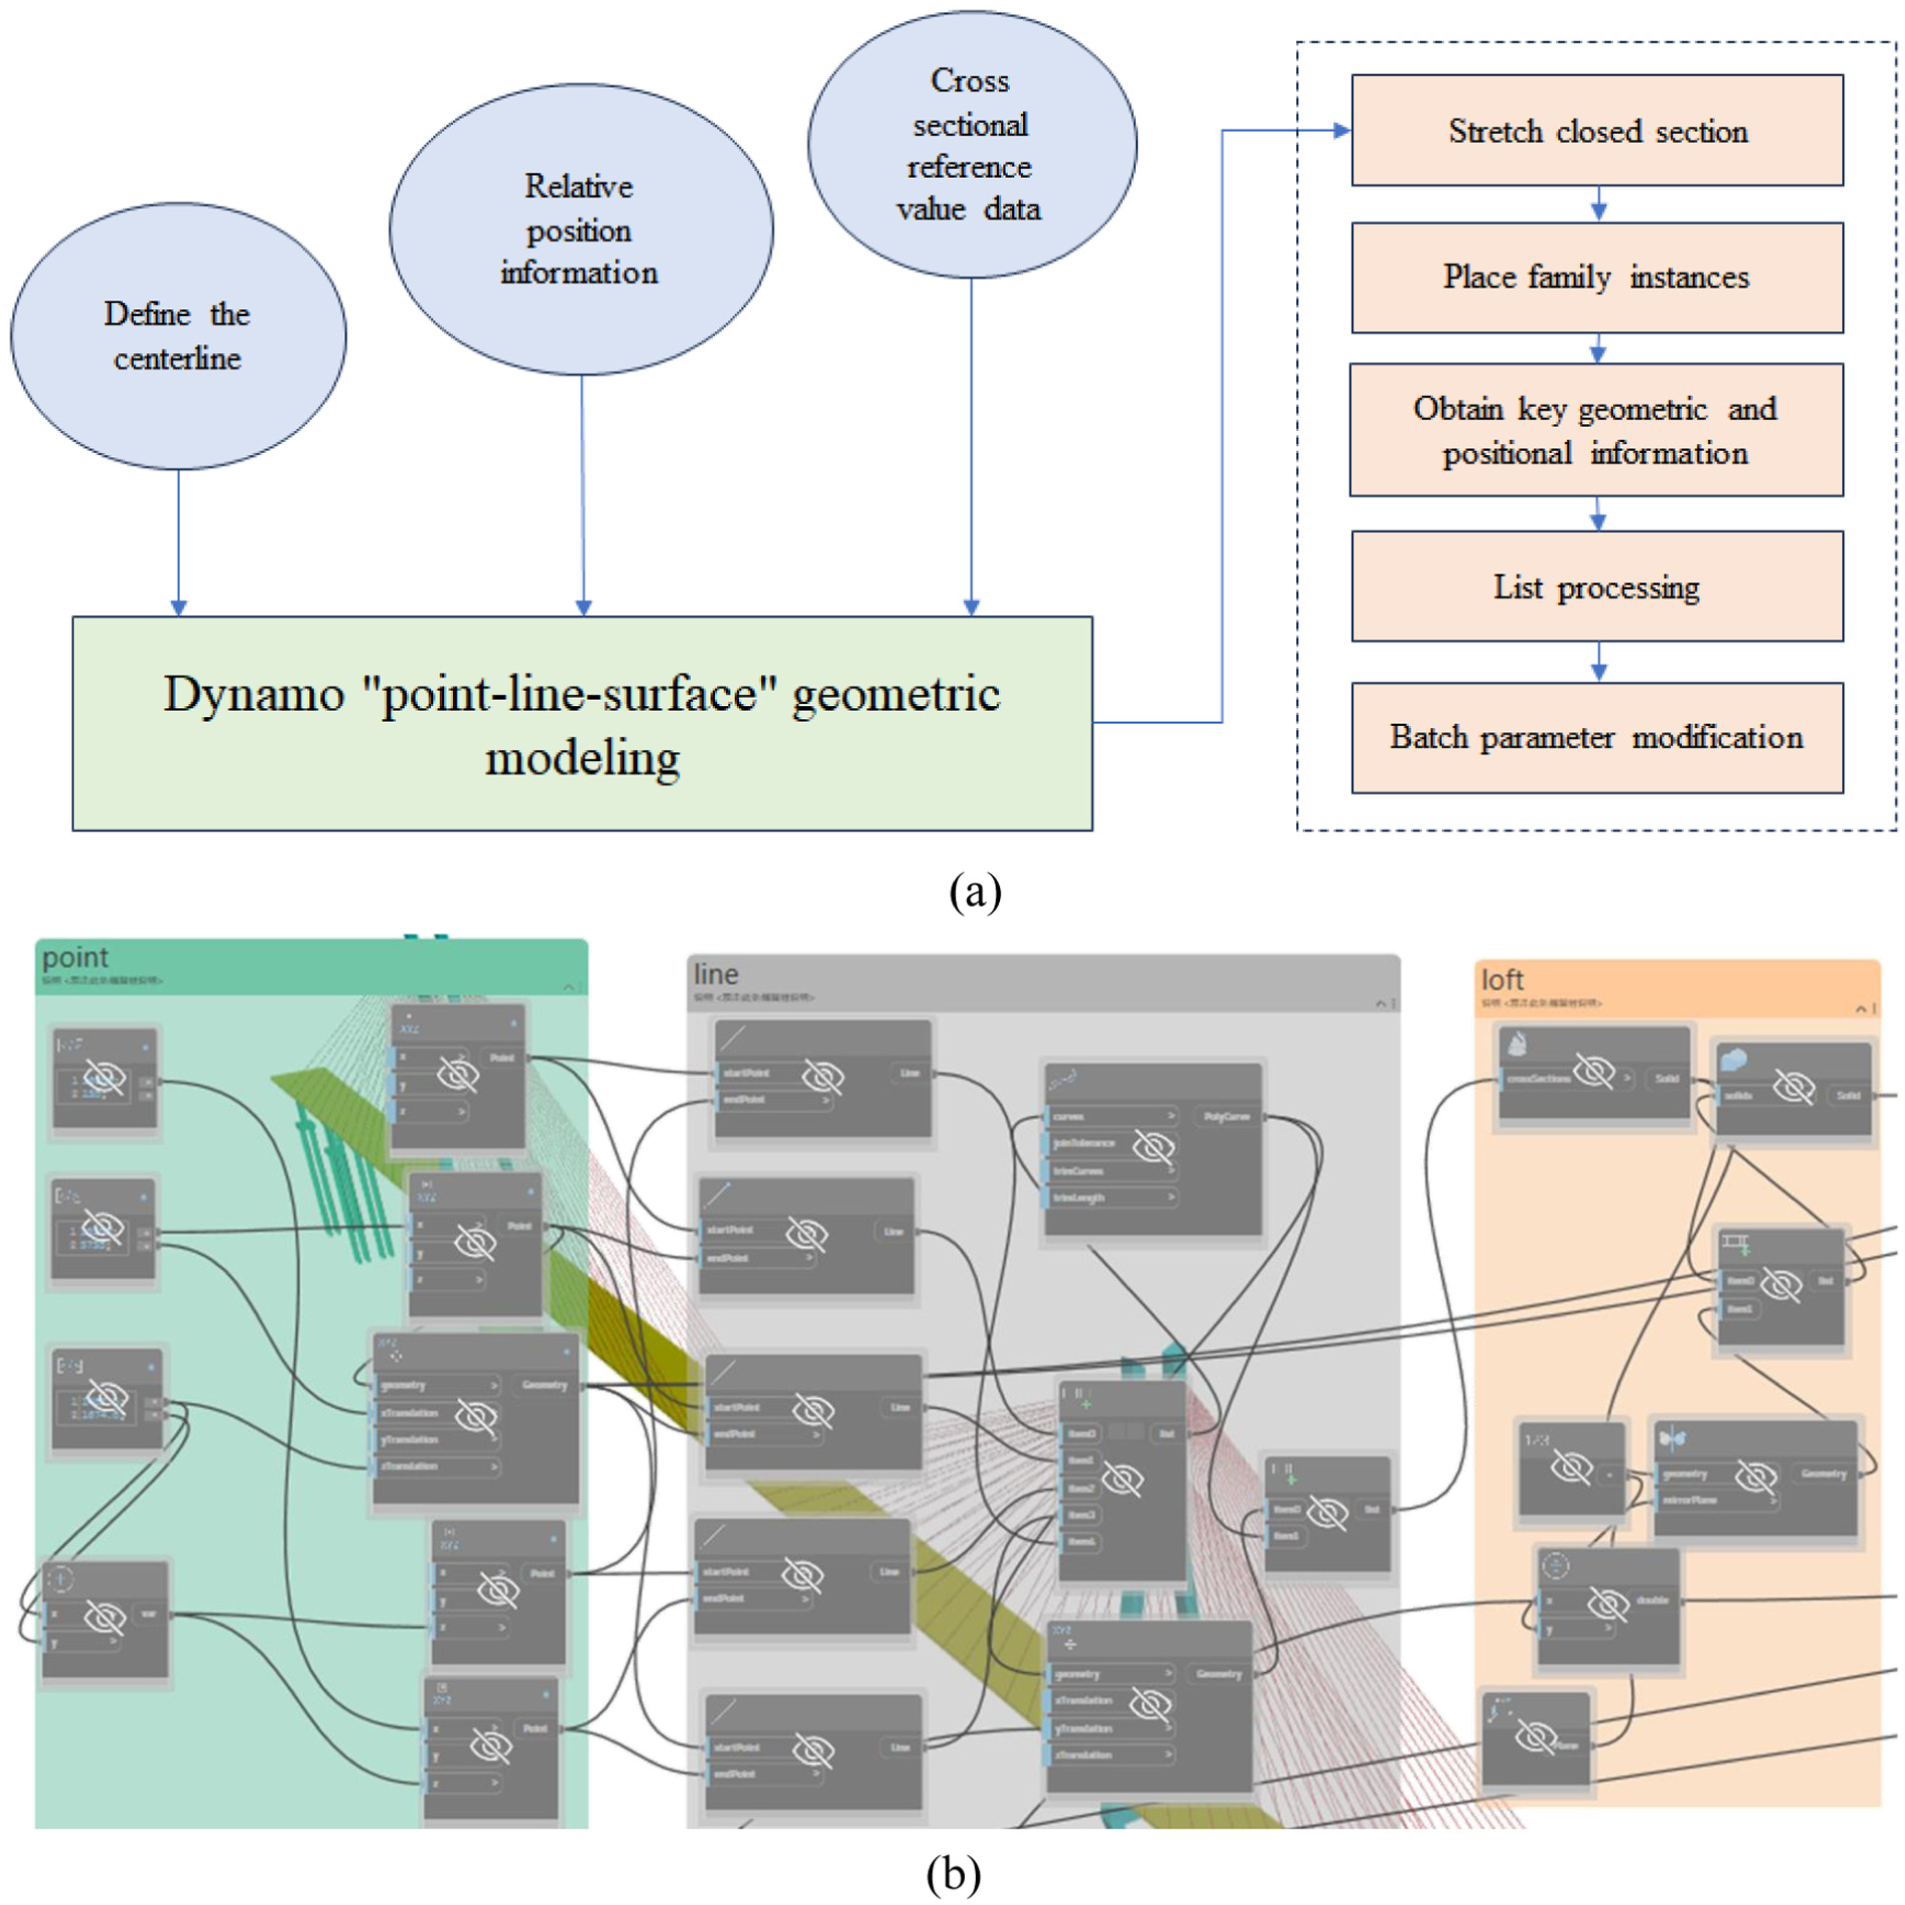
Automated modeling process of main beam: (a) flowchart for generating family instances and (b) example of constructing solid node groups for main beams.
In this study, the workflow from imagery data to defect visualization in the bridge model includes image preprocessing, extraction of crack features, coordinate transformation relative to the bridge benchmark, and generation of defects in the BrIM digitalization environment. Crack trajectory coordinates and measured widths are used to generate continuous small-diameter cylinders, forming width-varying 3D cracks. The entire workflow takes approximately 10 min on a standard workstation, with most of the time spent on image processing and feature extraction, and relatively little time required for generating the geometry.
Method for associating intelligent inspection data with BrIM digitalization
Ultimately, the generated 3D defect models are associated with the BrIM digitalization, integrating this multi-source information into the BrIM framework to form a comprehensive DT model. This integration consolidates all components of the bridge along with their associated multi-source information onto a unified platform, linking them to corresponding geometric units. Each defect unit encompasses not only geometric information but also physical, attribute, and operational maintenance (O&M) information. The geometric information includes details such as defect length, width, and angular orientation, ensuring that the model’s geometric configuration aligns accurately with the actual defects. Physical information comprises elements like the defect ID, location, and type, while attribute information encapsulates aspects such as the defect’s development timeline, boundary conditions, and damage severity level. O&M information includes maintenance records and corresponding timestamps. When associating this information, it is imperative to ensure the accuracy and consistency of the data to guarantee that the BrIM digitalization faithfully reflects the actual condition of the bridge. As illustrated in Figure 5, through data mapping, the inspection data, geometric models, physical information, attribute information, and O&M information are unified to form a complete and closely interconnected DT model.
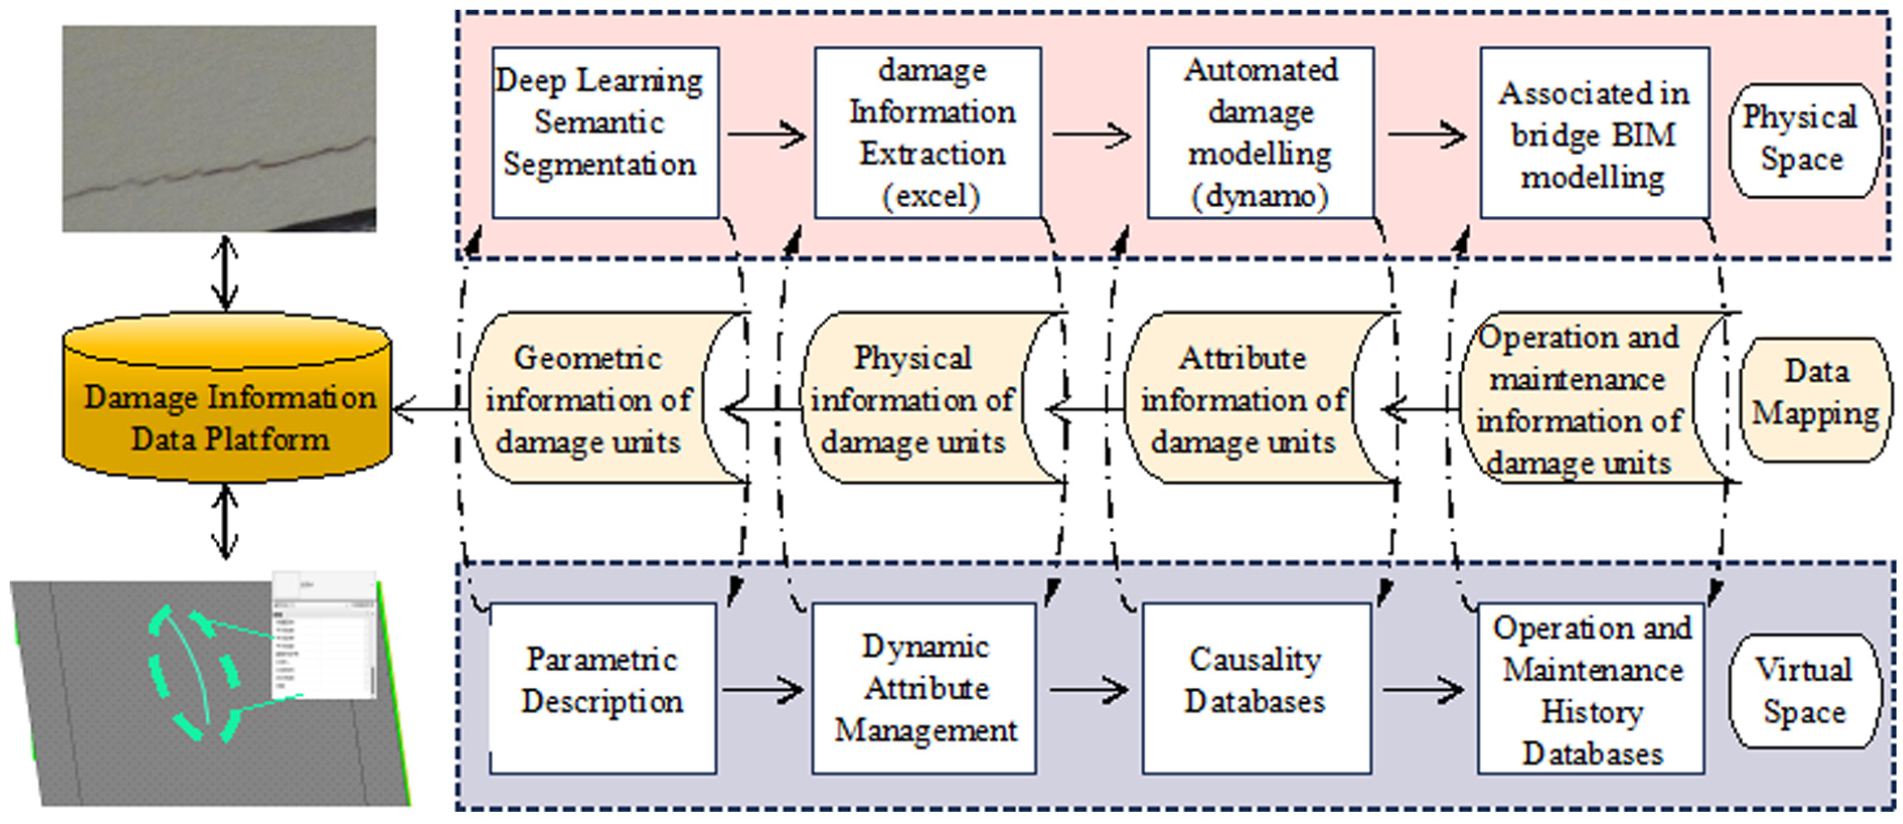
Damage DT modeling system. DT: digital twin.
Intelligent defect segmentation and quantitative information extraction based on deep learning
This paper employs deep learning and image processing techniques to achieve defect segmentation, thereby providing a data foundation for subsequent local stiffness calculations based on defect data. In this study, bridge crack segmentation, considered a standard step in intelligent inspection, was implemented using CrackSeU, 40 a lightweight attention-based U-shape network. The model was selected for its ability to integrate multi-level and multi-scale features, improving crack detection accuracy while maintaining computational efficiency. CrackSeU was trained on manually annotated bridge crack images under a supervised learning framework. Its performance has been validated at the pixel level, demonstrating accurate detection of fine cracks suitable for quantitative assessment. This allows direct integration of segmentation results into the BIM-based bridge inspection workflow, supporting real-time monitoring and structural safety evaluation, while relying on a widely accepted methodology for routine crack detection.
As illustrated in Figure 6, a deep learning model is employed for automatic segmentation of defect morphologies. The model includes multiple encoder modules, upsampling modules, feature fusion modules (FFMs), lateral output modules, and an output module. The encoder consists of five stages, each with two convolutional layers followed by activation or normalization layers, and a max-pooling layer between stages. Three upsampling modules are incorporated, each containing a convolutional layer, an LN_VT layer, 41 a Hard-Swish layer, and bilinear upsampling. The output module comprises a main output block (OB) and a side OB (SOB), with the SOB not used during inference to avoid extra computational cost. Convolution operations follow standard formulas. The FFM enables effective multi-scale feature integration and information flow, expressed through feature concatenation and convolution operations.
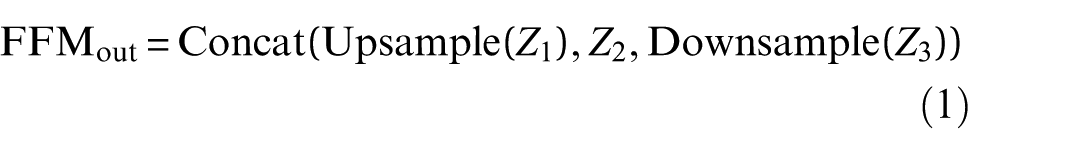

where
Deep learning algorithm for automatic damage segmentation.
This design enables the deep learning model to concurrently capture high-level global semantic features and low-level fine-grained details, thereby enhancing both the accuracy and efficiency of crack segmentation. The schematic diagram of the proposed deep learning-based automatic defect (crack) segmentation algorithm is illustrated in Figure 5.
Integration of bridge inspection data with BrIM
The objective of image recognition technology is to transform the geometric information coordinates of defects identified in images into a model with true 3D coordinates within the world coordinate system (WCS) through a series of coordinate conversions. This process facilitates the construction of a 3D defect damage model that accurately represents the actual conditions of the defects. Defect images were captured using digital cameras, with lens distortions corrected during acquisition through standard camera calibration based on Zhang’s method. 42 Intelligent detection of defects was performed using a pre-trained deep learning model. The primary contribution lies in the inspection–monitoring data fusion framework, which integrates defect information from intelligent inspection with SHM data.
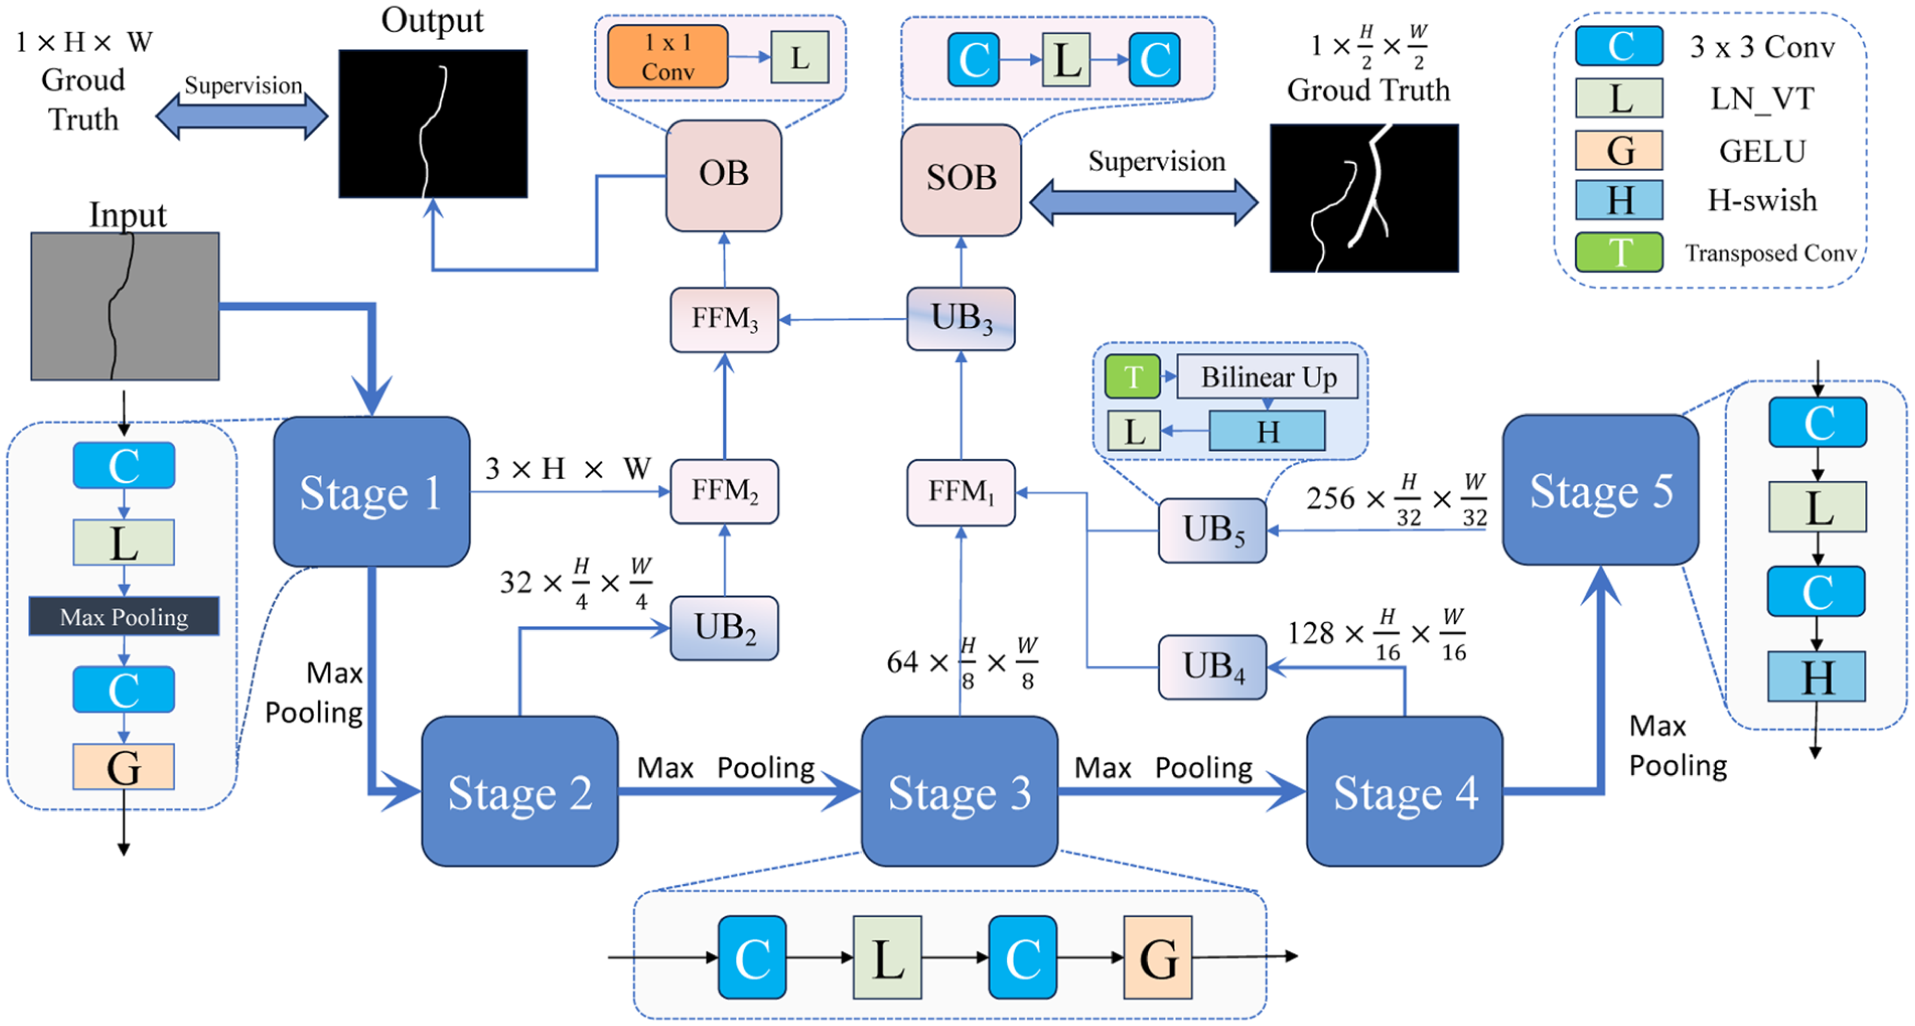
As shown in Figure 7, three coordinate systems are used in this study. The WCS serves as a global reference for the bridge, with all structural elements and sensor positions defined relative to it. The camera coordinate system (CCS) is a local frame attached to each camera, with its origin at the camera’s optical center; transformations from CCS to WCS are determined by the camera extrinsic parameters. The image (pixel) coordinate system (ICS) represents the two-dimensional (2D) pixel grid of the captured images, with points from CCS mapped to ICS via the camera intrinsic parameters. The projection from images to the virtual bridge model involves the world, camera, and image coordinate systems. 3D points on the bridge are first transformed into the CCS using extrinsic parameters, and then mapped onto the image plane via intrinsic parameters. Image points are back-projected as rays in 3D space and intersected with BrIM digitalization surfaces to map bridge defects or features onto the virtual model. Extracted defect features are further converted into coordinates relative to the bridge benchmark and input into dedicated code modules in the parametric modeling environment, enabling automated generation of defects in the virtual model. For scenarios where images are captured at fixed locations or periodically moved to predetermined positions, this method provides a known and stable spatial reference, ensuring that the projection from data to model is accurate and reliable. During this conversion process, multiple coordinate systems will be used, including the WCS, CCS, and image coordinate system. The above coordinate systems are based on fixed or periodically moving cameras.
Relationship between image recognition technique and model coordinate position.
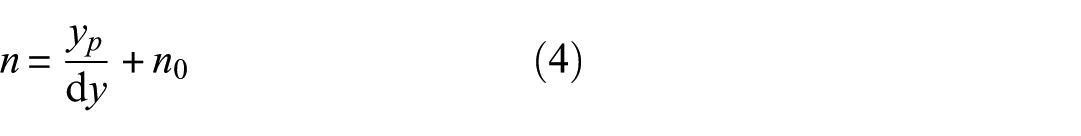
The pixel coordinate system is defined with a corner point of the image as its origin, and its axes are aligned along the lengthwise and width-wise directions of the photograph. This coordinate system is employed to describe the positional information of a defect within any given image. The image coordinate system, in contrast, takes the intersection point of the principal optical axis and the image plane (namely, the geometric center of the image) as its origin, with the X and Y axes oriented along the directions corresponding to the projected spatial extents of the defect’s length and width on the image plane. The transformation relationship between these two coordinate systems is articulated as follows:

where
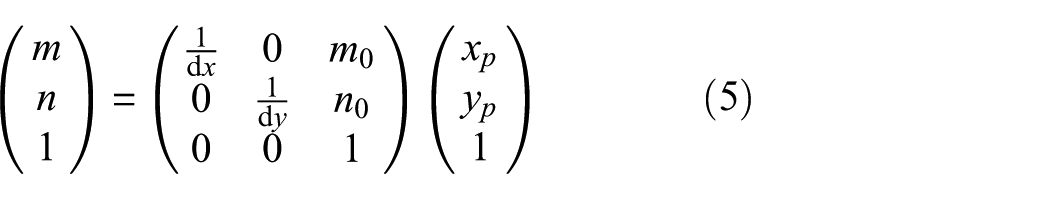
The equation can be reformulated into its homogeneous form as follows:
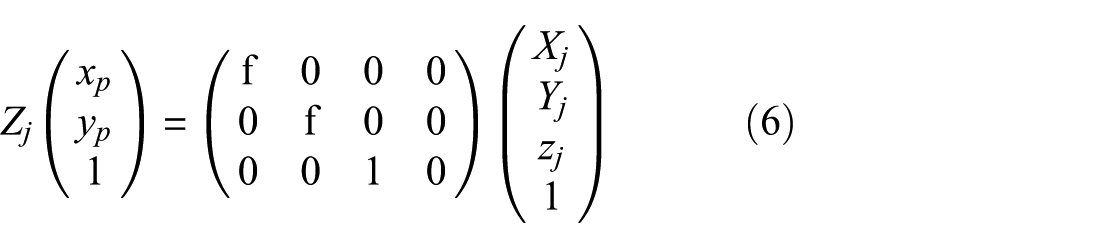
The transformation relationship between the CCS and the image coordinate system can be described by the following formula:
For the complete transformation from the defect’s pixel coordinate system to the WCS, the process can be carried out according to the following equation:
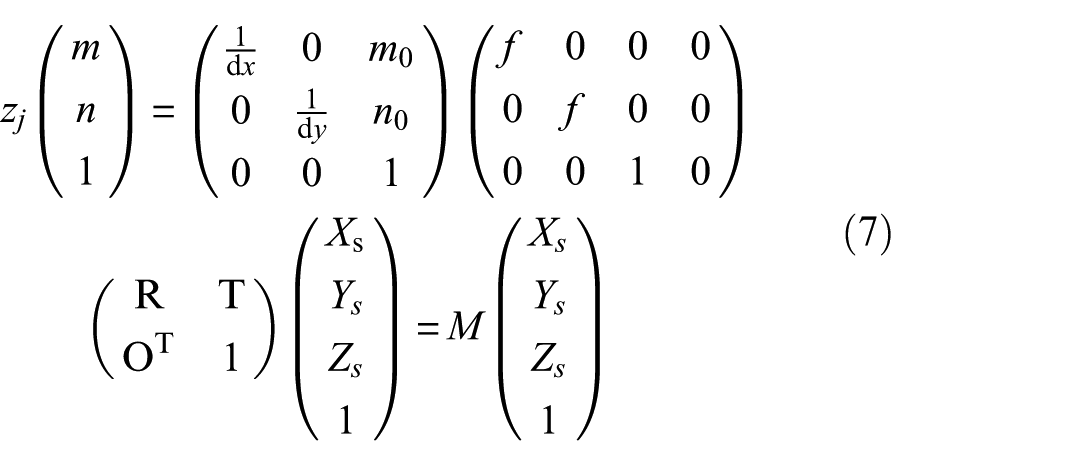
where
As shown in Figure 8, defect image data from actual bridge inspections are first acquired and processed using deep learning semantic segmentation to extract defect information, which is recorded in Excel. Key points from the extracted contours are then selected to establish reference points, and the 2D defect contours are mapped into 3D space via coordinate transformation, enabling precise localization of defects within the bridge structure. Leveraging parametric modeling tools such as Dynamo, highly accurate 3D geometric defect models are automatically generated. Batch processing facilitates the efficient creation of multiple defect models, allowing large volumes of data to be handled while significantly reducing modeling time. Finally, a color differentiation module is applied to characterize variations in defect widths, supporting the analysis of defect progression and the construction of a comprehensive defect damage model.
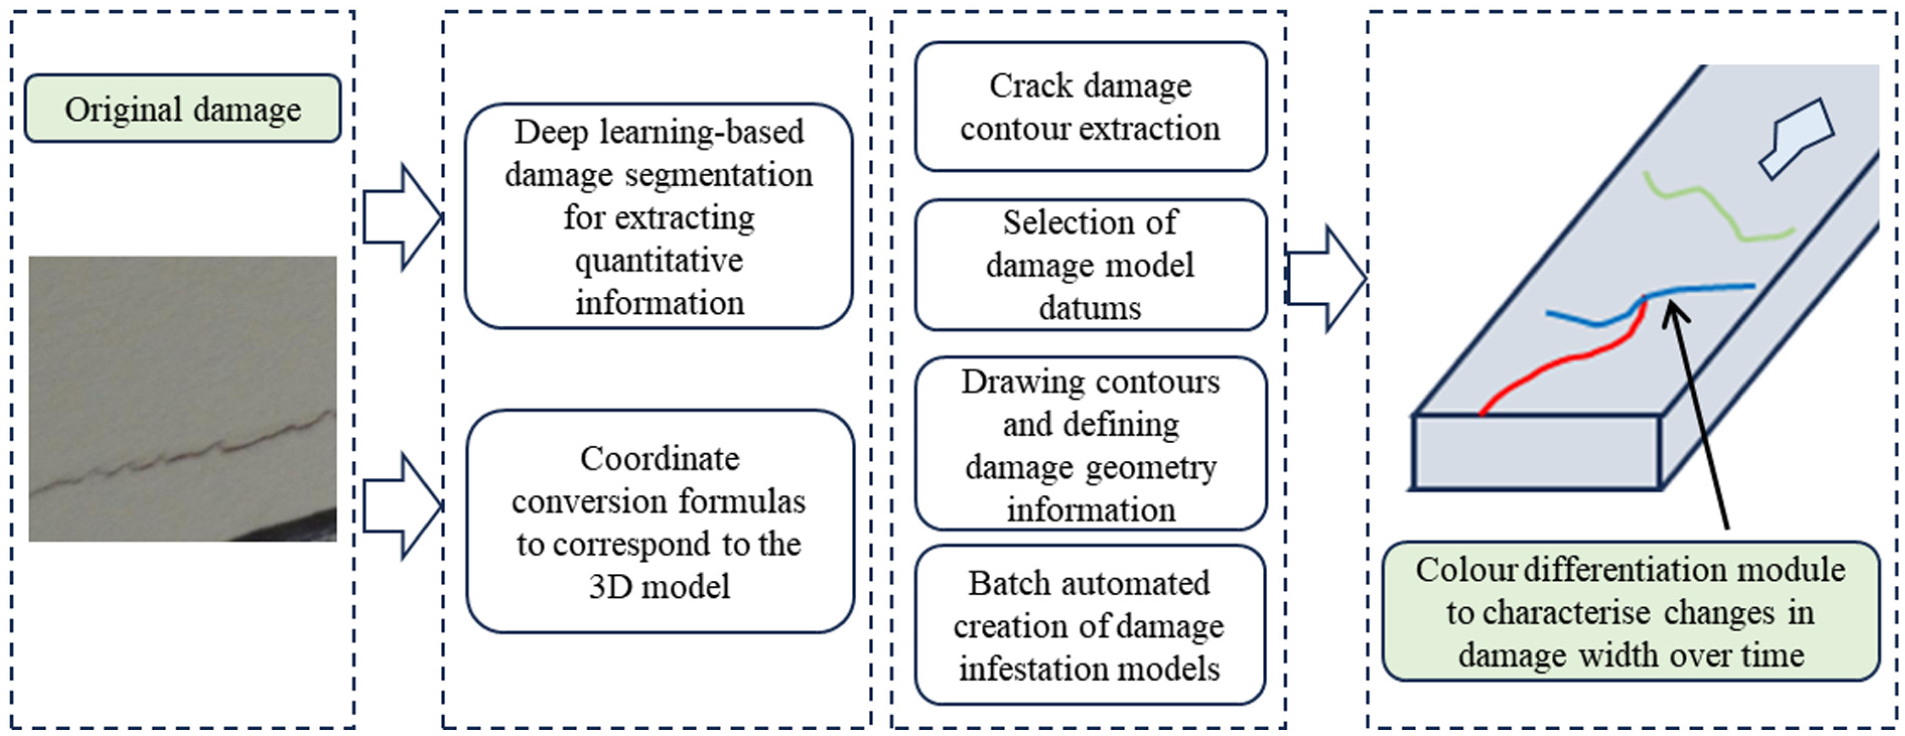
Correlation of damage detection data with BrIM digitalization. BrIM: bridge information modeling.
Figure 9 illustrates the process by which defect location coordinates from comma-separated values (CSV)-formatted inspection data are integrated into the BrIM digitalization workflow. Visualization and color coding are employed to enable the bridge’s condition to be intuitively interpreted by O&M personnel. To enhance efficiency, Dynamo, a visual programming plugin for Revit, is utilized. In visual programming, scripts are represented through interconnected nodes and functions, providing a graphical abstraction of traditional textual programming. In this study, the inspection data are visualized using Dynamo, attribute values related to defect length and area are calculated, and these values are defined as parameters within the bridge model.
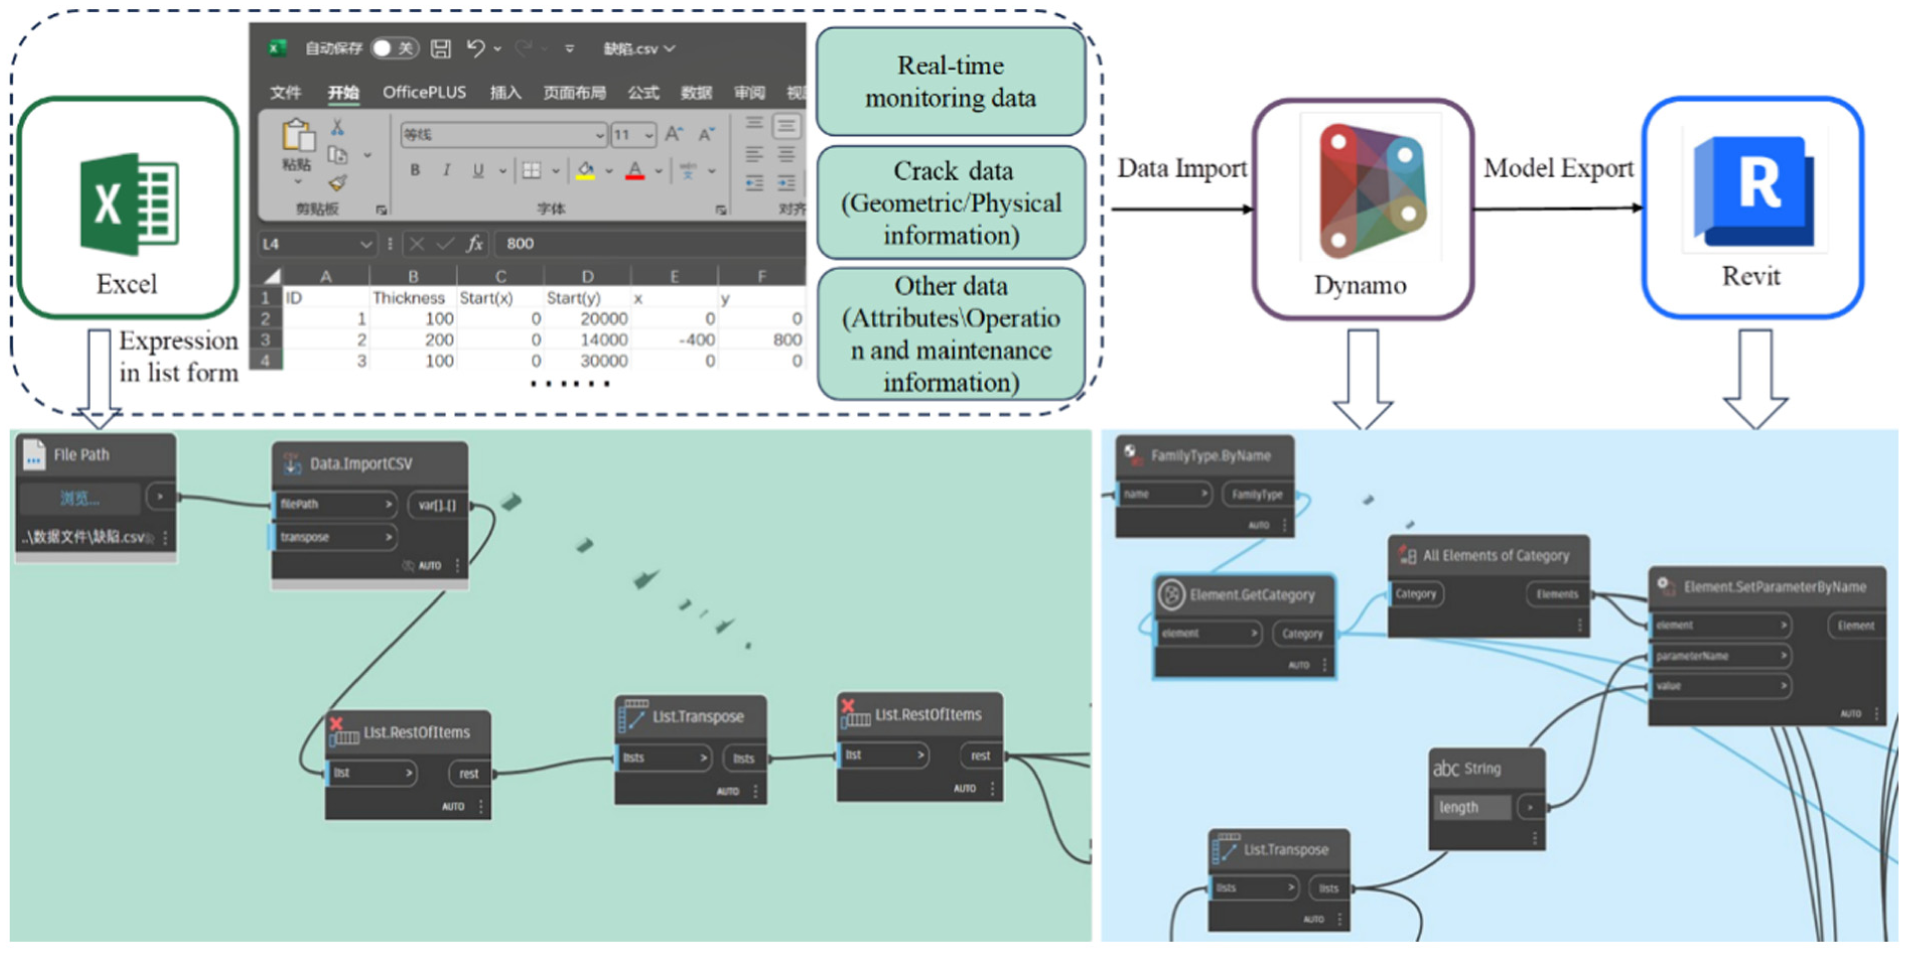
Sample logic flow on importing inspection data into BrIM through Dynamo script. BrIM: bridge information modeling.
Method for linking monitoring data with BrIM digitalization
As illustrated in Figure 10, the process of linking monitoring data with BrIM primarily comprises the following steps. Revit software is utilized to establish sensor families, load them into the project, and create sensor instances at designated monitoring points. Shared parameters are configured for these instances while parametric modeling software connects to a MySQL relational database to retrieve monitoring point numbers, collection timestamps, and corresponding monitoring data. A one-to-one correspondence between the monitoring point numbers in the Revit sensor attributes and those in the database is then established, allowing the monitoring data and timestamps to be written into the sensor instance attributes. The parametric model is set to operate periodically, dynamically updating the sensor attributes with newly retrieved data. Finally, the dynamically acquired monitoring data are compared against predefined alarm thresholds, and visual coloring treatments are applied to the sensor instances according to different warning levels for intuitive representation.
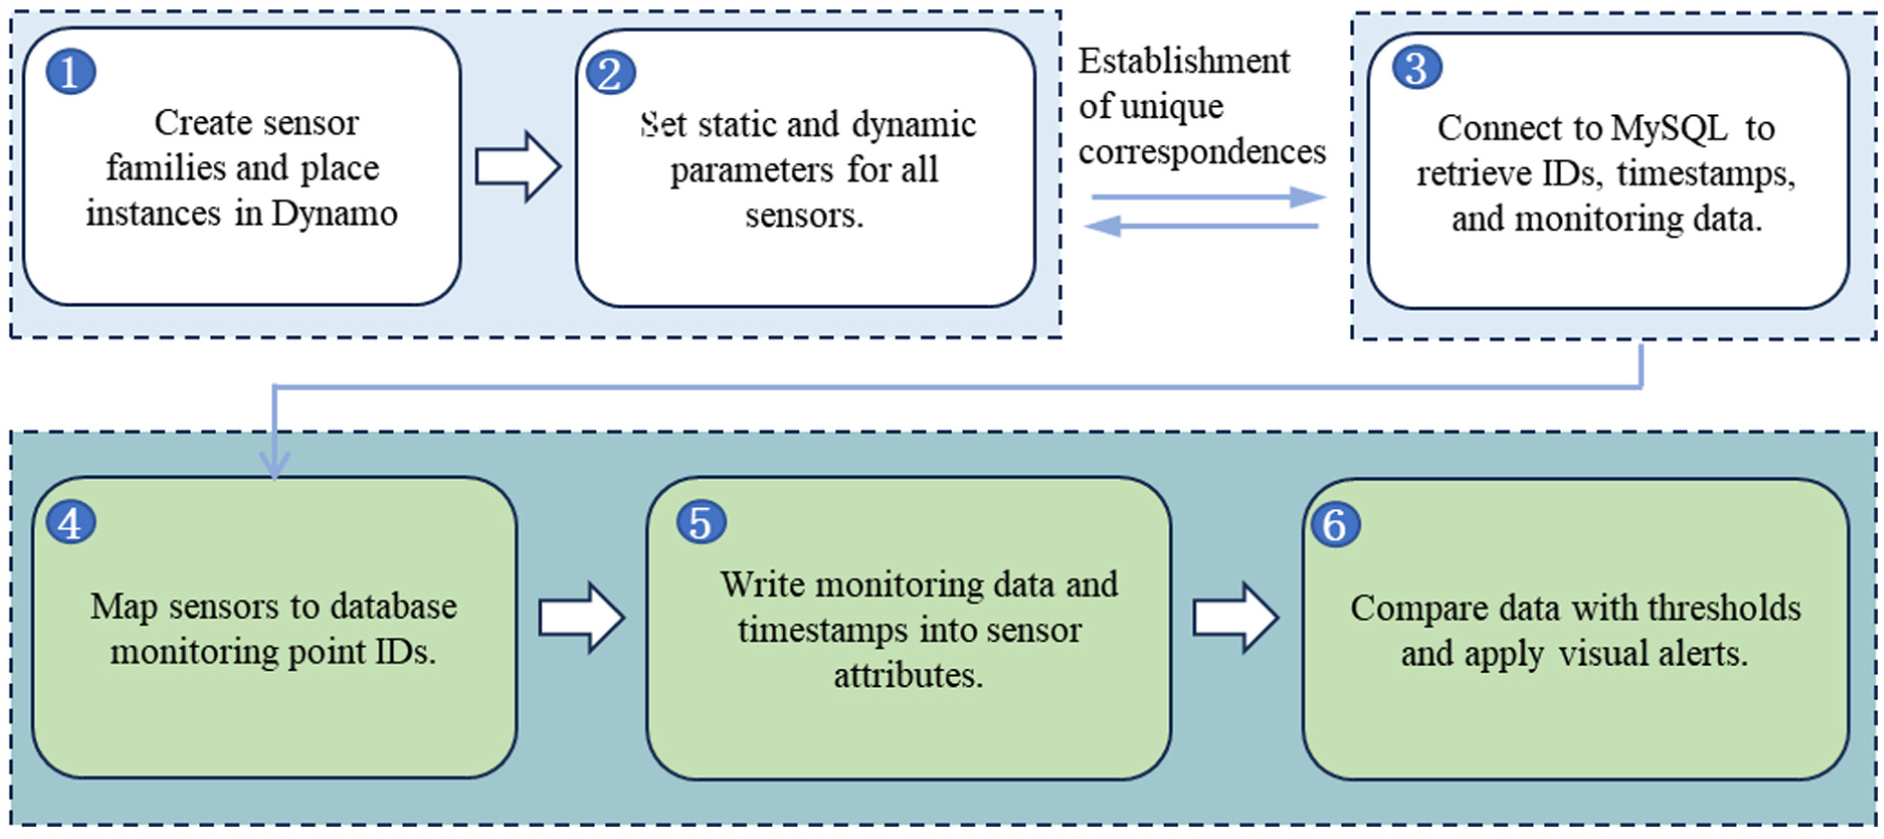
BrIM linked the monitoring data process. BrIM: bridge information modeling.
Filed validation experiments
Overview of the experiment
As shown in Figure 11, the Second Nanjing Yangtze River Bridge is a nationally significant project with a total length of 21.337 km. The bridge features a steel box girder cable-stayed structure, with the main bridge spanning 2938 m and a deck width of 38.2 m, including stay cable ducts and maintenance walkways. The main span measures 628 m, ranking first in China and third globally among cable-stayed bridges of the same type. The superstructure is primarily composed of steel box girders. The north and south pylon foundations employ double-walled steel cofferdams, each supported by 21 large-diameter bored cast-in-place piles with diameters of 3 m. The pier lengths for the north and south pylons are 10 and 83 m, respectively. The main pylons are constructed from prestressed reinforced concrete, with a modular design also based on prestressed reinforced concrete. The upper pylon column reaches a designed height of 195.41 m, with an architectural height of 300 m. The stay cable system comprises 160 cables, each consisting of high-strength, low-relaxation parallel steel strands of seven wires, arranged in a fan-shaped configuration to ensure uniform force distribution and an aesthetically pleasing appearance. The deck incorporates an orthotropic steel structure. The foundation system combines large-diameter bored cast-in-place piles with a separated pier-tower arrangement. The tower bodies are designed as thin-walled piers, and pot rubber bearings are employed to support the superstructure.
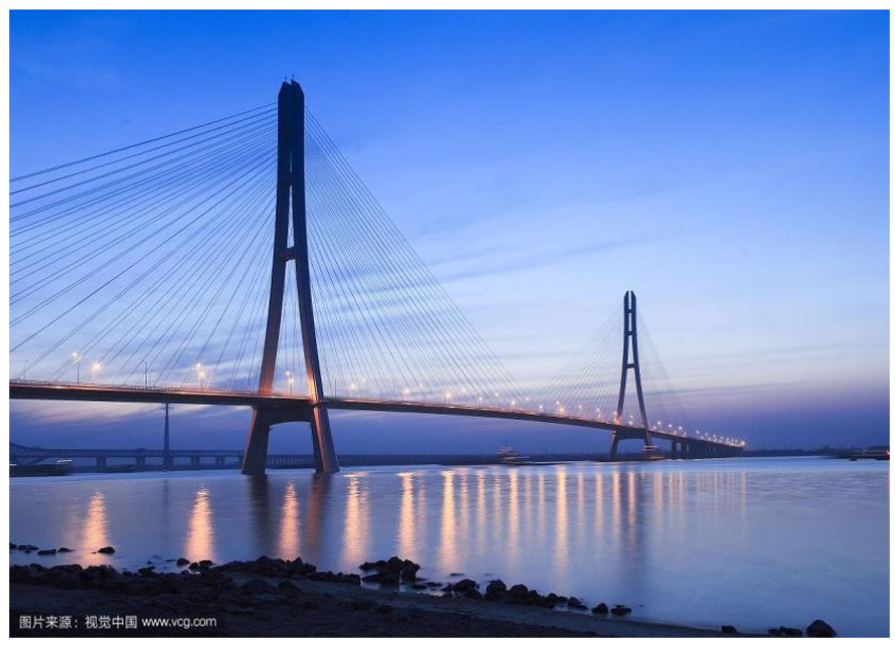
On-site drawing of the bridge.
Result analysis
As shown in Figure 12, during the BrIM construction process for the Second Nanjing Yangtze River Bridge, initially, based on the bridge’s laser point cloud data and design drawings, a BrIM was established using visual section programming. This model encompasses various components, including the main bridge deck, pylons, and stay cables, ensuring that the spatial relationships and physical properties of each structural part are accurately represented. Throughout the construction process, particular emphasis was placed on modeling the stay cable system. Given the large number of stay cables and their complex arrangement, specialized scripts were developed through parametric modeling techniques to automate the placement and attribute settings of the stay cables. This approach not only enhanced modeling efficiency but also guaranteed the precise realization of the fan-shaped layout design for the stay cables.
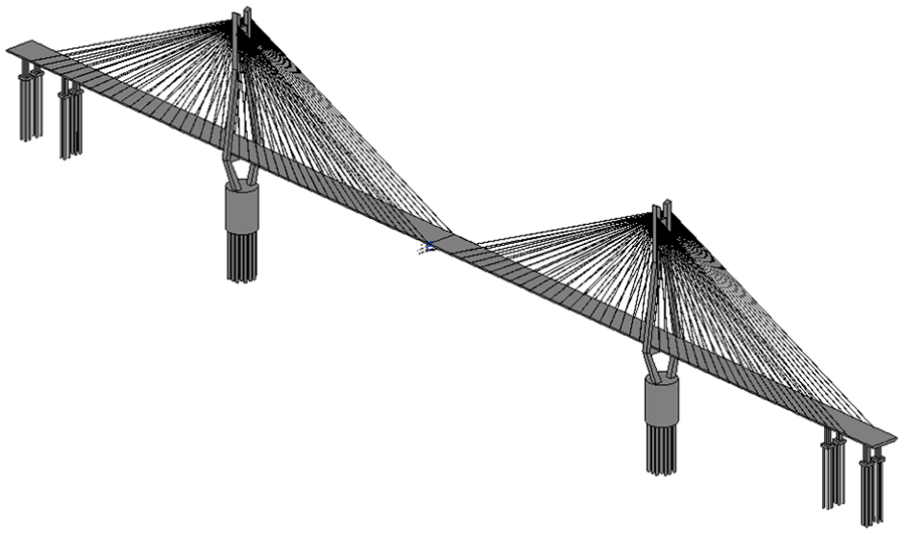
The established BrIM is based on a dynamo. BrIM: bridge information modeling.
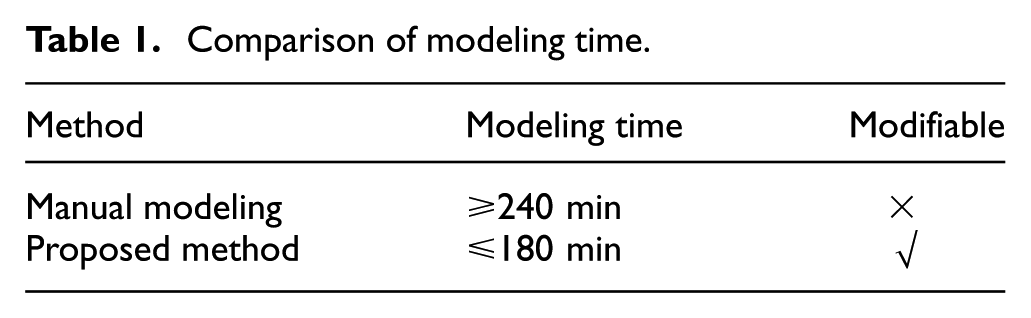
As shown in Table 1, a comparative analysis was conducted to evaluate the modeling efficiency of the proposed method against manual modeling performed in Revit. The results indicate that the total modeling time of the proposed method is approximately 180 min, representing about a 25% improvement in efficiency compared with the 240 min required by manual modeling. In addition, the proposed approach supports flexible modification of model parameters and component attributes through parameterized adjustment, enabling rapid iterative updates. This improvement is primarily due to the limitations of manual modeling for long-span bridges, where components are numerous and complex, requiring repeated modeling of similar elements and lacking support for parametric operations. By contrast, the interface programming approach can systematically generate and adjust model components, avoiding repetitive tasks and greatly enhancing efficiency.
Comparison of modeling time.
Based on a pre-trained deep learning model, defect images collected from experiments are inputted for automatic segmentation and width calculation. To reduce computational load, high-definition images (3840 × 2160 pixels) are cropped to 600 × 800 pixels, preserving essential defect details. As shown in Figure 13, the first row displays the original defects, and the second row shows segmentation results. The model includes an encoder, upsampling, feature fusion, side output, and output modules, capturing multi-scale and fine-grained features. Feature fusion enhances segmentation accuracy and width measurement precision, while side outputs stabilize training. Preliminary experiments show a mean Intersection over Union of approximately 88% and a processing speed of 10–12 frames per second on a standard GPU, demonstrating reliable and efficient defect quantification.
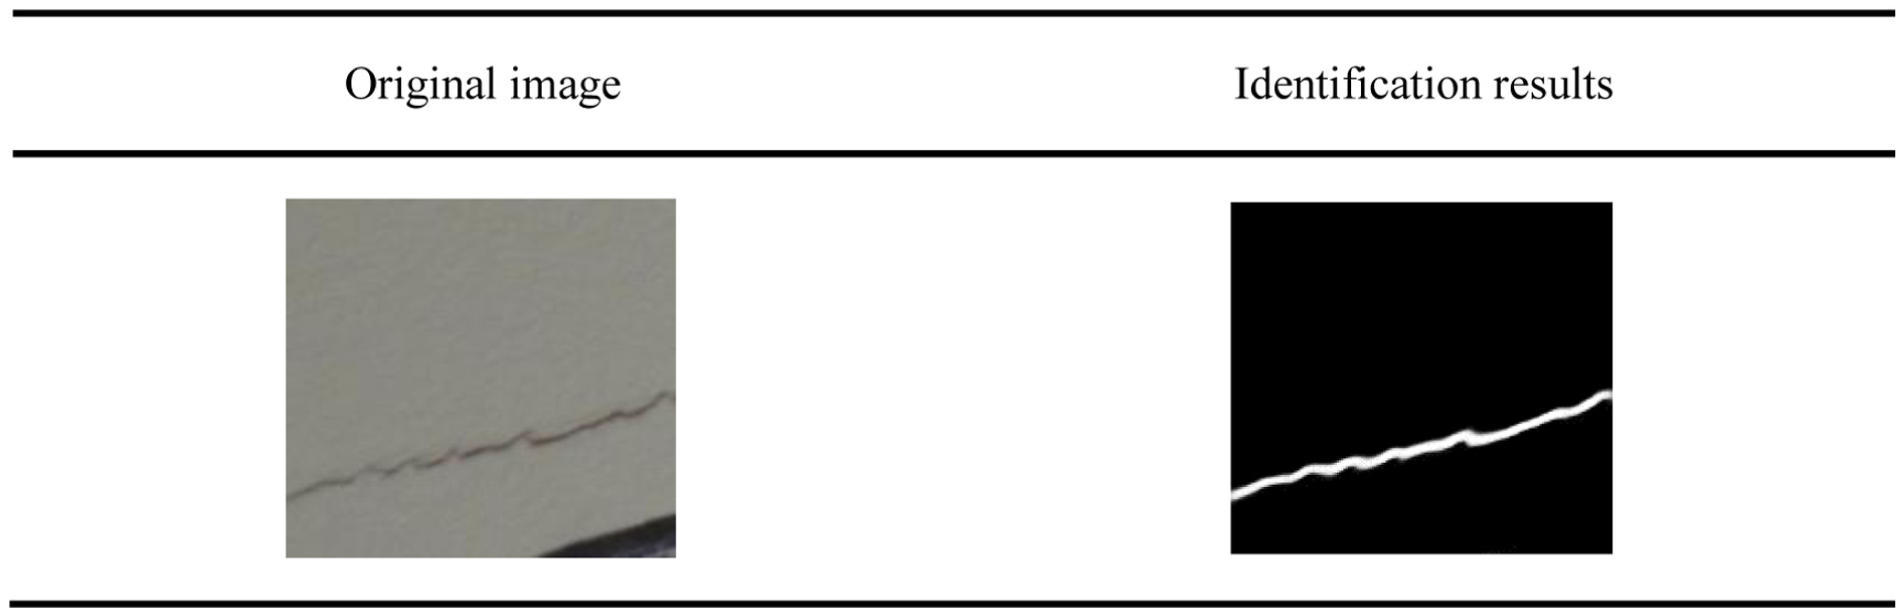
Damage identification result.
Building upon the intelligent segmentation based on deep learning, quantitative information of defects is further automatically calculated by integrating image processing methods. First, threshold segmentation is applied to the pixel-level recognition results of cracks, which involves binarizing the predicted image according to a specific threshold. Subsequently, the total number of defect pixels can be calculated, thereby obtaining a pixel-level representation of the defect image. Following this, the total area occupied by the defects can be computed as:
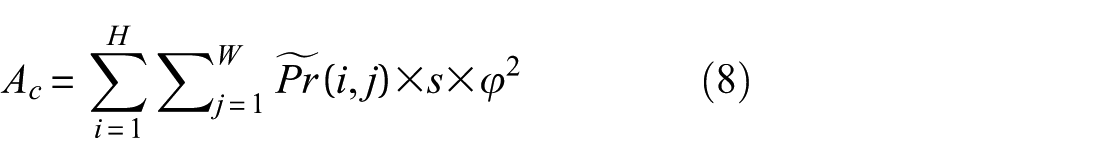
where
When the defect is identified as a crack, further algorithms are required to calculate the crack’s length and width. Finally, the medial axis transform (MAT) method is employed to extract the crack’s skeleton and compute its total length. Skeletonization is the process of converting the multi-pixel representation of a defect into a single-pixel-width skeleton. After extracting the defect’s skeleton, the formula for calculating the defect’s length
where
Based on this, the average width of the defect can be automatically calculated as:
where
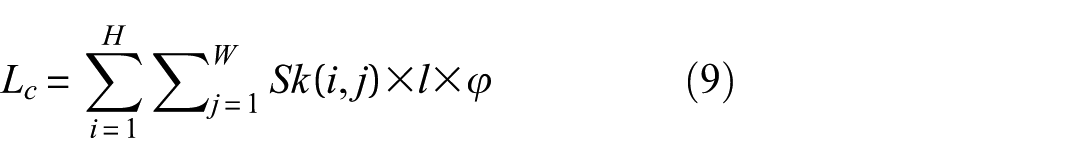
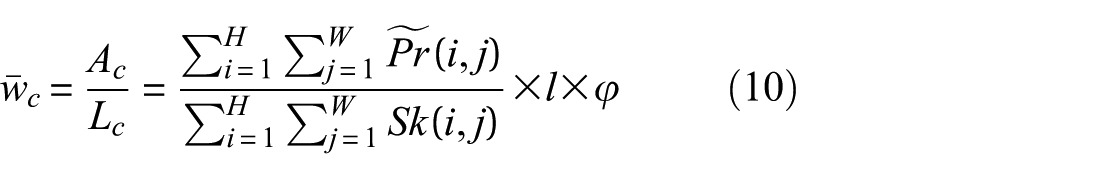
As demonstrated in Figure 14, linear defects such as cracks are visualized by generating corresponding points based on the coordinate values of each point along the crack as recorded in the data file. A continuous centerline is then established using these points. Along this line, cylindrical segments are generated, with radii determined according to the actual widths, and some segments with excessively small widths may be appropriately enlarged. These cylindrical segments are subsequently integrated and imported as BrIM objects. This method enables the precise visualization of crack shapes and facilitates automated integration of inspection data with the bridge model.
Result of generating BrIM object. BrIM: bridge information modeling.
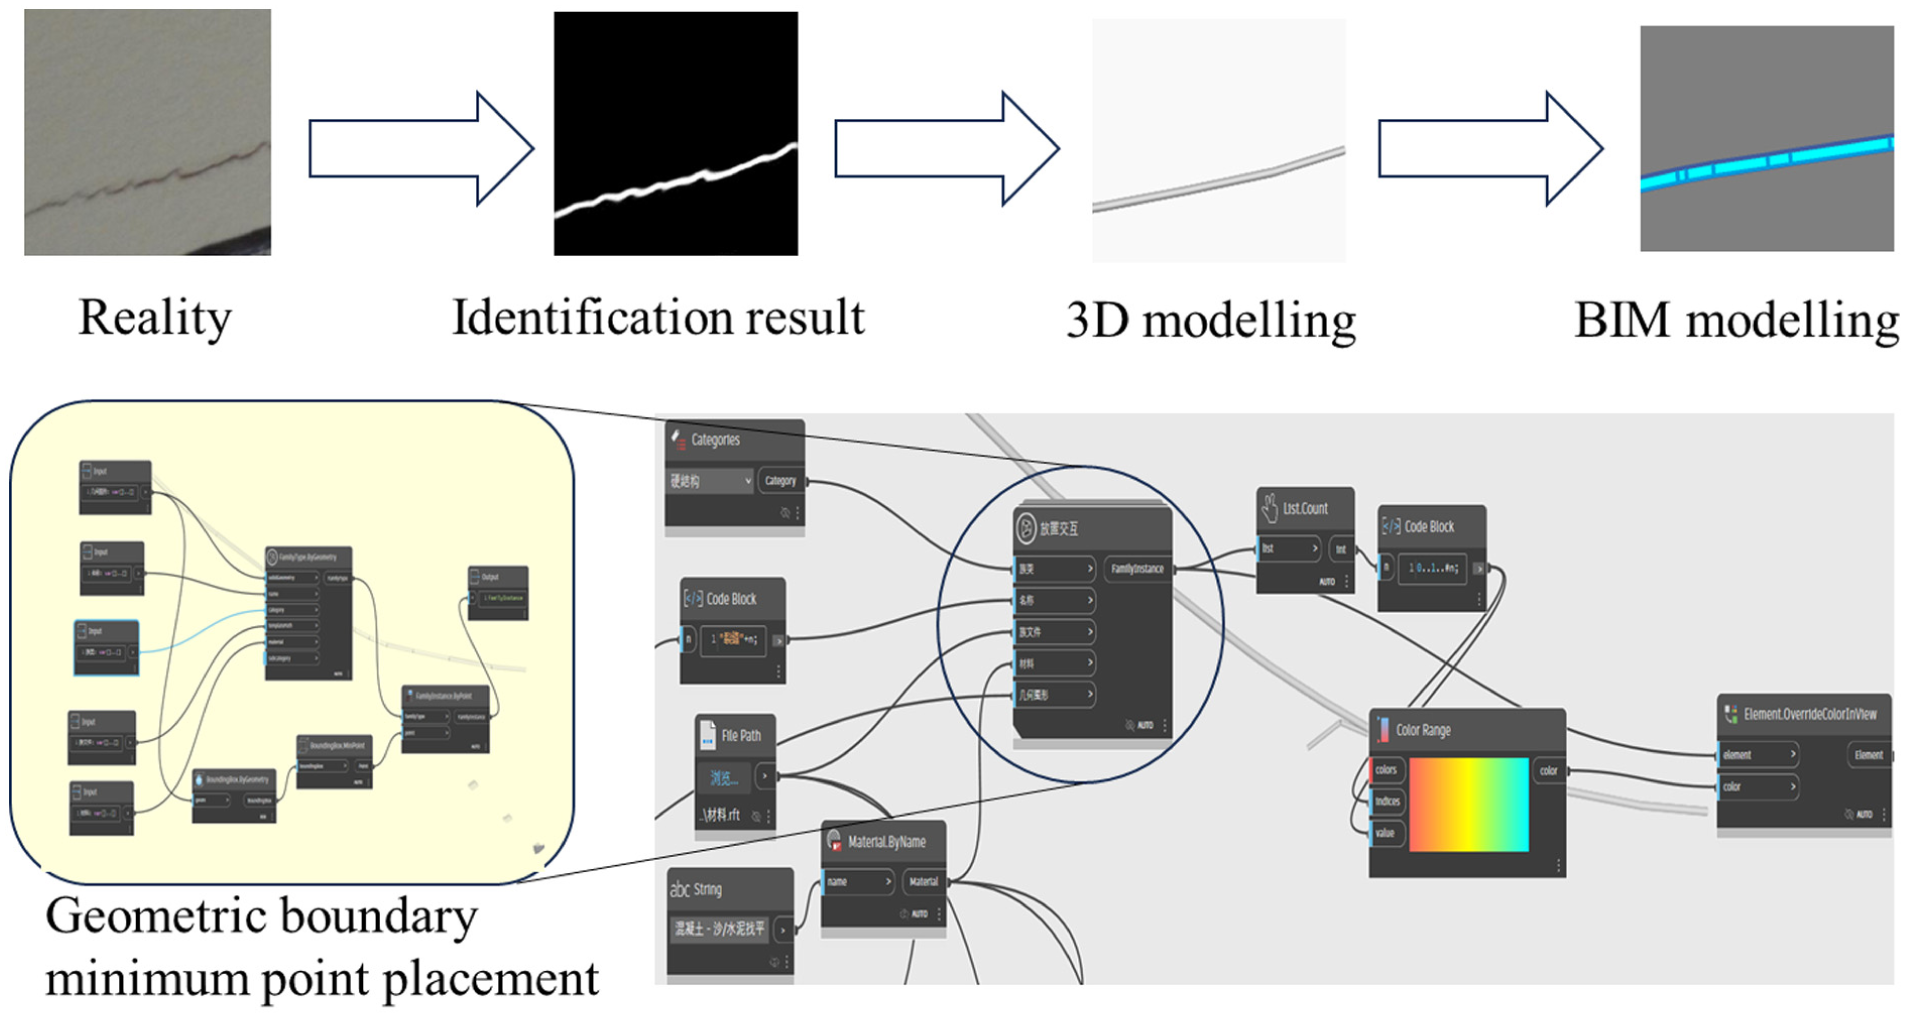
Quantitative analysis of common defects, such as cracks, was conducted using deep learning segmentation and image processing. Cracks were first recognized at the pixel level using a deep learning model, followed by image binarization to distinguish defect and background pixels. The total defect area was calculated using pixel counts, image dimensions, and scale factors, yielding 5 mm2. Skeleton extraction via the MAT allowed accurate computation of crack length (0.5 m), maximum width (0.015 mm), and average width (0.01 mm), providing precise quantitative data for defect management. Subsequently, color-based visualization was implemented to represent deterioration, involving parameter extraction, attribute assignment by structural units (Figure 15), and mapping of area and depth data. Visualization parameters were applied to BrIM using graphic options, enabling intuitive and operable representation of deterioration severity, thereby enhancing the scientific rigor and efficiency of structural health assessment.
Detail of BrIM digitalization integrating inspection data. BrIM: bridge information modeling.
In Dynamo, time-varying defect information is managed through dynamic time-dimension code blocks, with variations in defect widths visually distinguished by color to provide an intuitive representation of defect evolution. Associative programming nodes enable parallelization of temporal parameters across multiple defect widths. As illustrated in Figure 16, the dynamic evolution of defects from 2021 to 2024 is visualized, encompassing iterative updates of crack widths and the concurrent evolution of the corresponding 3D model. Dynamo functions as an intermediate control platform, facilitating continuous iteration of measured defect data and real-time model updates, thereby supporting the development of a refined BrIM and the dynamic management of associated structural information. Unlike conventional static visualization approaches, the developed method enables dynamic updating and interactive representation of crack information in the model environment. By dynamically linking the spatial distribution, severity, and temporal evolution of cracks to corresponding structural components, the model provides an integrated view of both geometric and damage states. This implementation transforms crack visualization from a simple presentation tool into a functional mechanism for data-driven bridge condition assessment and maintenance decision-making, thereby enhancing the interpretability and applicability of inspection data within intelligent bridge management systems.
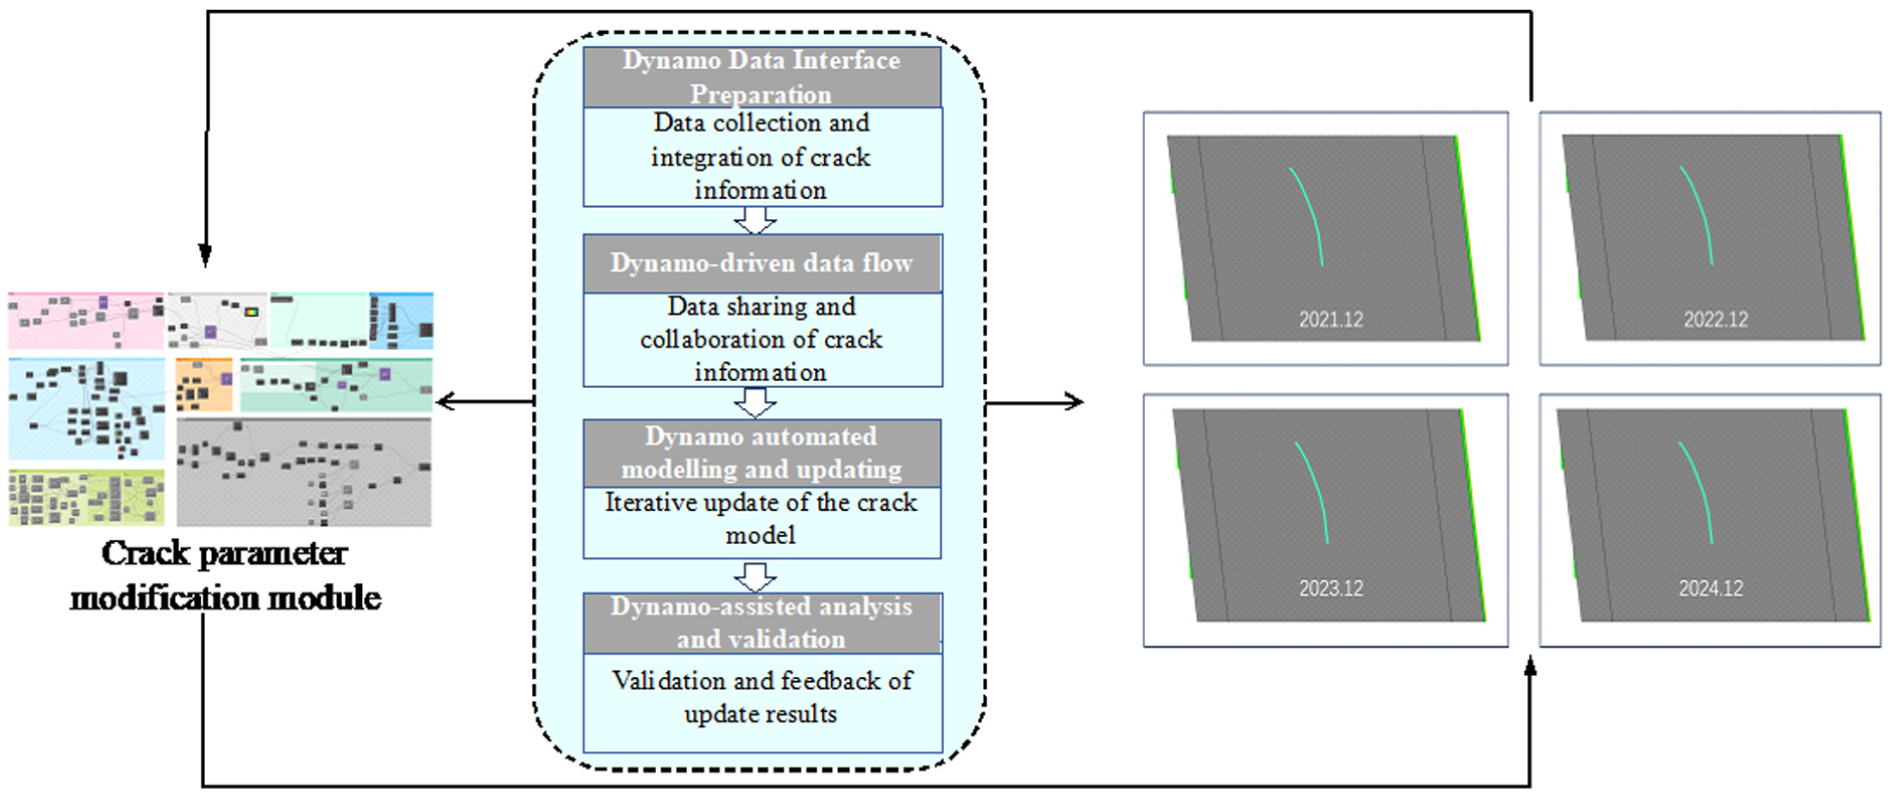
Visualization of the iterative update of damage dynamics.
Dynamo structures components within a family–type–instance hierarchy, with attribute modifications primarily applied to family instances. In this study, sensors are modeled as cubic components (Figure 17), with geometry constructed using the “Solid.ByLoft” method and positioned at their actual locations. After standardizing the input data, the “Data.ImportCSV” or “Data.ImportExcel” functions import the data as a list, from which item names are extracted to define project parameters via “Parameter.CreateProject Parameter.” Invalid entries are filtered out, and specific sensor parameters are updated in real time using “Element.SetParameterByName.” The workflow further enables dynamic adjustment of component colors to reflect operational status and potential risks. When monitoring data exceed predefined thresholds, components automatically change color (red for critical alerts, yellow for warnings), thereby facilitating rapid identification of problematic areas and supporting timely corrective actions.
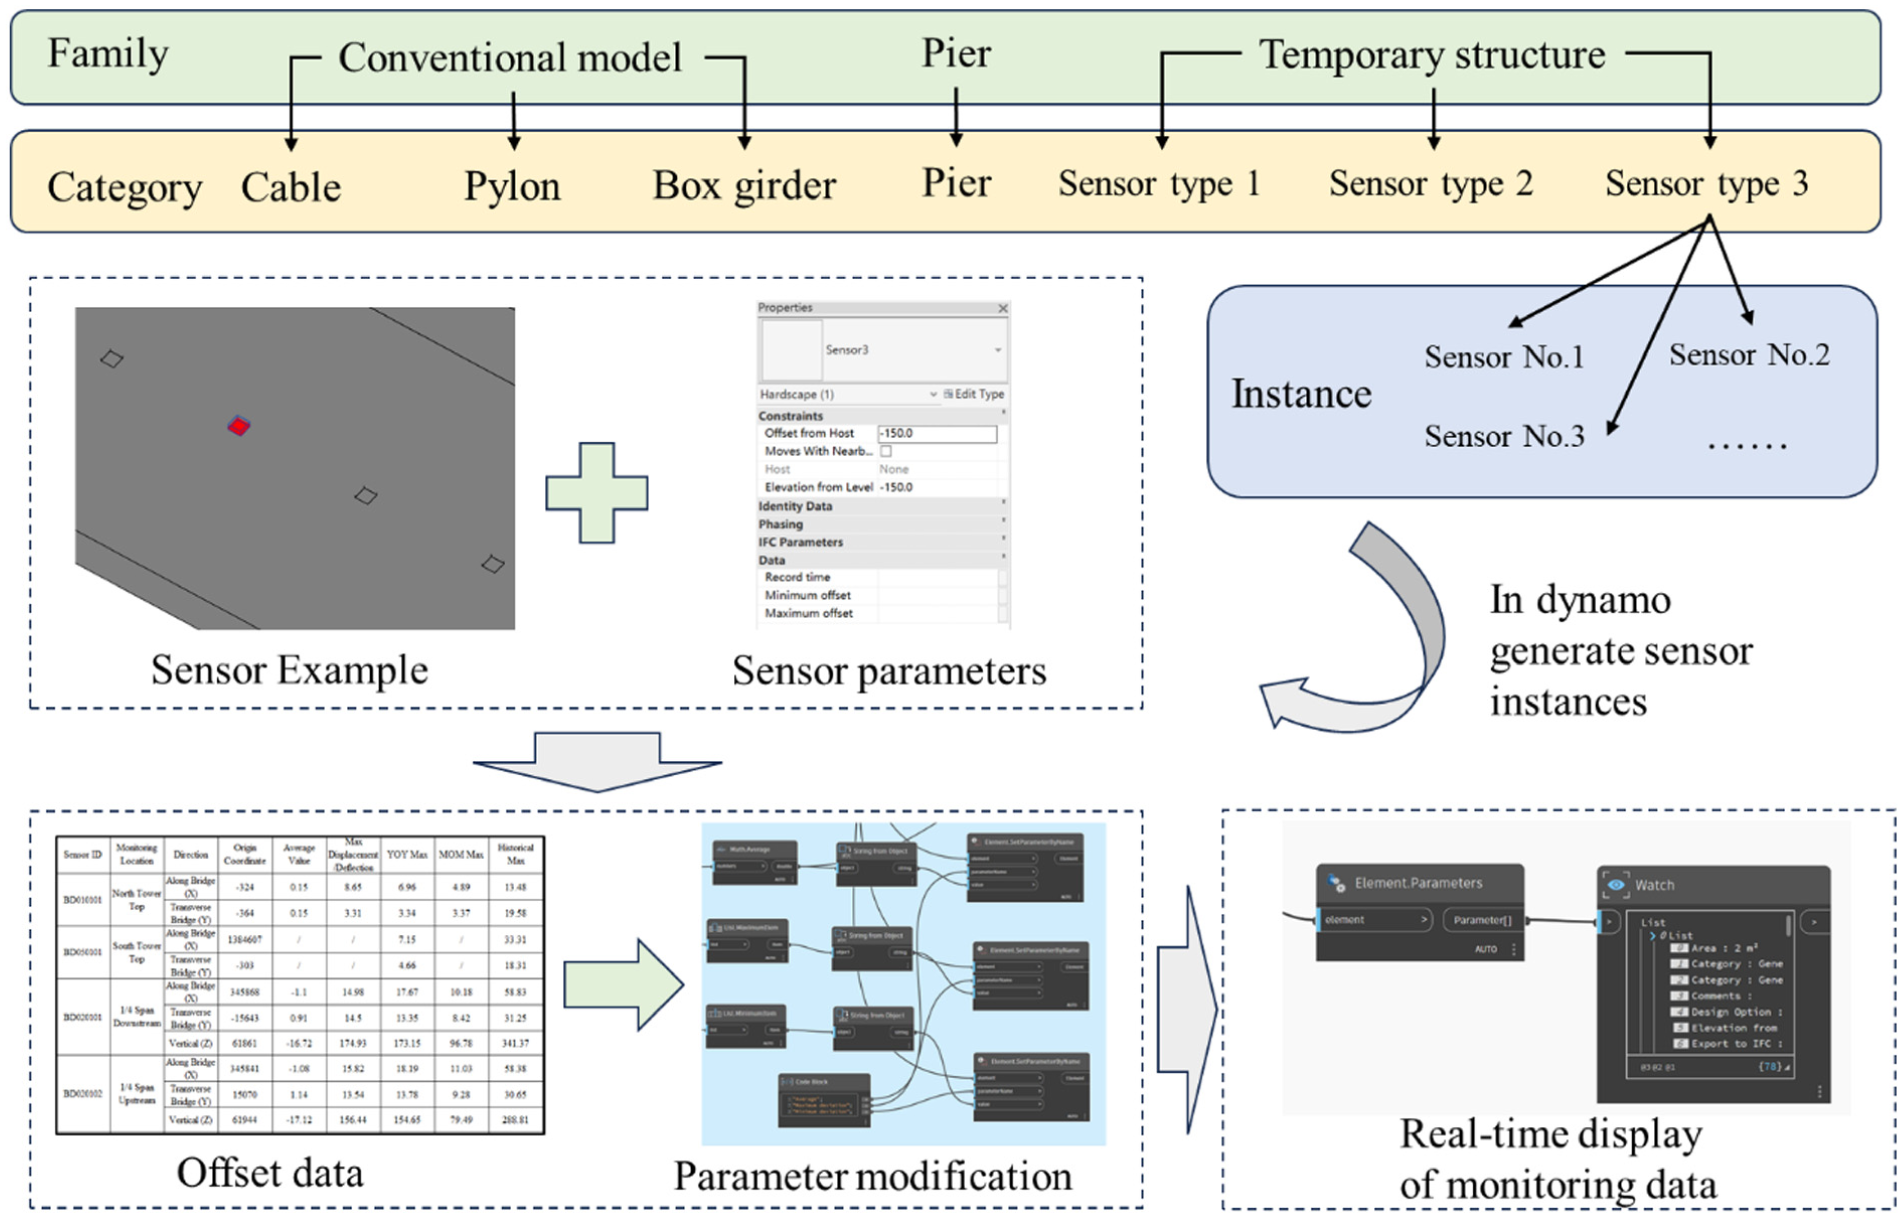
Dynamo changes the value of an attribute on a specific element.
During the BrIM construction process for the Second Nanjing Yangtze River Bridge, establishing an association between the BrIM and monitoring data is of paramount importance. Through parametric modeling and dynamic update technologies, the BrIM not only reflects the bridge’s design intent and construction process but also enables real-time integration and visualization of monitoring data, allowing for dynamic tracking of the bridge’s condition. As illustrated in Figure 18(a), each component within the BrIM is assigned a unique identification code, which corresponds one-to-one with sensors in the monitoring system. Once data are collected by the sensors, it is automatically imported into the corresponding component attributes within the BrIM through an interface program. This association enables management personnel to dynamically retrieve and review monitoring information for components, such as stress and deformation, during the construction process. Furthermore, through a color-coding module, the BrIM can visually present the results of monitoring data. For instance, when stress at a certain location exceeds the safety limit, the corresponding component is displayed in a warning color within the BrIM, making potential issues immediately apparent.
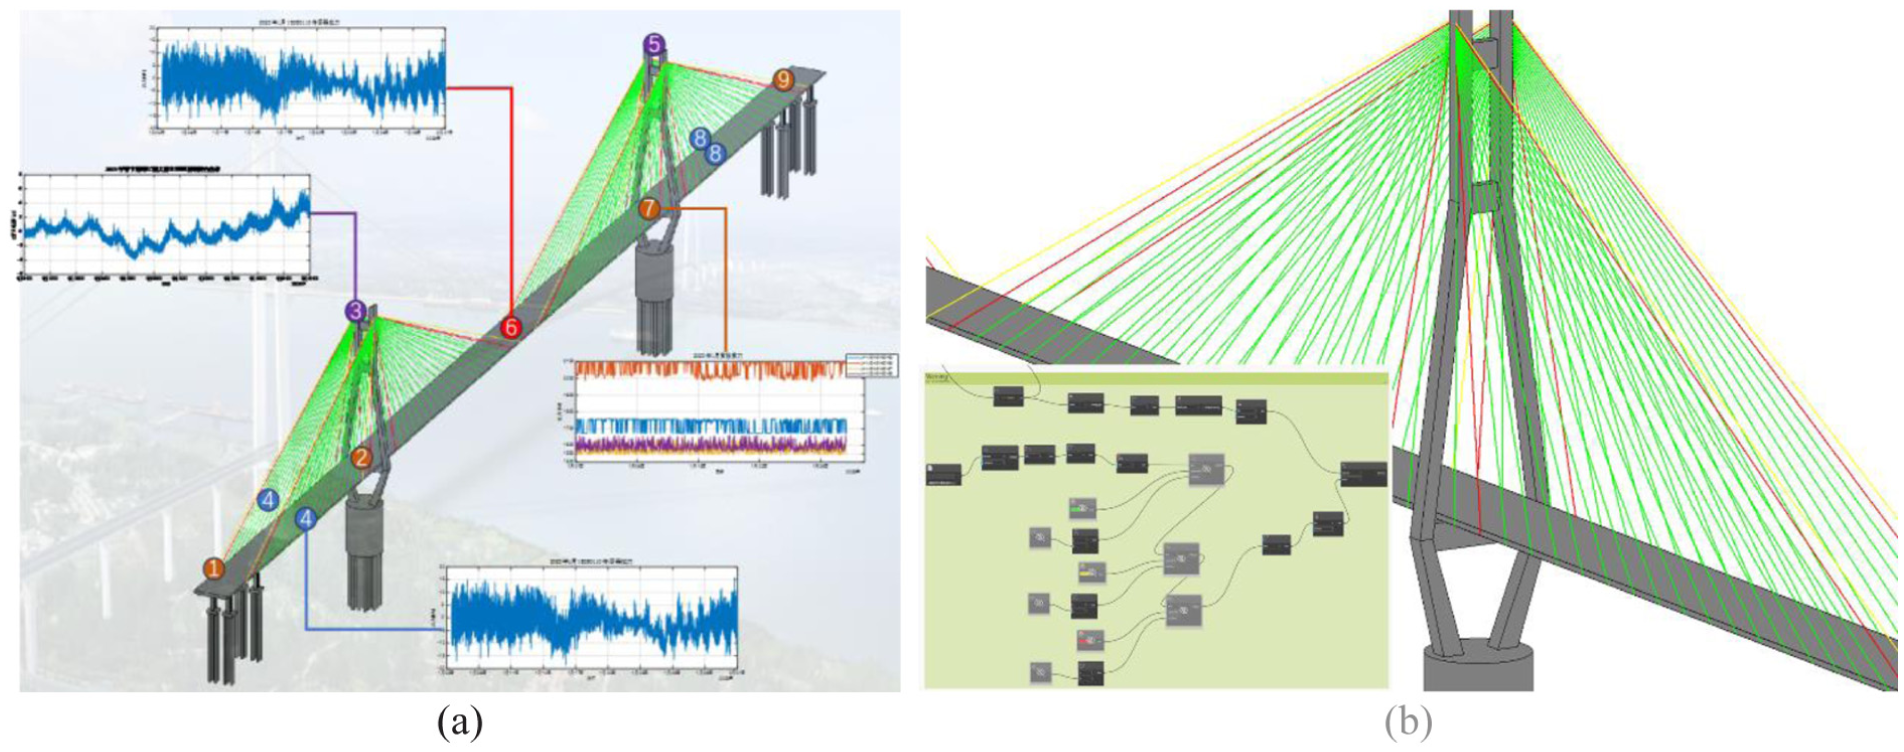
Results of the BrIM digitalization correlation monitoring data: (a) display of monitoring data and (b) display of the cable warning function. BrIM: bridge information modeling.
As shown in Figure 18(b), by setting appropriate monitoring thresholds, the model can achieve automatic early warning for the condition of stay cables, thereby further enhancing the safety management and maintenance efficiency of the bridge. Within the BrIM, specific threshold parameters are established for each stay cable. During the construction phase and the bridge’s operational period, monitoring sensors continuously collect data from the stay cables and transmit it to the BrIM through the interface program. When any monitored indicator approaches or exceeds the predefined threshold, the BrIM automatically triggers an early warning mechanism, providing precise information support for O&M personnel.
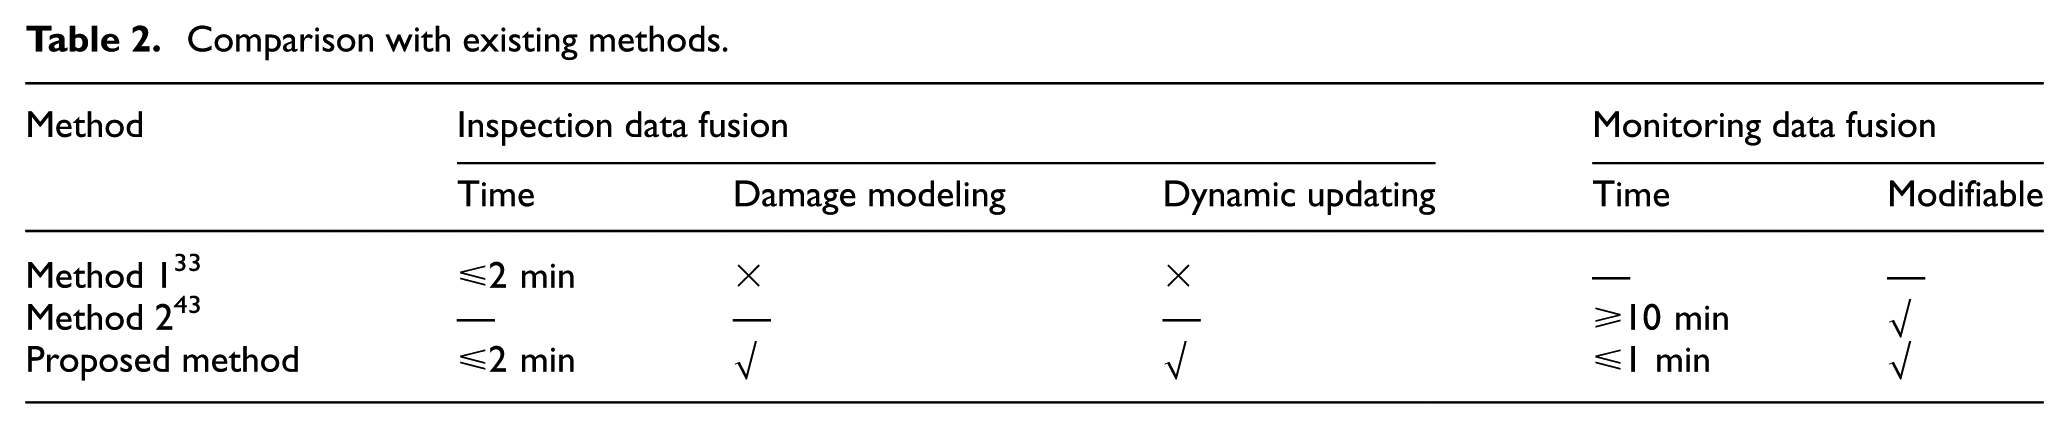
As shown in Table 2, method 1 33 is limited to inspection data fusion, whereas method 2 43 applies only to monitoring data fusion. The approach proposed in this study overcomes these constraints by enabling the concurrent integration of both inspection and monitoring data, thereby more accurately capturing the complex characteristics of bridge structural O&M. Regarding inspection data fusion, method 1 33 requires approximately the same processing time as the proposed method but is limited in functionality, as it only attaches crack information to tables without supporting actual crack modeling. Furthermore, existing methods, including method 1, are difficult to implement for long-term automated dynamic updates, whereas the proposed approach not only completes processing efficiently within 1 min but also enables dynamic updates and supports actual crack modeling. For monitoring data fusion, method 2 43 requires at least 10 min and allows data modification but exhibits low efficiency. By contrast, the proposed method achieves processing within 1 min while supporting editable data, demonstrating clear advantages in both efficiency and flexibility. These improvements are primarily attributed to automated data association: unlike manual methods, which necessitate individually locating each component and manually attaching monitoring data, the proposed method automatically identifies the corresponding components and attaches monitoring data, thereby eliminating repetitive operations and significantly enhancing both speed and accuracy.
Comparison with existing methods.
Conclusions
To address the issue of inadequate integration between inspection/monitoring information and BrIM digitalization, this paper proposes a DT framework for long-span cable-stayed bridges that integrates inspection and monitoring data with automated modeling. The main contributions are as follows:
A framework for integrating inspection and monitoring data with automated modeling is proposed. Leveraging the automated BrIM capability of Dynamo, this framework synchronizes SHM data and inspection data with BrIM digitalization, providing comprehensive support for full lifecycle management of bridges.
An efficient bridge modeling method using point cloud data and Dynamo visual programming is developed. High-precision 3D point cloud data are obtained via laser scanning, and geometric information is extracted through reverse engineering. Compared with manual Revit modeling, the proposed method reduces total modeling time from approximately 240 to 180 min while maintaining high accuracy and enabling flexible parameter modifications.
A parameter-based method for dynamically updating defect inspection data and associating monitoring data is introduced. Deep learning algorithms automatically extract defect information, and Dynamo’s parametric modeling allows rapid updates and visual representation of inspection data within the BrIM digitalization. In inspection data fusion, processing time is similar to existing methods, but actual crack modeling and long-term dynamic updates are enabled. For monitoring data fusion, processing time is shortened from ≥10 min to approximately 1 min, while allowing editable data. Each bridge component is assigned a unique identification code corresponding to monitoring sensors, and thresholds are set for critical components such as stay cables, triggering early warnings when exceeded. This approach significantly improves both efficiency and flexibility over existing methods.
The framework is applied to the Second Nanjing Yangtze River Bridge. The feasibility and effectiveness of the proposed DT framework are validated, demonstrating applicability for bridge O&M management and providing a reference for DT applications in similar large-scale infrastructure projects.
The prospective directions of this research are outlined as follows. A BIM-to-FEA data pipeline is to be established to realize efficient and automated conversion from design-phase BrIM to analysis-phase finite element models, thereby eliminating information discontinuity between design and analysis domains. Adaptive image acquisition will be achieved through intelligent positioning technology, enabling inspection devices to dynamically adjust their spatial position and orientation according to bridge configuration and target characteristics, thus ensuring optimal data capture. Furthermore, a cloud-based DT platform will be developed to achieve integrated management of models and monitoring data, incorporating web-based modules for visualization, analysis, and collaborative remote monitoring. With the continuous advancement of artificial intelligence and information technologies, the proposed framework is expected to provide a robust foundation for data-driven bridge maintenance planning, resource allocation, and decision-making.
Footnotes
Declaration of conflicting interests
The authors declared no potential conflicts of interest with respect to the research, authorship, and/or publication of this article.
Funding
The authors disclosed receipt of the following financial support for the research, authorship, and/or publication of this article: The research presented was financially supported by the China Scholarship Council (no. 202506090018), the Postgraduate Research and Practice Innovation Program of Jiangsu Province (no. SJCX24_0085), and the SEU Innovation Capability Enhancement Plan for Doctoral Students (no. CXJH_SEU 24096).