
Abstract
Given the deficiencies of existing methods, this work investigates a novel methodology for monitoring the deformation safety of in-service ultra-high arch dams. Regarding observation point group (OPG) with similar spatiotemporal deformation pattern as the modeling object, the deformation principal component (DPC) analysis model is constructed. Adaptive adjustment approach, Gaussian mutation disturbance, and Tent chaotic disturbance are introduced to optimize the search ability of sparrow search algorithm (SSA). Using the improved SSA, the parameter optimization approach of the DPC model is established. The four-level monitoring criteria are proposed by comprehensively considering the deviation degree between DPC and elastic state and the combined control limit of DPCs. Using the radial deformation observation data of the studied dam, the effectiveness of the proposed methodology is verified. The following findings are obtained. The established DPC analysis model can effectively reveal the main deformation patterns of OPGs. The improved SSA shortens the computation time, avoids premature convergence, and improves the DPC analysis model performance. The probabilistic and physical significance of the established four-level criteria is stricter than that of confidence interval criteria. Compared with confidence ellipsoid method, the proposed criteria are more conducive to practical engineering applications. The research provides technical support for the improvement of safety monitoring capability, disaster prevention, and lifetime extension of in-service ultra-high arch dams.
Keywords
Highlights
Deformation similarity relationship and principal component feature are considered.
Deviation degree between observation value and elasticity status is characterized.
SSA is improved by integrating multiple strategies for parameter optimization.
The combined control limit of DPCs is constructed based on multivariate statistics.
The safety monitoring criteria possess stricter probabilistic and physical meanings.
Introduction
China has abundant water resources with a total volume of approximately 2.8124 × 10⁹ m3, accounting for about 6% of the total water resources in the world. The potential hydro-energy reserve is approximately 6.8 × 10¹⁰ kW. Hydro-energy has numerous advantages, for example, stable supply, low pollution, and renewability, and it has become an important component of the energy supply in China. Since the 1950s, China has built more than 9.8 × 10⁴ dams for the application requirements of flood protection, electric power generation, irrigation, water supply, and so on. These water conservancy projects play crucial roles in China’s socioeconomic development.1,2
With the in-depth promotion of hydropower development, remarkable achievements have been made in the domain of ultra-high arch dam, as shown in Figure 1. Some concrete arch dams with height larger than 200 m, such as Jinping I arch dam (Yalong River, 305 m), Xiaowan arch dam (Lancang River, 294.5 m), Xiluodu arch dam (Jinsha River, 285.5 m), and Dagangshan arch dam (Dadu River, 210 m), have been built for hydropower cascade development.1,2 In addition, several projects in western China, for example, Yebatan arch dam (Jinsha River, 217 m), are under construction, and some others, for example, Longpan arch dam (Jinsha River, 277 m), are under plan. Ultra-high arch dams are constructed in alpine gorge areas. Project safety is influenced by multiple factors, for example, huge reservoir water load, high stress level, landslide, geological fault, earthquake, temperature crack, and high-speed flow.3–6 Due to the disastrous consequences of dam failure, great demands are placed on the safety monitoring of ultra-high arch dams during their long-term operation process. Deformation, a crucial in situ observation item, reveals the evolution of dam safety status. Ultra-high arch dams are equipped with numerous observation instruments. In-depth analysis of deformation observation data is not only a requirement specified in relevant standards but also the most direct means to explore the deformation characteristics of ultra-high arch dam. Developing objective deformation analysis models and safety monitoring criteria has important theory significance and application value.
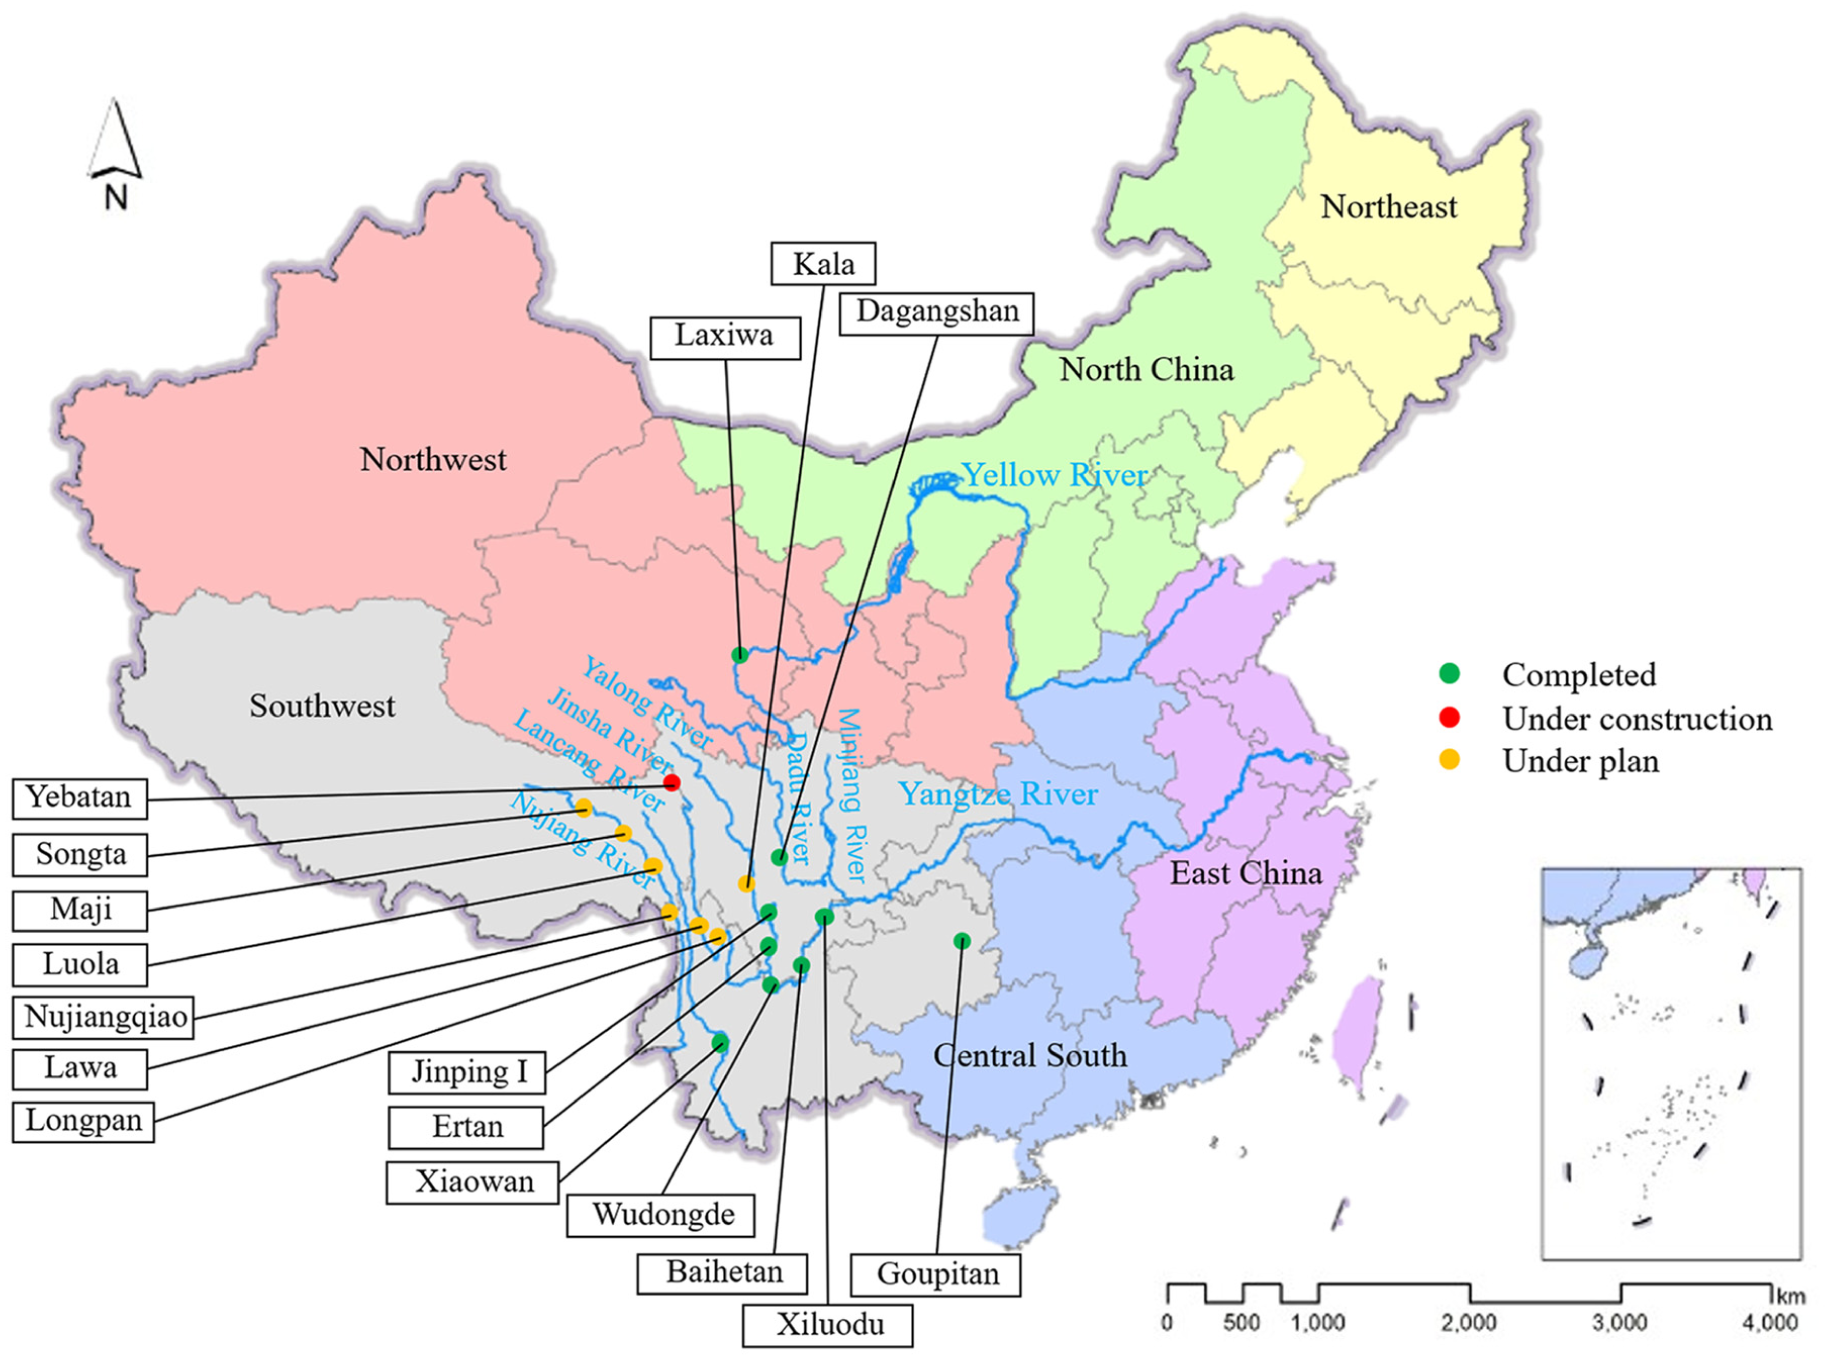
Typical ultra-high arch dams of China.
Conventional deformation analysis models include statistical model, hybrid model, and deterministic model. With the in-depth development of research, modern mathematical theories, such as neural network, deep learning, meta-heuristic algorithm, and numerical simulation, have been successfully applied.7,8 Composite modeling approach in which multiple intelligent algorithms are integrated has become one of the research hot spots. For safety monitoring criteria, there are three basic analysis ways, that is, typical small probability method, confidence interval method, and structure calculation method,9–13 which have been widely applied in practical engineering. It seeks to render a scientific judgment on whether the deformation behavior of the target dam is within a safe range, predicated on a rigorous analysis of their deformation characteristics. On the whole, deformation analysis models and safety monitoring criteria have gradually evolved from simple models to more sophisticated ones, from phenomenological observation to in-depth understanding of underlying essence, from theoretical exploration to practical implementation, from offline-based approaches to real-time online analysis, and from one-dimensional estimation to multi-dimensional assessment.
Arch dam, a three-dimensional shell structure, transfers external loads to dam abutment and foundation via arch-beam system. Most of the existing models regard the deformation behavior of an observation point as modeling object. However, point deformation only reflects local characteristics and cannot characterize spatial interactions of different zones. Using deformation observation data of observation point group (OPG), there are mainly two basic ways to build deformation analysis models, that is, spatial-temporal model and panel model, as given in Table 1. The two types of models involve numerous factors, and the problem of multi-collinearity among independent variables is significant. Moreover, observation points on an ultra-high arch dam can be grouped according to deformation similarity features. Several models do not take the characteristics into account. Safety monitoring criteria, for example, information entropy method21,22 and confidence ellipsoid method,23,24 are established to analyze the deformation safety of OPG. Information entropy method is based on probability statistics. Although this method is beneficial for practical application, it cannot effectively characterize the interactive effects of structure type, load, material, topography, geology, and so on. Confidence ellipsoid method considers the actual situation to some extent, and the probability and physical significances are relatively stricter. However, the construction process of confidence ellipsoid is complicated, and it is difficult to extend to ultra-high dimensions. Existing studies have certain insufficiencies. Related research still needs further investigation.
Deformation analysis models of OPG.
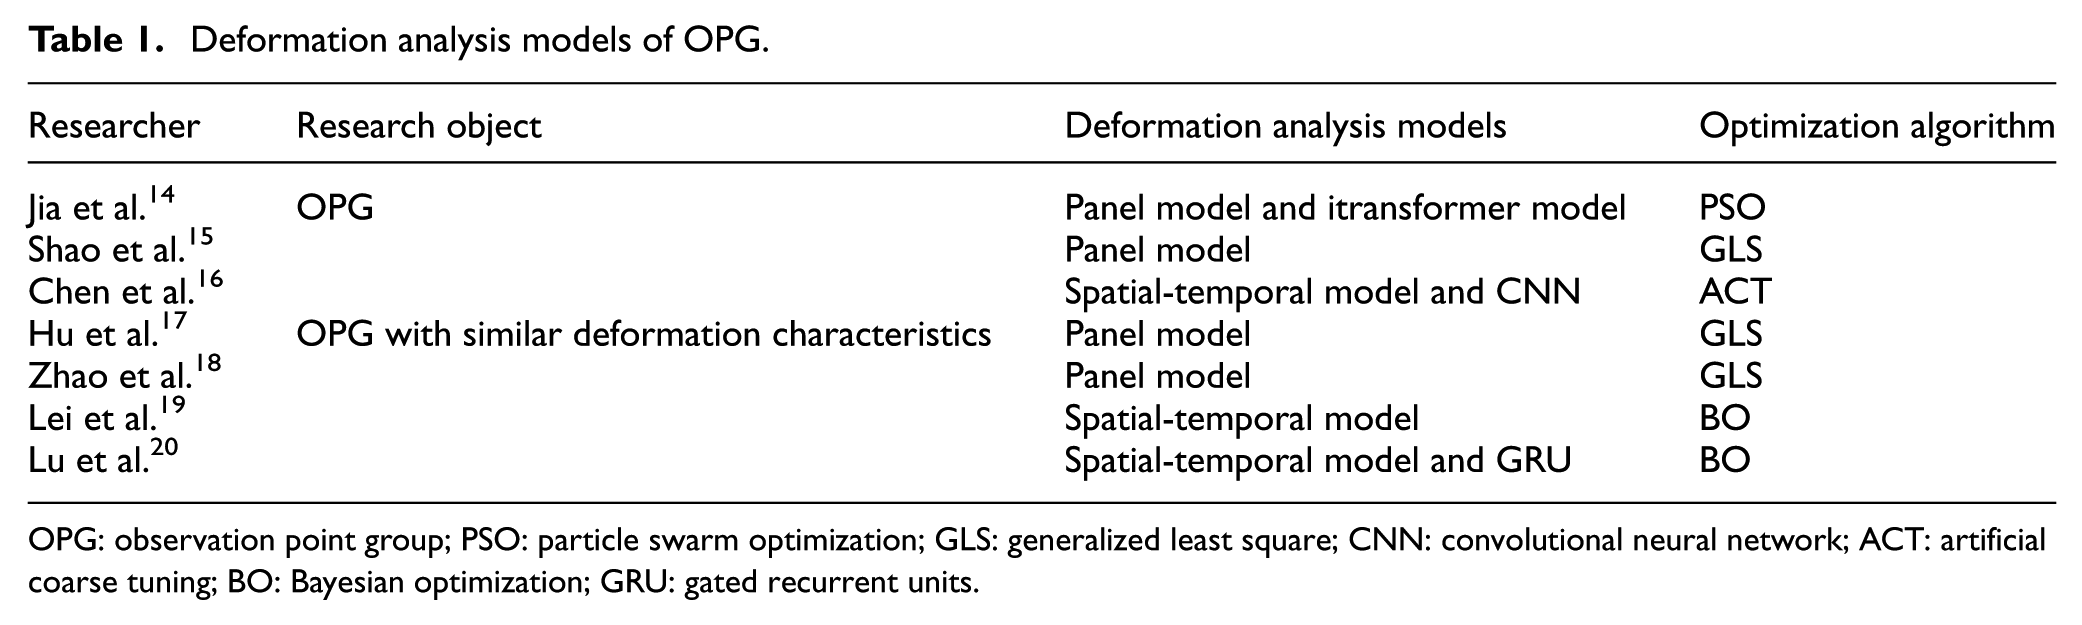
OPG: observation point group; PSO: particle swarm optimization; GLS: generalized least square; CNN: convolutional neural network; ACT: artificial coarse tuning; BO: Bayesian optimization; GRU: gated recurrent units.
Taking OPG with similar deformation characteristics as the research object can more accurately reflect the operational status of arch dam. Yang et al., 25 Hu and Ma, 26 Xu et al., 27 and Cao et al. 28 used hierarchical clustering to produce OPGs with similar deformation characteristics. Hierarchical clustering can obtain the natural clustering structure of data through unsupervised learning, which can realize the reasonable decomposition of the spatiotemporal differentiation characteristics of dam deformation. It provides a foundation for the monitoring model construction of OPG. Principal component analysis (PCA) is an effective method to mine hidden features of spatiotemporal data. By fusing monitoring data using PCA, rapid diagnosis of the overall deformation behavior of the target dam can be achieved.29,30 This approach can effectively reduce the number of monitoring models and lowers the probability of false alarms. However, the existing methods have certain insufficiencies. On the one hand, the mathematical mechanism of deformation principal component (DPC) is not fully considered in characterizing hydraulic pressure component, temperature component, and aging component. On the other hand, there are usually multiple DPCs, and thus, traditional univariate statistics cannot identify the abnormal conditions of DPCs. The construction approach of the combined control limit of DPCs needs further investigation.
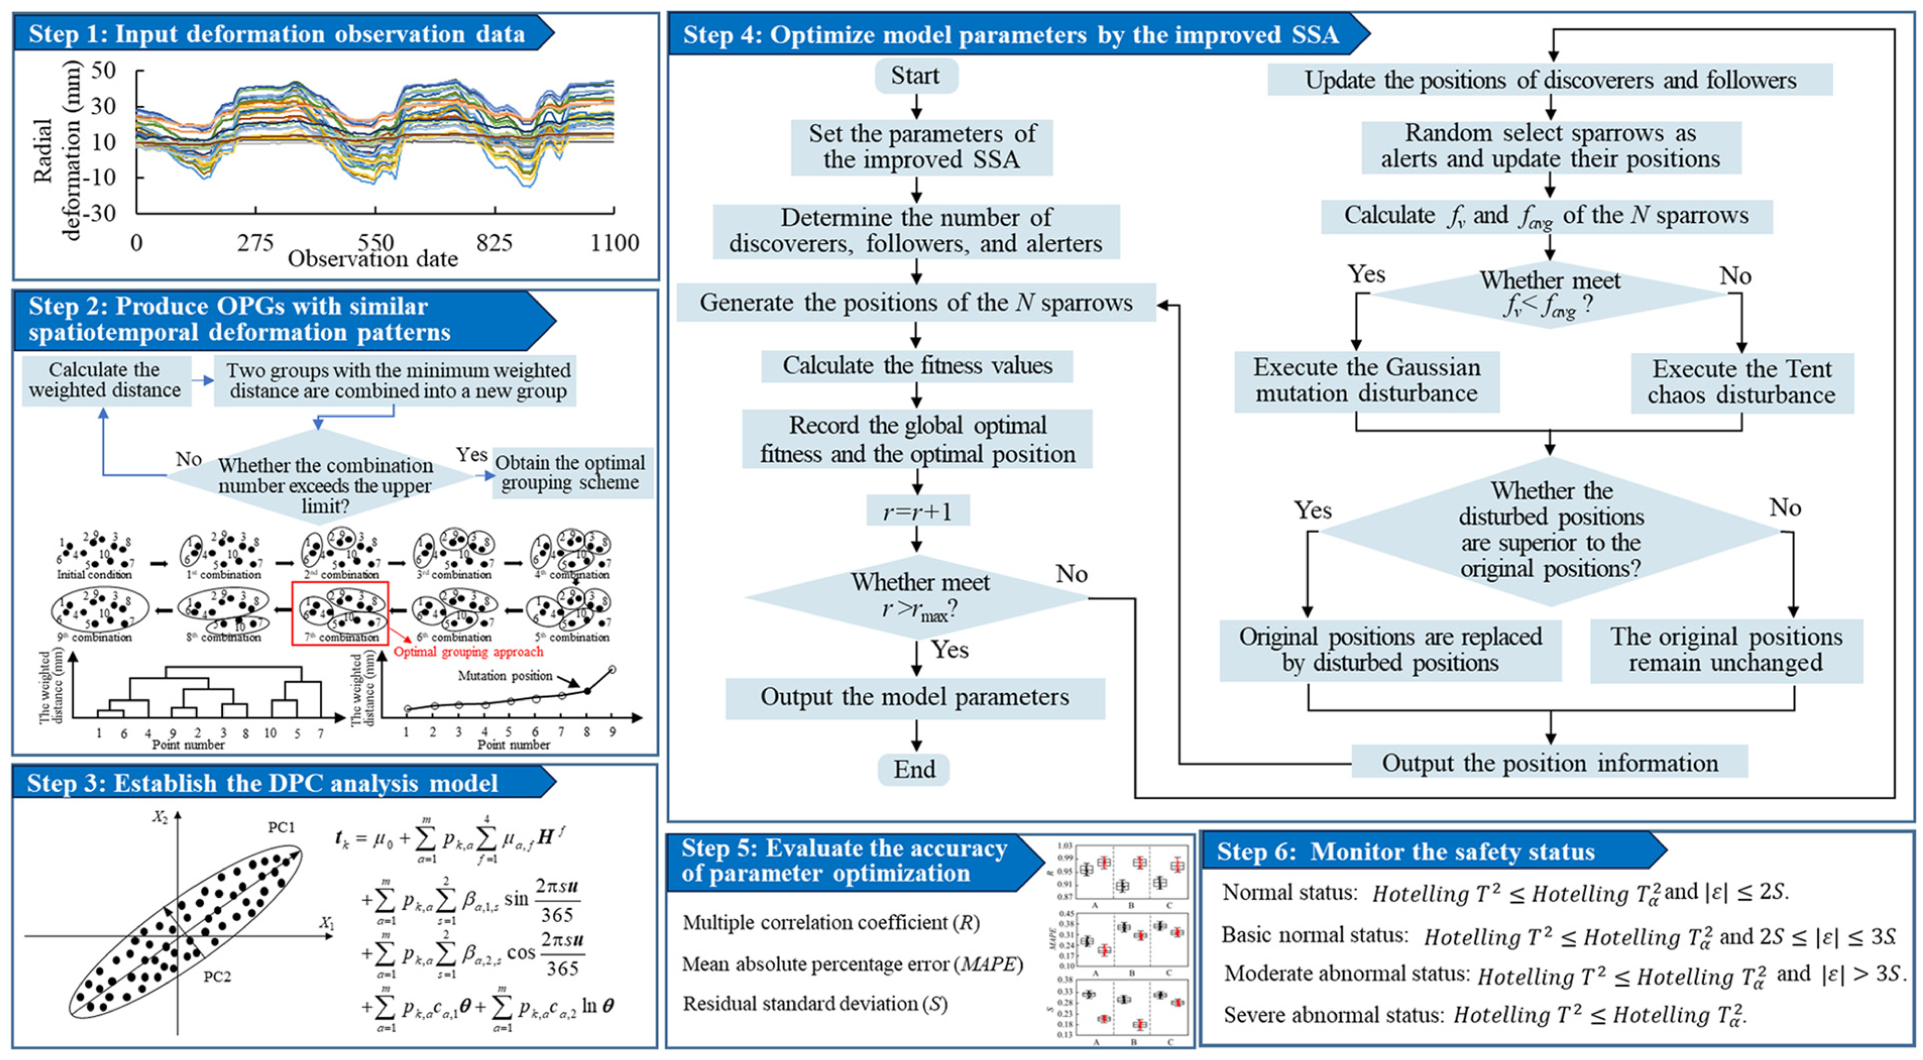
Regarding the deformation behavior of OPG as the modeling object, a novel safety monitoring methodology is proposed utilizing frontier analysis theories and modeling technologies. Radial deformation serves as a critical indicator for evaluating dam safety and is adopted for analysis in this study. This work is organized as follows. The second section introduces the construction process of the developed methodology, and the suggested methodology is verified and discussed in the third section. The fourth section refines the research findings.
Methodology
DPC analysis model
The method given in the study by Yang 24 is used to generate OPGs with similar spatiotemporal deformation feature. At the beginning, one point is labeled as one group. Two groups with the minimum weighted distance are combined into a new group. Algorithm operation is repeated until all points are merged into one group. Pedigree clustering dendrogram is produced to visualize deformation similarity degree. Mutation principle is used to determine the number of OPGs.
Here,
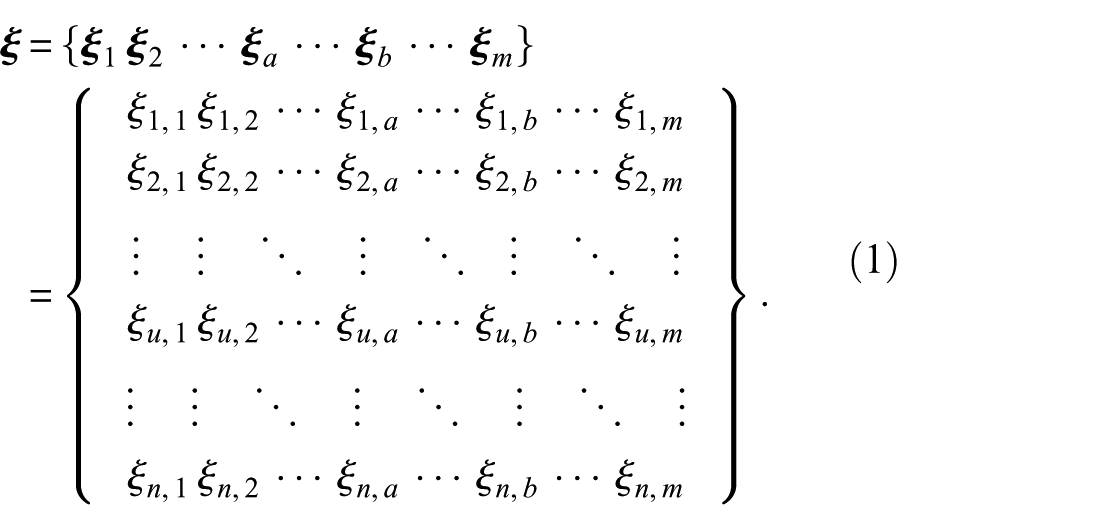
The construction process of DPCs is as follows. Here,
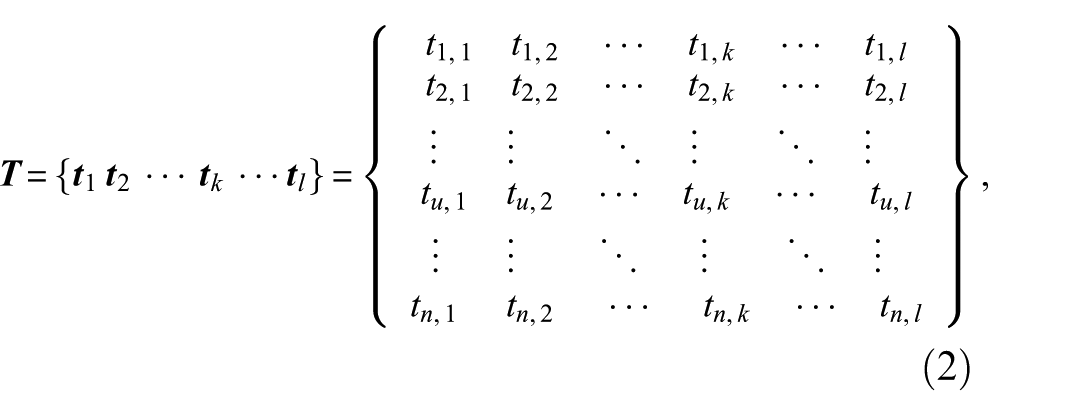
where
According to the mathematical mechanism of PCA,

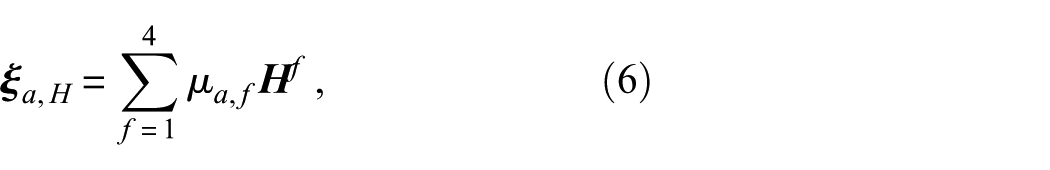
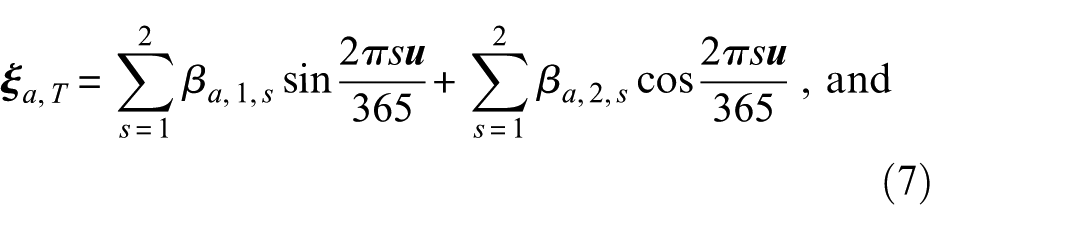
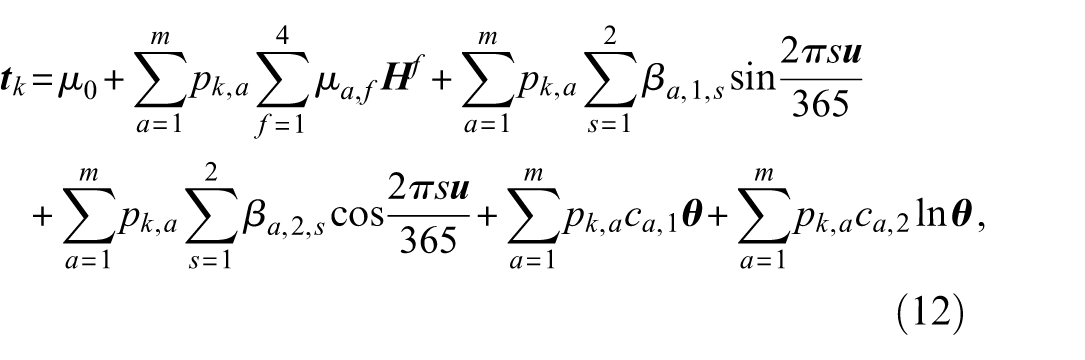
Arch dam deformation can be interpreted as hydraulic pressure component, temperature component, and aging component. In situ observation, numerical simulation, and geo-mechanical model test indicate that hydraulic pressure deformation and temperature deformation are instantaneous elastic deformations, while aging deformation comprehensively characterizes creep effect, plastic deformation, compression deformation, irreversible crack deformation, and so on.33,34 Therefore,

where
where
where
where

where
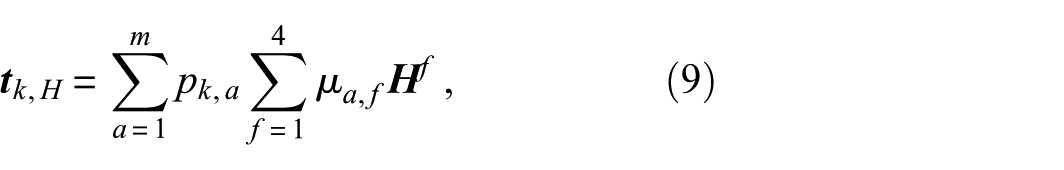
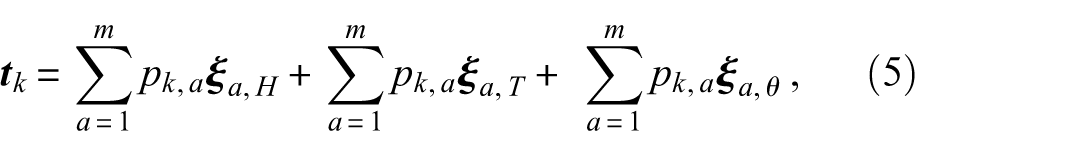
Then,
where
Parameter optimization method
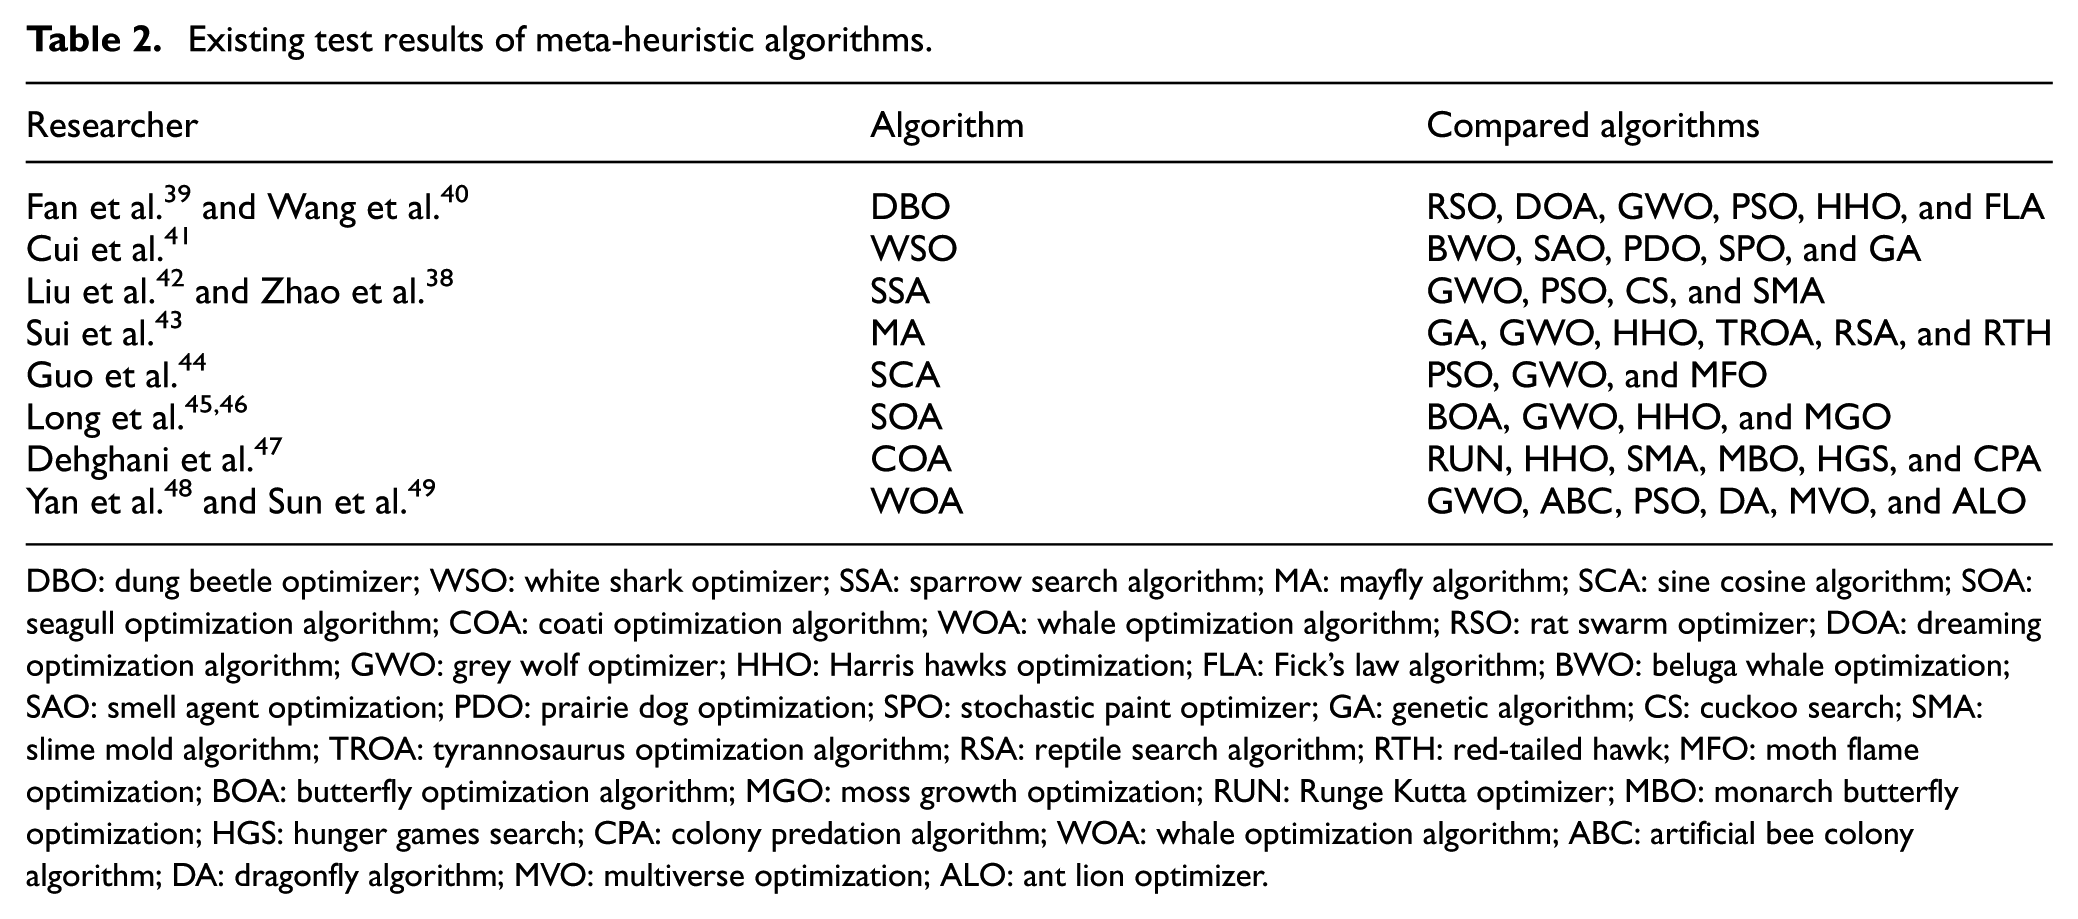
Meta-heuristic algorithm selection. Studies given in Table 2 demonstrate that dung beetle optimizer (DBO), white shark optimizer (WSO), SSA, mayfly algorithm (MA), sine cosine algorithm (SCA), seagull optimization algorithm (SOA), coati optimization algorithm (COA), and whale optimization algorithm (WOA) show good optimization performances. The eight meta-heuristic algorithms are selected for performance comparison in this work.
Existing test results of meta-heuristic algorithms.
DBO: dung beetle optimizer; WSO: white shark optimizer; SSA: sparrow search algorithm; MA: mayfly algorithm; SCA: sine cosine algorithm; SOA: seagull optimization algorithm; COA: coati optimization algorithm; WOA: whale optimization algorithm; RSO: rat swarm optimizer; DOA: dreaming optimization algorithm; GWO: grey wolf optimizer; HHO: Harris hawks optimization; FLA: Fick’s law algorithm; BWO: beluga whale optimization; SAO: smell agent optimization; PDO: prairie dog optimization; SPO: stochastic paint optimizer; GA: genetic algorithm; CS: cuckoo search; SMA: slime mold algorithm; TROA: tyrannosaurus optimization algorithm; RSA: reptile search algorithm; RTH: red-tailed hawk; MFO: moth flame optimization; BOA: butterfly optimization algorithm; MGO: moss growth optimization; RUN: Runge Kutta optimizer; MBO: monarch butterfly optimization; HGS: hunger games search; CPA: colony predation algorithm; WOA: whale optimization algorithm; ABC: artificial bee colony algorithm; DA: dragonfly algorithm; MVO: multiverse optimization; ALO: ant lion optimizer.
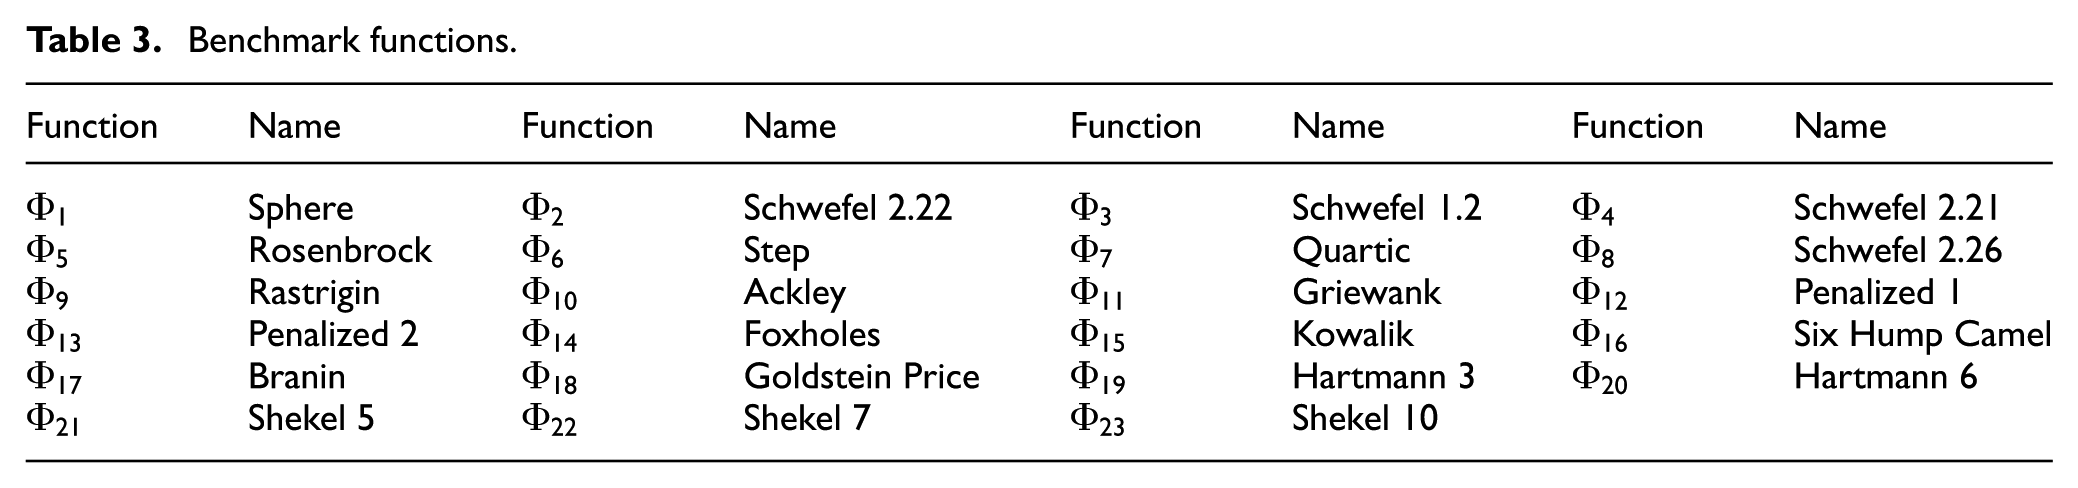
The 23 benchmark functions,50–54 including unimodal type (
Benchmark functions.
The average running time (ART) and the average iteration number (AIN) of the eight meta-heuristic algorithms are given in Table B1. The evaluation indicators and the optimal convergence curves are given in Tables B2 to B4 and Figure A1, respectively. Table 4 gives the optimization results of the eight meta-heuristic algorithms, indicating that SSA exhibits advantages among the selected eight meta-heuristic algorithms.
Optimization results of the eight meta-heuristic algorithms.
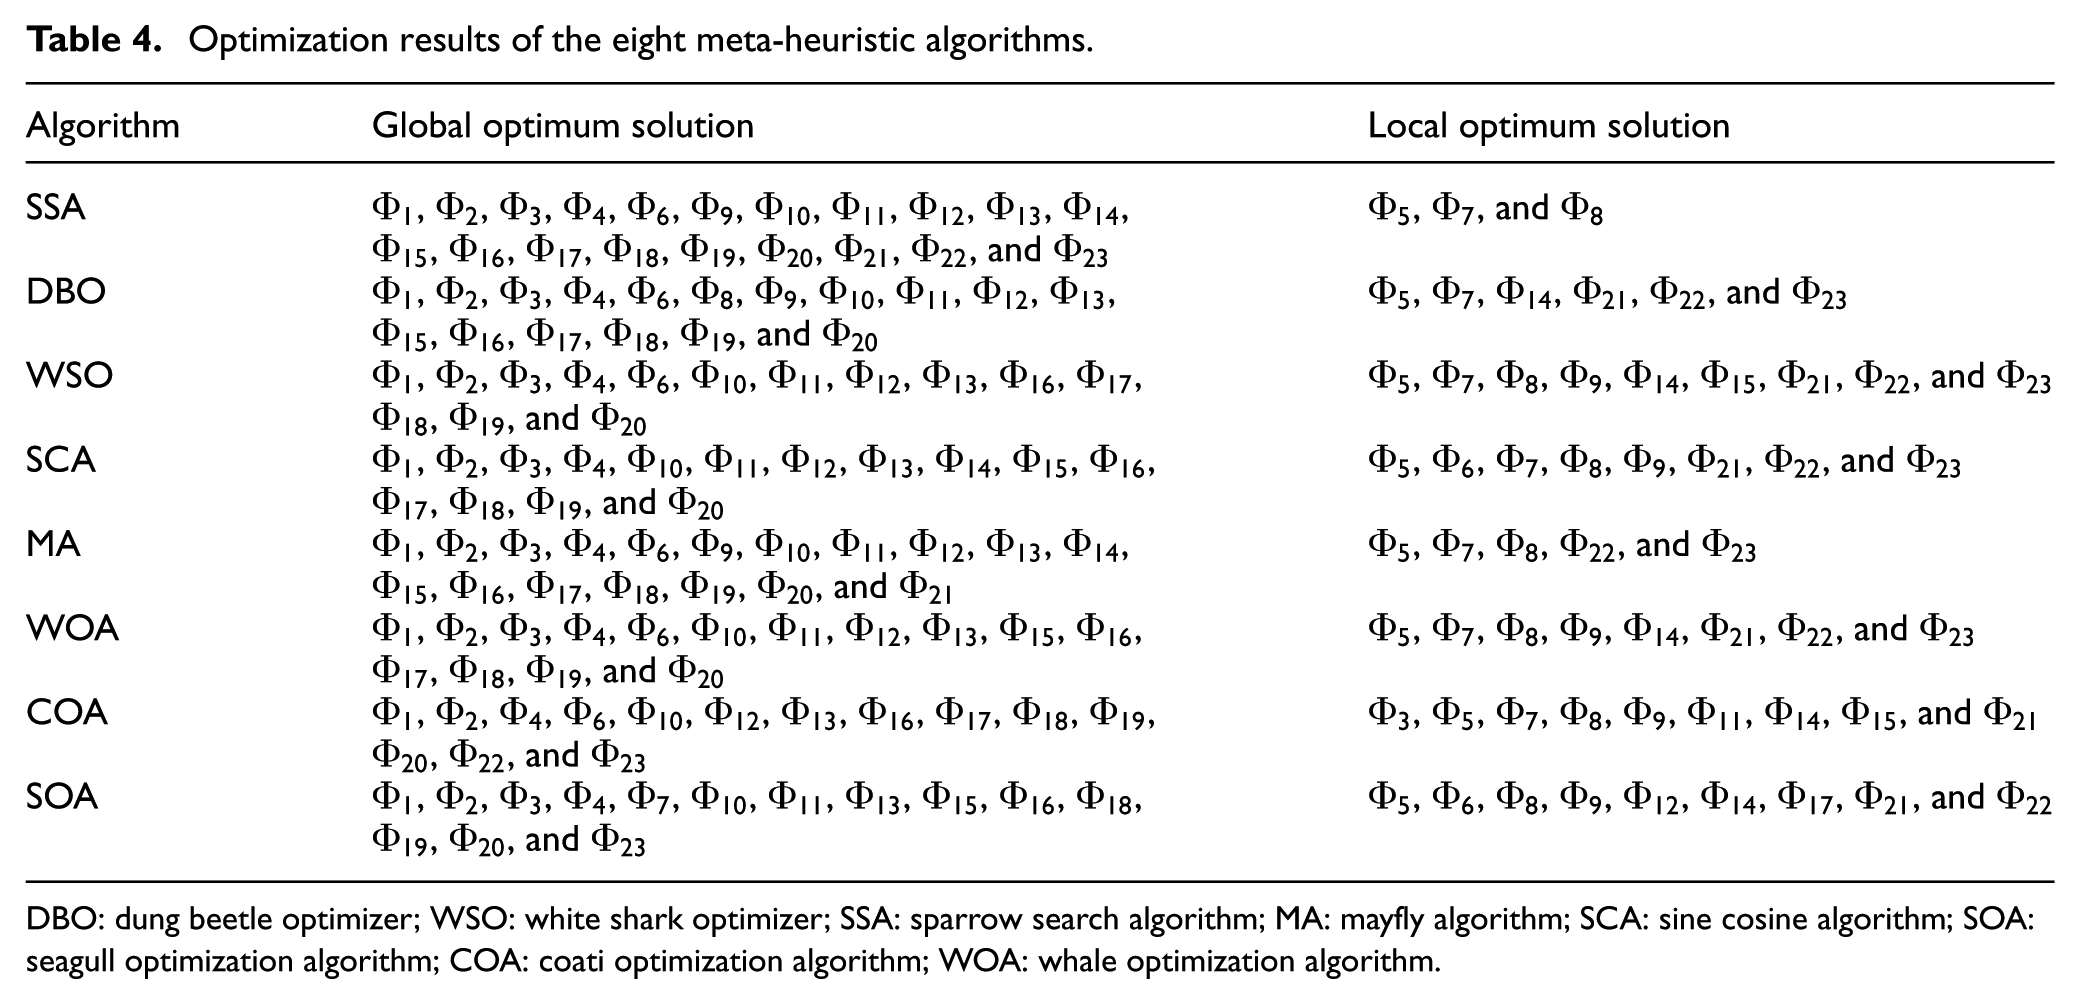
DBO: dung beetle optimizer; WSO: white shark optimizer; SSA: sparrow search algorithm; MA: mayfly algorithm; SCA: sine cosine algorithm; SOA: seagull optimization algorithm; COA: coati optimization algorithm; WOA: whale optimization algorithm.
Improvement strategy of SSA. Although the performance of SSA is satisfactory, it still needs to be improved to prevent premature convergence.
Adaptive adjustment approach 55 is introduced to realize adaptive transformation from global fast search to local precise search, expressed as
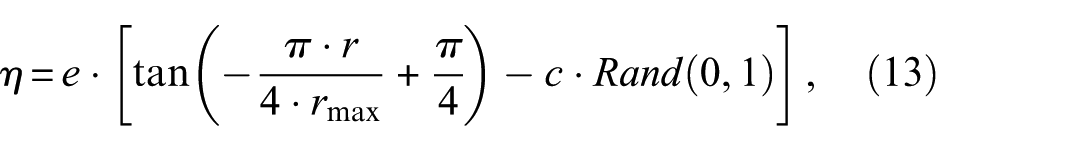


where
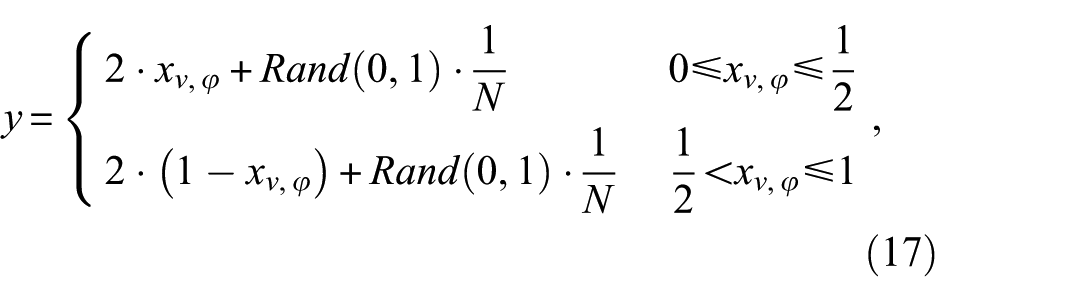
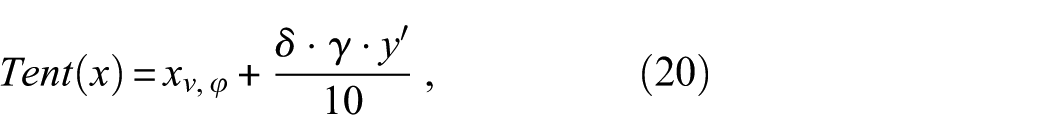
To enhance the ability of escaping from local optimal solution, Gaussian mutation disturbance 56 and Tent chaotic disturbance 57 are introduced. Gaussian mutation disturbance is

where
where


where
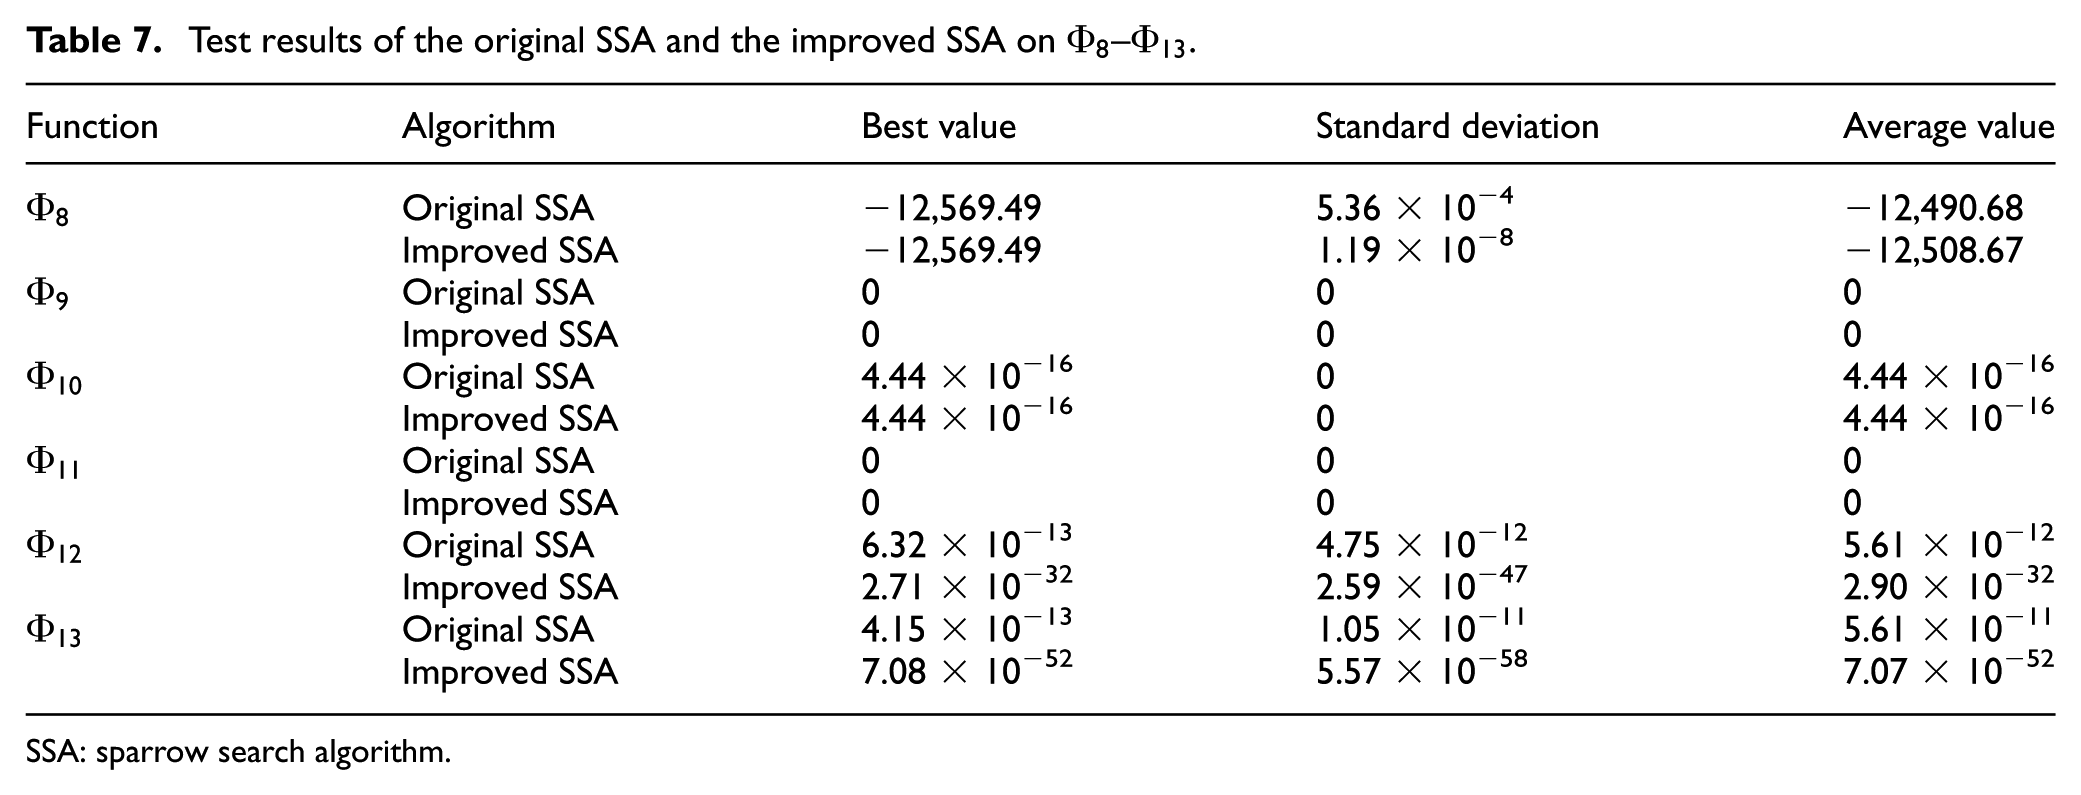
The flowchart of the improved SSA is given in Figure 2. The original SSA and the improved SSA are compared using benchmark functions. The two algorithms are set to execute 30 times independently, and the
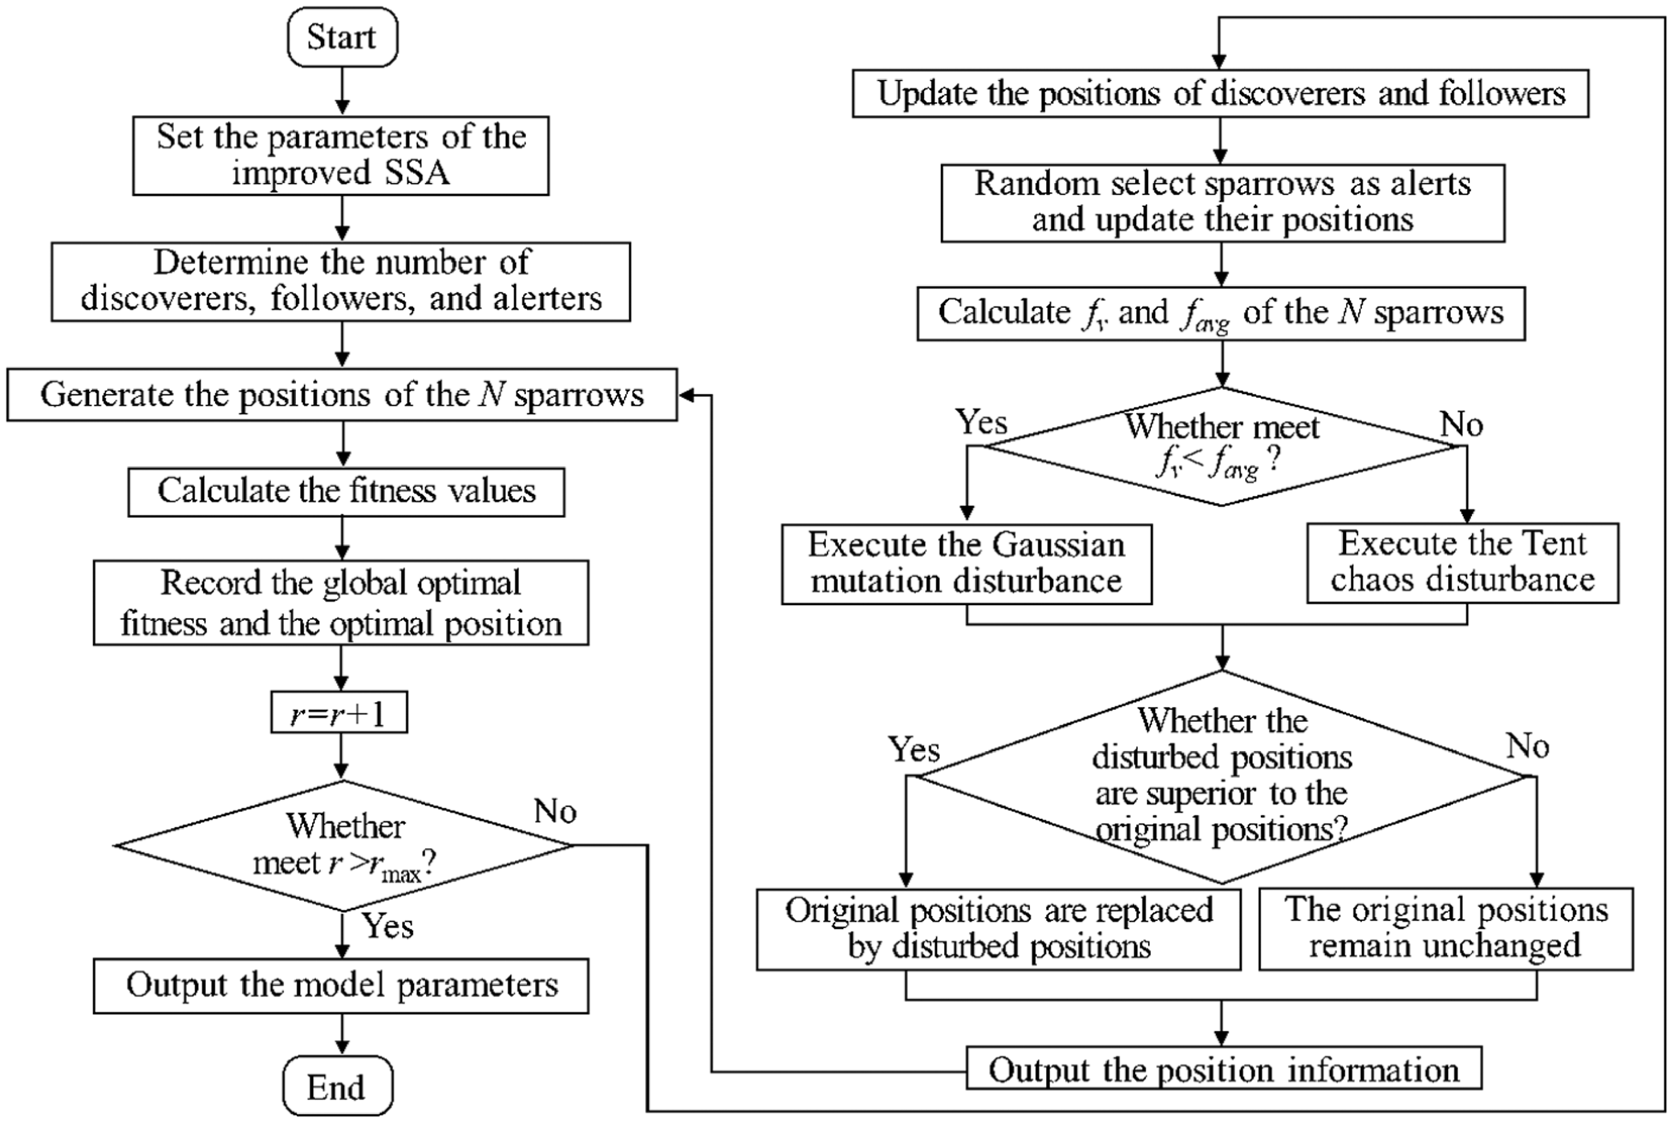
Flowchart of the improved SSA. SSA: sparrow search algorithm.
ART and AIN of the improved SSA and the original SSA.
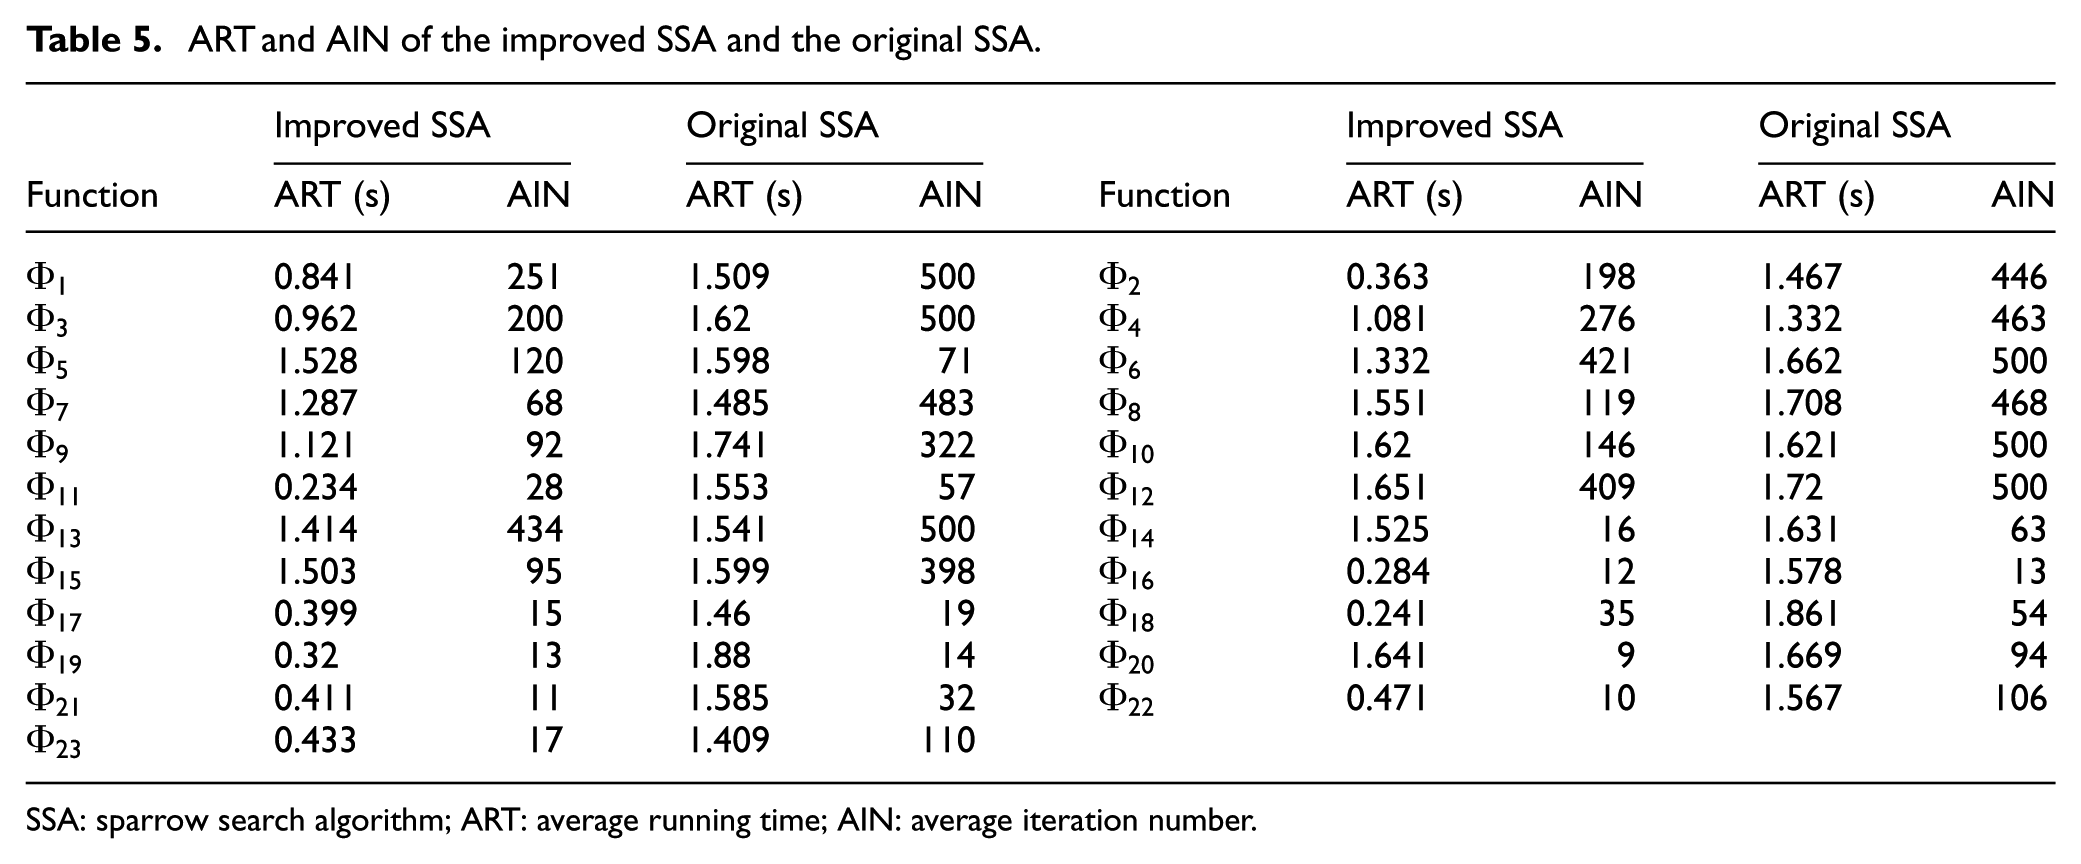
SSA: sparrow search algorithm; ART: average running time; AIN: average iteration number.
Test results of the original SSA and the improved SSA on
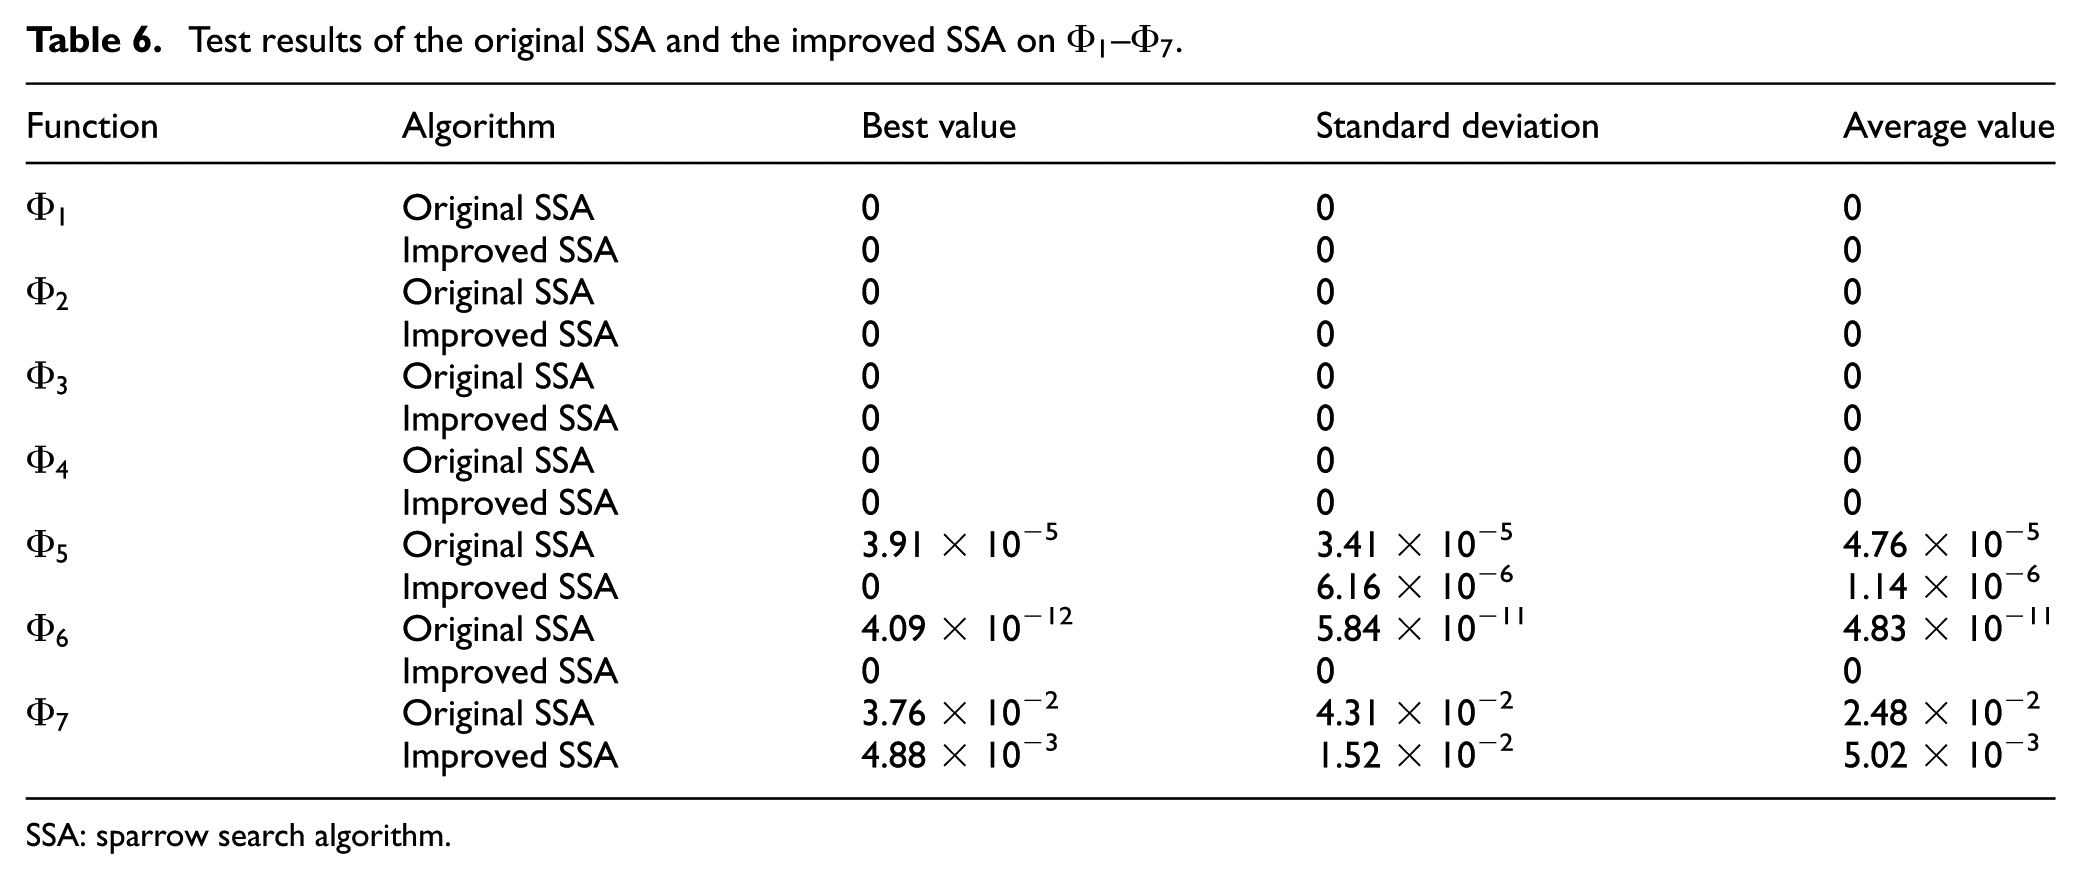
SSA: sparrow search algorithm.
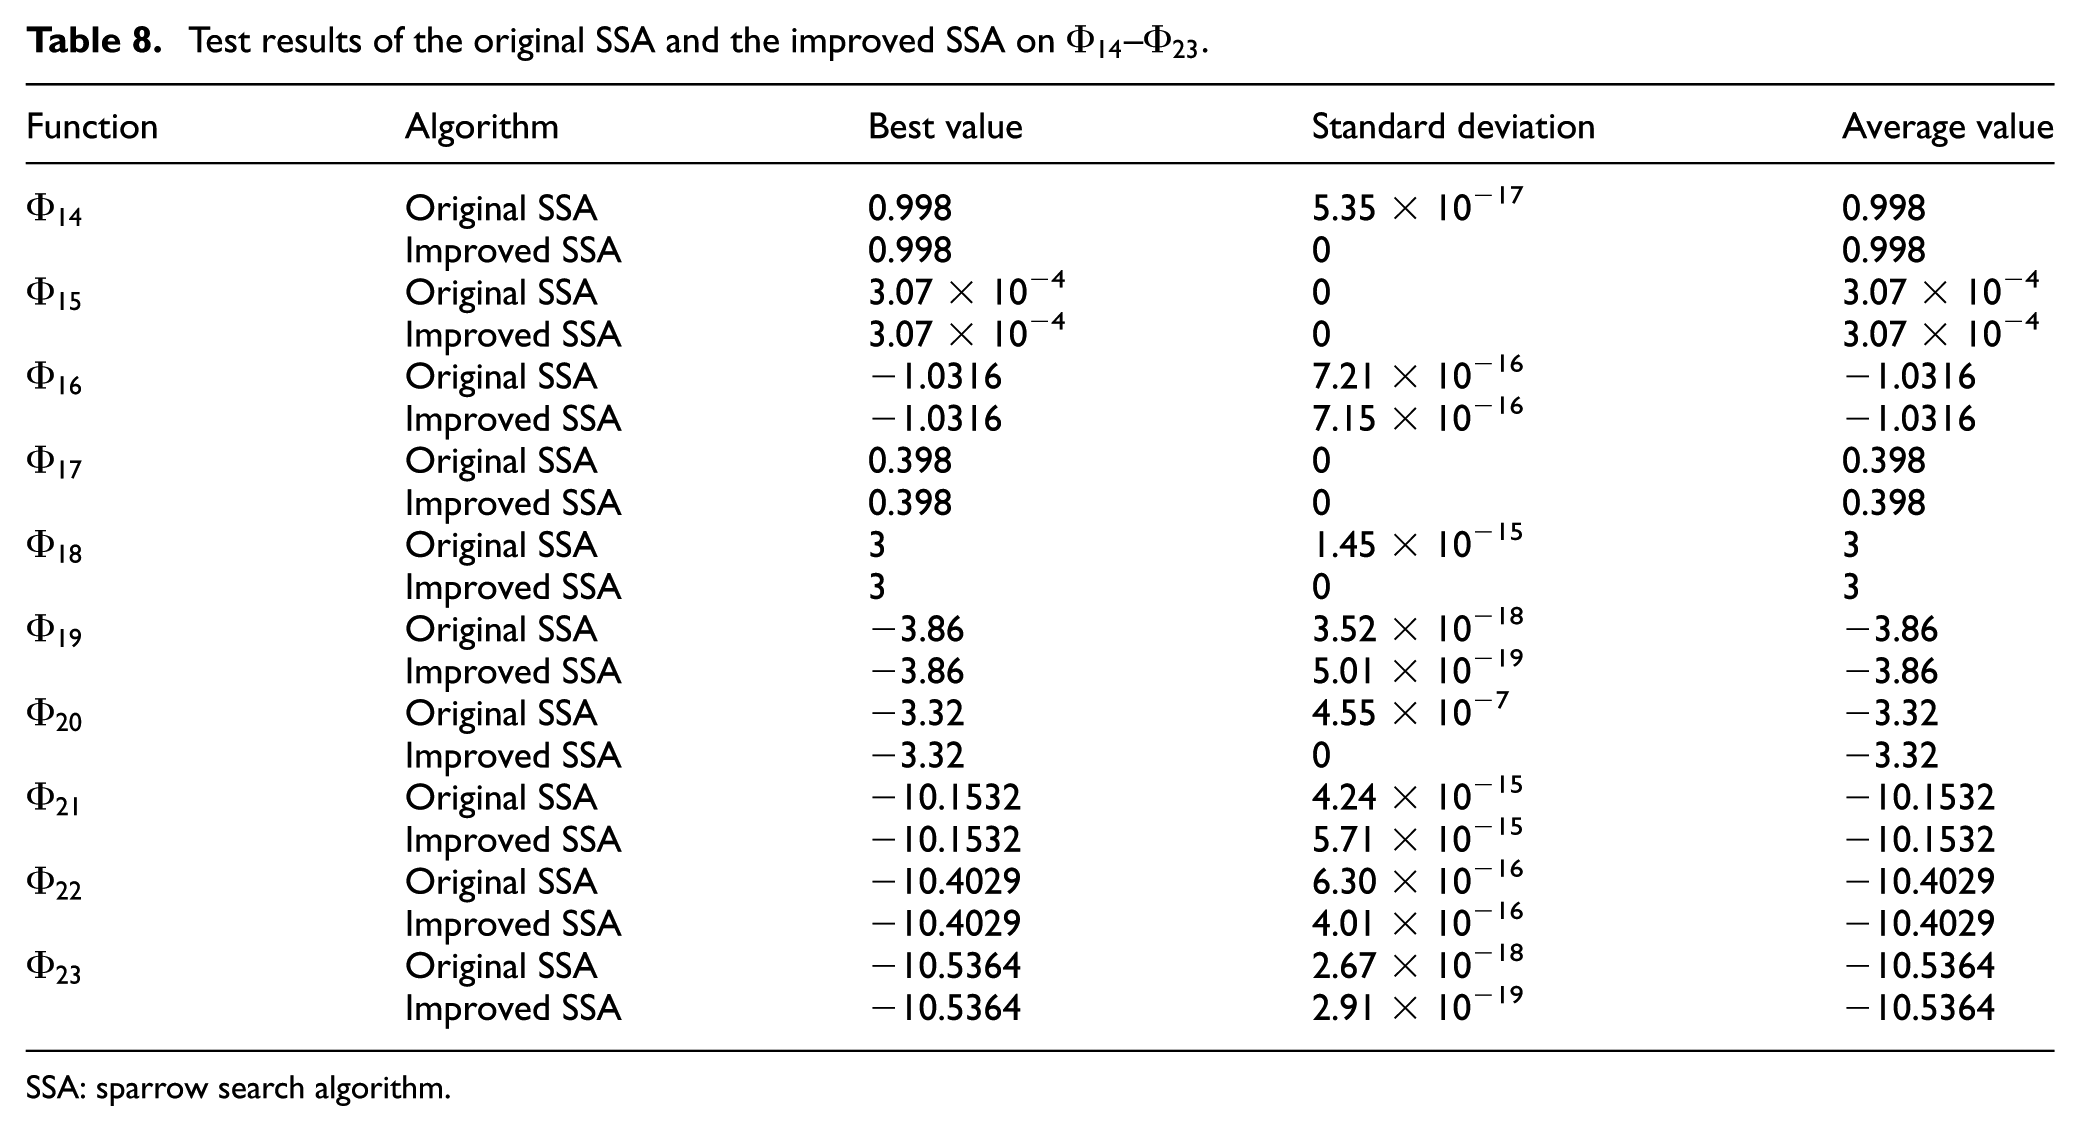
Test results of the original SSA and the improved SSA on
SSA: sparrow search algorithm.
Test results of the original SSA and the improved SSA on
SSA: sparrow search algorithm.
Optimization results of the improved SSA and the original SSA.
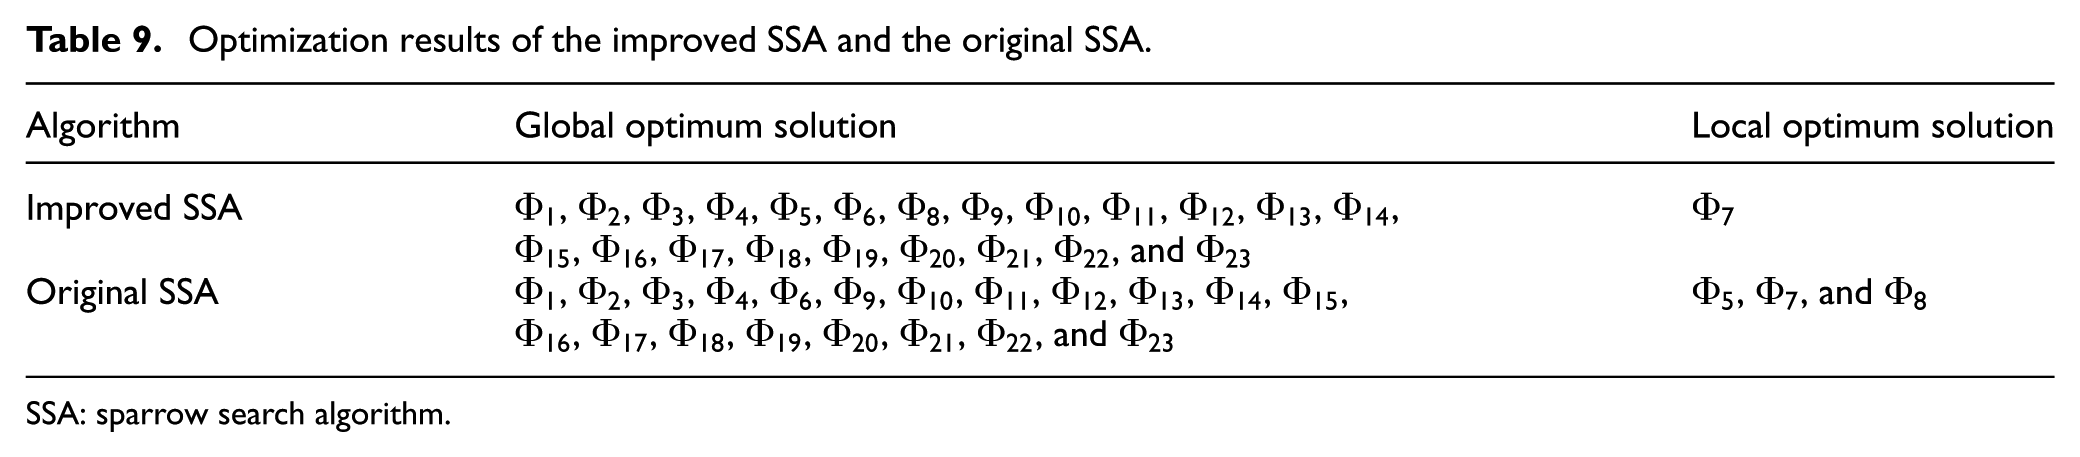
SSA: sparrow search algorithm.
For optimizing the parameters of the DPC analysis model by the improved SSA, the following parameters need to be initialized, that is,
Safety monitoring criteria
Current specifications define the safety status of an in-service dam as normal status, basic normal status, and abnormal status. For the conventional three-level monitoring criteria, the monitoring criterion of abnormal status is vague, which cannot effectively identify the critical state of structure degradation.
Ultra-high arch dams are in elastic deformation state during their normal operation period. Deformation dangerous degree can be described by the deviation degree between observation value and elastic state. Confidence interval criteria
63
are used to characterize the deviation degree in this work. Small probability deformation is another important indicator to evaluate the safety status of dam deformation. For

where

where
By comprehensively considering the deviation degree between DPC and elastic state and the combined control limit of DPCs, the four-level monitoring criteria are established as follows.
(1) If
(2) If
(3) If
(4) If
Figure 3 gives the flowchart of the suggested method.
Flowchart of the proposed methodology.
Case study
Case study A
The arch dam A contributes significantly to the flood control, ecological environment enhancement, and soil and water conservation of Yalong River basin. The main water retaining structure is a parabolic hyperbolic arch dam. The maximum height is 305 m, the crest length is 552.2 m, the maximum span is 480 m, the crest thickness is 16 m, the maximum base is 63 m, and the thickness-height ratio is 0.207. The dam is constructed in an unsymmetrical V-shape valley. The geological condition is complicated. Disadvantage geological structure surfaces, for example, weak rock mass and fault, widely exist in the dam site, especially for the left bank.
The 32 observation points, as presented in Figure 4, are used to observe the radial deformation and the tangential deformation of the dam body. Upstream water level is approximately in the range of 1800–1880 m, as shown in Figure 5. Air temperature, approximately in the range of −1.7–39.1°C, shows annual periodicity characteristics, as presented in Figure 5. Figures 6 and 7 give the spatiotemporal variation rules of radial deformation. Obviously, some observation points, for example, PL9-1 and PL9-2, present a similar deformation pattern, and some others, for example, PL9-1 and PL11-3, exhibit significant deformation differences. It is necessary to fully consider deformation similarity characteristics when regarding OPG as the modeling object.
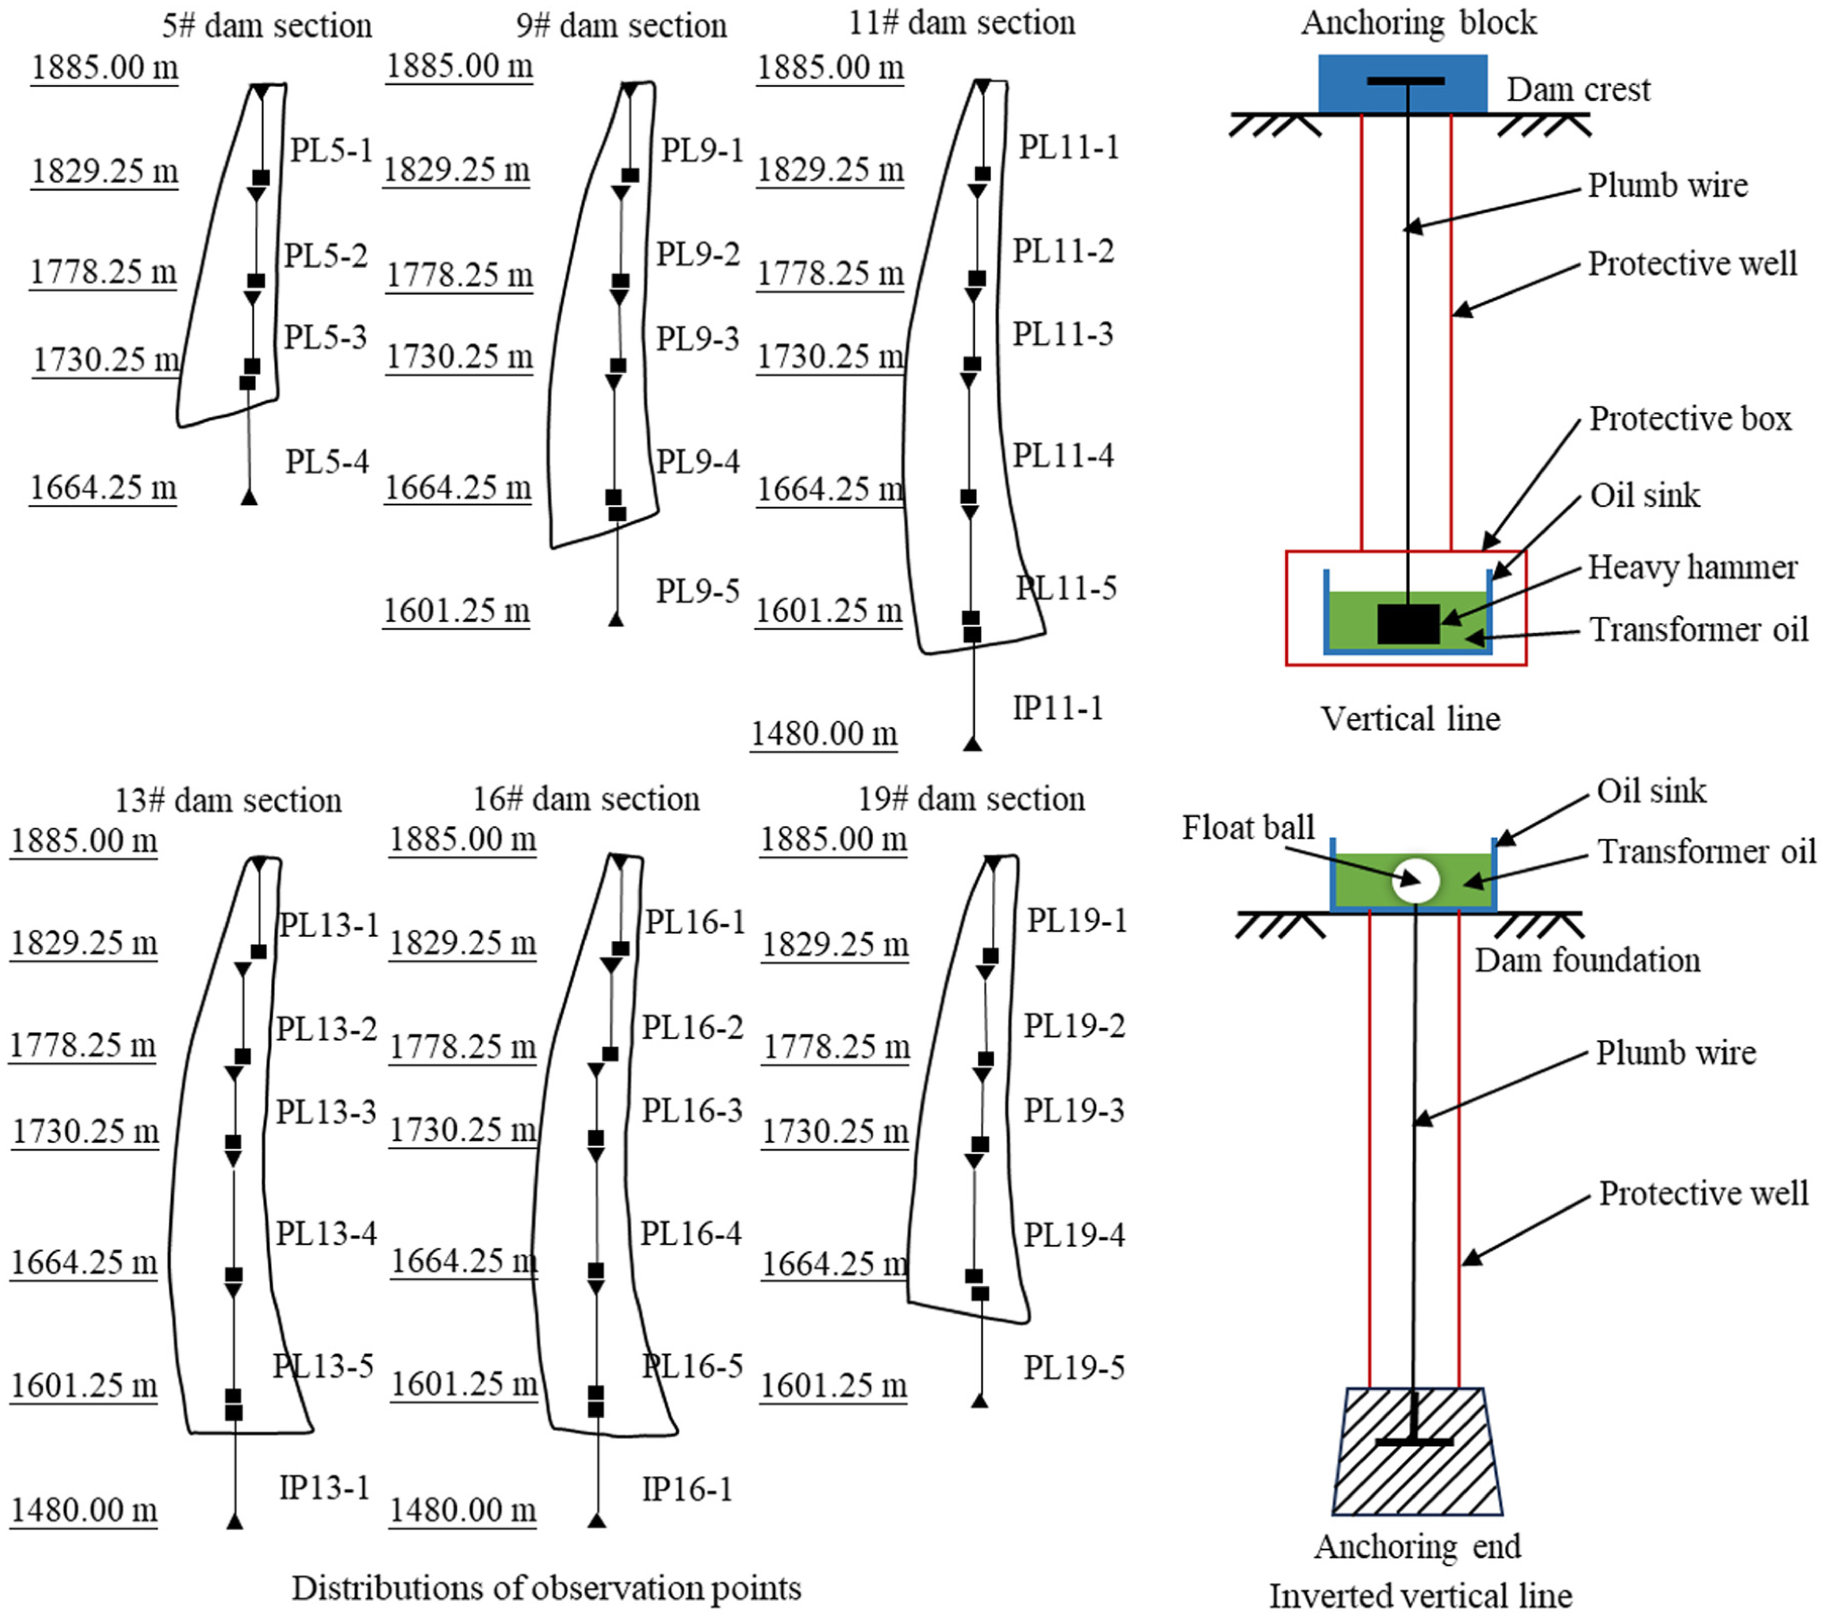
The studied dam and its deformation observation points.
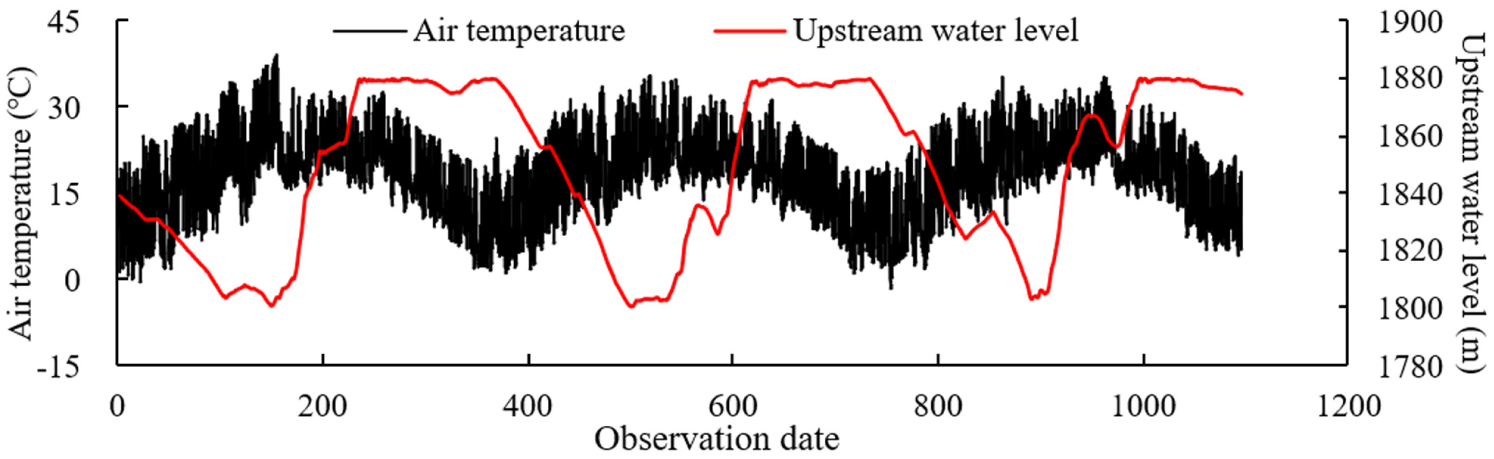
Time curves of air temperature and upstream water level.
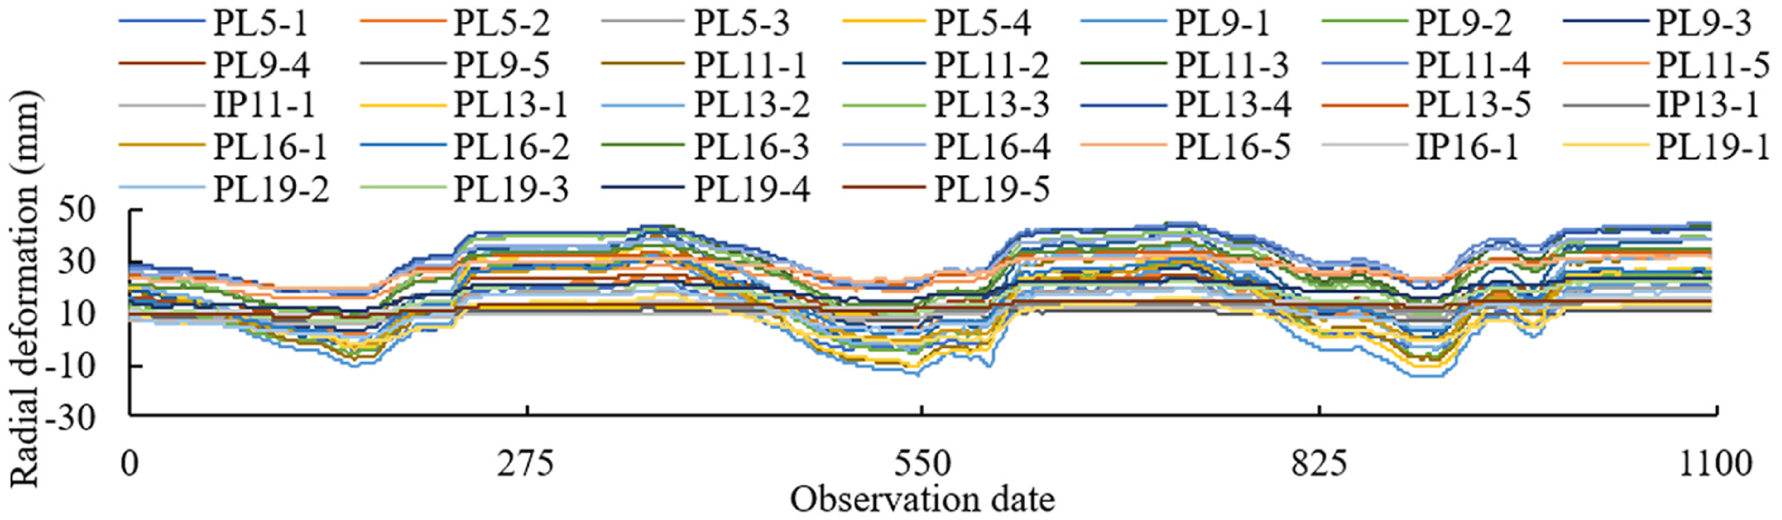
Time curves of radial deformation.
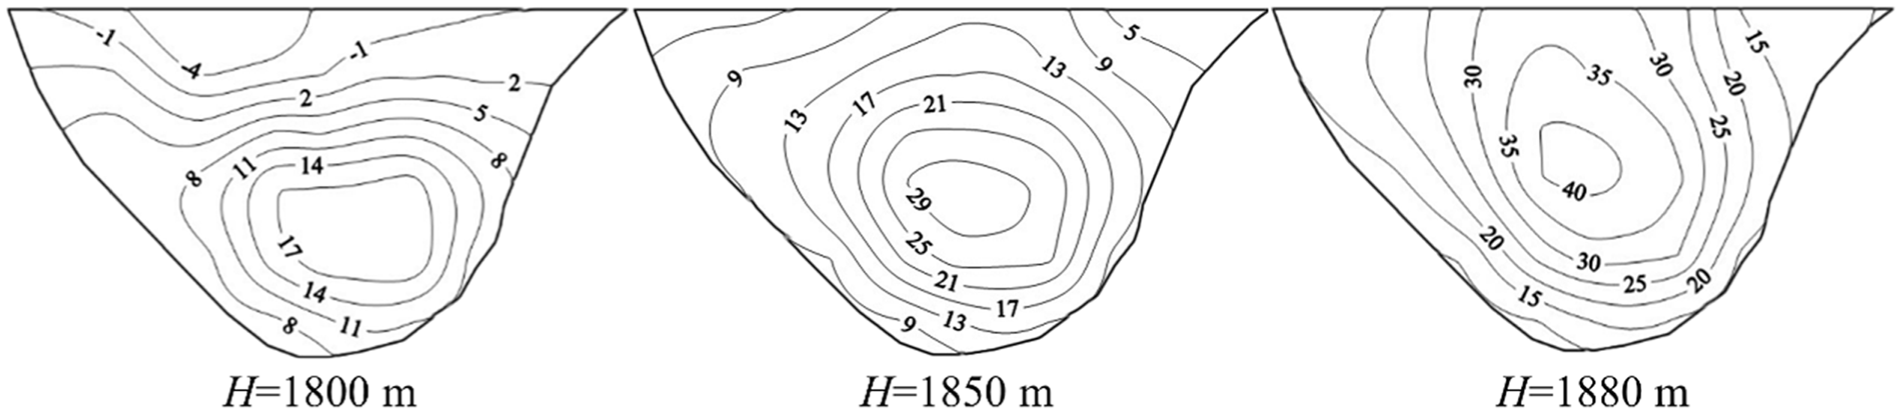
Radial deformation distributions under different upstream water levels.
Using the method given in the study by Yang,
24
OPGs with similar spatiotemporal deformation patterns are generated. Figure 8 indicates that the mutation position of the curve occurred at the 30th combination, and thus, the optimal grouping approach is the OPGs corresponding to the 29th combination. Figures 9 and 10 indicate that the 32 observation points are categorized into three groups. Groups A and B are located at the upper and middle parts, respectively. Group C is located near the dam abutment and foundation. According to Figure 11, the spatiotemporal deformation patterns of observation points are similar within each OPG, and those among different OPGs exhibit obvious deformation differences. Therefore, the suggested method for producing OPGs is effective. The observation data of the 1st–1000th date is used for DPC model construction. The
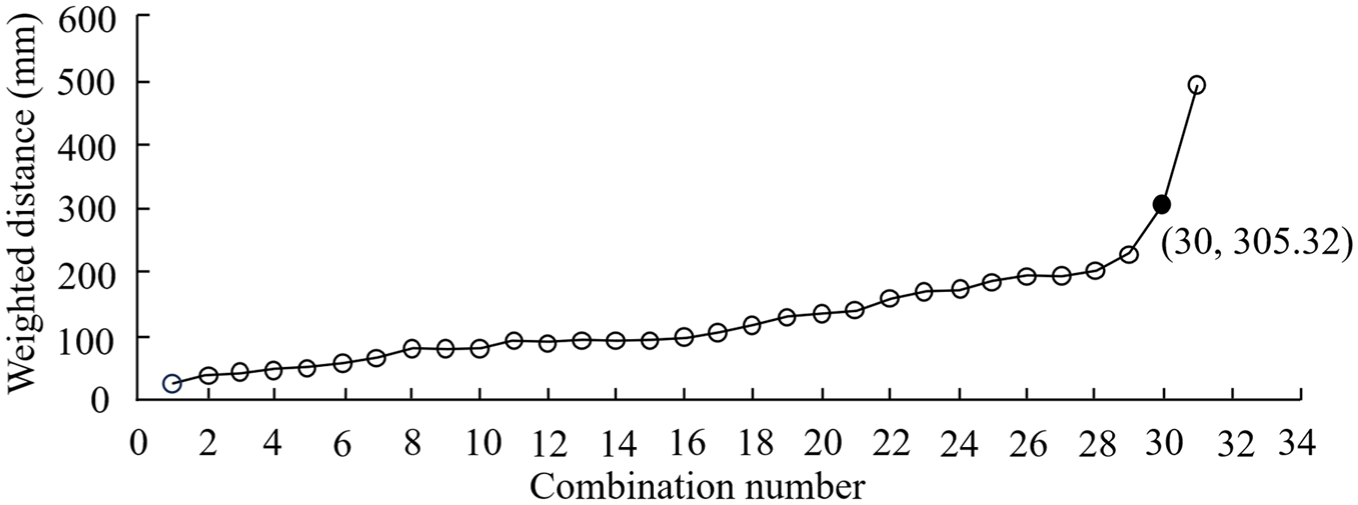
Relation curve between the weighted distance and the combination number.
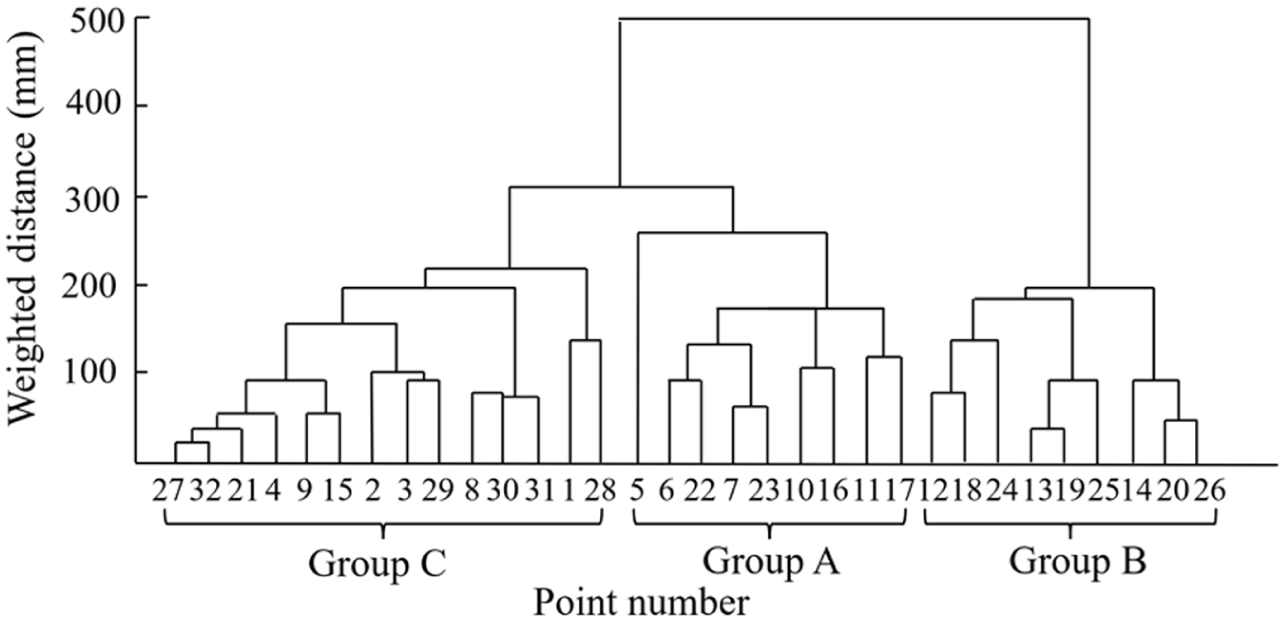
Pedigree clustering dendrogram.
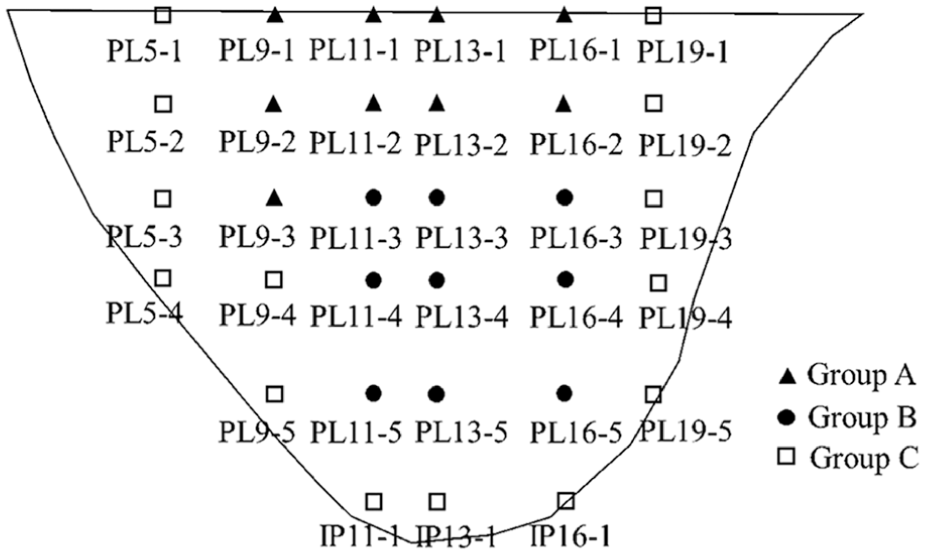
The distributions of the generated OPGs. OPG: observation point group.
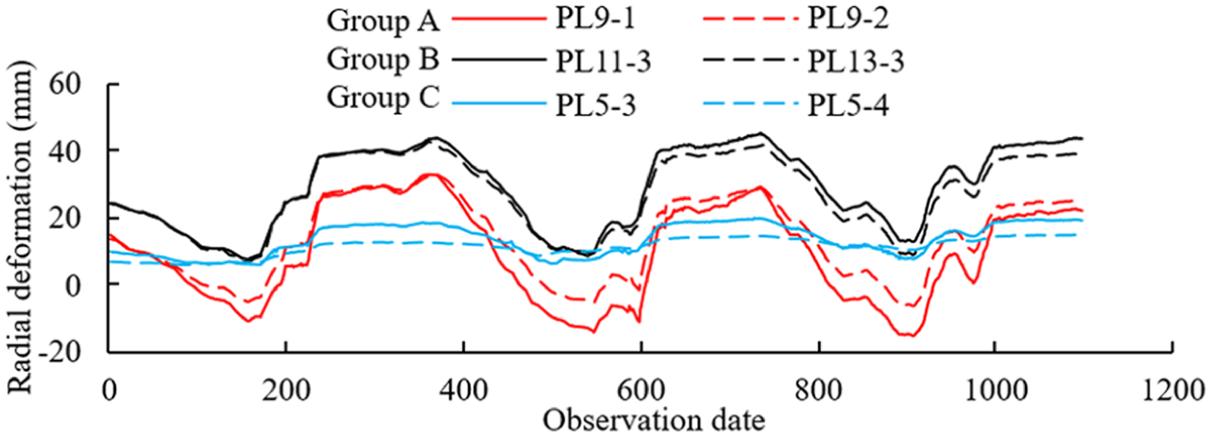
Time curves of radial deformation of PL9-1, PL9-2, PL11-3, PL13-3, PL5-3, and PL5-4.
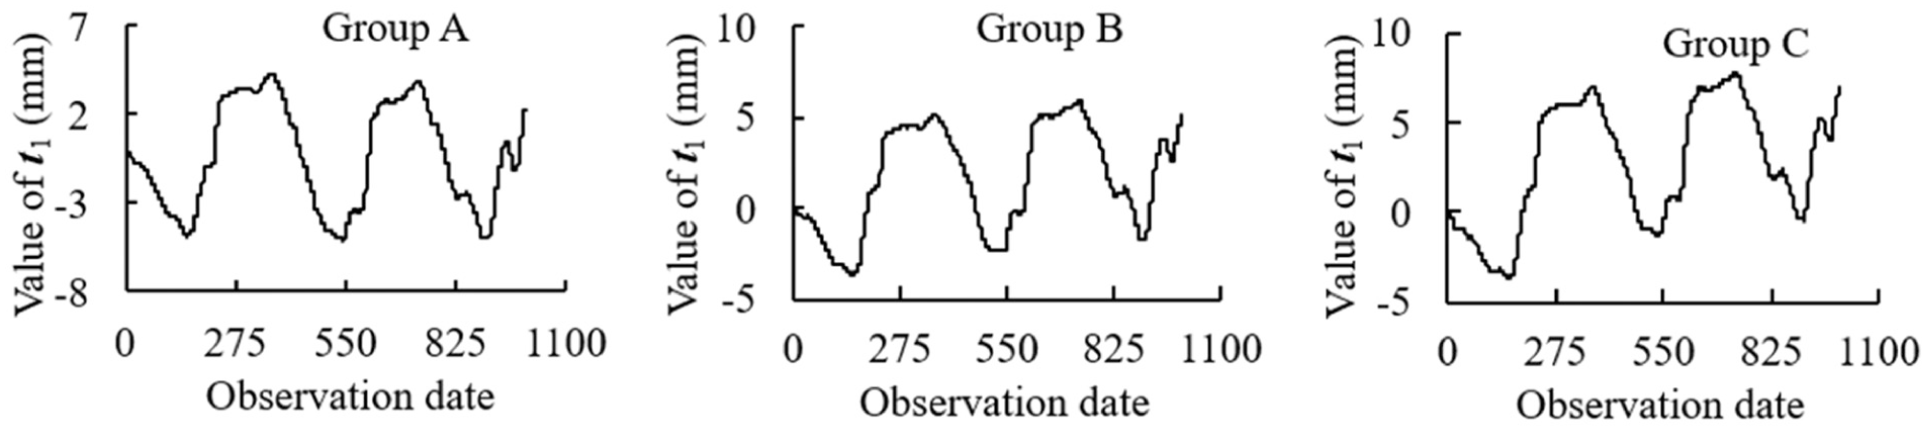
The
The
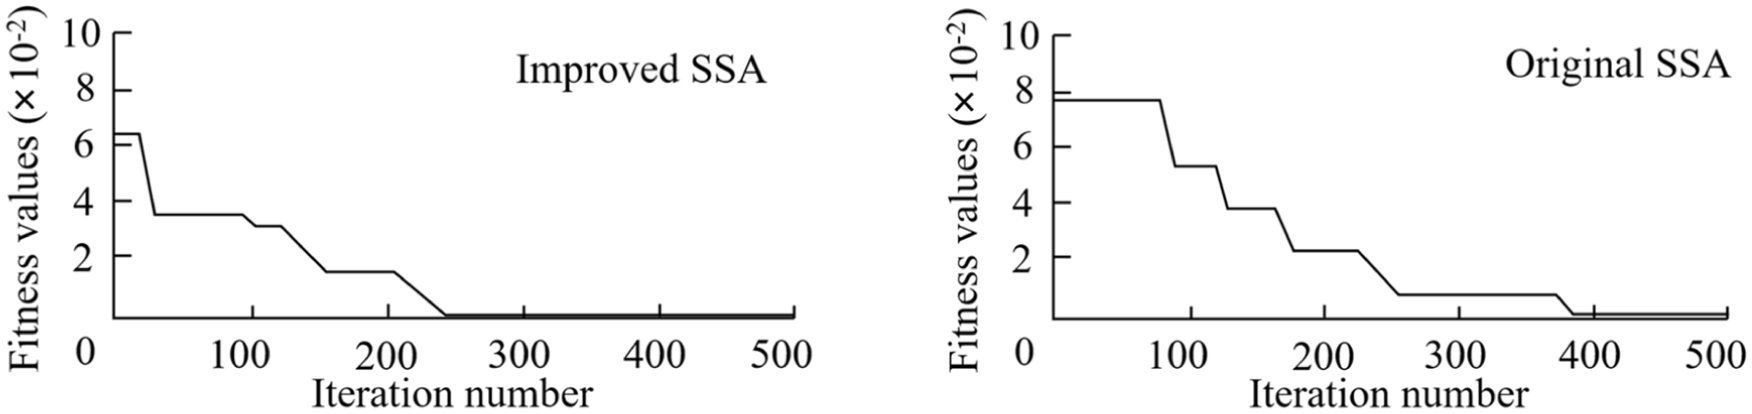
The optimal convergence curves of the
Computation time, the number of local optima, and AIN of the
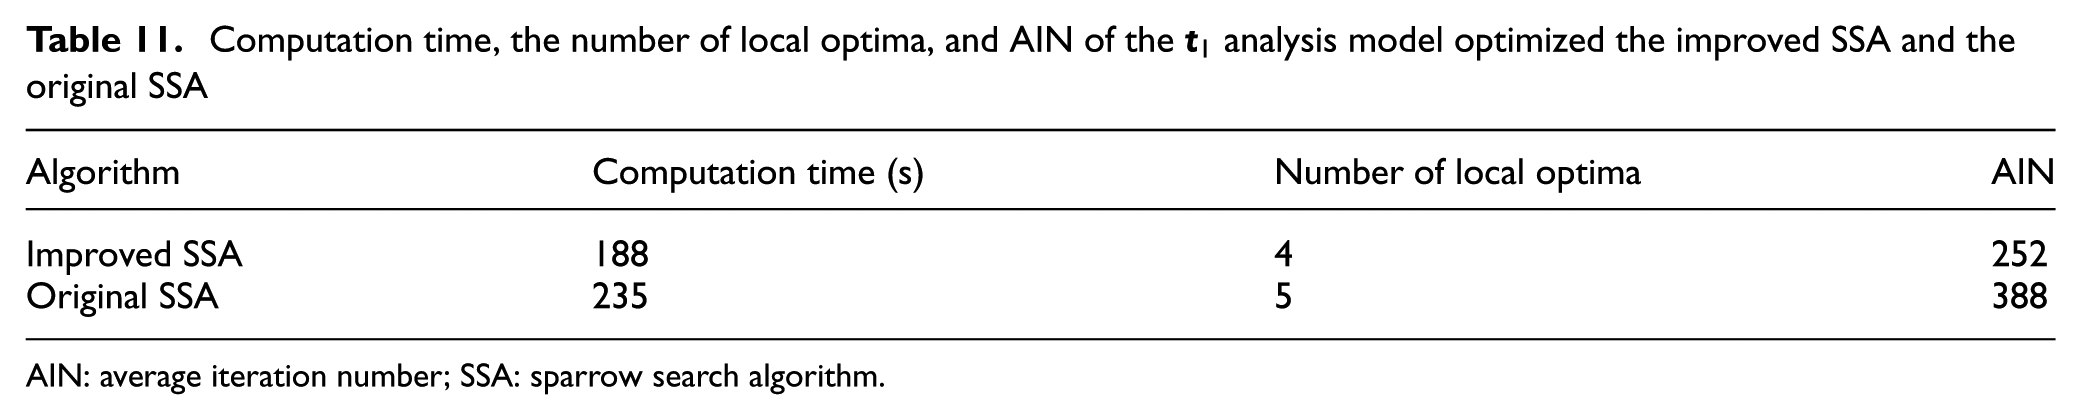
AIN: average iteration number; SSA: sparrow search algorithm.
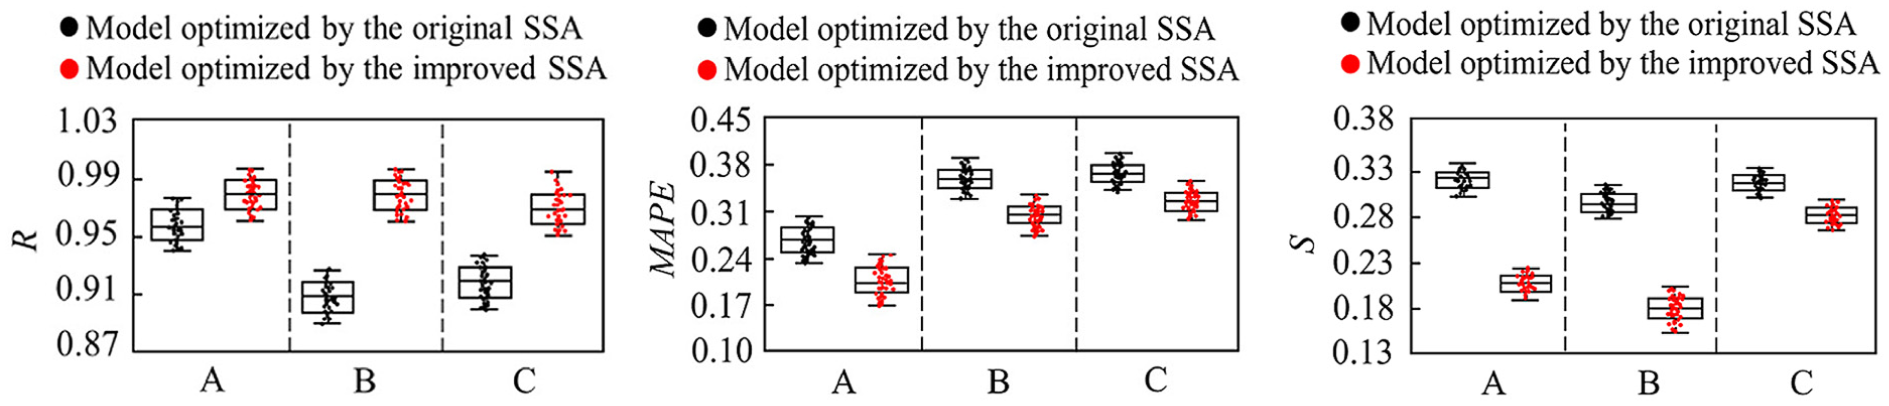
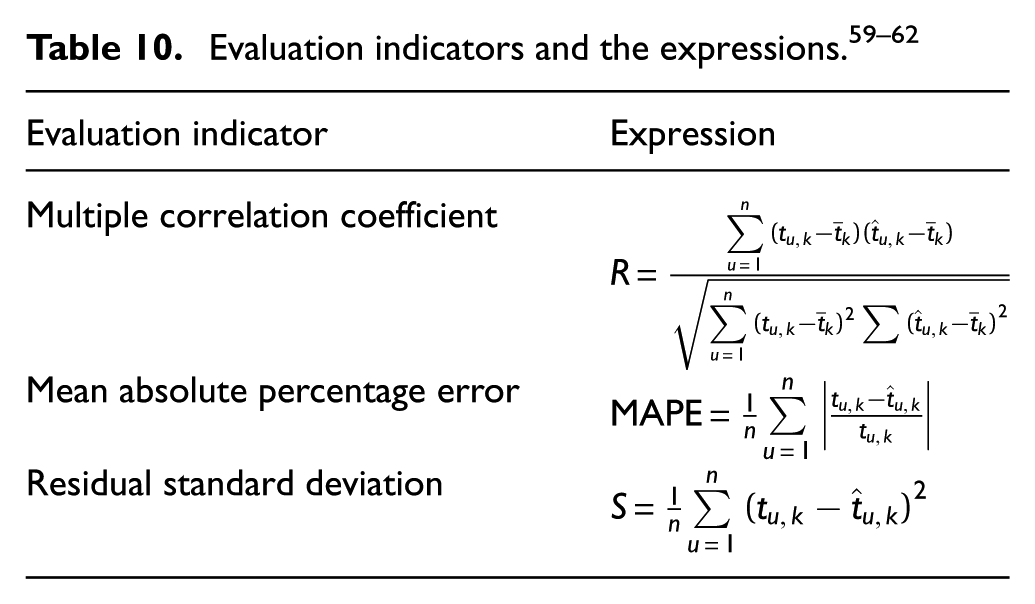
Evaluation indicators distributions.
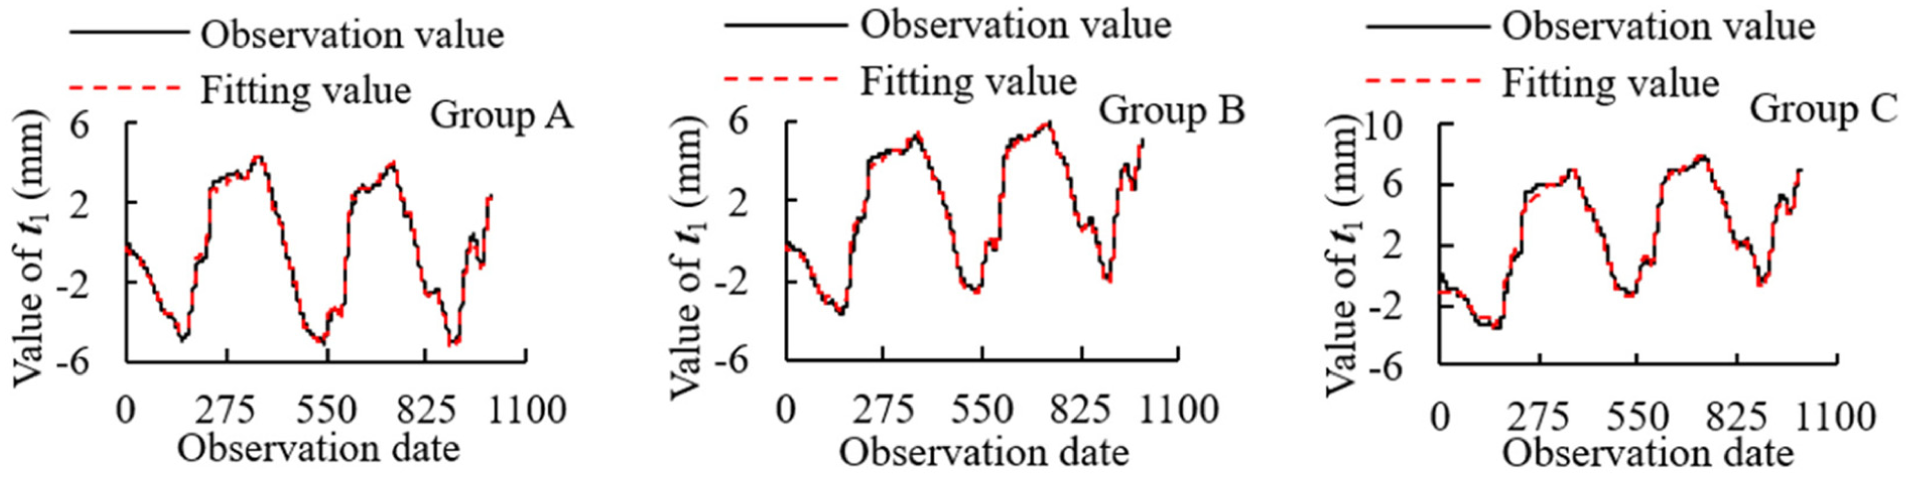
The best-fitting results of the
Fitting performance of the
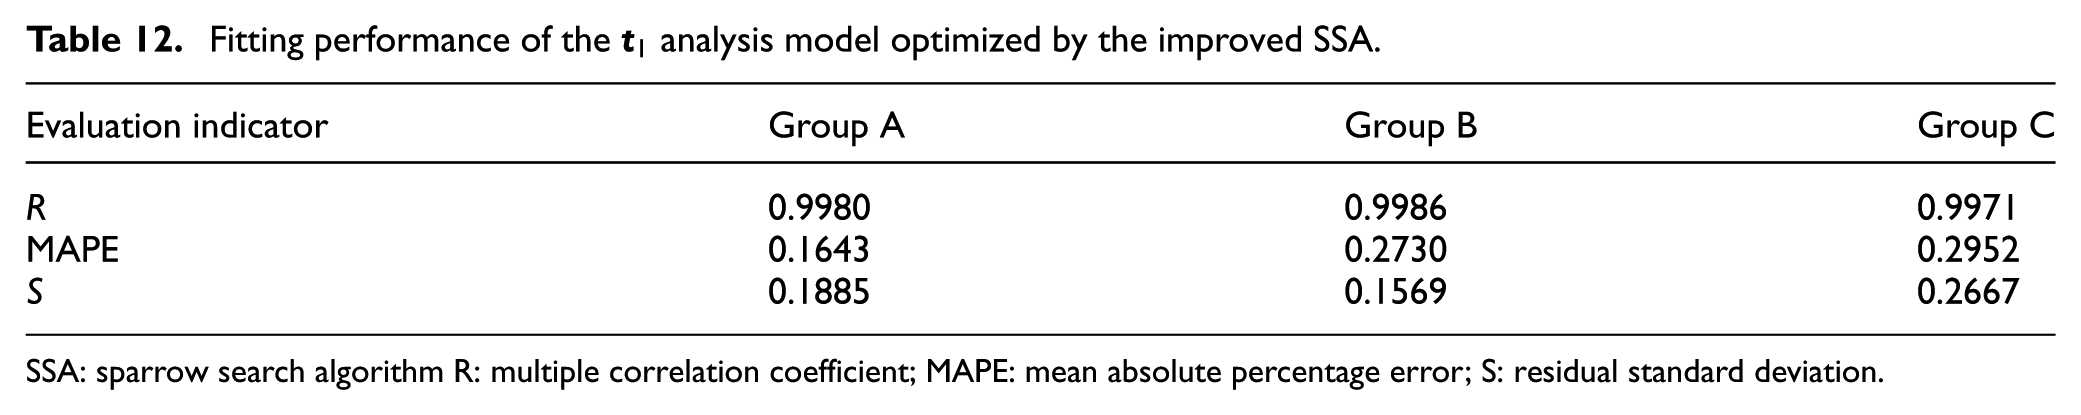
SSA: sparrow search algorithm R: multiple correlation coefficient; MAPE: mean absolute percentage error; S: residual standard deviation.
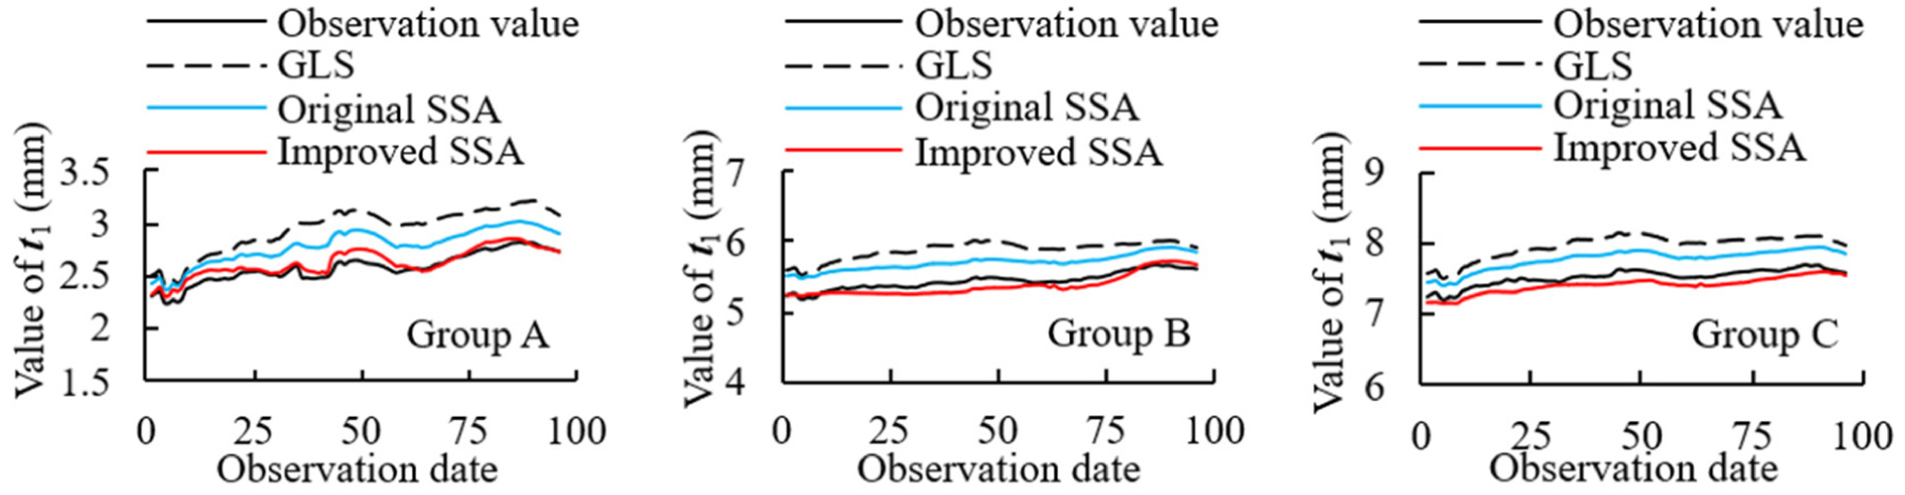
Prediction results of the
Prediction performance comparison.
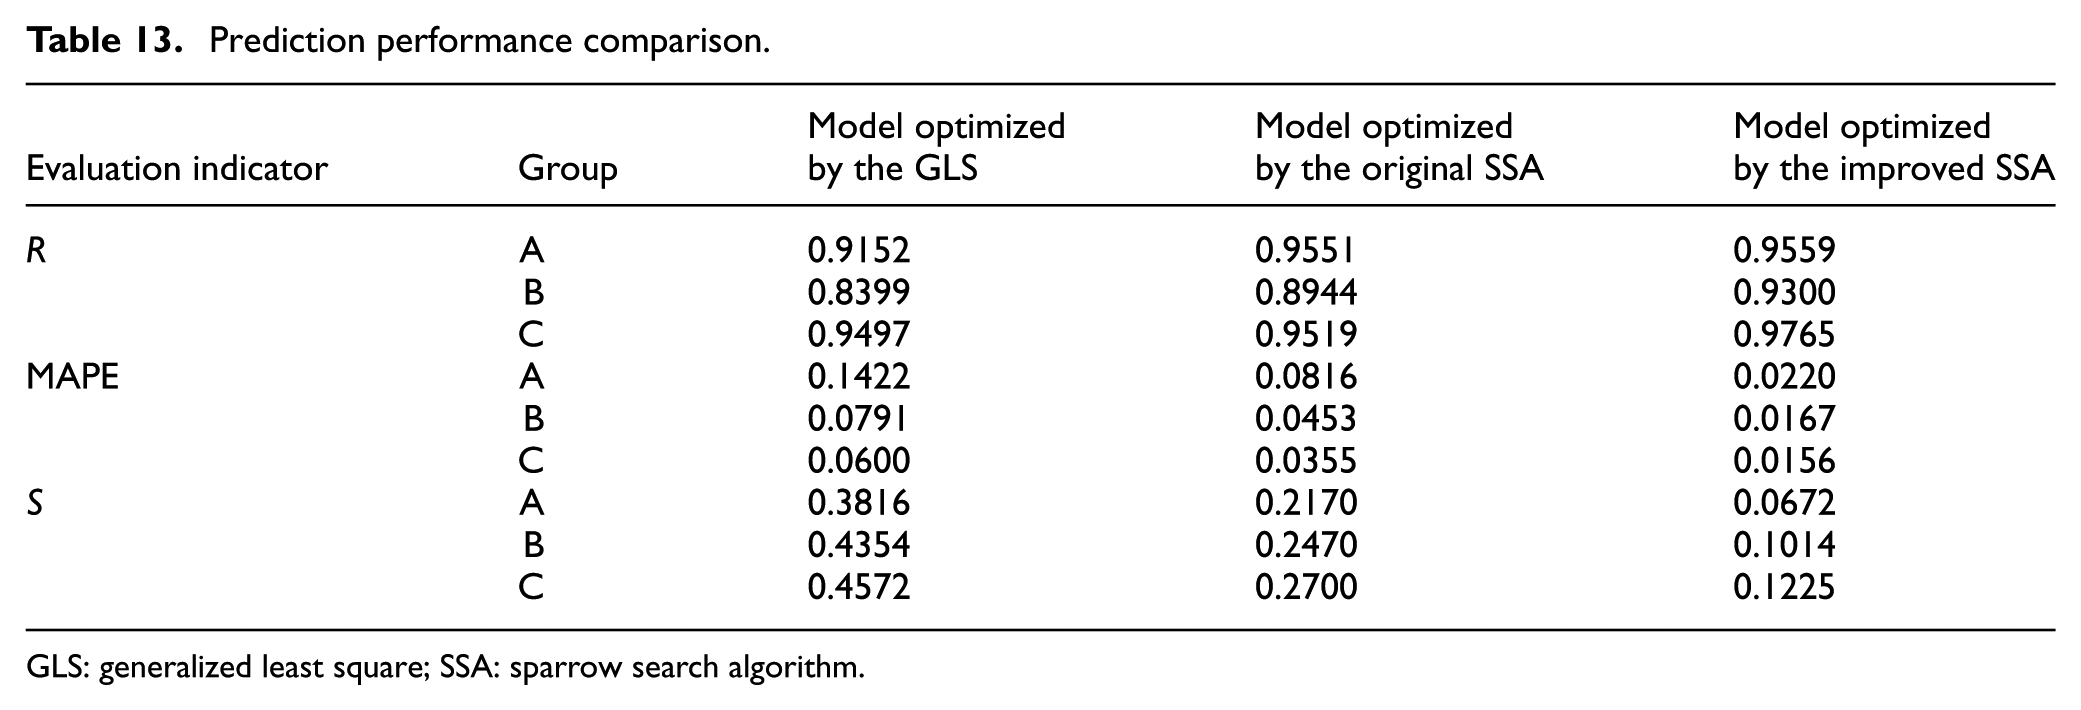
GLS: generalized least square; SSA: sparrow search algorithm.
In this case study,
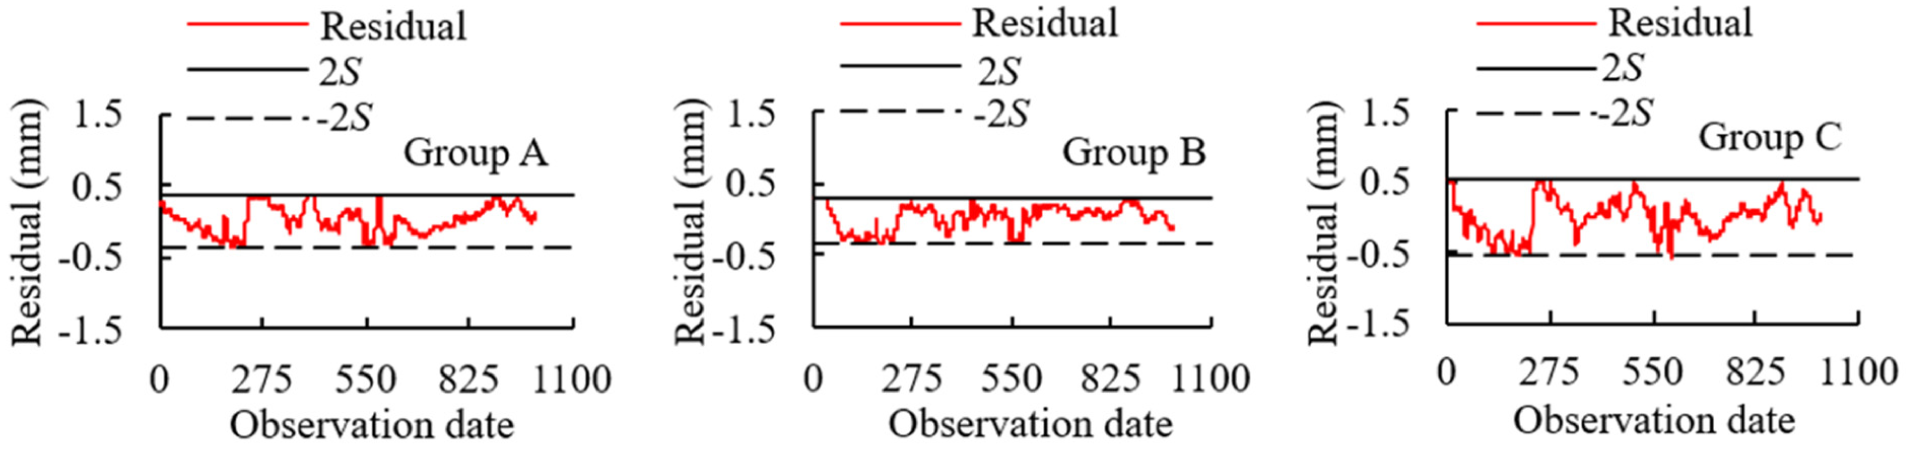
Residuals and the control limits.
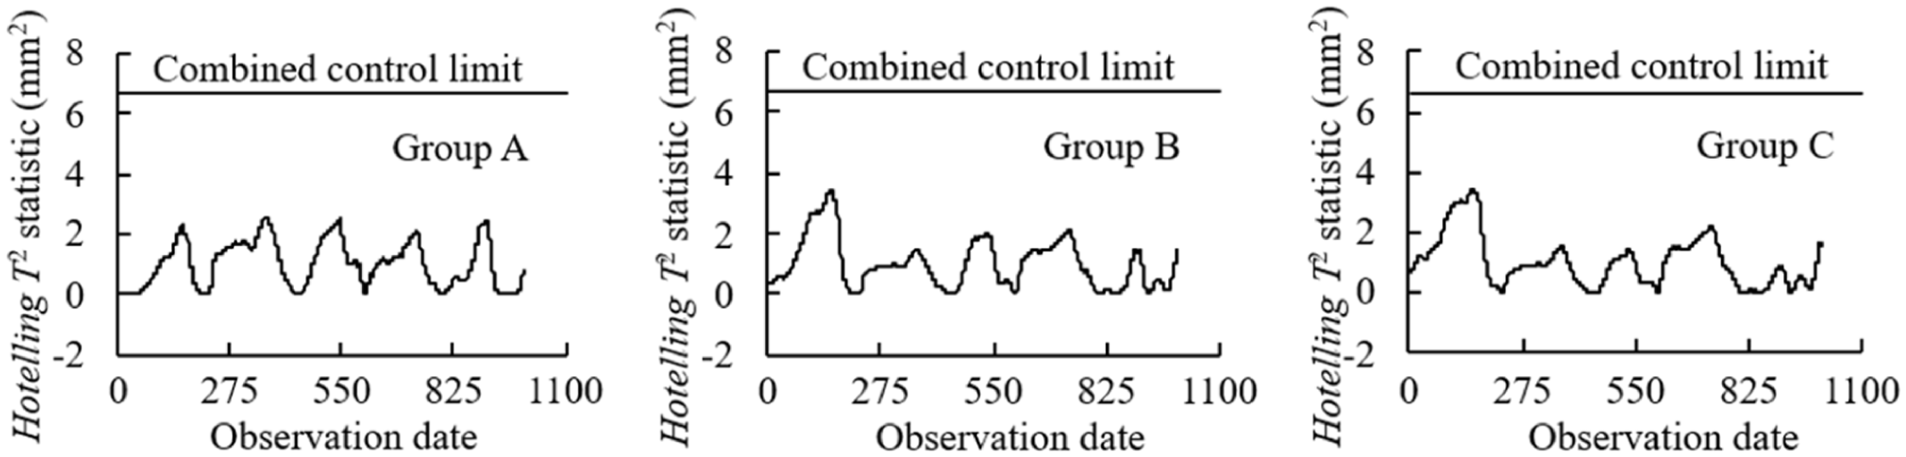
Hotelling T 2 statistics and the combined control limits.
Case study B
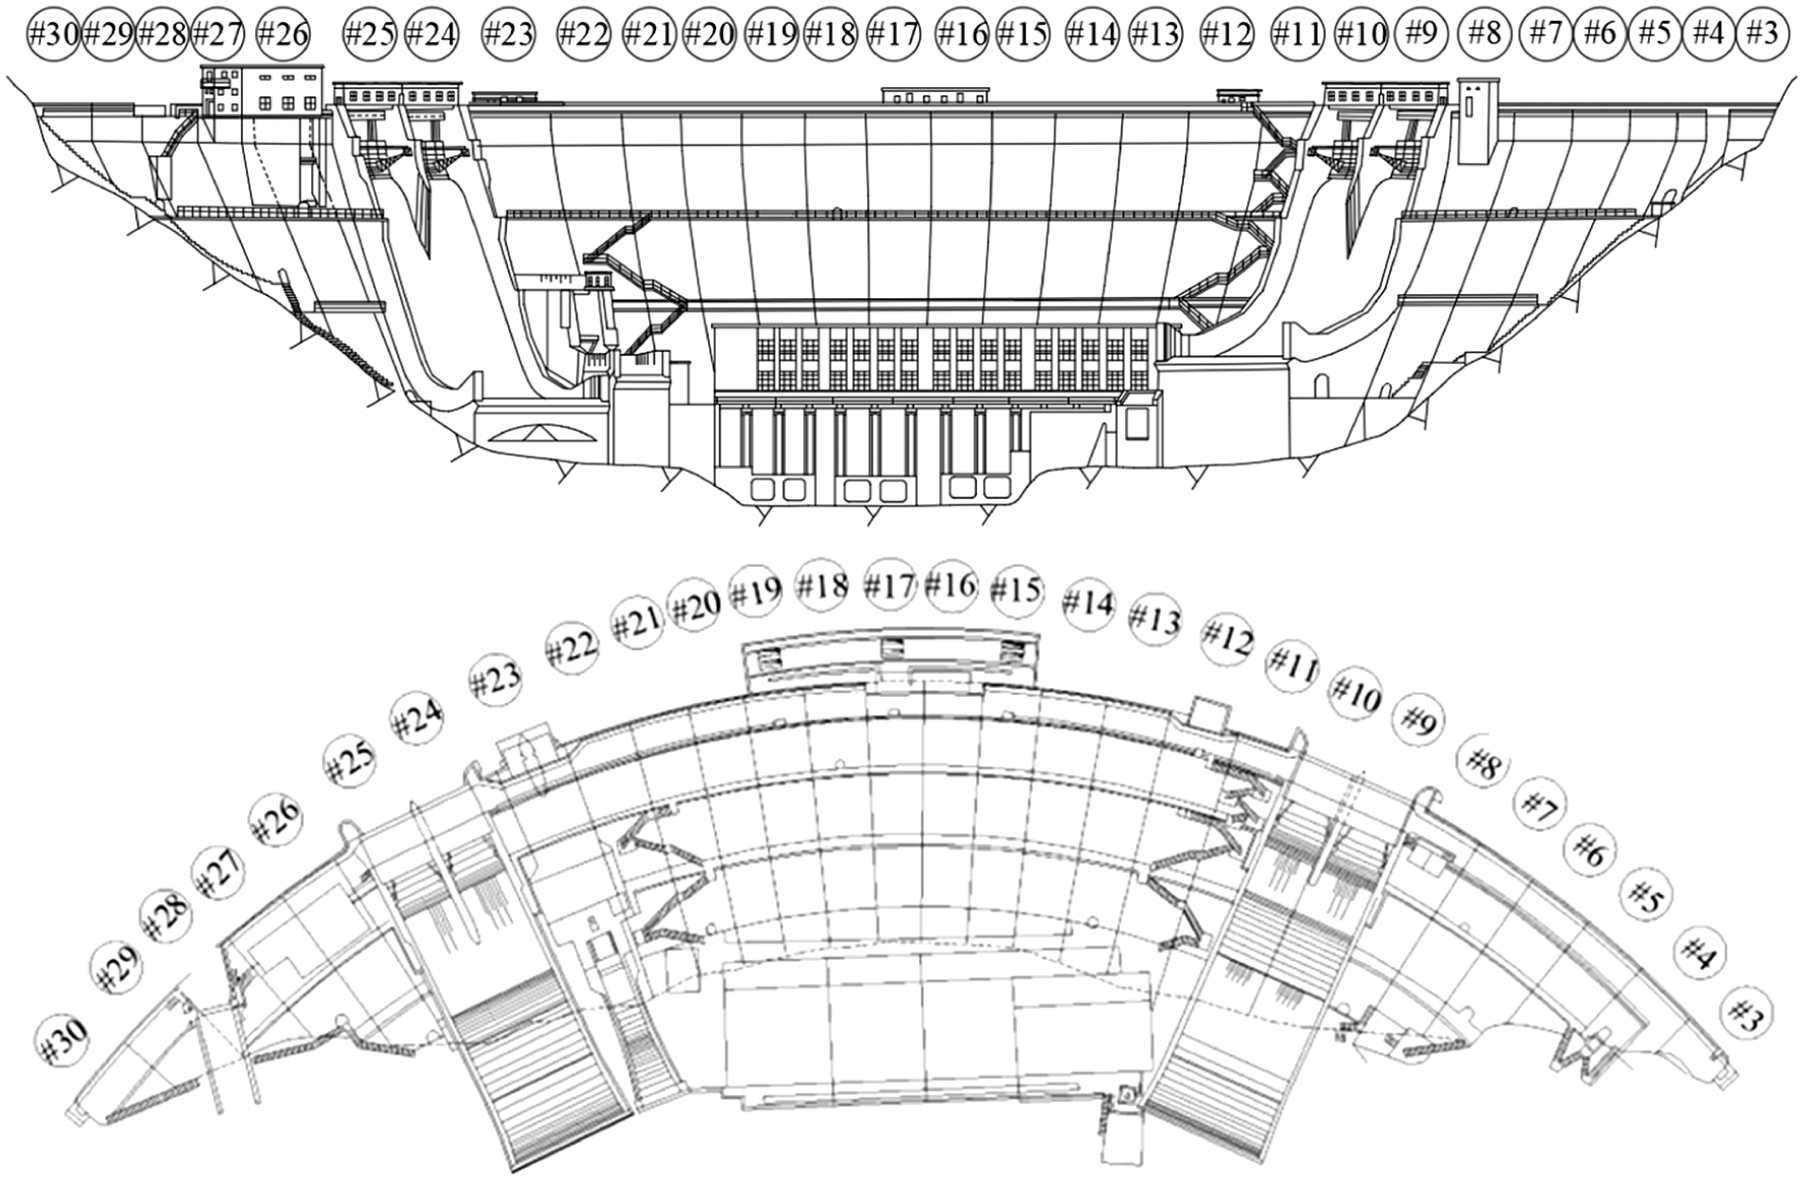
The arch dam B, as presented in Figure 19, is a gravity arch dam. The project overview is given in Reference 67. Figure 20 shows the section shape and the observation point locations. Figure 21 gives the time curves of radial deformation of OP8_a, OP8_b, OP18_a, OP18_b, OP26_a, and OP26_b from March 6, 2001, to July 25, 2013. As shown in Figure 22, upstream water level is approximately in the range of 101.64–120.18 m. Air temperature, approximately in the range of −4.20–33.35°C, shows annual periodicity characteristics.
The arch dam B.
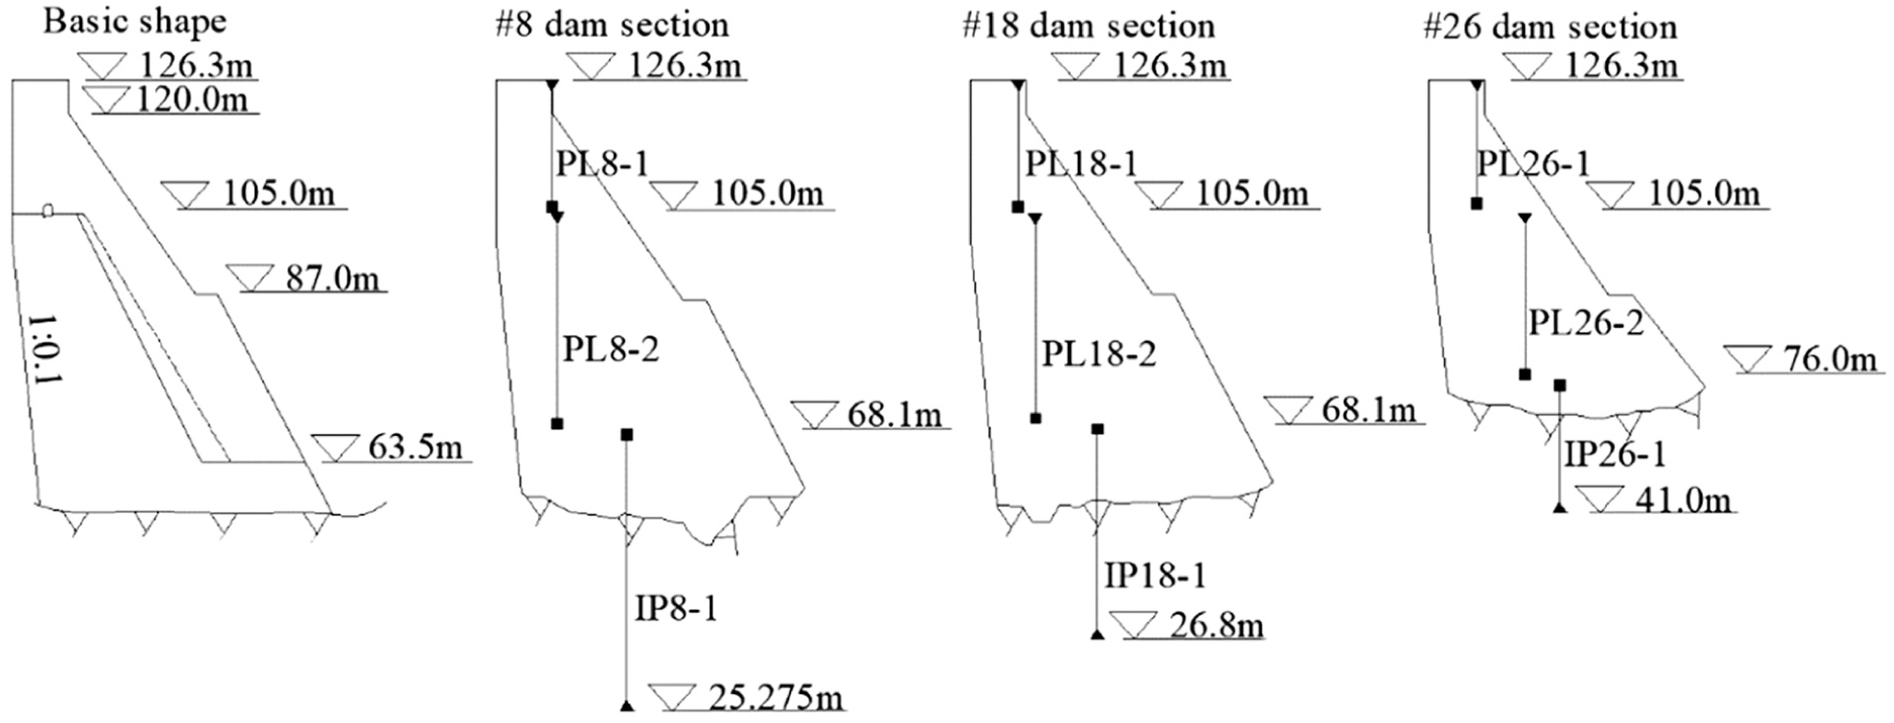
Section shape and observation point locations.
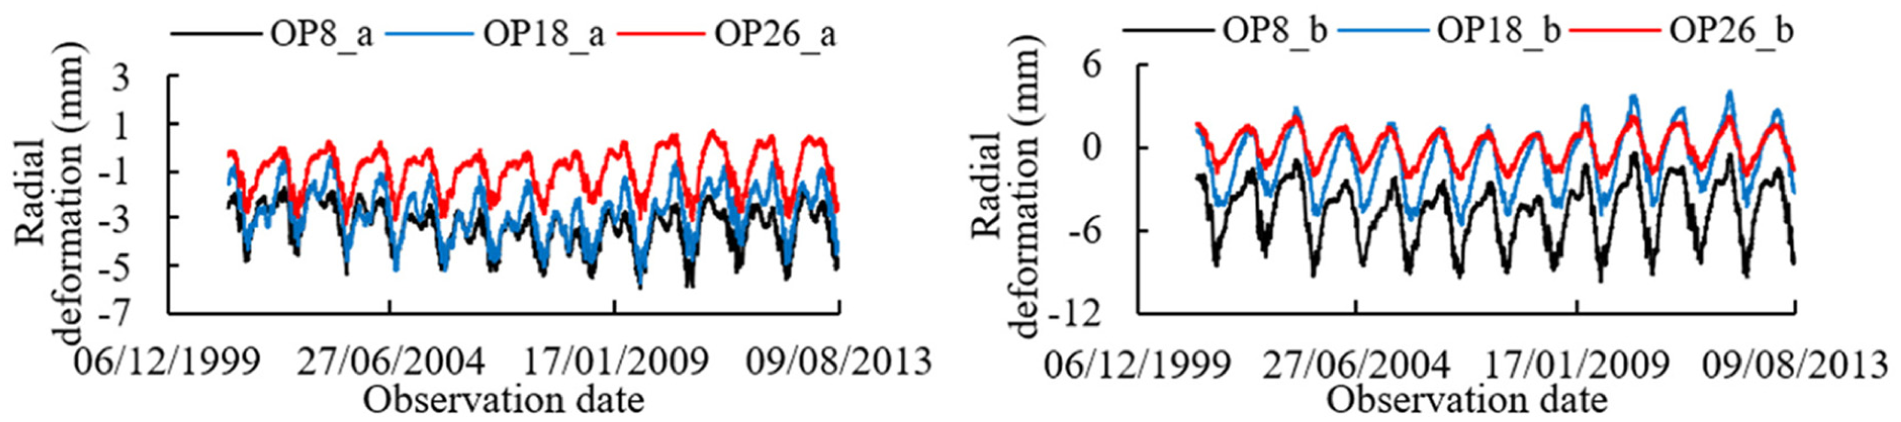
The radial deformation of OP8_a, OP8_b, OP18_a, OP18_b, OP26_a, and OP26_b.
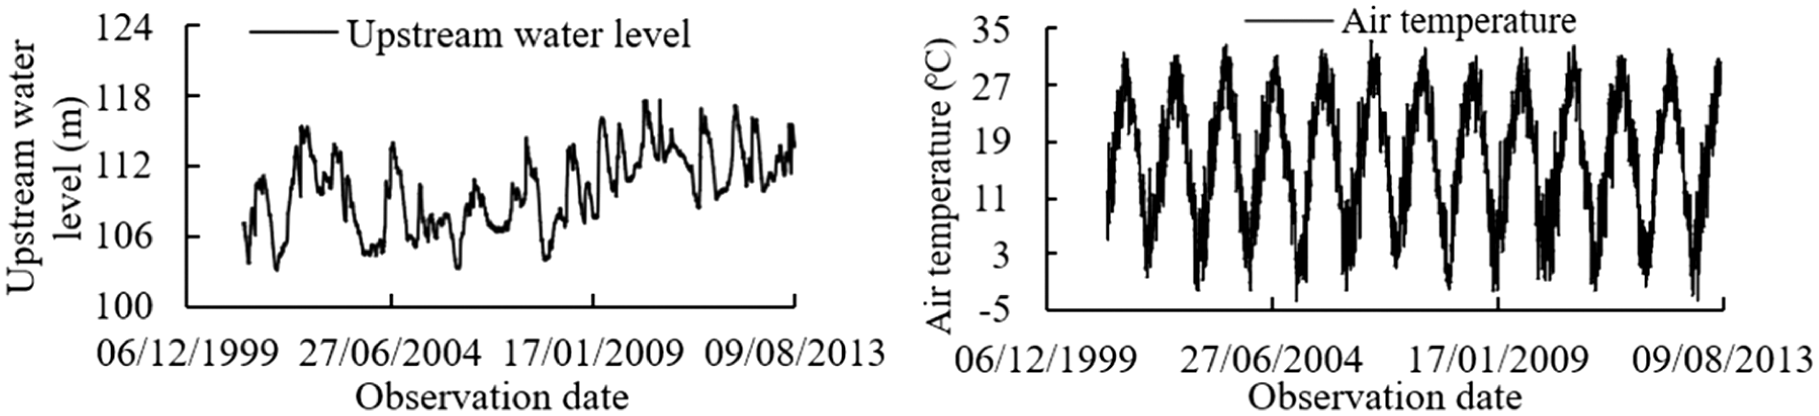
Time series of upstream water level and air temperature.
The modeling process is the same with case study A and is not elaborated here. The analysis results show that the dam B is in the basic normal status on December 6, 2001, to December 16, 2001, January 24, 2001, to February 3, 2001, January 4, 2002, to February 13, 2002, February 15, 2004, to February 22, 2004, January 20, 2005, to January 23, 2005, January 4, 2006, to January 14, 2006, and January 10, 2008, to January 13, 2008. Basic normal statuses happened in the condition of low air temperature. The primary reasons are associated with cracks in the dam. During the construction phase, cracks occurred in the #5 to #28 dam sections near the elevation of 105 m. These cracks have an approximate length of 300 m and a depth of around 5 m. Figure 23 shows the crack opening deformation of X8-1 and X12-1. When the ambient temperature is low, the internal temperature of the dam is higher than its surface temperature. Consequently, the shrinkage of the surface concrete is constrained by the internal concrete, which in turn leads to the expansion of existing cracks. Moreover, the dam body features an overhang of 1:0.1 below the elevation of 105 m, as illustrated in Figure 20. During winter, the upstream water level remains relatively low, as depicted in Figure 22. Consequently, the arch dam B undergoes deformation towards the upstream direction, which further exacerbates the expansion of existing cracks.
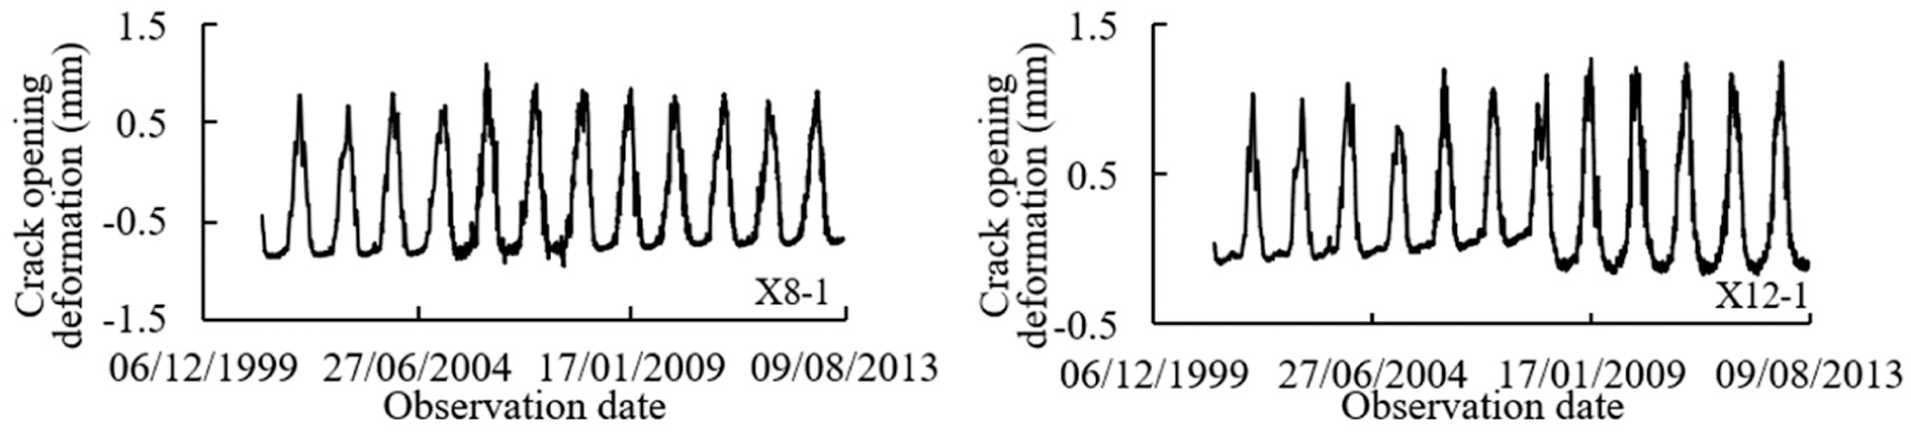
Time curves of crack opening deformation of X8-1 and X12-1.
According to the study by Lu et al., 67 the crack expansion occurred on December 5, 2001, to December 14, 2001, January 24, 2001, to January 28, 2001, January 14, 2002, to February 13, 2002, February 16, 2004, to February 22, 2004, January 23, 2005, January 10, 2006, and January 14, 2008. The results of the suggested four-level criteria are generally consistent with crack expansions given by. 67 The results of confidence interval criteria show that the arch dam B is abnormal on December 6, 2001, to December 16, 2001, February 15, 2004, to February 22, 2004, and January 10, 2008, to January 13, 2008, and some dangerous states are omitted. Therefore, the established four-level monitoring criteria are more reliable compared with confidence interval criteria.
Discussion
For practical application, the following points should be concerned.
(1) The established DPC analysis model is suitable for analyzing dam deformation in a shorter period. For a longer period, a phased modeling strategy can be employed. Although the DPC analysis model focuses on radial deformation of arch dam in this research, it can be improved and reconstructed to analyze tangential deformation, crack deformation, and so on. Significantly, some special influencing factors need to be given a special consideration according to different deformation types. For example, the studies of Rong et al., 68 Shao et al., 69 and Li et al. 70 demonstrate that the impacts of river valley deformation should be fully considered in the tangential deformation modeling of in-service ultra-high arch dam.
(2) The physical significance and the probabilistic interpretation of the developed four-level criteria are clearer than those of confidence interval criteria. If abnormal status emerges, then the deformation similarity characteristics of OPGs change to some extent. The developed criteria compared with confidence ellipsoid method, another improved method based on confidence interval criteria, are conducive to practical application.
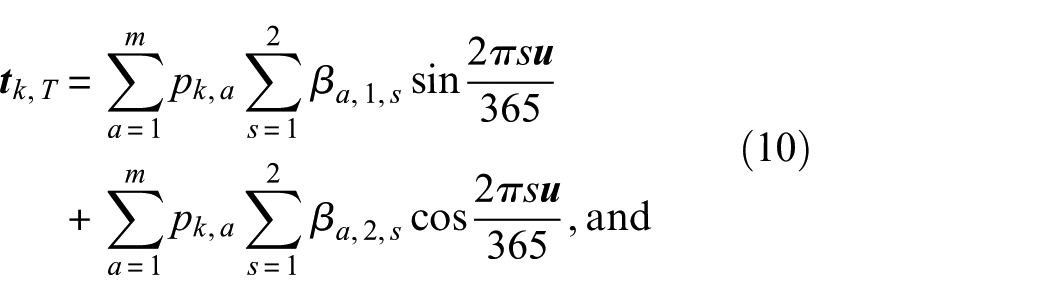
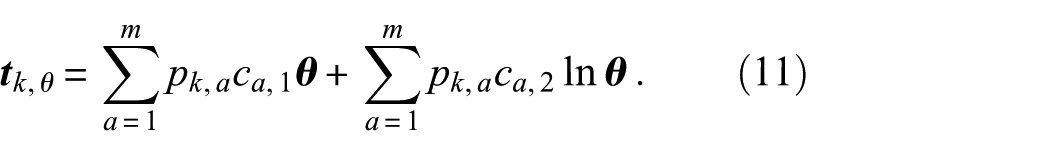
(3) For projects in cold areas, for example, Qinghai-Tibet Plateau, Equations (10) and (11) need to be improved based on site-specific conditions. In addition, the uncertainty in the occurrence of accidental loads determines that this model cannot characterize their action effects. Numerical simulation and geo-mechanical model test can be employed for analysis.
(4) Confidence level plays a crucial role in analysis results and should be carefully determined. However, there is no distinct concept on how to determine scientific confidence level values. Factors, for example, engineering and building grades, disaster losses, failure risk, stress state, stability, and practical application experience, should be fully considered.
The operating conditions of ultra-high arch dams are complex and diverse. In engineering applications, the most appropriate countermeasures should be determined through scientific analysis, practical application experience, and site-specific conditions.71–73 Recommended treatment measures are presented in Figure 24. If a basic normal status occurs, it is essential to concentrate on deformation trend carefully, to closely monitor other relevant observation items, and to deeply explore possible reasons. For a dam in a moderate abnormal status, structural damage should be thoroughly examined, and countermeasures, for example, reinforcing damaged parts and reducing upstream water level, need to be implemented. When a severe abnormal status occurs, personnel should be evacuated rapidly, and effective flood prevention measures must be adopted.
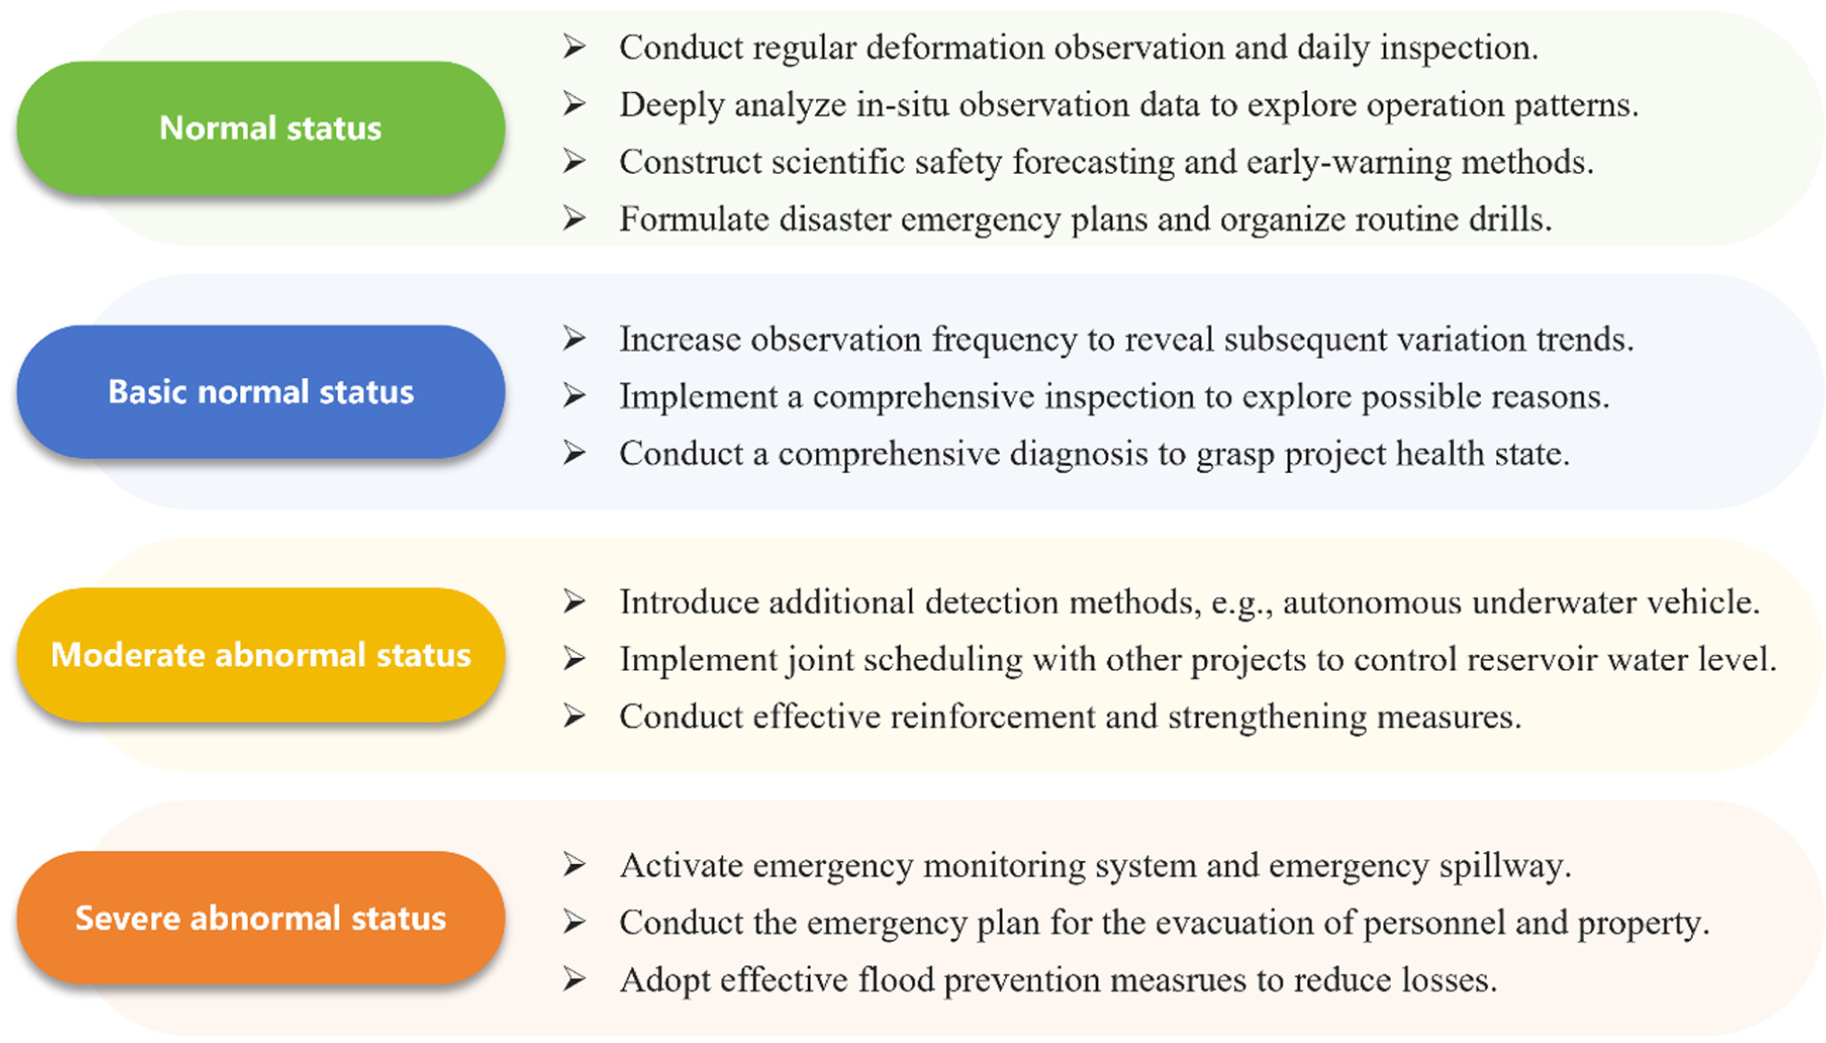
Recommended treatment measures.
Conclusion
To solved the deficiencies of existing methodologies, this research provides a novel method for monitoring the deformation safety of OPGs of ultra-high arch dams by comprehensively considering deformation similarity relationship and principal component feature. The following conclusions are drawn. (1) Considering the mathematical mechanism of PCA, the hydraulic pressure component, the temperature component, and the aging component of DPC are modeled. The established DPC analysis model shows good performance to characterize the main deformation patterns of OPGs with similar spatiotemporal deformation characteristics. (2) The improved SSA shows better performances compared with the original SSA in terms of convergence performance, searching ability, and operation stability. The DPC analysis model optimized by the improved SSA possesses the best interpretation and prediction effects among the three established models. (3) The proposed four-level criteria exhibit greater rigor in probabilistic and physical significance compared with the confidence interval criteria. In comparison to confidence ellipsoid method, the proposed criteria provide greater practicality for engineering applications. This study offers technical assistance for the improvement of safety monitoring capability, disaster prevention, and lifetime extension of in-service ultra-high arch dams.
In engineering practice, meticulous attention must be paid to the boundary conditions to ensure the applicability of the proposed methodology. (1) The DPC analysis model is well-suited for short-term analysis, while a phased modeling approach can be employed for long-term analysis. (2) For projects located in cold regions, the expressions for characterizing temperature deformation and aging deformation require refinement based on on-site conditions. (3) Inherent uncertainty associated with the occurrence of accidental loads means the DPC model is unable to characterize their effects. In such instances, numerical simulation and geo-mechanical model tests are recommended for analytical purposes.
In future research and practice, the following efforts still merit high priority. First, it is essential to strengthen studies on the deformation feedback mechanisms of ultra-high arch dams and adjacent mountain slopes. Special attention should be paid to the impacts of strong earthquake, cold-wave shocks, freeze-thaw cycles, dissolution, and carbonation, as well as their coupled effects. In addition, an intelligent database and sharing platform should be established. This will facilitate the efficient management and utilization of in situ observation data of ultra-high arch dam, which can improve the efficiency of four-level safety monitoring.
Footnotes
Appendix A
Appendix B
Declaration of conflicting interests
The authors declared no potential conflicts of interest with respect to the research, authorship, and/or publication of this article.
Funding
The authors disclosed receipt of the following financial support for the research, authorship, and/or publication of this article: This research was supported by the National Natural Science Foundation of China (grant numbers 52109155 and 42401319) and the Open Research Fund Program of National Key Laboratory of Water Disaster Prevention (grant number 2024491911).