
Abstract
Machinery label data is necessary for training intelligent fault diagnosis models. However, unlabeled and abnormal data are commonly seen in these data, resulting in the reduction of data quality. As a result, these low-quality data may lead to inaccurate diagnosis models. To address this issue, a kernel cluster local outlier factor (CLOF) method is proposed for automated labeling and abnormal data detection. The suggested approach can establish the relationship among different samples of label data based on a parameter-free method, that is, the natural neighbor spectrum. Through this relationship, different clusters are searched. Then, CLOF is calculated to evaluate the abnormal degree of different clusters, and clusters whose CLOF is larger than the predetermined threshold value are detected as abnormal data. The natural neighbor spectrum is reconstructed after cleaning abnormalities. Finally, fault types of the data can be labeled automatically based on the relationship between unlabeled and labeled data through the reconstructed spectrum. The proposed method is validated through different experimental data collected from a gear test bench, a real wind turbine, and a centrifugal pump, respectively. The results indicate that the proposed approach is effective in detecting abnormal data with different condition types and labeling data accurately and automatically.
Keywords
Introduction
Machinery structure health monitoring has entered the big data era, presenting both significant opportunities and challenges. As for the opportunities, big data can be processed and mined to recognize the machinery condition or diagnose faults accurately.1–3 For different health monitoring fields such as wind turbine drivetrain, 4 bearing,5,6 gearbox, 7 and in different working conditions such as unstable speed,8,9 and so on, have been deeply studied. However, big data possesses five distinct characteristics, namely substantial volume, diverse variety, rapid velocity, diminished quality, and low density of value, 10 which make it a challenge to process this big data for fault diagnosis. Many researchers resort to employing deep learning techniques in intelligent fault diagnosis for processing massive data more rapidly and efficiently.11–14 Although these intelligent fault diagnosis methods provide an effective way for processing of monitoring data with properties of high volume, high velocity, and low-value density, it should be noted that several challenges and concerns accompany these methods. Because machinery usually operates under tough environment, abnormal data are widely present. Inaccuracy models are usually constructed based on low-quality data containing abnormal data.
Data quality describes the extent of the associations between data and the operational status of machinery, 15 Abnormal label data indicates the presence of abnormal data as well as unlabeled or incorrectly labeled data. Poor-quality data are usually generated due to disturbance from the environment and faults on data acquisition equipment, these poor-quality data are irrelevant to the machinery health condition. Training intelligent fault diagnosis models directly based on these abnormal data without data processing, unreliable models are probably obtained due to the special property, that is, “garbage in, garbage out” 16 shared by machine learning-based methods. Extensive research has been conducted on the impact of abnormal data on machine learning performance, and all have found that the classification accuracy decreases as the quality of training data declines.17–19 As a result, wrong diagnosis results are probably obtained based on these unreliable models. The abnormal data have attracted much attention, and it has become an issue that cannot be ignored during intelligent model construction. For example, to decrease the negative influence of polluted data, Shang et al. 20 proposed a core loss that can be used in an autoencoder framework. Wang et al. 21 attempted to construct a graph neural network with data cleaning for the diagnosis of monitoring data with contamination. By using compressive sensing and an enhanced context encoder for abnormal data reconstruction, one-dimensional data quality is greatly improved. 22 Although many intelligent models have considered the negative influence brought by abnormal data and many measures have been taken, they cannot cancel the influence of abnormal data, and data labeling is still an open issue.
To address this issue, some data cleaning methods should be used to remove abnormal data and label data for quality assurance of monitoring data before fault diagnosis. The data quality will be improved, and then it can be used to train intelligent models. Normal data, intimately linked to health status, have similar characteristics and can be considered as contextual attributes. The data that are abnormal and against some typical pattern, with their characteristics becoming indeterminate rather than deterministic, governed by random or probabilistic distributions, are markedly distinct from the normal data. Thus, these contextual outliers are considered as abnormal data,
23
and numerous methods for detecting abnormal data have been proposed. These methods can be categorized into four groups: statistics-based methods, classification-based methods, regression-based methods, and cluster-based methods. As the commonly used statistics index or methods, median absolute deviation,
24
Gumbel distribution,
25
3
Many researchers also developed some detection methods of abnormal data based on clustering algorithms. For example, utilized in the assessment of wind turbine health, the density-based spatial clustering of applications with noise (DBSCAN) algorithm 37 was implemented to mitigate the impact of outliers arising from instrumentation errors. A local kernel density estimation approach 38 was proposed for abnormal data detection. For enhancing the robustness of their energy prediction model via deep learning algorithms, He et al. 39 utilized the local outlier factor (LOF) to refine the gathered data. A kernel-based LOF 40 was suggested for the cleansing of big data in machinery condition monitoring. Xie et al. 41 proposed an adaptive sliding window and weighted multiscale LOF for abnormal data detection. The isolation forest was introduced for anomaly detection. 42 Hu et al. 43 argued that the preparation of data precedes the modeling of wind turbine power curves driven by data and proposed a preliminary cleaning method based on k-means clustering algorithm. Clustering algorithms usually need some parameters to be set and their effectiveness depend greatly on these parameters, which brings great difficulty in applications of these methods.
The above detection methods of abnormal data cannot be used for label data quality assurance, and the reasons are as follows. First, there exist difference among the data of various labels which make the abnormal detection more difficult. Second, these methods usually fail to detect abnormal data that are numerous. Third, most existing work on data quality assurance focuses on abnormal data detection but neglects labeling data automatically. In actual engineering, unlabeled data are commonly seen and cannot be directly used for intelligent fault diagnosis modeling. Lacking an effective technique of labeling data, labeling data has to be performed by hand, which requires expert experience and takes up much time.44,45 Therefore, an effective quality assurance method of label data should have both the ability to detect abnormal data and to label data automatically.
To detect abnormal data and label data automatically for label quality assurance, a natural neighbor-based kernel cluster local outlier factor (CLOF) is proposed. In the proposed method, the natural neighbor spectrum is constructed first. The inspiration for the concept of the natural neighbor stems from the dynamics of human camaraderie, wherein true friendship is mutual, requiring each individual to view the other as a genuine companion in order for the bond to be authentic. The idea of natural neighbor is that two points can be considered as natural neighbors only if any point belongs to the neighborhood of the other. Based on this idea, natural neighbor can be searched without setting parameters and just depends on the condition of the label data. Specifically, if data of some label have high density, the nearest neighbor number of these data will have large values, while abnormal data will have a small nearest neighbor number. A spectrum of natural neighbors can be constructed based on the relationship inherent in natural neighbor data. Second, the natural neighbor clusters are searched according to the natural neighbor. Third, the local outlier degree of different clusters, including the normal cluster and suspicious cluster, will be calculated. Finally, abnormal data can be detected from data of various labels according to these CLOFs and then the label can be identified according to the natural neighbor relationship between the data of known labels and the data of unknown labels.
Drawing from the aforementioned statements, the contributions of this paper can be outlined as follows:
1) The paper originally illustrates and discusses the notion of label data quality within the domain of machinery health monitoring. Moreover, based on these discussions, a method employing the natural neighbor-based kernel CLOF is proposed for improving the quality of label data by automatic labeling and abnormal data detection.
2) The application scope of the natural neighbor is broadened in machinery health monitoring through the proposed method. Based on natural neighbor, a new quantitative evaluation of data quality is proposed and named CLOF. The CLOF is able to detect abnormal data from data of various label, which traditional methods probably fails to do.
3) Based on the natural neighbor, the label data can be automatically identified and labeled, which further improves the quality of the label data.
The remainder of this paper is organized as follows. The natural neighbor theory is introduced in the second section. The method for ensuring label data quality is elaborated in the third section. The fourth section is dedicated to the validation of the proposed technique using gear and bearing data, individually. Lastly, the fifth section provides the conclusion for this study.
Natural neighbor theory
k-Nearest neighbors
The foundation of many powerful tools in various fields has been laid by k-nearest neighbors (KNN),46–48 which refers to a subset that can be searched according to the following rules. Given a set of points A, and for any point p in A, the KNN of p is defined as

where
For example, in Figure 1, the KNN of
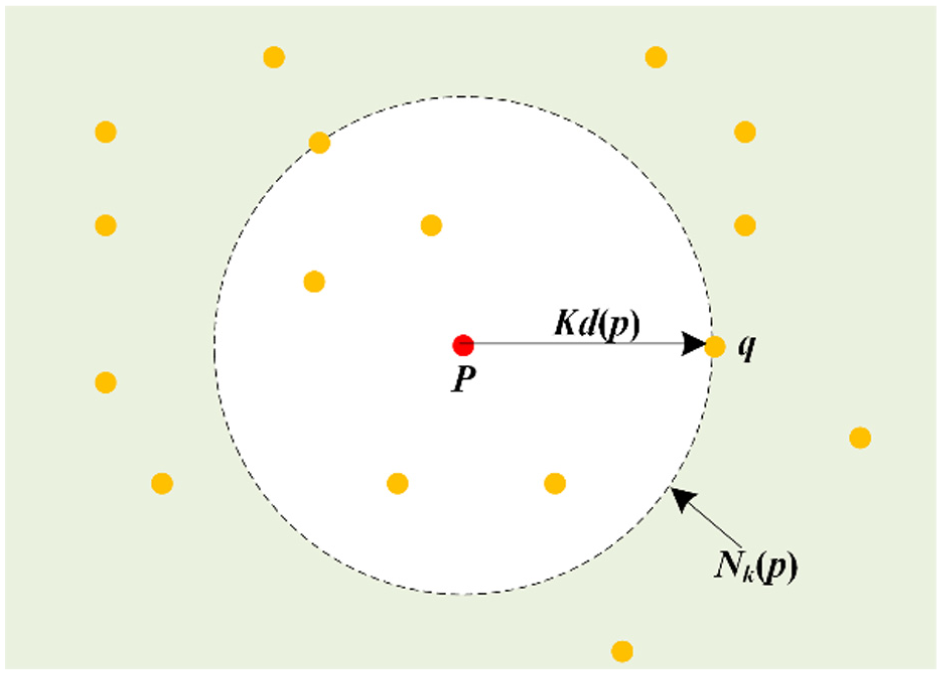
KNN of p when k = 6. KNN: k-nearest neighbor.
The mutual neighbors are constructed based on KNN and RKNN for representing a more closely relationship between two points. p and q become mutual neighbors, if they satisfy the following rule

Natural neighbor
One notable shortcoming of KNN and RKNN is that they both suffer from the problem of parameter selection. It is expected that the points similar to
Natural neighbor is proposed to solve this shortcoming for describing the neighbor relationship exactly. The theory of natural neighbors, drawing inspiration from the camaraderie prevalent in human society, 49 encompasses the subsequent quartet of definitions.


For


where
Proposed method
To improve the quality of label data, a natural neighbors-based method is proposed. The proposed method involves first searching for the natural neighbor of each data point and constructing a natural neighbor graph based on the identified natural neighbors. Second, the natural neighbor clusters are obtained by searching the natural neighbor path and the sharing path for different points. Third, the kernel CLOF is calculated, where includes the LOF of the normal cluster and the suspicious cluster. Finally, clean the abnormal data based on the kernel CLOF, and data with unknown labels can be found, and some data can be further labeled with the help of the natural relationship shared by these data and labeled data. Each step’s implementation and illustration are meticulously delineated in the subsequent four sections.
As depicted in Figure 2, the flowchart of the proposed method is visually presented based on the aforementioned statements.
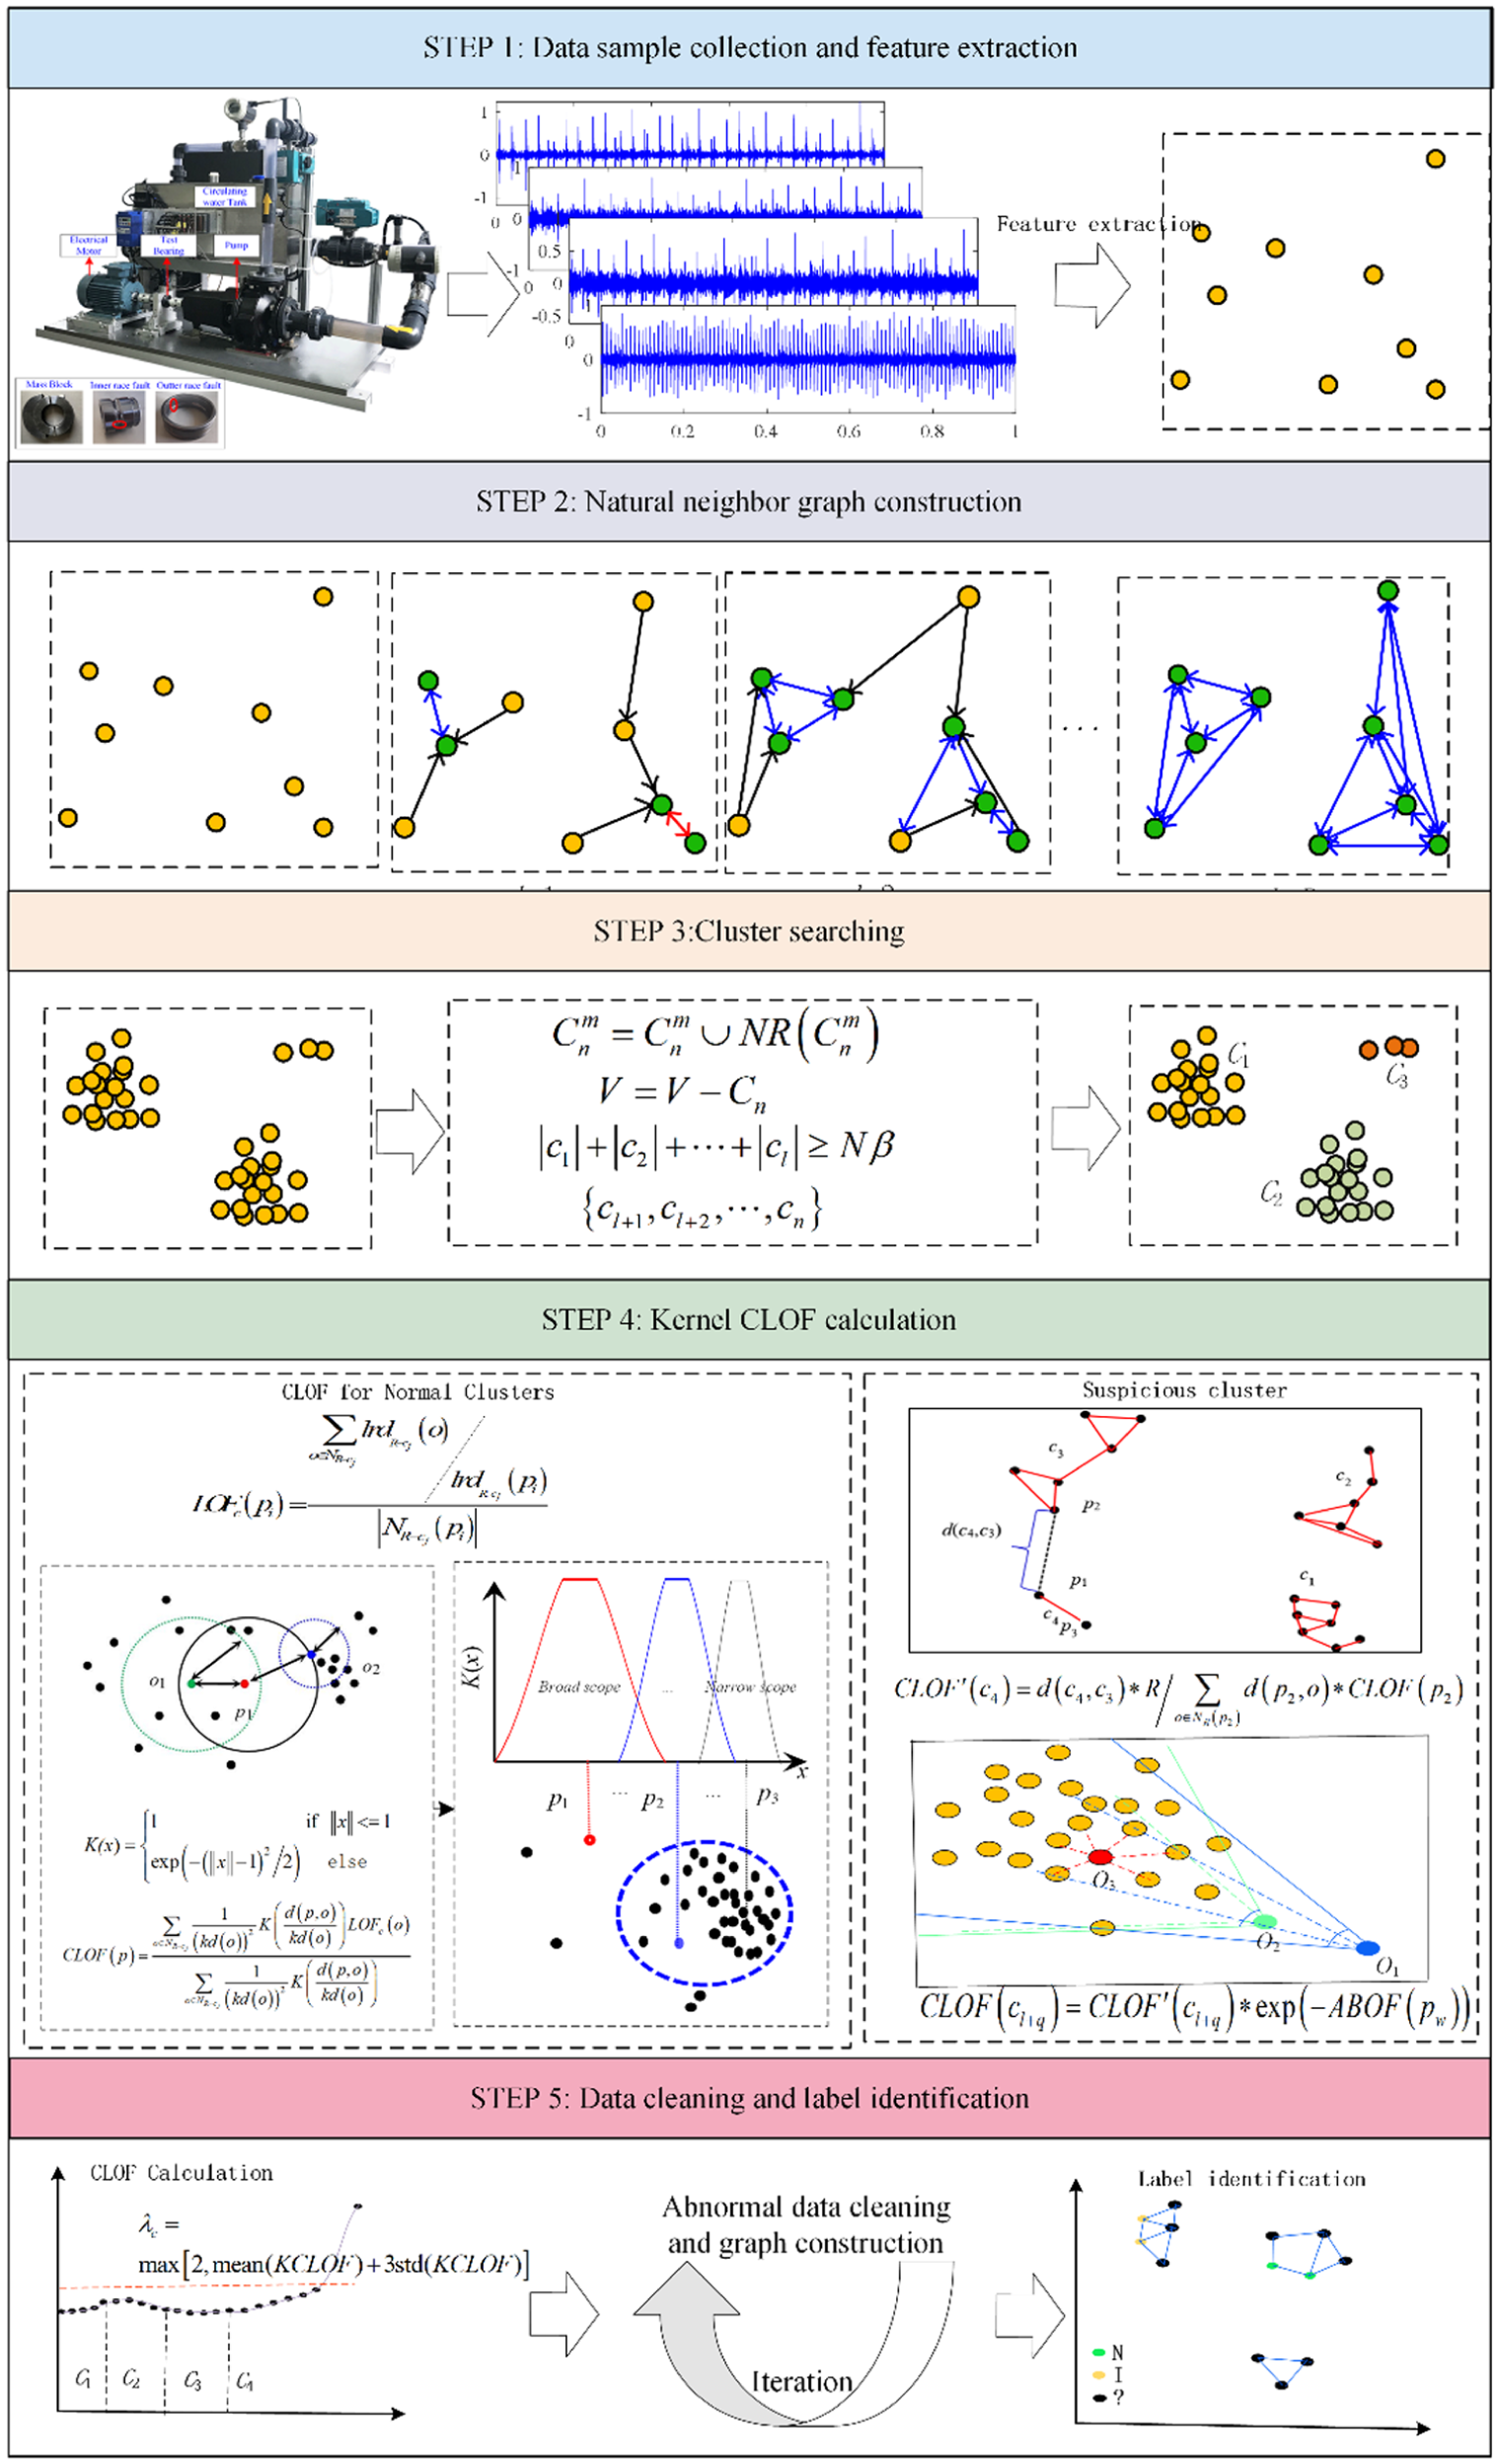
The flowchart of the proposed method.
Natural neighbor graph construction
The relationship among various sample data is established through the construction of a natural neighbor graph. Totally, 23 index features are extracted from each sample data, that is, mean value, maximum value, minimum value, peak to peak, root mean square, crest factor, variance, square root amplitude, average amplitude, waveform factor, peak value, impulse factor, margin factor, kurtosis, skewness as well as eight wavelet energy coefficients. The natural stable state of these sample data can be obtained based on these features, when
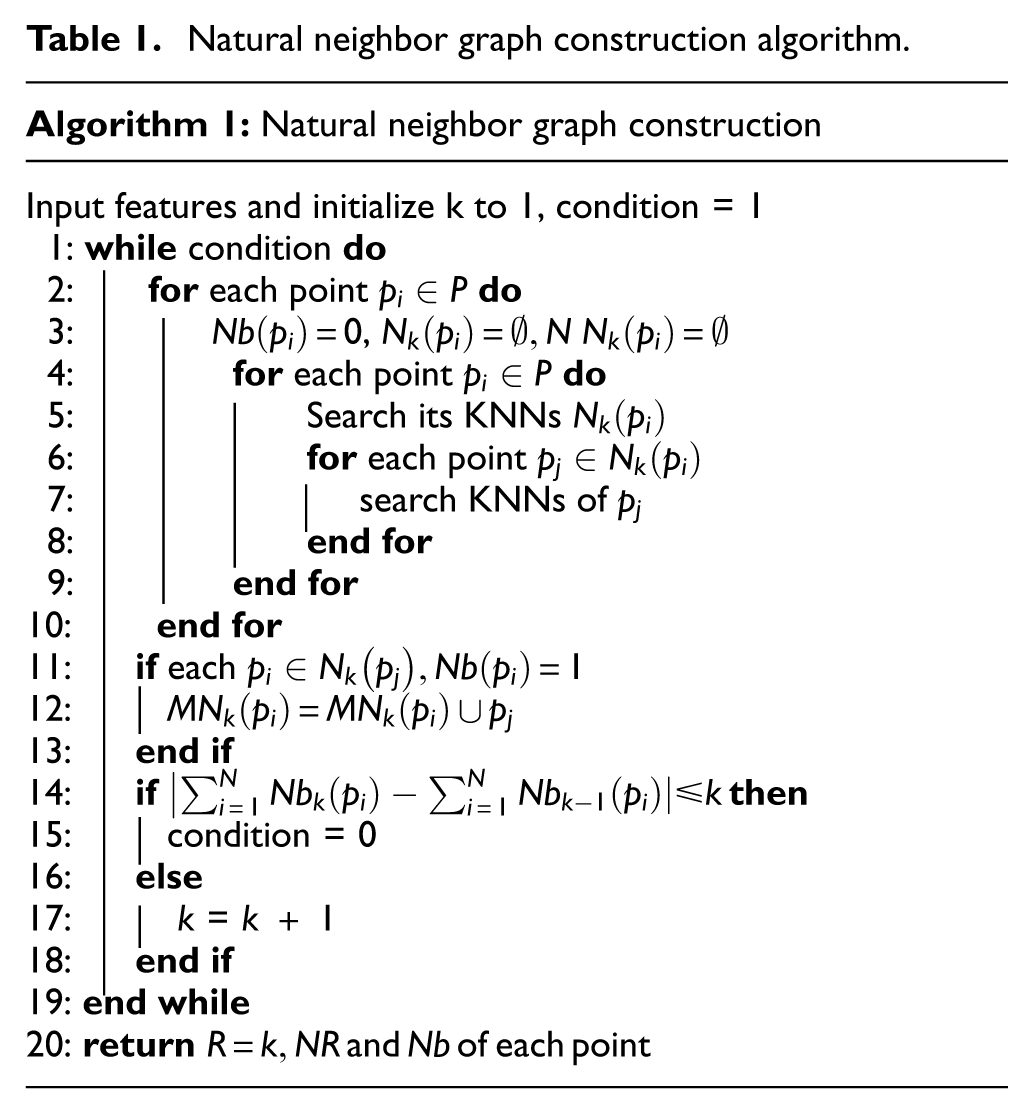
The construction process algorithm is described in Table 1 and to enhance comprehension of this procedure, an illustrative instance of a natural neighbor graph constructed through this process is presented in Figure 3.
Natural neighbor graph construction algorithm.
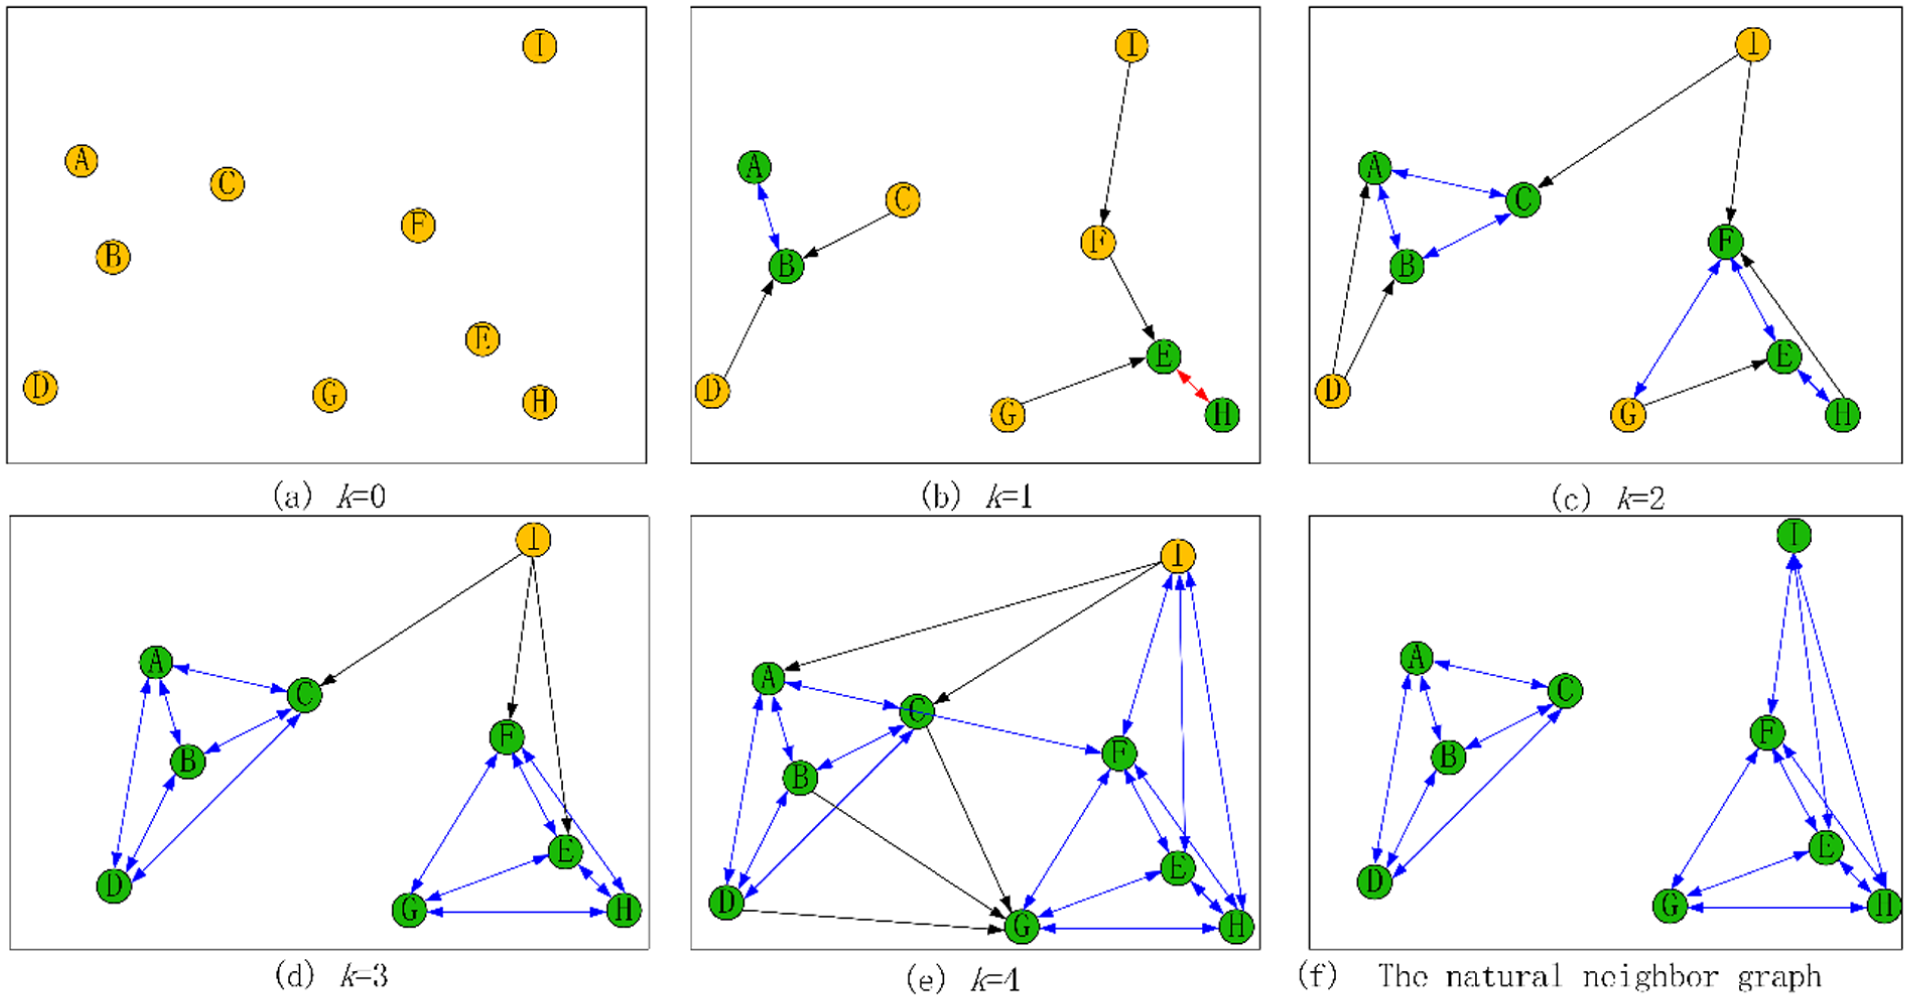
A case of natural neighbor graph construction: (a) k = 0, (b) k = 1, (c) k = 2, (d) k = 3, (e) k = 4, and (f) the natural neighbor graph.
In Figure 3(a), the initial setting of
There are totally nine data points as shown in the Figure 3(a), that is,
Similarly, when k = 1,
The search for natural neighbor clusters
The sample data can fall into different clusters without parameters derived from the natural neighbor graph. Specifically, there exists one path from one point
Cluster searching procedure algorithm.
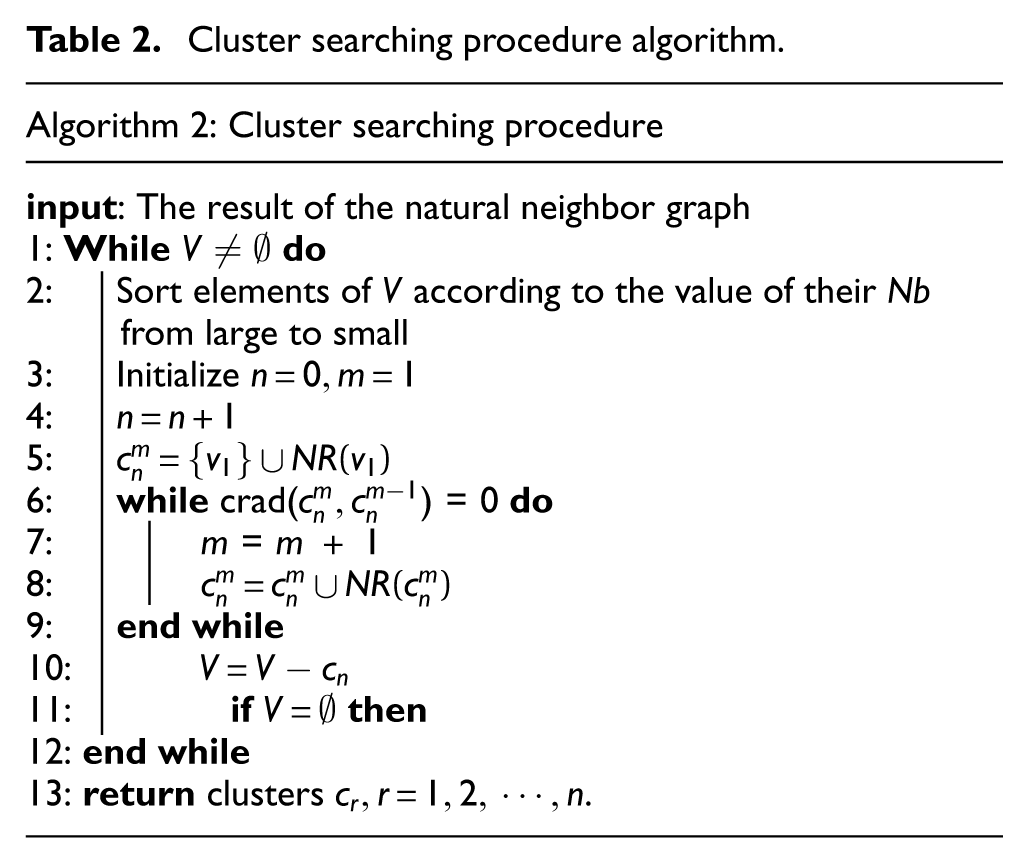
First, the natural neighbor graph constructed in section A is input, and parameters including

where
The rule ensures that all points have paths connected to
Afterwards, select the normal data according to the cluster data. Based on the search for clusters in section B, the set of clusters

The normal data have the characteristics that they are more likely to fall into clusters with more data points compared with the abnormal data. Therefore, clusters


where
Cluster local outlier factor
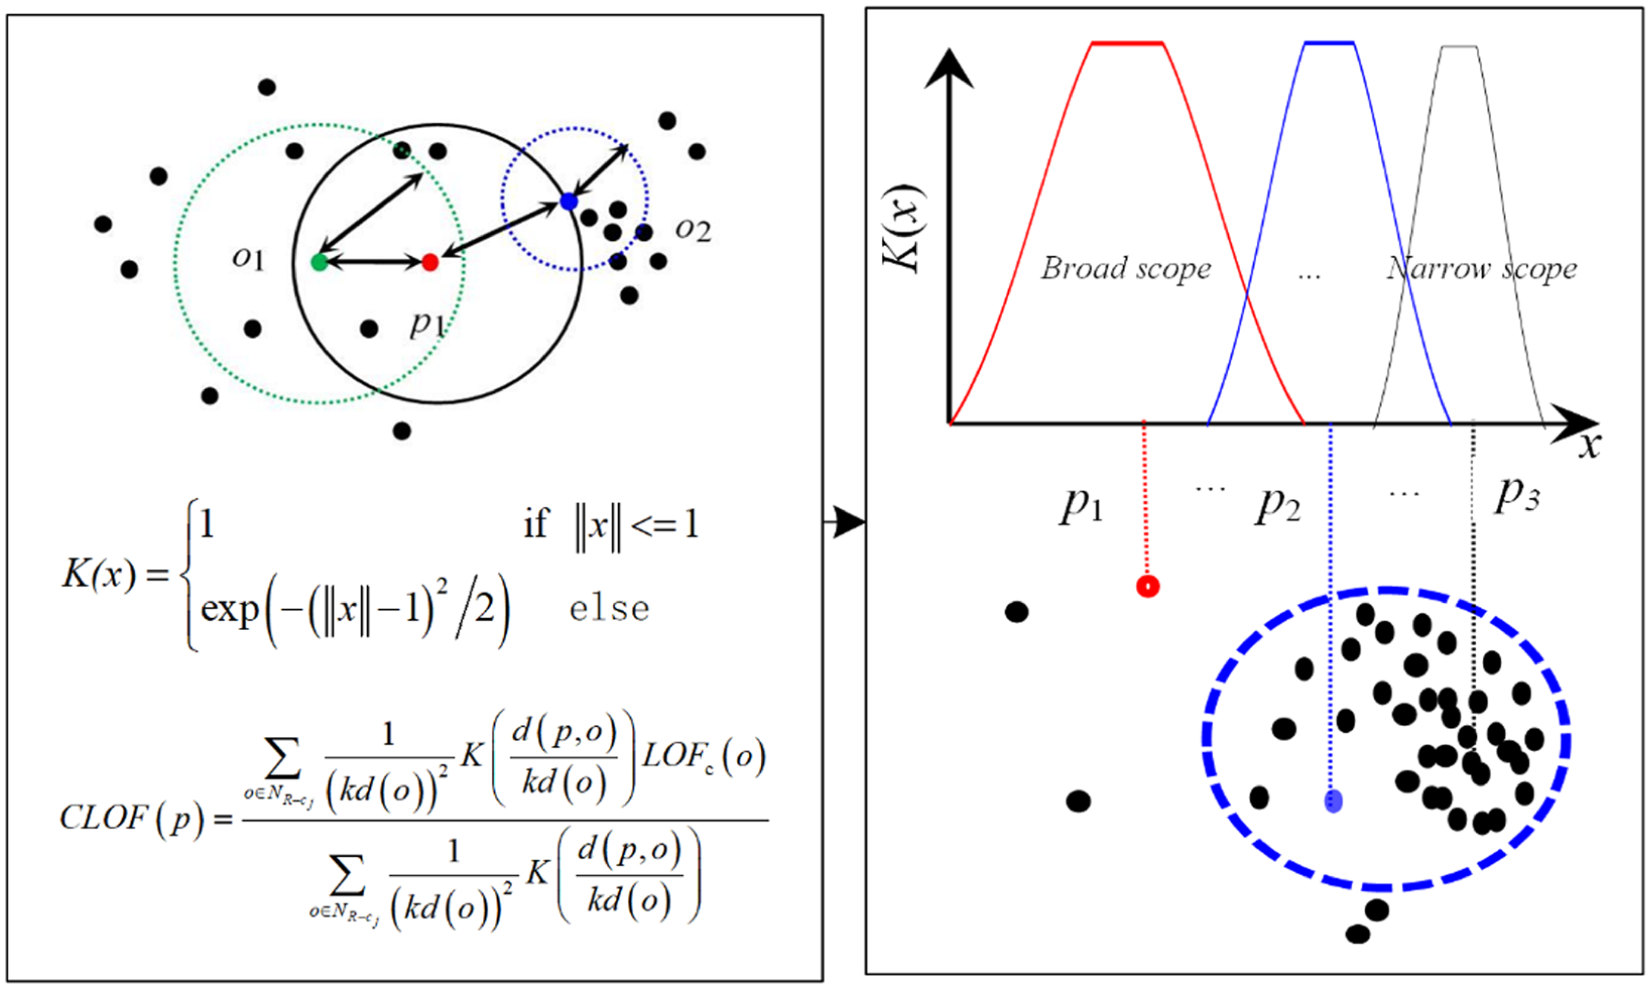
In this section, the abnormal data will be detected by CLOF, which describes the local abnormal degree of data with different labels. The calculation of CLOF is introduced as follows.
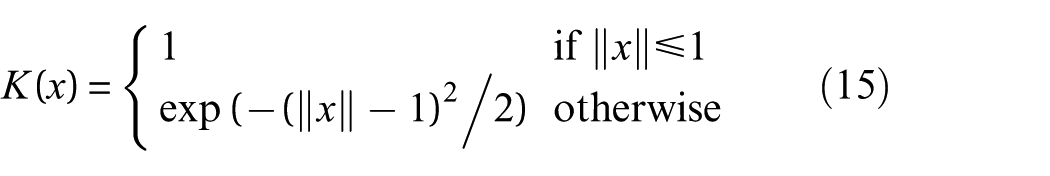
1) Calculate the CLOF of data in clusters of normal data. The improved LOF of data in the normal cluster is calculated using
where
To enhance the ability of CLOF in dirty data detection, the kernel regression method is introduced for calculating the CLOF of data among normal clusters, and the equation is shown as follows:
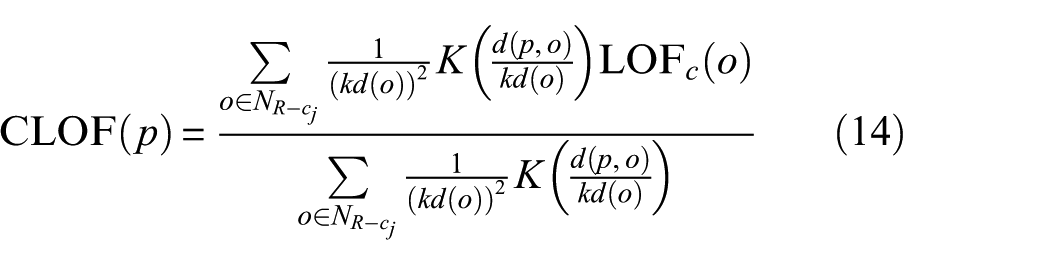
Where
From Equation (14), it is easy to find that
2) Evaluate the similarity between suspicious and normal clusters. The similarity is evaluated according to the distance between two clusters and is defined as

where

where
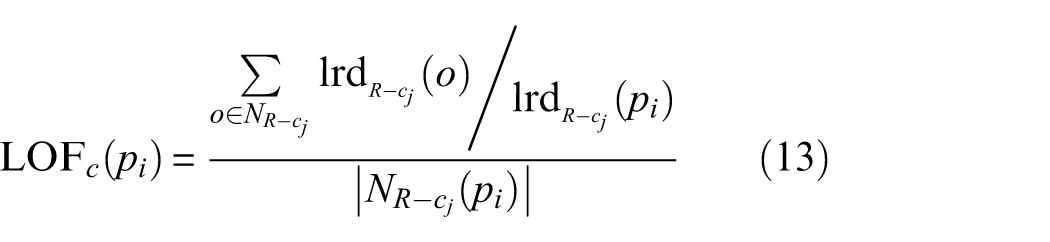
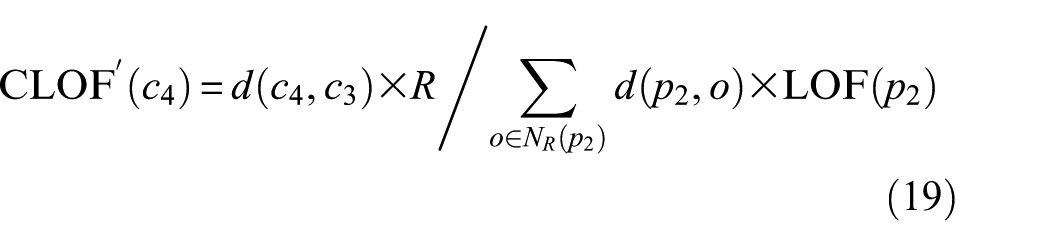
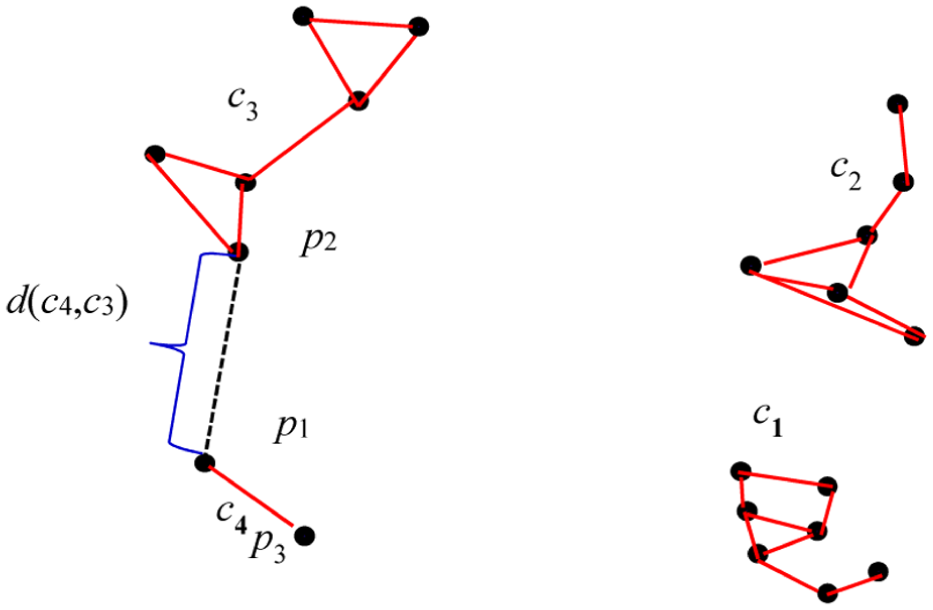
3) Calculate the CLOF of data in a suspicious cluster using the following equation
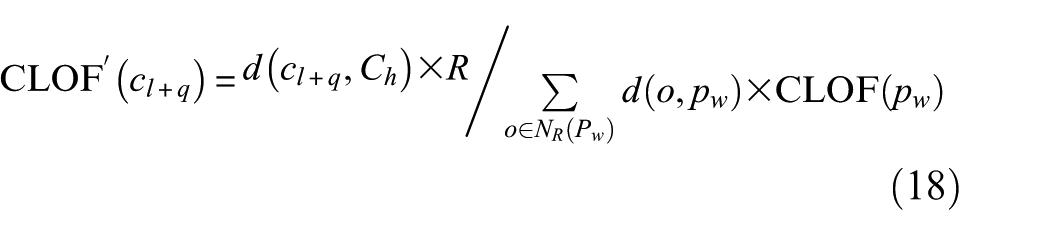
where
The calculation of the CLOF. CLOF: cluster local outlier factor.
Figure 5 shows a case of the calculation of CLOF for data in a suspicious cluster. The natural spectrum has been constructed and four data clusters including
where
4) Obtain the final CLOF. One sample near the center of its normal cluster is more likely to be normal data than the sample at the border of the cluster. However, when sample data in high-quality clusters are acquired inadequately,
where

The calculation of the CLOF. CLOF: cluster local outlier factor.
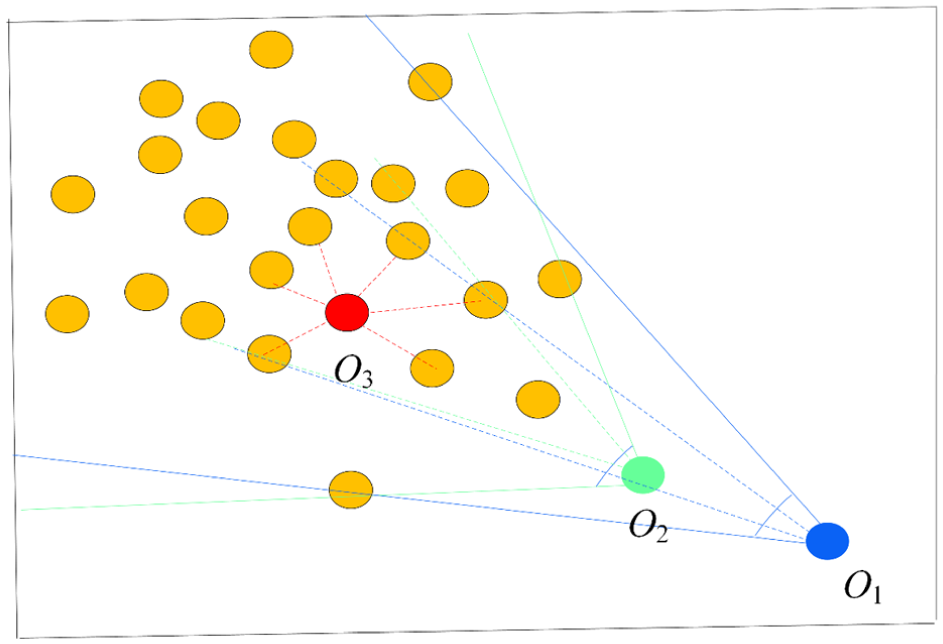
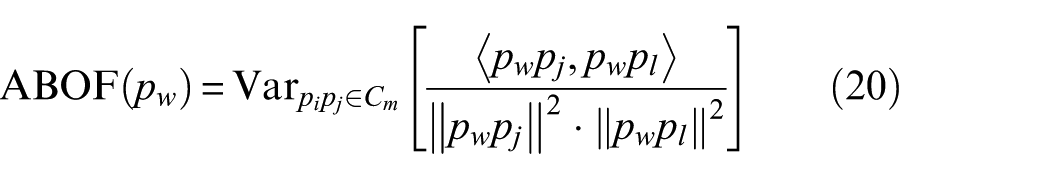
The abnormal degree is evaluated by the index of angle.
The experimental setup of gear health monitoring.
The final CLOF for suspicious clusters improved by ABOF can be obtained and shown as below
where
Label identification
The label identification is applied to clean abnormal data, and then the data of unknown label is identified. The process is described as follows.
1) Clean abnormal data. Based on CLOF, the abnormal data can be further detected. Specifically, given a threshold value

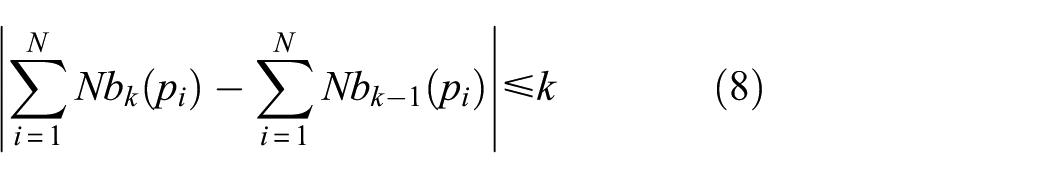
2) Identify the label of unlabeled data. After abnormal data cleaning, natural neighbor graph construction will be done repeatedly. It should be noted that the iteration stop condition is updated using the following equation
The search for natural neighbor clusters is also done repeatedly to establish the relationship among the data with known and unknown labels. For example, if the fault class of
Experimental demonstrations
Quality assurance of label data for gear health monitoring
To maintain the reliability and safety of machinery equipment, it is crucial to obtain the accurate health condition of gears, which are vital transmission elements. In this section, the effectiveness of the proposed method is corroborated through the utilization of experimental gear data. Displayed in Figure 7, the experimental setup primarily comprises one motor, one pulley, one gearbox, and one magnetic powder brake. The motor is used to supply power for the pulley through the conveyor belt. The pulley is connected to the gearbox through a shaft and drives the pinion of the gearbox. The gearbox has one pair of gears of one high-speed stage, including pinion (driven) and wheel (driving). To offer a regulatory load, the magnetic powder brake finds application. Positioned on the gearbox housing is a vibration accelerometer for the gathering of vibration data, operating at a sampling frequency of 5.12 kHz.
Vibration data was collected under three types of faults, such as normal condition, broken teeth of wheel, wheel pitting, and pinion wear. Totally, 176 samples of data were collected, and each condition has 44 samples. Ten samples are randomly selected from three conditions, including normal, pinion wear, and wheel pitting, and labeled as the corresponding fault types. The other samples, including 34 samples of normal, pinion wear, and wheel pitting, and the whole samples of broken teeth of wheel are considered as the samples with unknown labels.
To ensure the data’s quality for advancing deep learning model construction, the proposed method is implemented. Principal component analysis is then utilized to decrease the natural neighbor spectrum, aiming at facilitating visualization, which is shown in Figure 8. Then the natural neighbor clusters can be searched. The clusters are labeled from
The natural neighbor graph of the whole monitoring data.
The CLOF of the whole data. CLOF: cluster local outlier factor.
The clusters marked from
The reconstructed natural neighbor graph after data cleaning.
The fault types of samples can be identified according to the relationship constructed by the natural neighbor spectrum. For example, the fault type of unlabeled data samples that are connected to the labeled data marked using red dots can be detected as wheel pitting. Because there is no labeled data in the
The label identification result of the proposed method.
Quality assurance of label data from a real wind farm
Wind energy has zero-carbon emissions, no pollution, and renewable; therefore, many countries have given more emphasis on this energy by installing lots of wind turbines around mountain, sea, and even deserts in the last two decades. Wind turbines usually operates under tough environment, leading to high-frequency break down of them. To ensure the safety of these turbines, monitoring systems with intelligent diagnosis algorithms are developed and applied to the equipment. Unfortunately, missing values, drift segment, and distortion are commonly seen in the monitoring data due to the severe environment, which would lead to fault alarms and should be cleaned before being used to train the intelligent diagnosis model.
The monitored transmission system structure is shown in Figure 12(a) and as shown in Figure 12(b), a sensor is installed near the driven side which occurs fault easily. The sampling frequency is 25.6 kHz, and the time duration is 4 s per sample. During February 25, 2014, to April 16, 2016, 563 sampling data were collected.
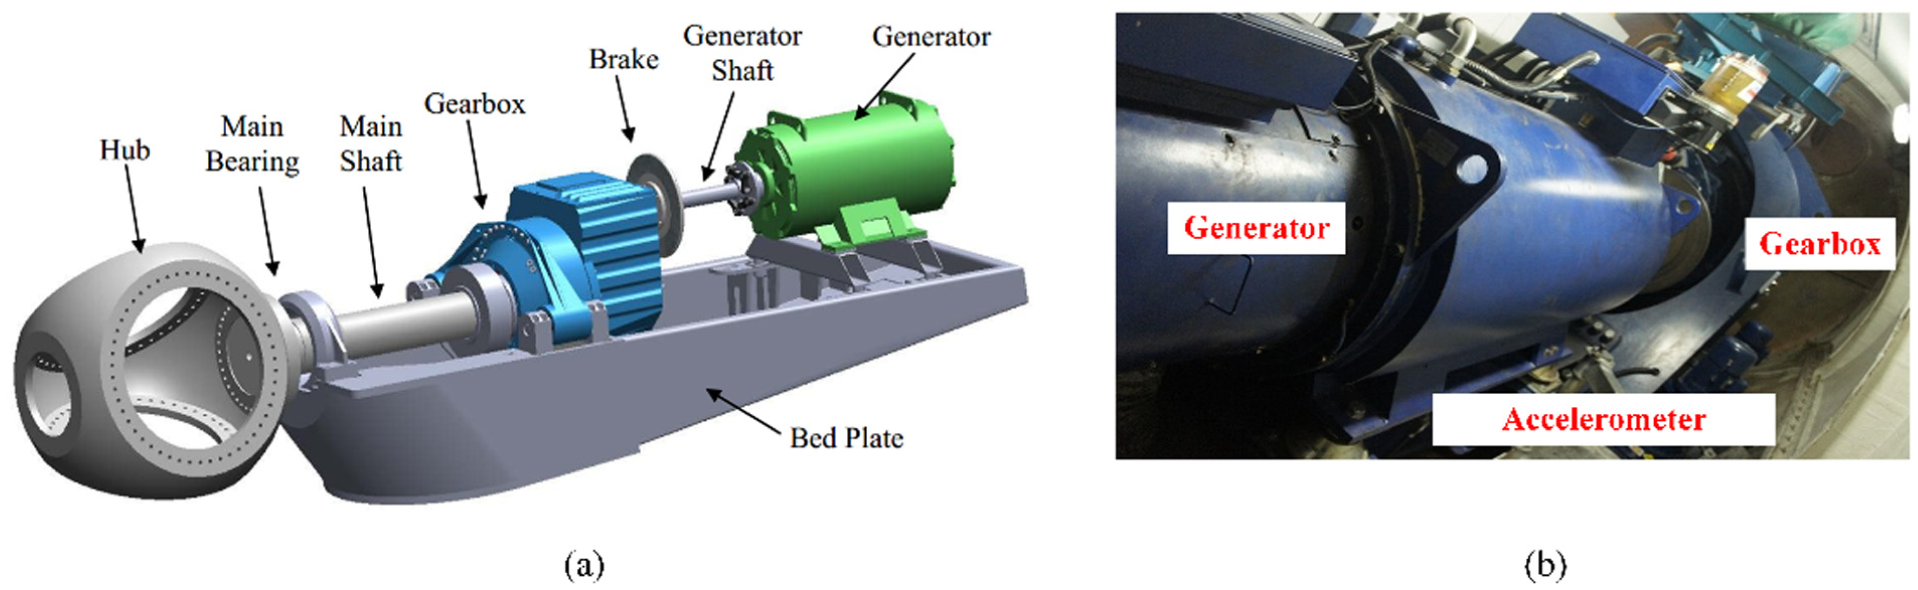
(a) The structure of wind turbine transmission and (b) the actual transmission systems in a real wind farm.
The proposed method is then applied to abnormal data cleaning. First, invalid data is cleaned based on the recorded rotary speed of the motor. The wind turbine operates and generates electricity when the wind speed data are larger than the cut-in speed, that is, 3 m/s. The rotary speed of the electrical motor is less than 1080 rpm, and the electromagnetic coil of the motor is not excited to generate electricity. Therefore, the invalid data are detected when the rotary speed is less than 1080 rpm, as shown in Figure 13. One hundred forty samples marked in blue color remain after cleaning these invalid data.
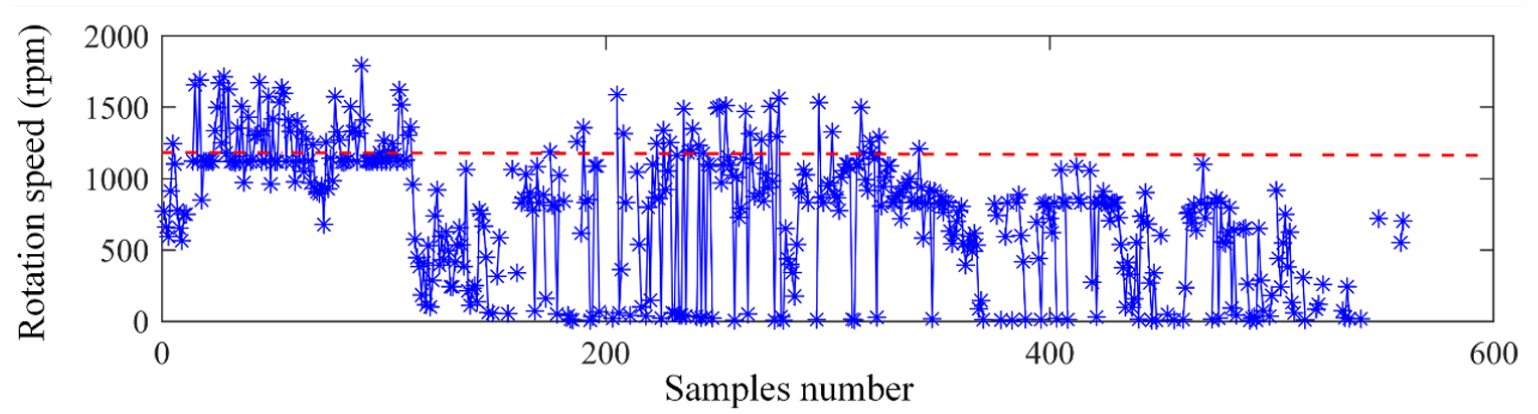
The rotation speed of different data samples.
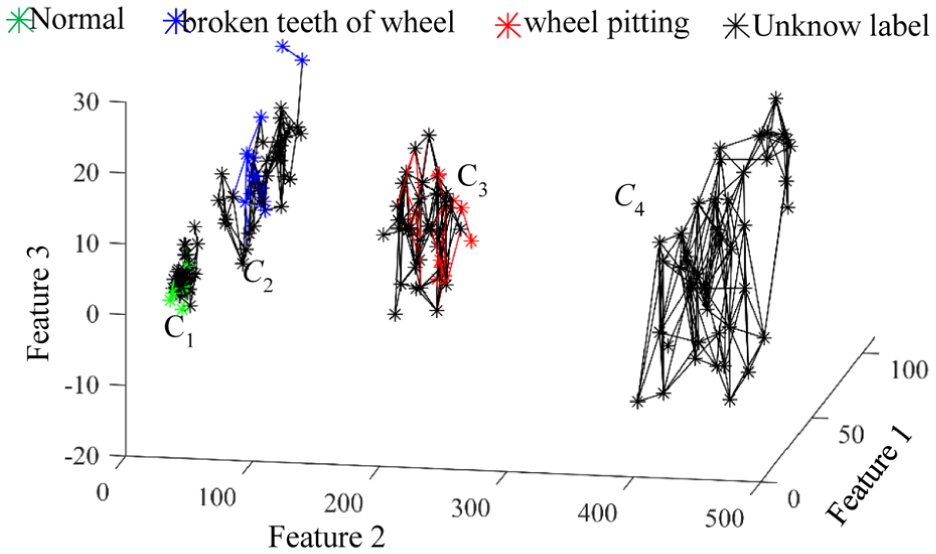
Continually, these data are input into the proposed CLOF. The natural neighbor spectrum is shown in Figure 14, and among these data, several marked using red starts denotes the data with known labels. Specifically, their labels all belong to the driven side fault. Based on this spectrum, KCLOF values are further calculated
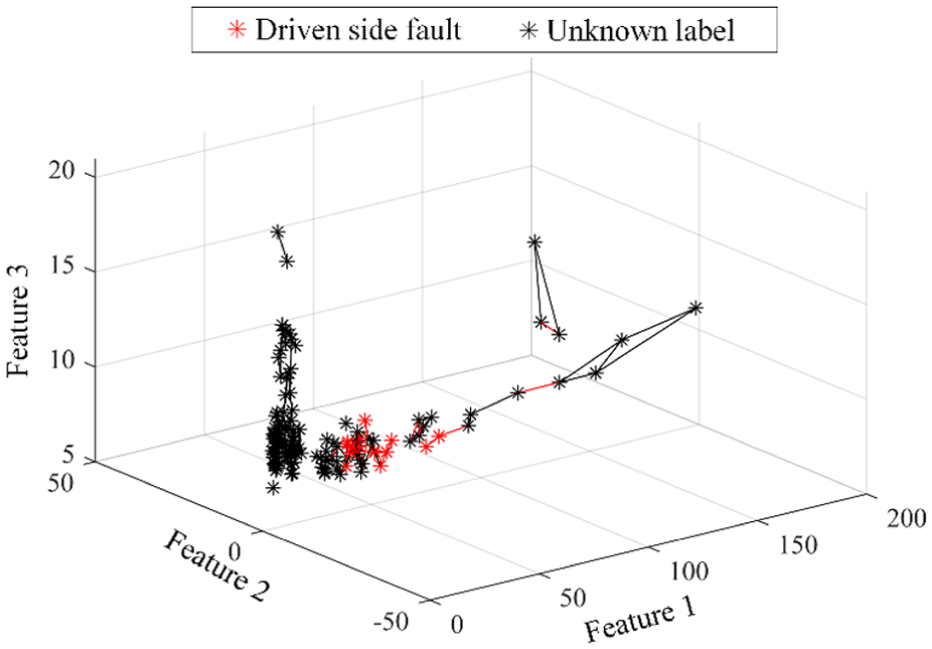
The natural neighbor graph of the whole monitoring data.
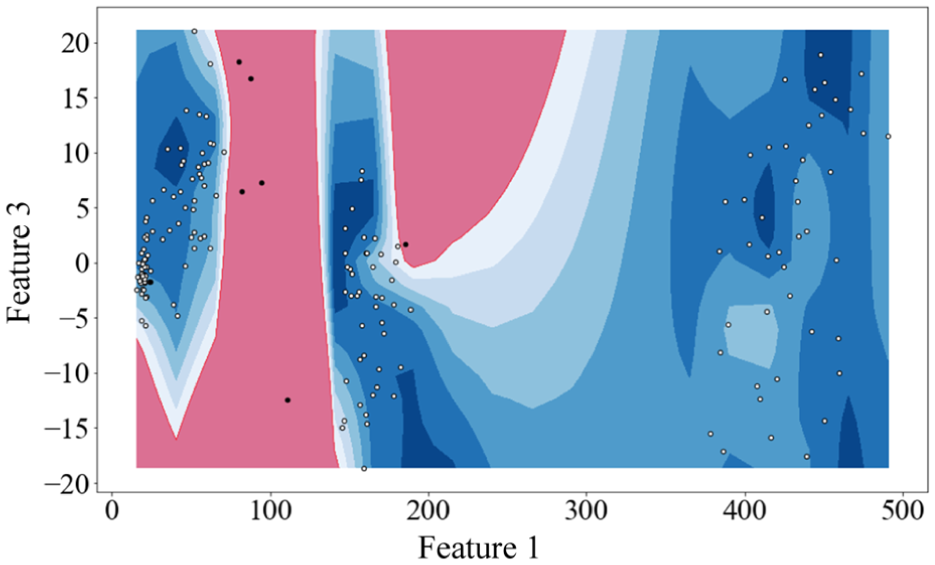
Figure 15 shows the result of the CLOF contour, and it can be seen from Figure 16 that the CLOF values of several sample data corresponding to the series number of 16, 36, 41, 119, 123, 138 exceed the threshold value. Therefore, these data are detected as abnormal data.
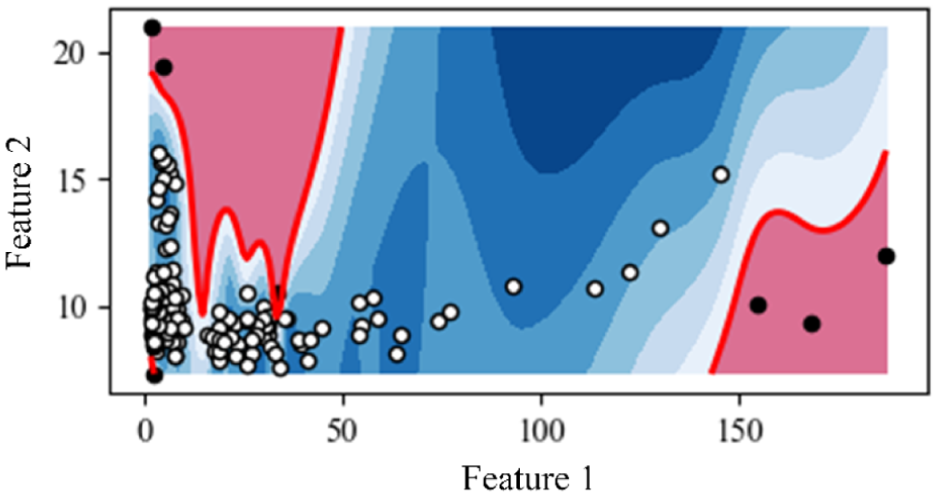
CLOF contour of different data samples. CLOF: cluster local outlier factor.
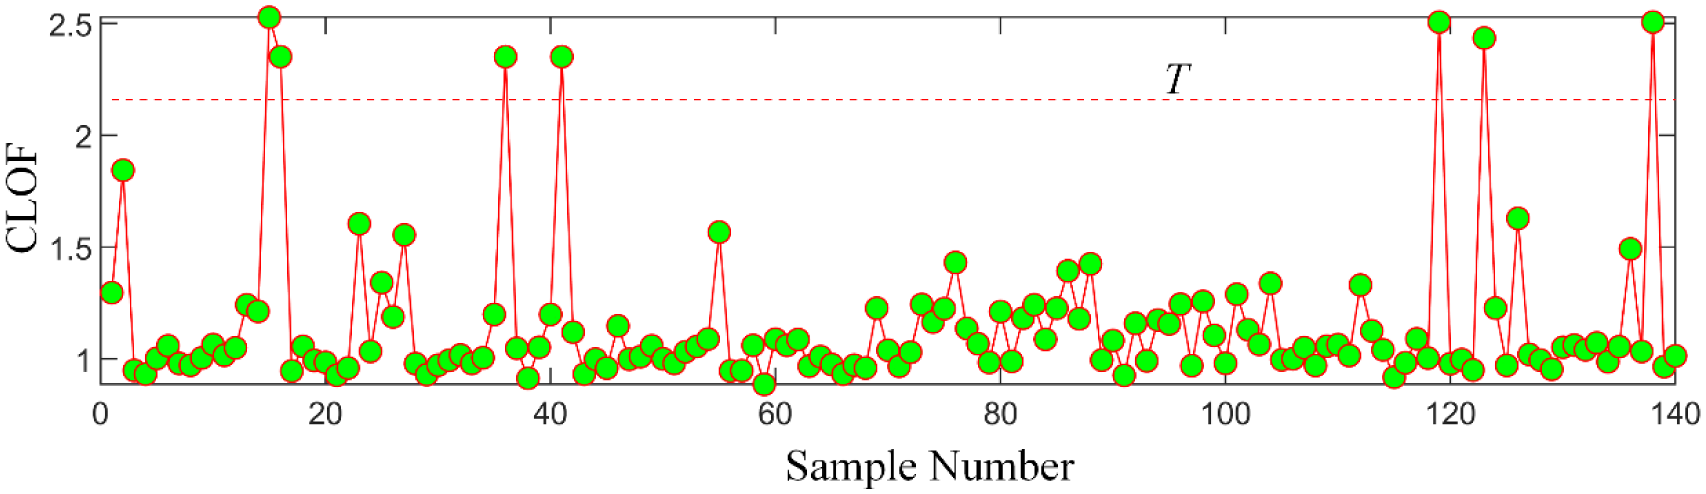
CLOF values of different data samples. CLOF: cluster local outlier factor.
The time-domain waveforms of detected abnormal data of no. 16, 36, 41, 119 are shown in Figure 17. Obviously, there is one drift segment in each waveform of no. 16, 36, 41, while the amplitude of no. 119 is not stable and increase gradually which may be attributed to the fluctuation of wind. Two data samples including no. 123 and 138 are wrongly detected as abnormal data. After deletion of these abnormal data, construct the natural neighbor spectrum again based on the remaining sample data. It can be seen that these data fall into two types. Among one type, there are several labeled data marked using red star, which are corresponding to the driven side fault, while the data of the other type is unknown but should be a different condition type from the driven side fault.
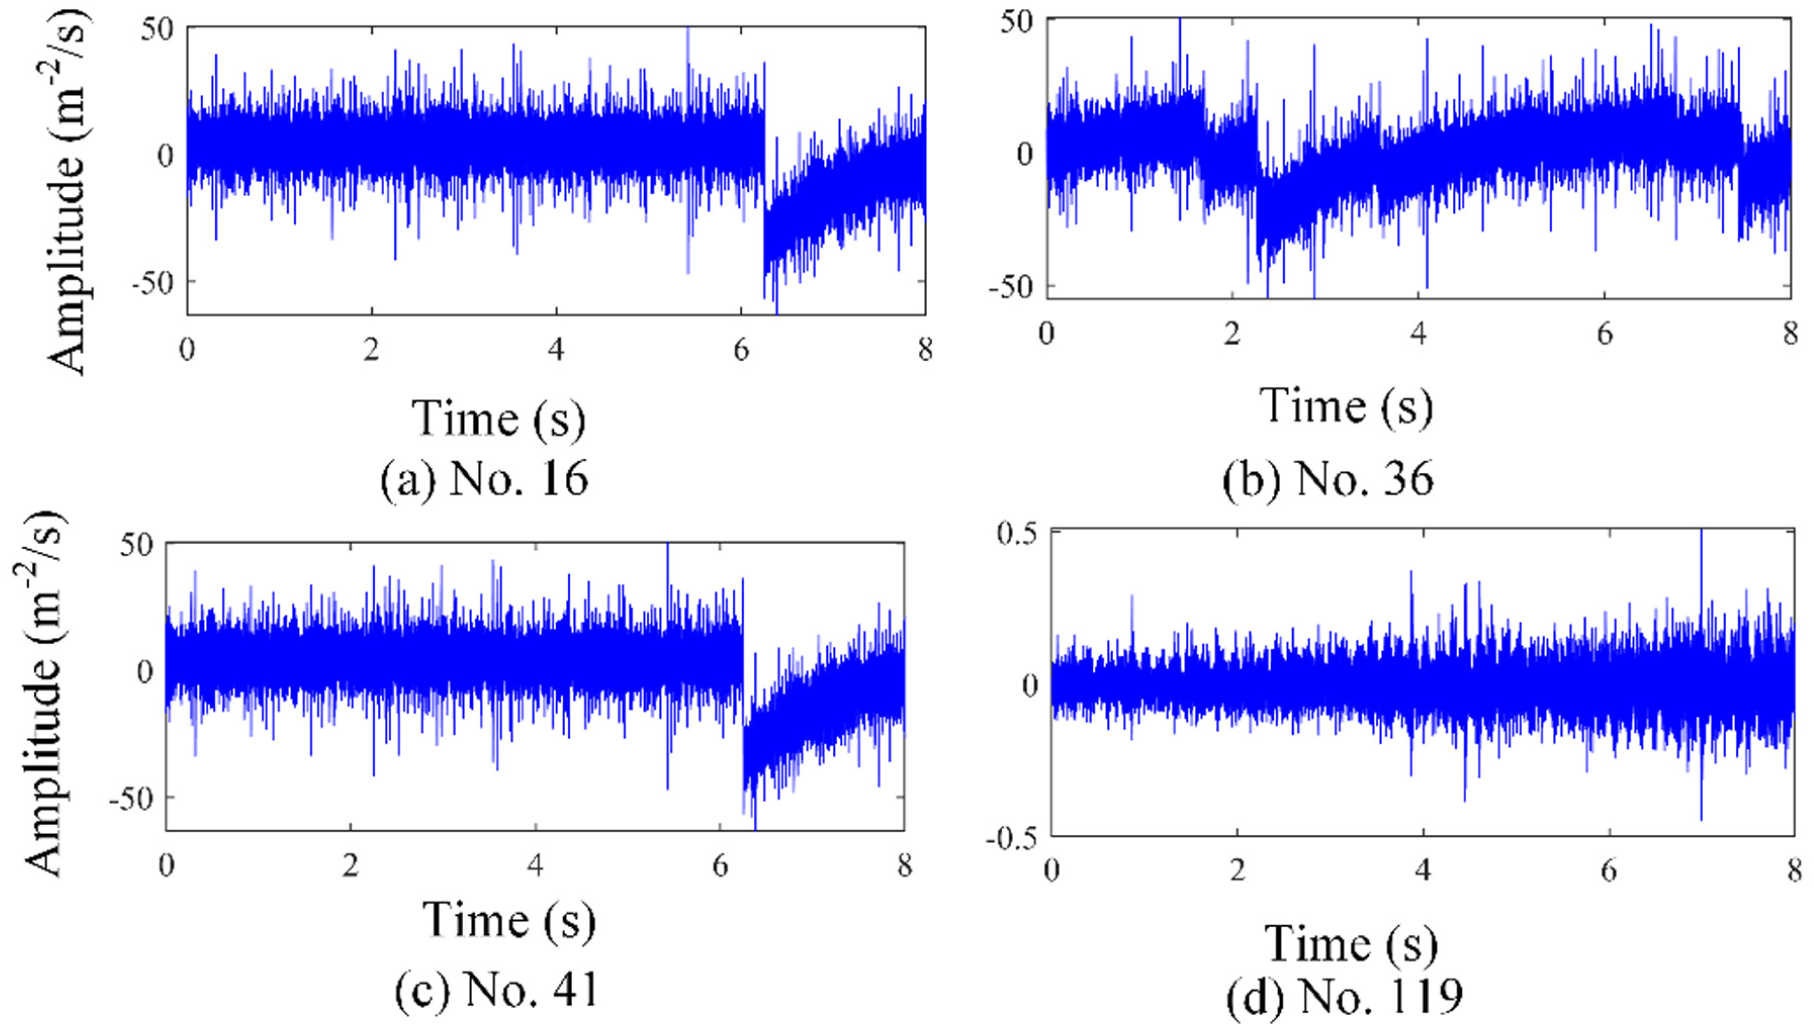
The time-domain waveforms of different data samples: (a) no. 16, (b) no. 36, (c) no. 41, and (d) no. 119.
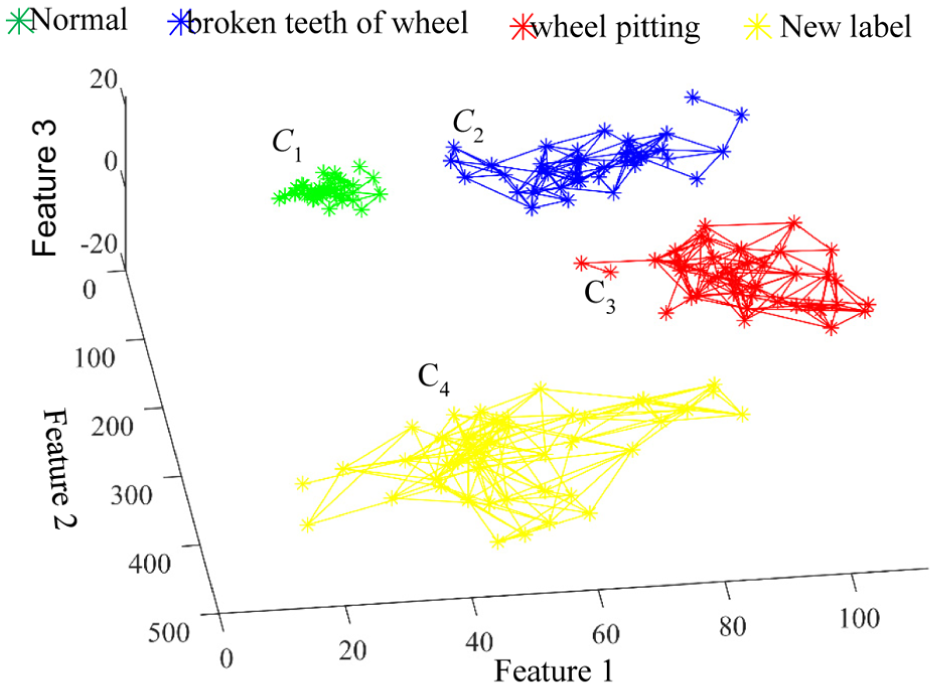
According to the maintenance records, the driven bearing suffered fault from February 25, 2014, to July 3, 2015. Afterwards, the wind turbine was repaired and thus the sampling data can be considered in health condition. In other words, the monitoring data contains two different fault types including driven bearing fault and health condition, which agrees with the detected result using the proposed method. Consequently, the proposed method not only can successfully detect the abnormal data from data with different label types but also can label data according to labeled data (Figure 18).
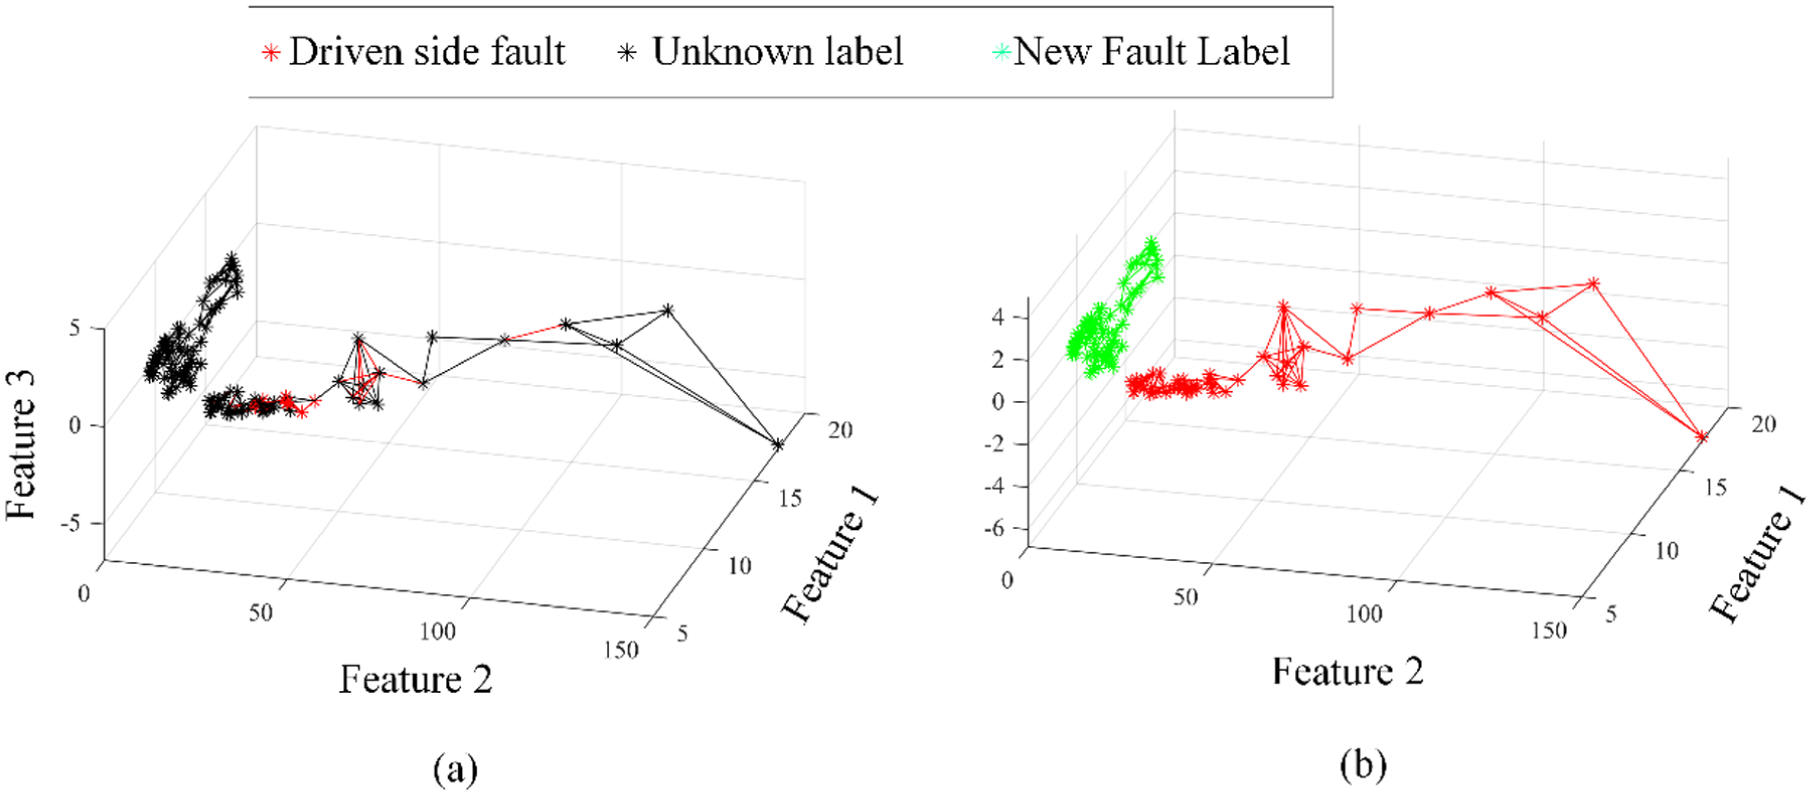
(a) The reconstructed natural neighbor graph after data cleaning and (b) data labeling.
To verify the effectiveness of the proposed method, several advance abnormal data detection and data labeling methods are used for comparison. The results of these comparison methods are shown in Figure 19. DBSCAN has been widely used for data cleaning and thus used to process the wind data. However, compared with the proposed method, which is free of parameters setting, many parameters such as
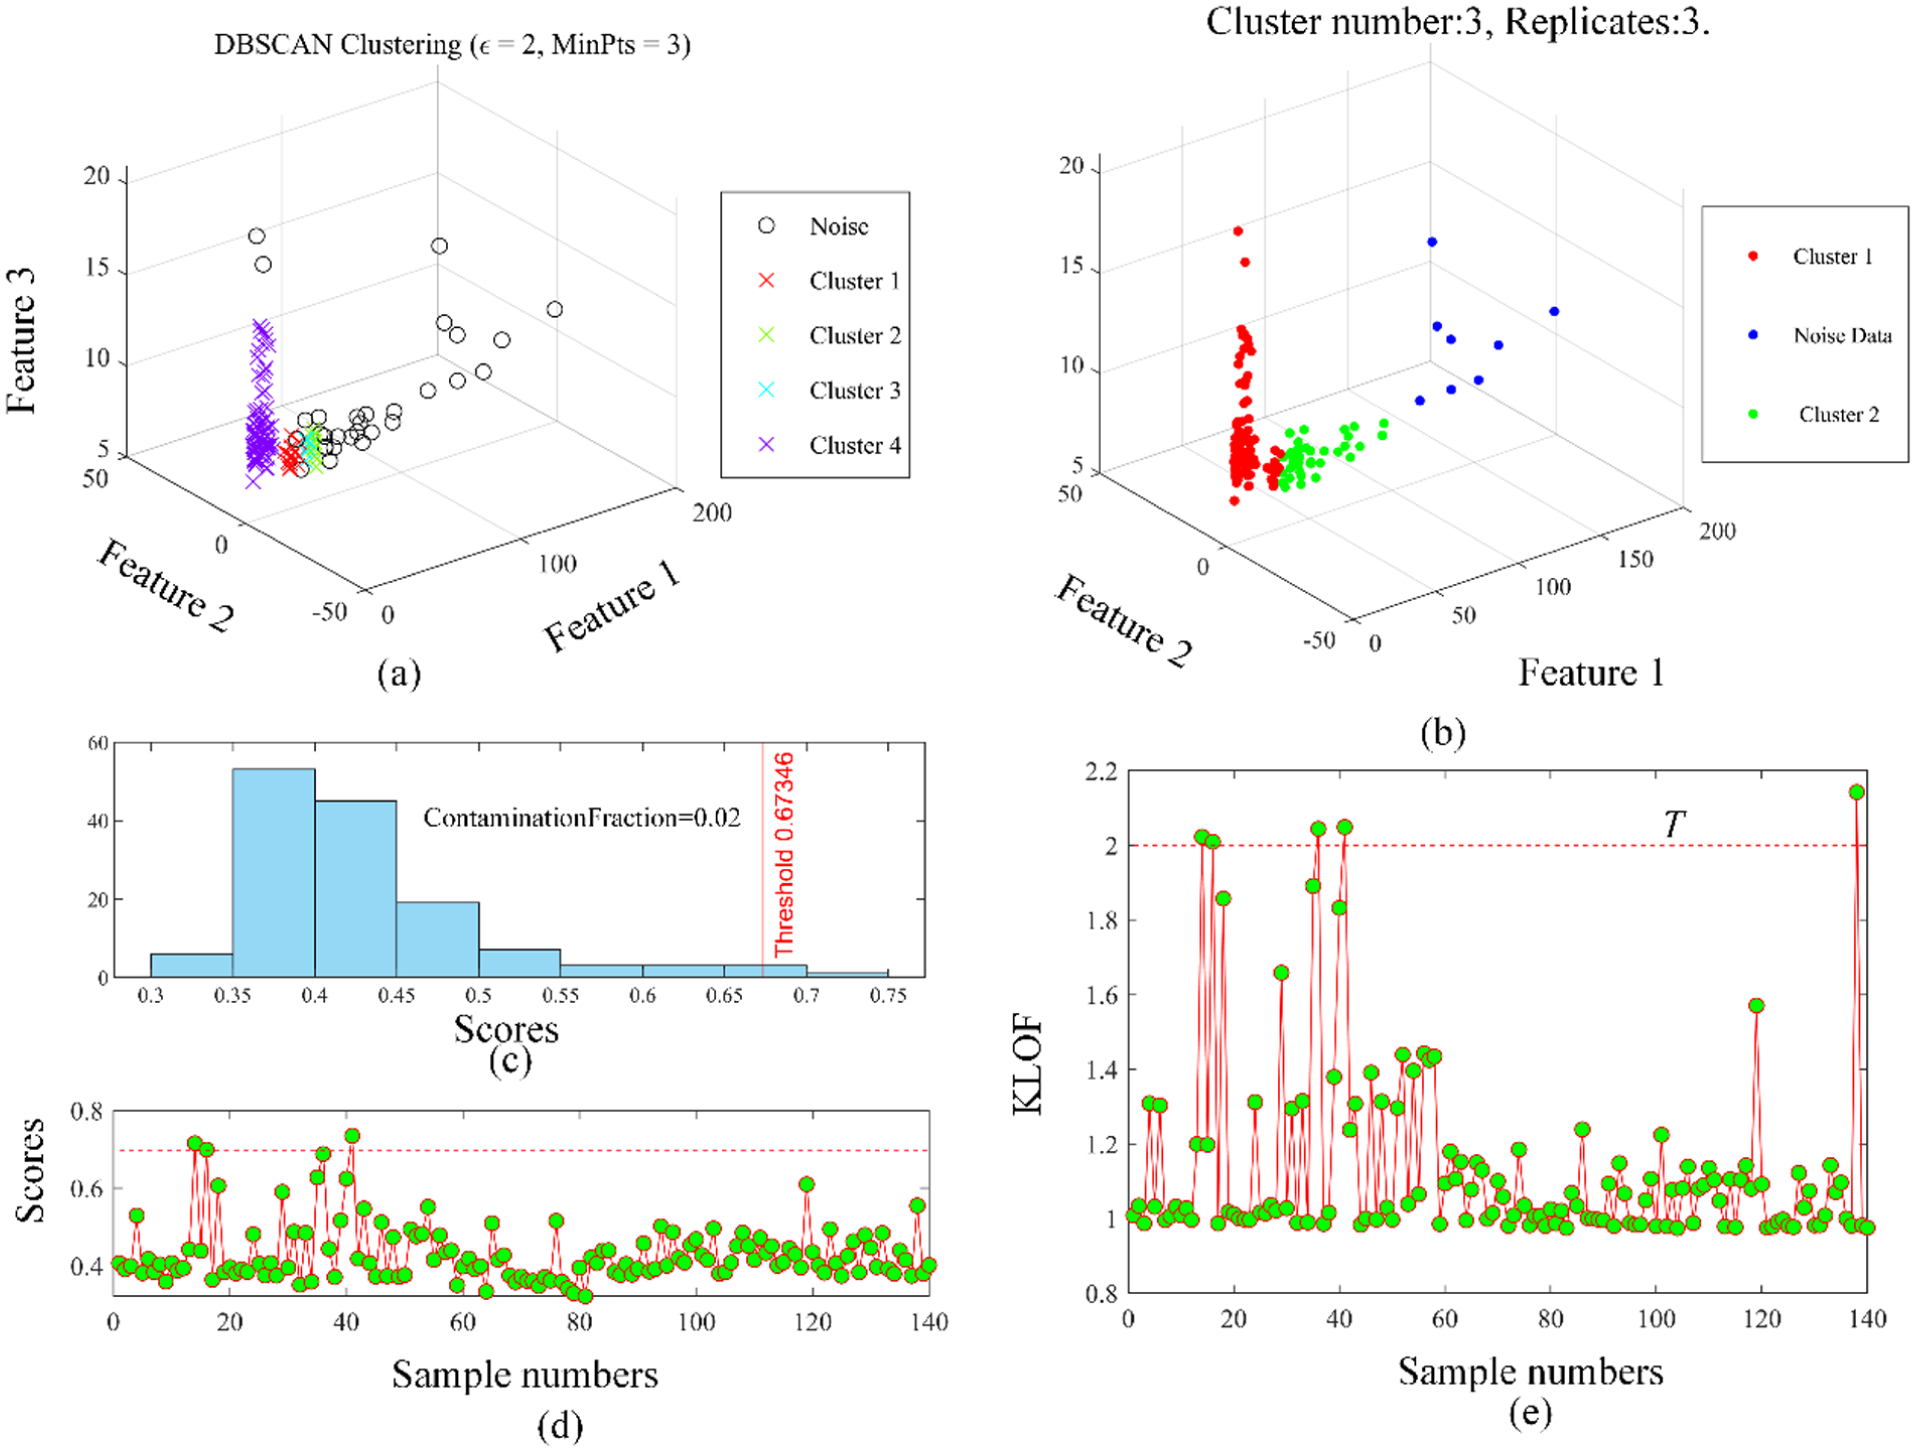
Abnormal data detection and labeling using different methods for a wind turbine: (a) DBSCAN, (b) k-means, (c) isolated forest, and (d) KLOF. DBSCAN: density-based spatial clustering of applications with noise; KLOF: kernel local outlier factor.
The result is displayed in Figure 19(b) and it can be found that the three of four abnormal data samples are successfully detected, while no. 119 is wrongly classified as the normal cluster. Some driven side fault samples are wrongly detected as the same type as the health condition.
Isolated forest 41 and LOF 39 are classic anomaly detection methods and have been used for data cleaning. The results of them are shown in Figure 19(c) and (d), respectively. The contamination fraction is set to be 0.02 for the isolated forest, which assumes that the percentage of abnormal data in the whole data is 2%. Then, the isolated forest method can detect the abnormal data by checking whose fraction is larger than the threshold value. Two data samples, including no. 16, 41 are detected as abnormal data and no. 14 is wrongly detected. In KLOF, four abnormal data samples can be detected and just one, that is, no. 138 are wrongly detected. However, both isolated forest and KLOF can just detect the abnormal data but cannot label data samples with the condition types.
The test results of all the methods are shown in Table 3. Mo denotes the number of the abnormal data samples that are successfully detected by the corresponding methods. M1 represents the number of normal data samples that are wrongly detected as abnormal data. M3 is the accuracy of the data labeled. The proposed method can not only detect all the abnormal data samples but also label the condition type with an accuracy of 98.53. DBSCAN has the largest M1 value, that is, 26, while the number of the other methods are all very small. Thus, the proposed method is superior to the other methods in both abnormal data detection and labeling, which verifies its effectiveness.
The results of abnormal data detection and data labeling using different methods.
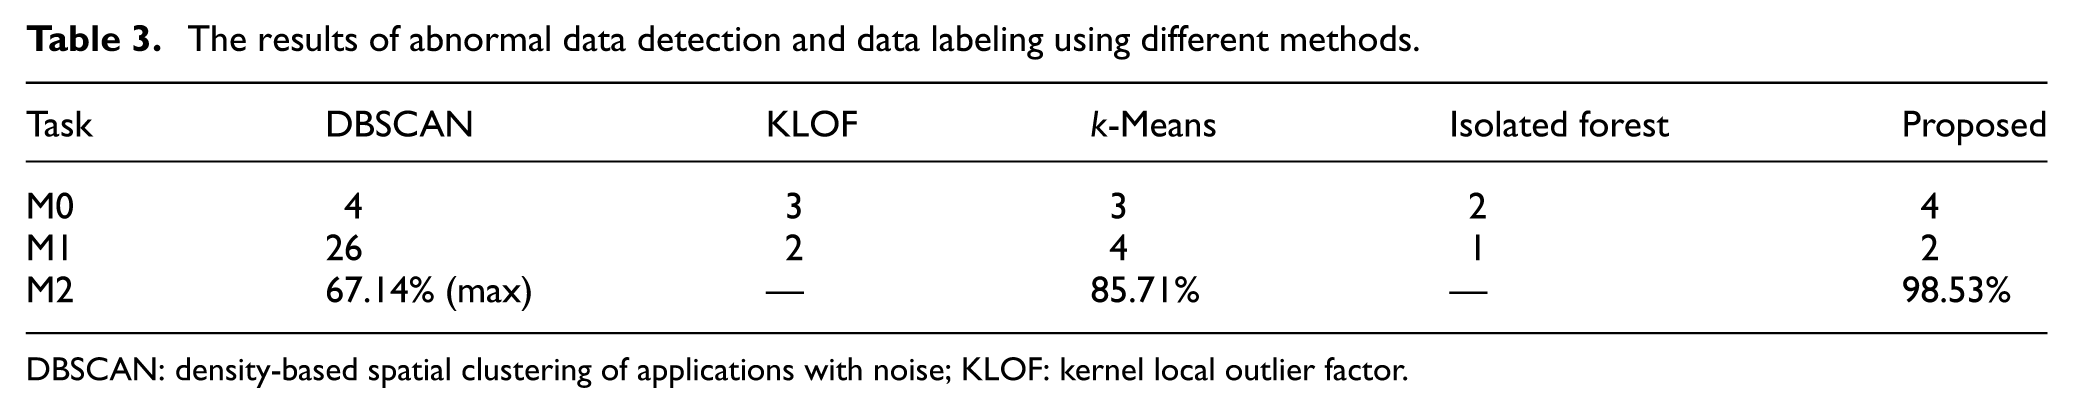
DBSCAN: density-based spatial clustering of applications with noise; KLOF: kernel local outlier factor.
Quality assurance of label data for centrifugal pump
Centrifugal pumps are widely used in many industrial fields, such as nuclear power, petrochemical, thermal power, and play a vital role in such fields. Many researchers have done much research on fault diagnosis of centrifugal pumps and how to improve the data quality of centrifugal pumps has always been an important topic. As shown in Figure 20, the electrical motor drives the centrifugal pump, and between them, one roller element bearing supports the rotation axis. The water is driven from the import to the circulating water tank. One sensor is installed on the bearing house to monitor its condition.
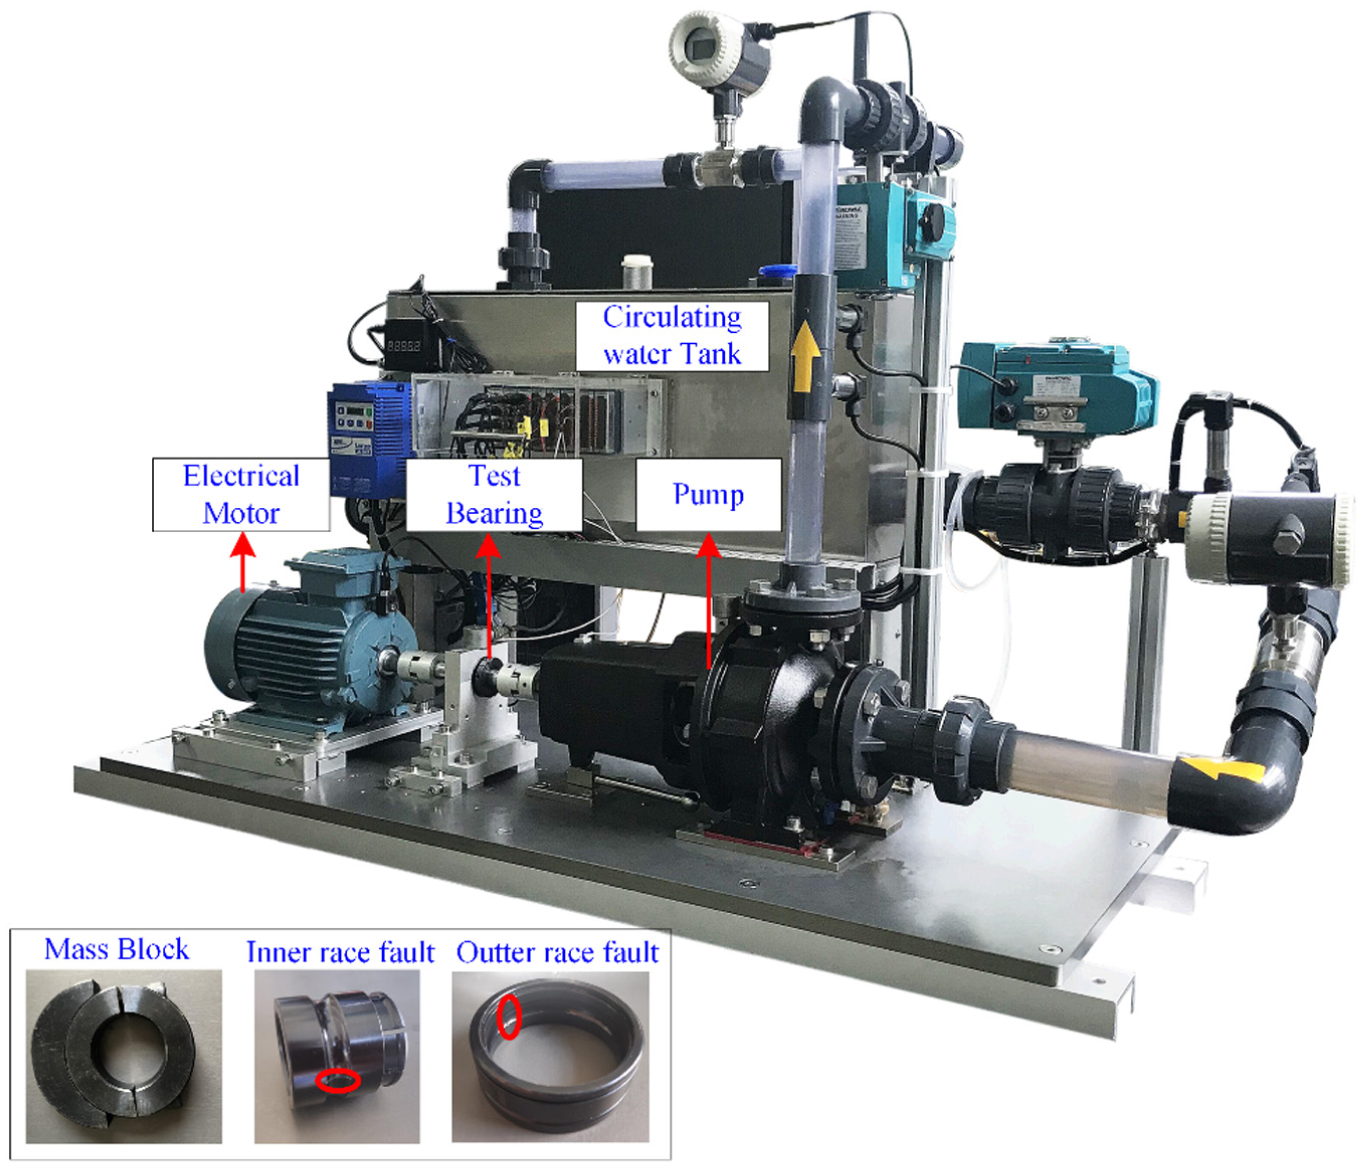
The centrifugal pump experiment platform.
Four condition types, including unbalanced fault induced by fixing one mass block on the rotary axis, inner race fault, outer race fault, and health condition, were considered, and the corresponding data were collected. Twenty data samples of the whole condition are randomly selected as the known fault labels.
To simulate the external disturbance, one hammer was used to knock the test bench and the corresponding condition type was outer race fault. Totally, there are 10 data samples that are abnormal data generated by knocking the bench. Obviously, data with different label type enhance the difficulty of the disturbance data detection. The proposed method is then applied to these data for detecting the abnormal data. First, the natural neighbor spectrum is constructed and shown in Figure 21. It can be seen that these data fall into five clusters, and the data samples denoted by a black star need to be labeled. The fault type of the other samples is described by a different color.
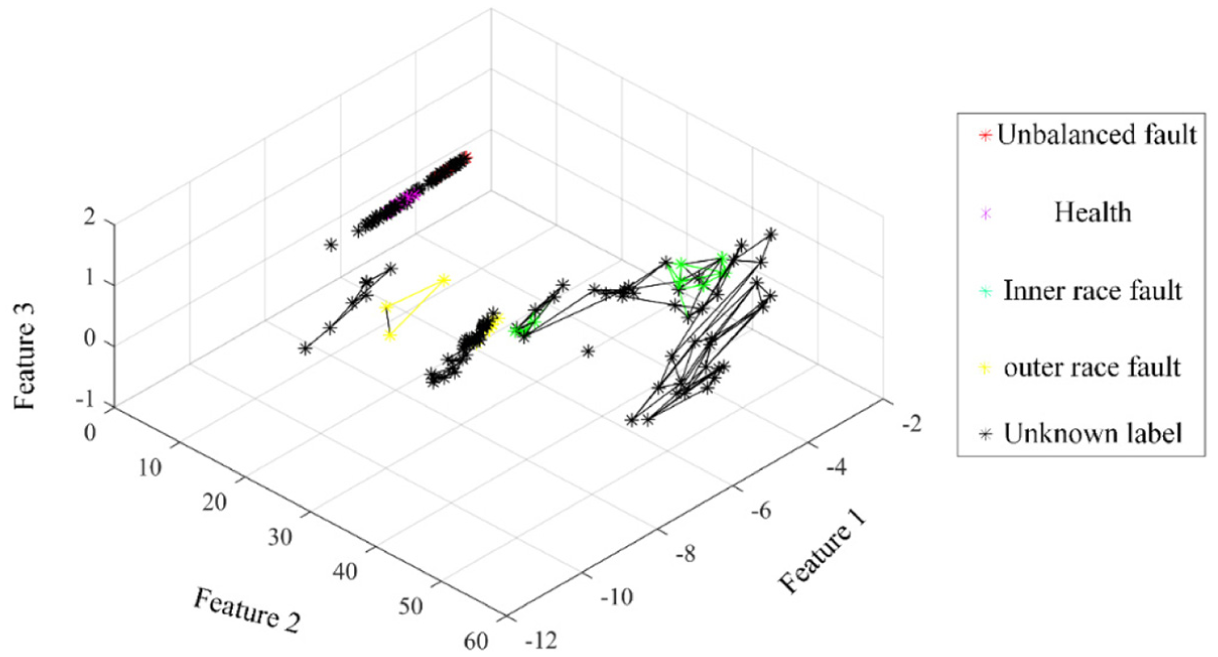
The natural neighbor graph of the whole monitoring data.
The CLOF contour is then calculated and shown in Figure 22. As shown in Figure 23, the data whose KCLOF values are larger than threshold values are detected as the disturbance data. After the data cleaning of the first iteration, the remaining data is then continuously input into the proposed method for iteration until all the KCLOF are smaller than the threshold value. After two rounds of iteration, no more abnormal data can be detected.
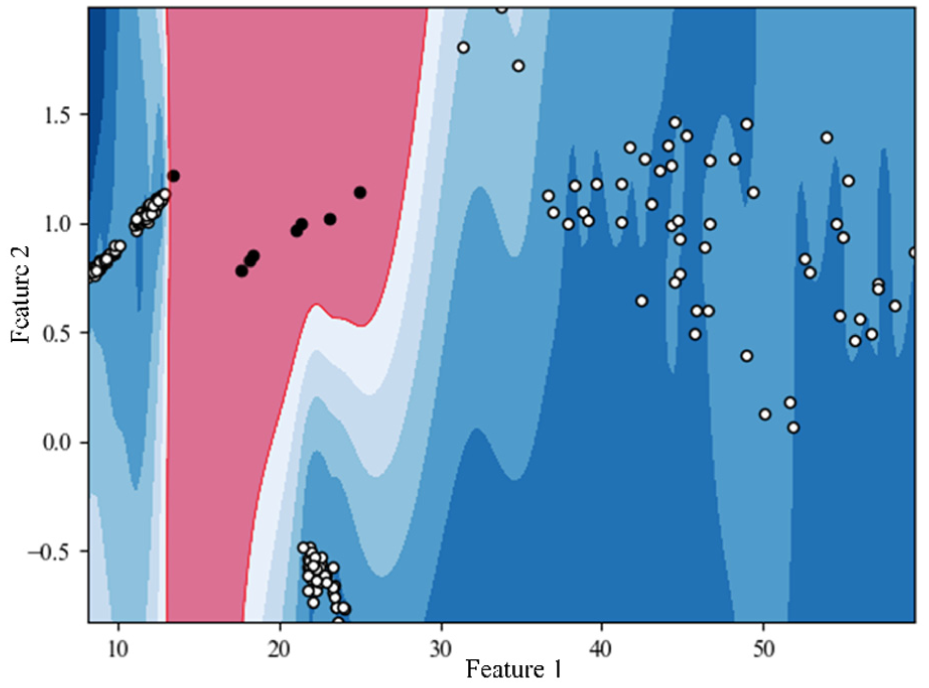
The CLOF contour of the whole data. CLOF: cluster local outlier factor.
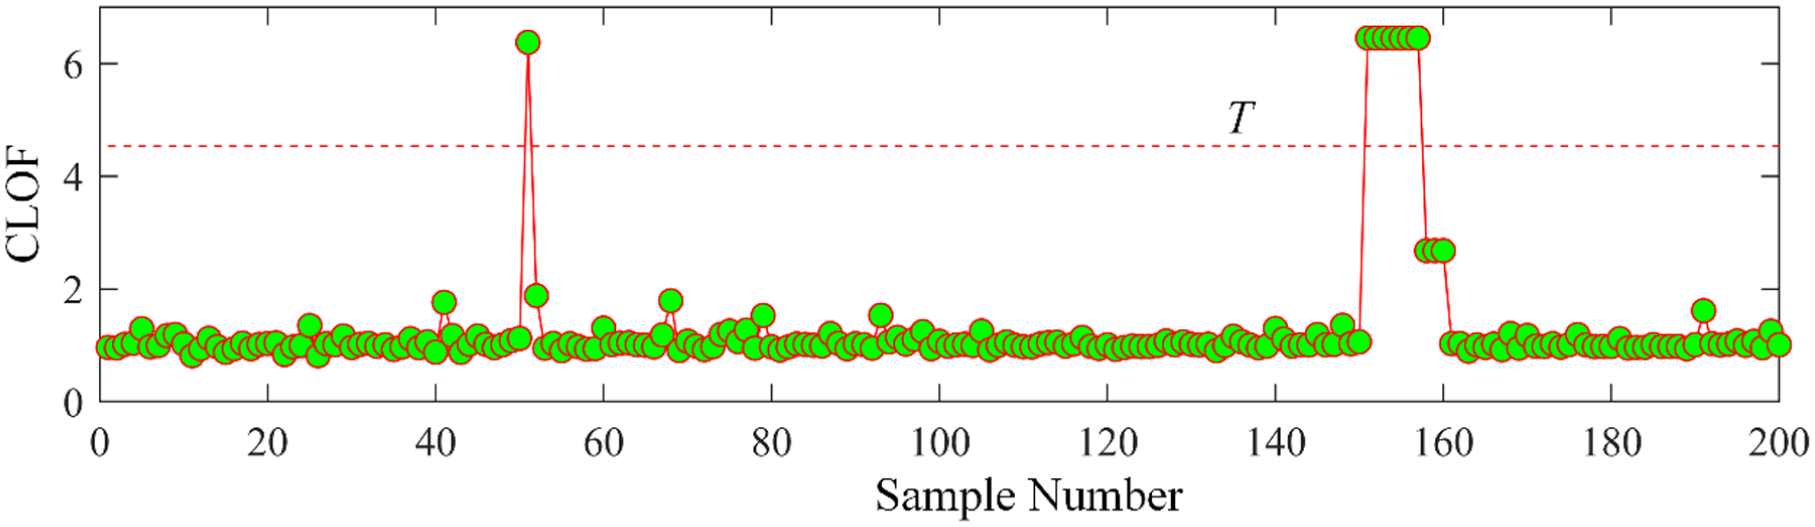
CLOF values of different data samples. CLOF: cluster local outlier factor.
Finally, nine abnormal data samples from no. 151 to 159 are successfully detected. Also, no. 51 and 149 are wrongly detected. The time-domain waveforms of two detected data, including no. 154, 156 are shown in Figure 24, respectively, and two normal data including no. 145, 148 are also displayed for comparison.
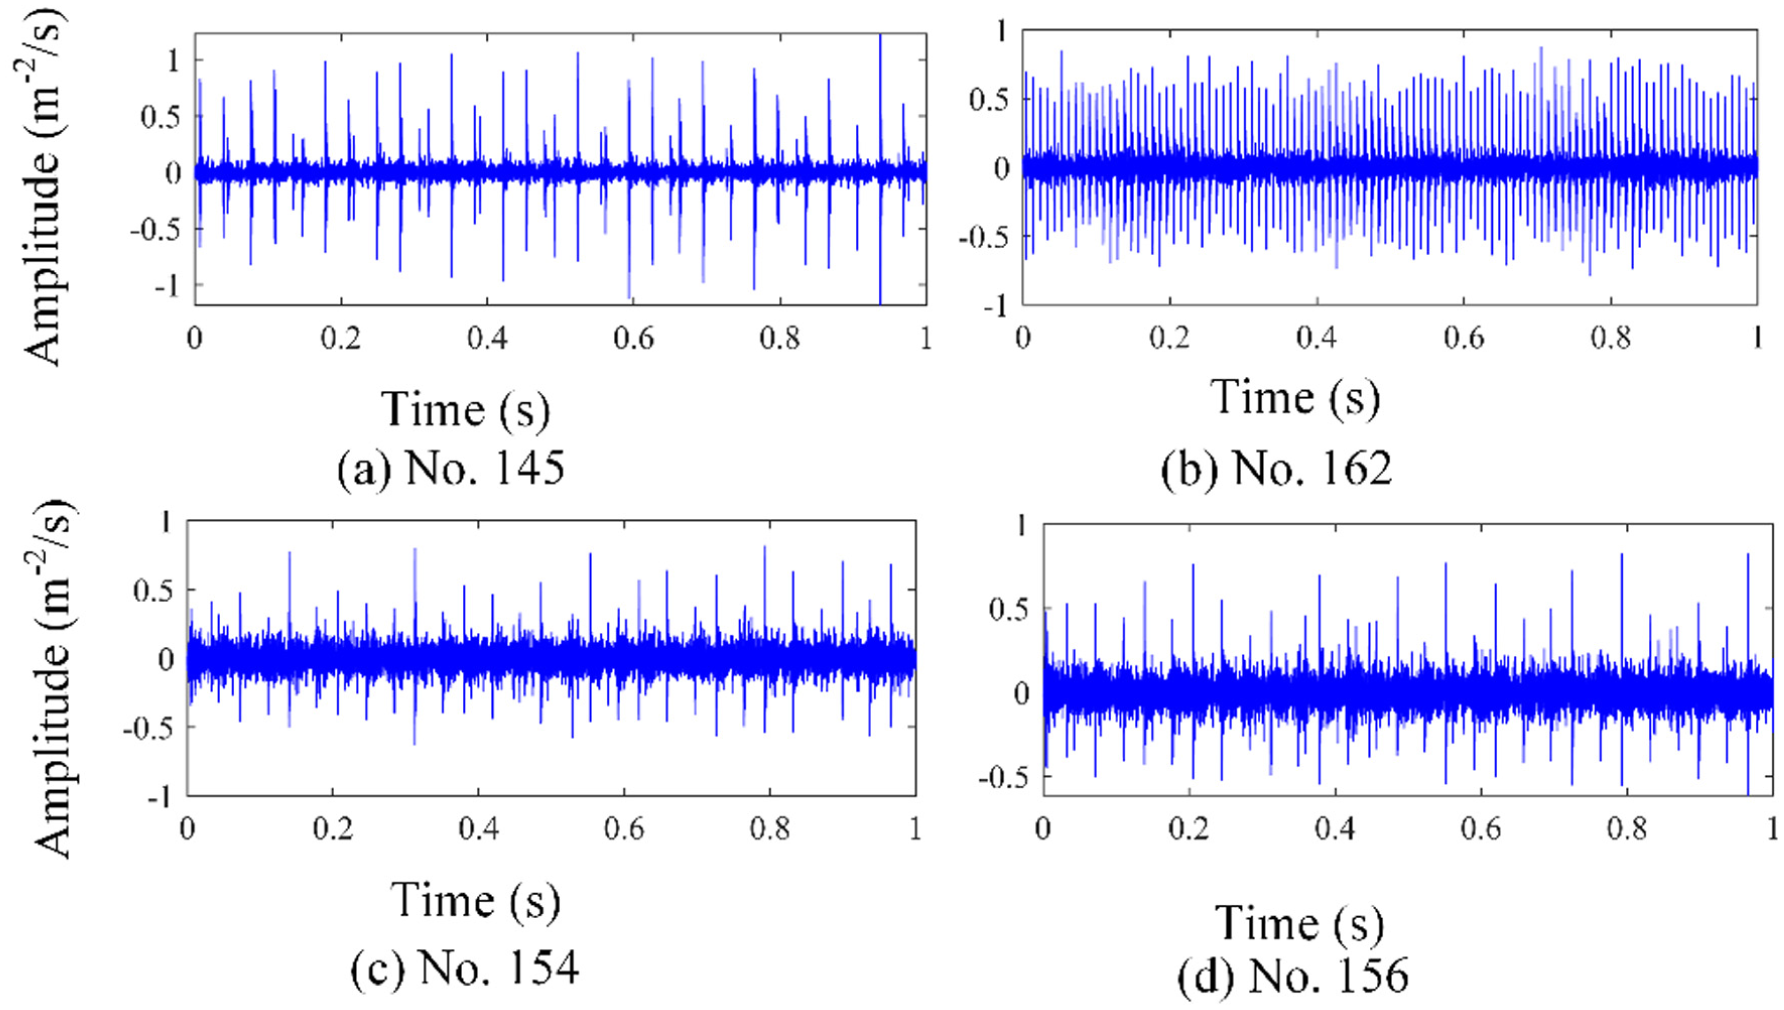
The time-domain waveforms of different data samples: (a) no. 145, (b) no. 162, (c) no. 154, and (d) no. 156.
Then these abnormal data are cleaned, and the reconstructed natural neighbor spectrum is shown in Figure 25. These data with four condition type falls into four clusters as shown in Figure 25(a). Then, through the spectrum relationship between the known and unknown label data sample, we can infer what types of the unknown label data samples. The final data labeling result is shown in Figure 25(b), and all the data samples are labeled accurately.
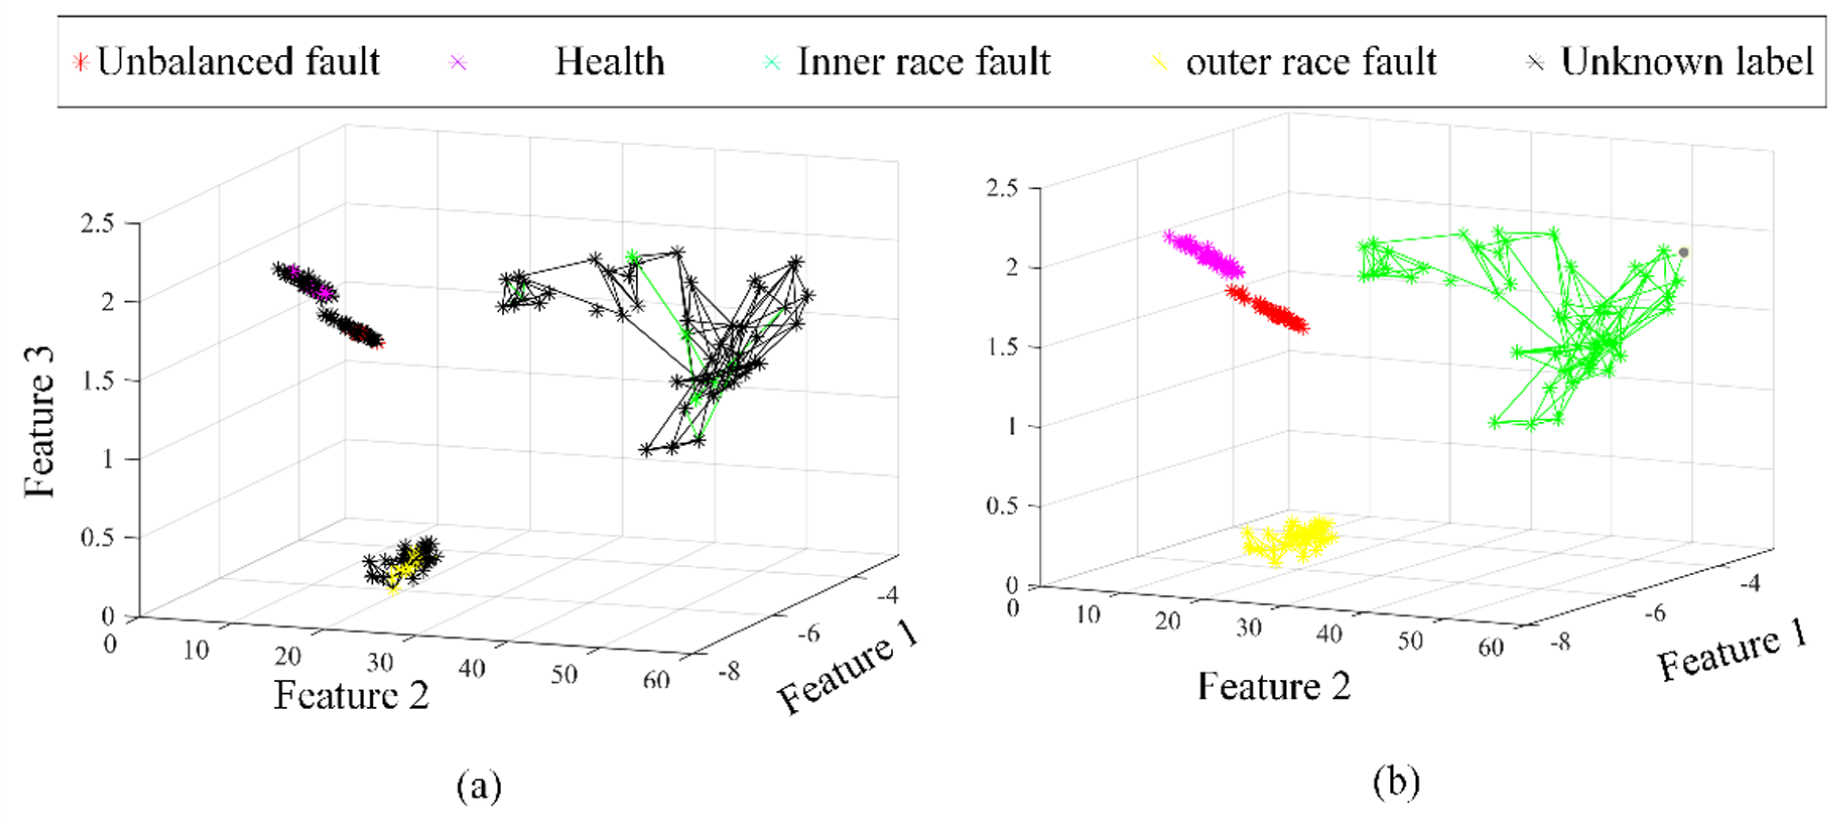
(a) The reconstructed natural neighbor graph after data cleaning and (b) the data labeling result.
Then, four methods are also used to process the vibration data collected from the centrifugal pump for comparison. Figure 26 present detecting results of these methods. As statistically calculated in Table 4, for DBSCAN, seven abnormal data are detected, while two data samples are wrongly detected. The maximum labeling accuracy of DBSCAN is 63.53. k-Means also gives an unsatisfactory result that three samples of abnormal data are successfully detected, while eight data samples are wrongly detected. k-Means also achieves the lowest labeling accuracy, just 60.53%, far below that of the proposed method, that is, 98.2%. Furthermore, nine abnormal data samples are successfully detected by the proposed method and just two data samples are wrongly detected as abnormal data, which also holds great advantages over all the compared methods. Therefore, the data quality can be assurance to a great extent by using the proposed method for data cleaning and labeling.
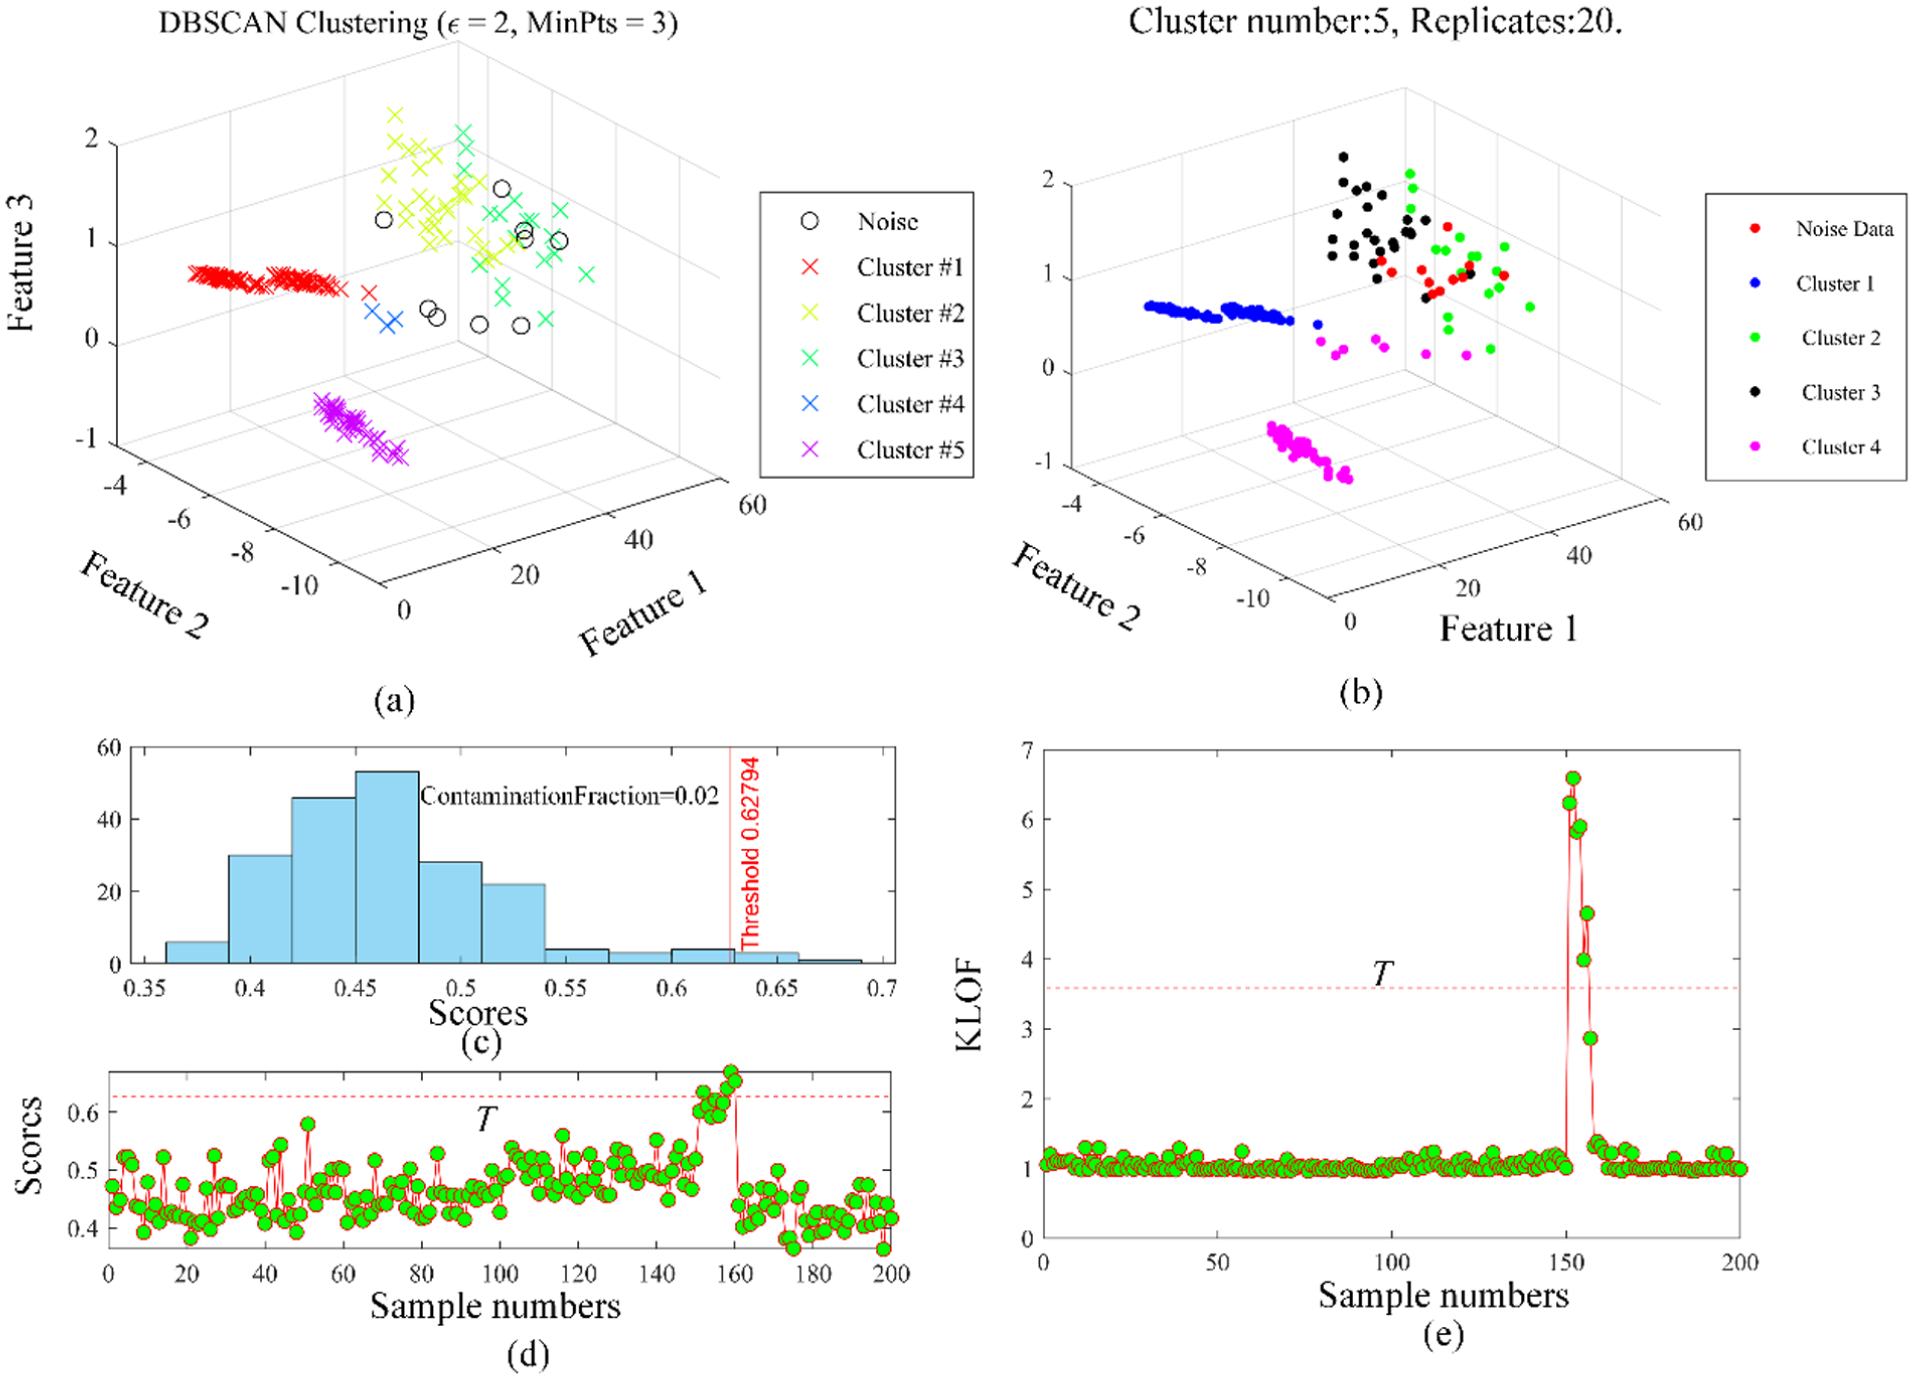
Abnormal data detection and labeling using different methods for a centrifugal pump: (a) DBSCAN, (b) k-means, (c) isolated forest and (d) KLOF. DBSCAN: density-based spatial clustering of applications with noise; KLOF: kernel local outlier factor.
The results of abnormal data detection and data labeling using different methods
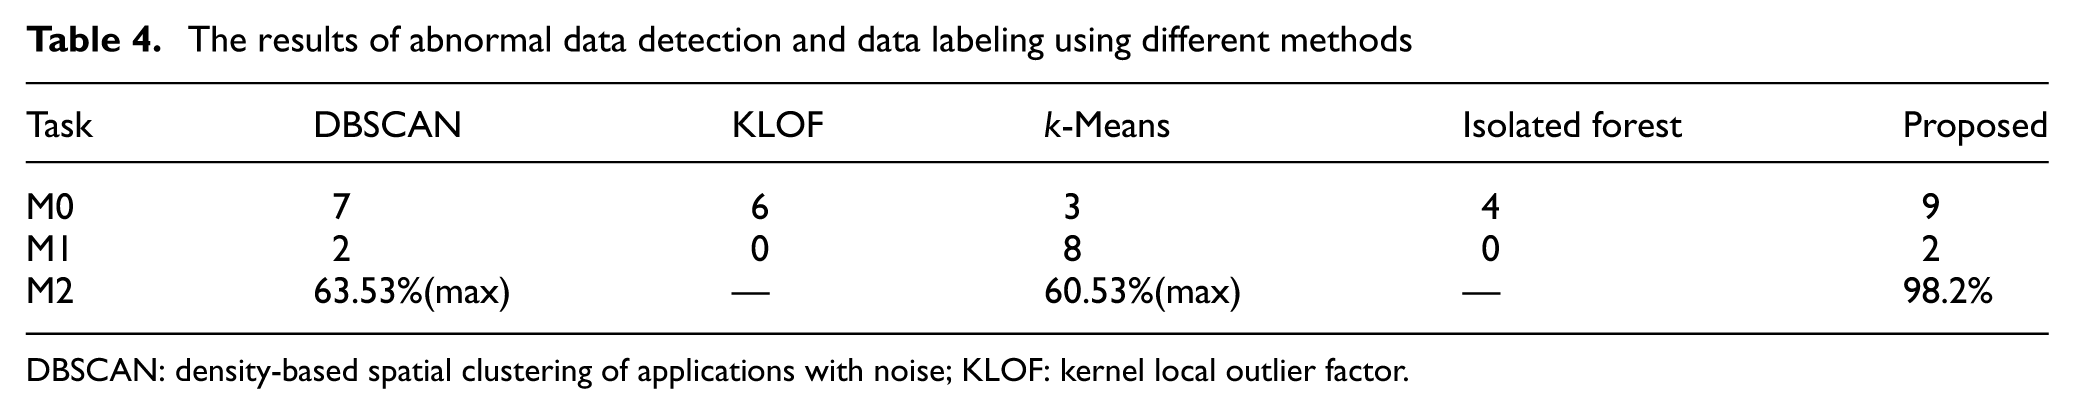
DBSCAN: density-based spatial clustering of applications with noise; KLOF: kernel local outlier factor.
Conclusions
A natural neighbor-based approach is proposed in this paper to enhance the quality of label data. In this method, the neighbor spectrum is constructed to establish the relationship among different data samples. Different clusters are searched based on the relationship, and CLOF is able to evaluate the quality degree of these clusters. By searching the labeled data relevant to the object data in the natural neighbor graph, the abnormal clusters can be cleaned, and the fault types of the unknown data can be decided by searching the labeled data that is relevant to the object data in the natural neighbor graph. Among data with different labels, the effectiveness of the proposed method in detecting abnormal data is verified by the experimental data collected from a gear, wind turbine, and Pump. Moreover, the proposed method can assist in labeling unknown data. Because feature extraction is an important stage and greatly influences the effect of data labeling, construction of more robust feature indicators will be considered further in our future work.
Footnotes
Declaration of conflicting interests
The authors declared no potential conflicts of interest with respect to the research, authorship, and/or publication of this article.
Funding
The authors disclosed receipt of the following financial support for the research, authorship, and/or publication of this article: This research is supported by National Natural Science Foundation of China (62403406), Natural Science Foundation of Hebei Province (F2025203081), Open Fund (OGE202302-13) of Key Laboratory of Oil & Gas Equipment, Ministry of Education (Southwest Petroleum University), and China Scholarship Council Program under Project 202408130110.