
Abstract
Damage detection based on bridge responses under moving loads has garnered significant attention due to its ability to eliminate the need for costly excitation equipment. However, current methods in this field often require the measurement or identification of moving loads, adding complexity to the process. While the transmissibility function (TF) is promising for damage detection in properly handling the input, the understanding of TF properties under moving loads remains limited, impeding its full potential. To bridge the gap, this study proposes a novel approach that combines the physical properties of TF with the probabilistic feature extraction capabilities of the variational autoencoder (VAE) for bridge anomaly detection under moving loads. The finite element solution of TF under moving loads has been analytically derived, revealing that TF is independent of unknown input spectra and characterized by the frequency response functions of the beam and the Fourier transforms of elemental shape functions. Leveraging TF under moving loads as an effective damage indicator, a VAE model extracts low-dimensional probabilistic features from multiple TFs across a frequency band, facilitating a more efficient formulation of probabilistic distances as input-independent anomaly scores. The Kullback–Leibler divergence between the input-independent features under the baseline condition and those under potential damage scenarios, measuring the dissimilarity of probability distributions across different states, is computed as a damage index to detect the existence of structural damage. Furthermore, the application of extreme value theory aids in establishing a decision threshold for anomaly detection by harnessing the inherent advantages of modeling the tail behavior of extreme events more accurately, thereby improving the accuracy of damage detection while minimizing false positives. The effectiveness of this method is validated through numerical simulations on a simply supported beam and experimental studies on a two-span continuous beam, showcasing its potential for practical damage detection applications.
Keywords
Introduction
Bridges are critical components of transportation infrastructure, but they inevitably experience damage over time. Monitoring their structural condition is essential for timely maintenance and extending their service life. To meet this need, extensive research has focused on damage identification techniques, with vibration-based methods gaining particular recognition for their effectiveness and practicality. 1 However, under operational conditions, bridges are exposed to ambient excitations such as traffic, wind, and ocean waves, complicating the direct measurement or identification of input forces, a limitation of many traditional vibration-based methods. To address this limitation, output-only vibration-based methods have been developed, relying solely on structural responses to detect damage. 2
The transmissibility function (TF), a mathematical representation that describes the output-output relationship of a structure in the frequency domain, has emerged as a promising damage-sensitive feature for damage detection.3,4 With the advantage of not requiring input measurement or imposing stringent assumptions on the input, the TF has demonstrated its sensitivity to damage5,6 and robustness against the influences of input variations.7,8 Various TF-based damage detection methods have been explored. By integrating the difference between the TFs of intact and damaged structures over the frequency band of interest, a TF damage indicator was proposed to detect the elastic modulus reduction in a metro tunnel. 9 By subtracting the TFs computed between consecutive locations under intact and damaged structures, a TF index was constructed to detect mass changes or stiffness loss in a shear-building model. 10 Inspired by the modal assurance criterion, a TF-based Response Vector Assurance Criterion indicator was developed to detect cuts in a beam. 11 This indicator was later extended to identify elastic modulus reduction in a bridge subjected to moving vehicles. 12 In addition, a Generalized Transmissibility Damage Indicator and a wavelet energy TF were proposed to assess the condition of wind turbines.13,14 Beyond these indicators, the TF has been combined with other techniques. For instance, a TF-based autoregressive model with exogenous excitations was introduced for damage detection in a composite beam under varying environmental and operational conditions.15,16 Probabilistic models have also been developed to quantify uncertainties associated with TFs,17–20 leading to the formulation of statistical damage detection methods capable of addressing multiple uncertainties.21–24
Recently, TF-based damage detection methods have advanced through the integration of deep learning.25–29 With its strengths in information fusion and pattern recognition, 30 deep learning enables the automatic extraction of crucial features from TF data and transforms damage detection into a pattern recognition task. Supervised approaches, such as Capsule neural networks25,26 and convolutional neural networks,27,28 have been successfully applied to TF data for damage localization and quantification. In addition, an element-wise parallel deep learning scheme has been proposed to perform distributed damage diagnosis using TF data. 29 Despite these advancements, a major challenge remains—the scarcity of labeled data across diverse damage scenarios, which is critical for effectively training supervised models. To address this limitation, unsupervised deep learning has emerged as a viable alternative, eliminating the dependency on extensive labeled datasets. Among these, variational autoencoders (VAEs) have demonstrated strong potential for developing anomaly detection methods by extracting probabilistic features from data in an unsupervised manner.31,32 By learning the normal patterns inherent in the data, VAEs can identify deviations indicative of potential damage, providing a flexible and practical approach to damage detection. 33
Extracting damage-sensitive features from bridge responses induced by moving loads has recently attracted considerable attention.34–36 These responses are typically more pronounced than those from ambient vibrations, making them particularly advantageous for damage detection in short- and medium-span bridges. 37 Moreover, using moving loads as excitation sources offers a practical and cost-effective alternative to specialized equipment such as shakers. Recent studies38–40 have applied unsupervised deep learning to extract features from acceleration responses induced by moving loads, showing promise for bridge condition assessment. However, structural responses are influenced not only by the properties of the bridge but also by the characteristics of the moving loads, such as axle spacing and weight. This dependency necessitates building an extensive dataset of structural responses under various load scenarios to train deep learning models effectively and enhance their generalization capabilities. The variability introduced by moving loads presents a challenge in constructing such datasets, posing a key obstacle to the widespread adoption of these methods.
While the TF is promising for damage detection due to its advantage of handling input variations, its fundamental properties under moving loads remain underexplored, limiting its application in this critical scenario. Meanwhile, prevailing data-driven paradigms face two significant hurdles: unsupervised learning methods based directly on accelerations require extensive datasets under varied loading conditions, while TF-based supervised learning approaches are constrained by the scarcity of labeled damage data. To bridge these gaps, this study proposes a novel physics-informed unsupervised framework that synergistically combines the theoretical properties of TFs under moving loads with the probabilistic feature extraction capability of the VAE. The schematic view of the proposed method is shown in Figure 1, and the major scientific contributions can be summarized as follows:
Compared to research focused on TFs under a fixed input or ambient excitations, an analytical finite element (FE) solution for TFs of beam-like structures under moving loads is derived in this study. The solution reveals that TFs under moving loads are independent of unknown input spectra and are characterized by the frequency response functions (FRFs) of the beam and the Fourier transforms (FTs) of the elemental shape functions.
An input-independent probabilistic feature distance measure is developed as an anomaly score by synergistically combining the input independence of TFs with the probabilistic feature extraction capability of a VAE model. Specifically, the Kullback–Leibler (KL) divergence between input-independent features under the baseline condition and those under potential damage scenarios, measuring the dissimilarity of probability distributions across different states, is computed as a damage index to detect the existence of structural damage.
An anomaly detection threshold is determined using extreme value theory (EVT) to improve detection accuracy and reduce false positives. Compared to traditional statistical methods, EVT provides a more precise estimation of extreme values and tail probabilities by accurately modeling the behavior of extreme events, making it particularly beneficial for tasks involving rare events such as anomaly detection.
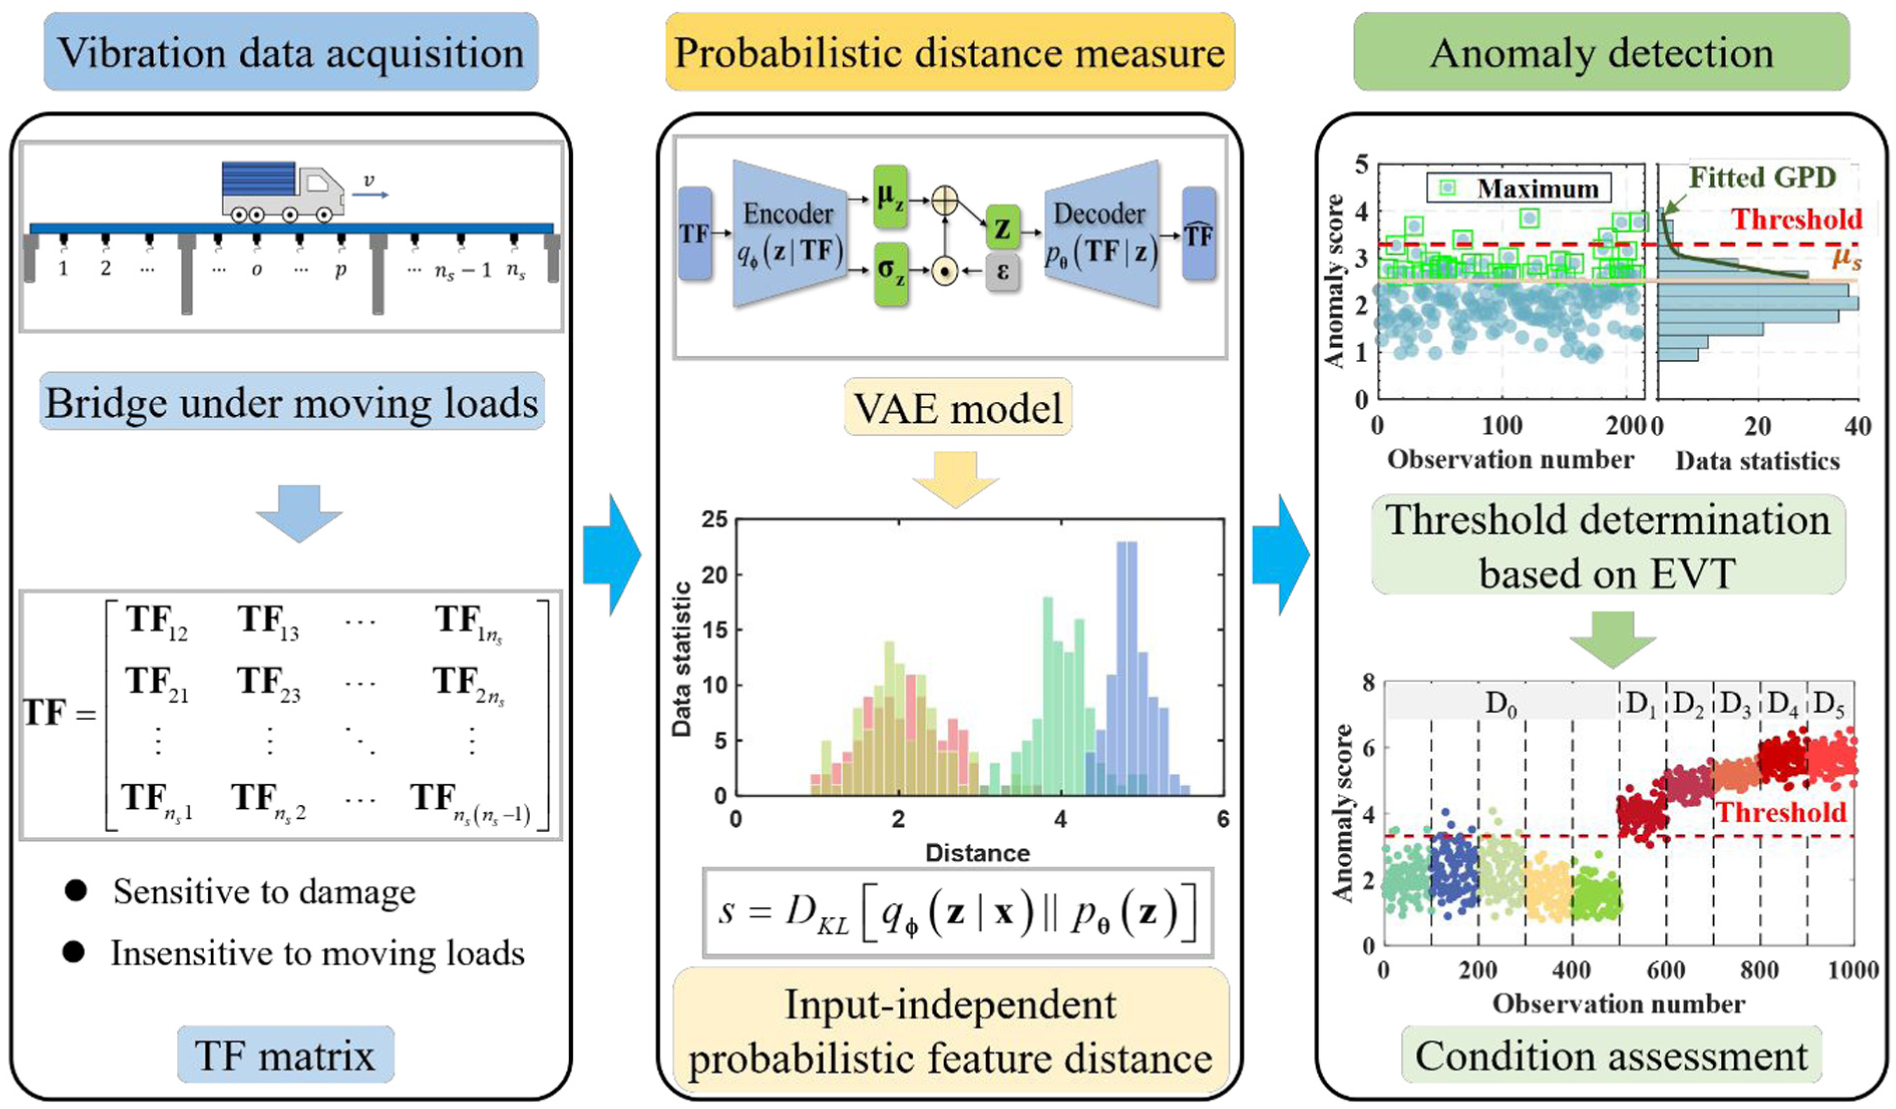
Schematic view of the method proposed in this study.
TFs for beam-like structures under moving loads
This section presents the analytical FE solution for TFs under moving loads and elucidates their fundamental yet previously underexplored properties, thereby extending their applicability beyond traditional fixed or ambient excitations and providing a rigorous physics-based foundation for their use as damage-sensitive features under moving loads.
FE model of a beam under moving loads
Assume that a bridge subjected to a moving vehicle is simplified to an Euler–Bernoulli beam under
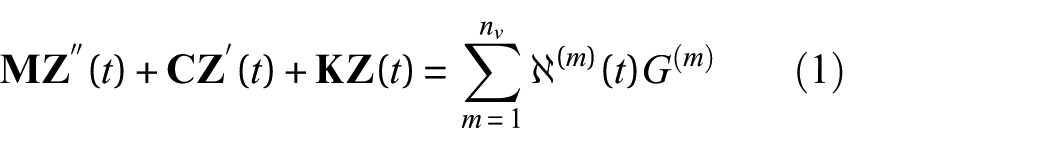
where
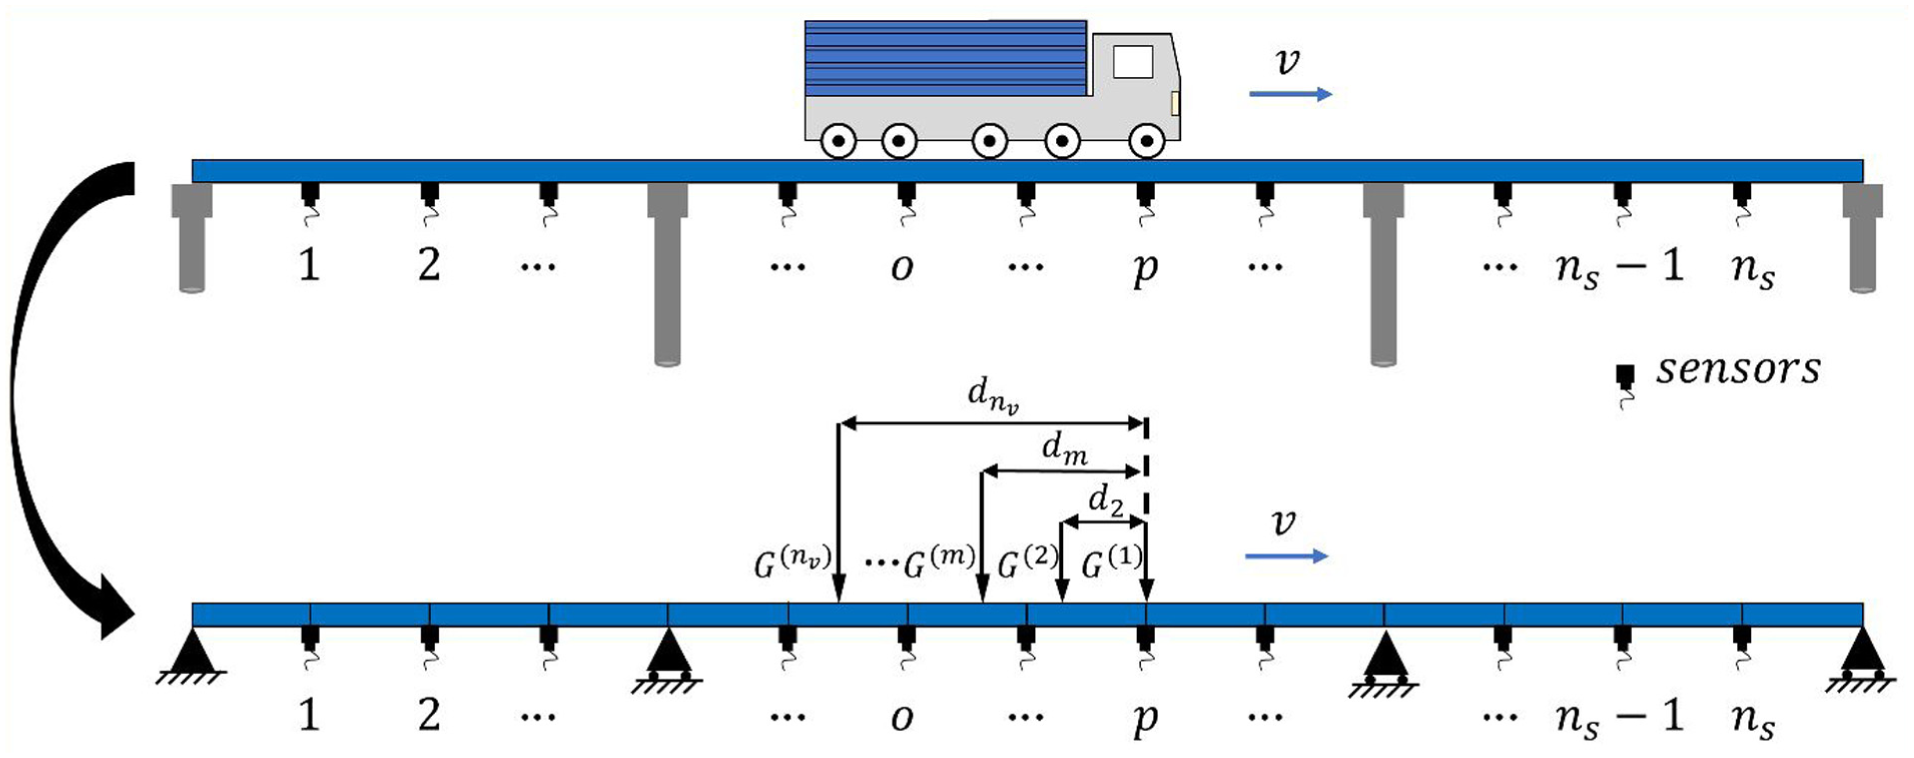
Schematic diagram of FE model of a beam under moving loads. FE: finite element.
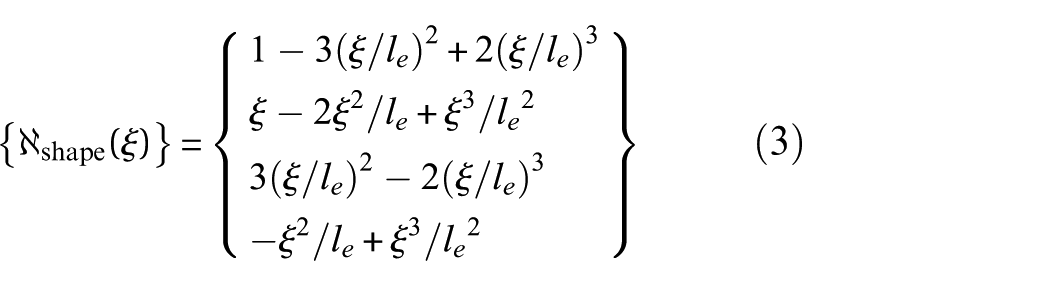
In the equivalent nodal load vector,
where
where
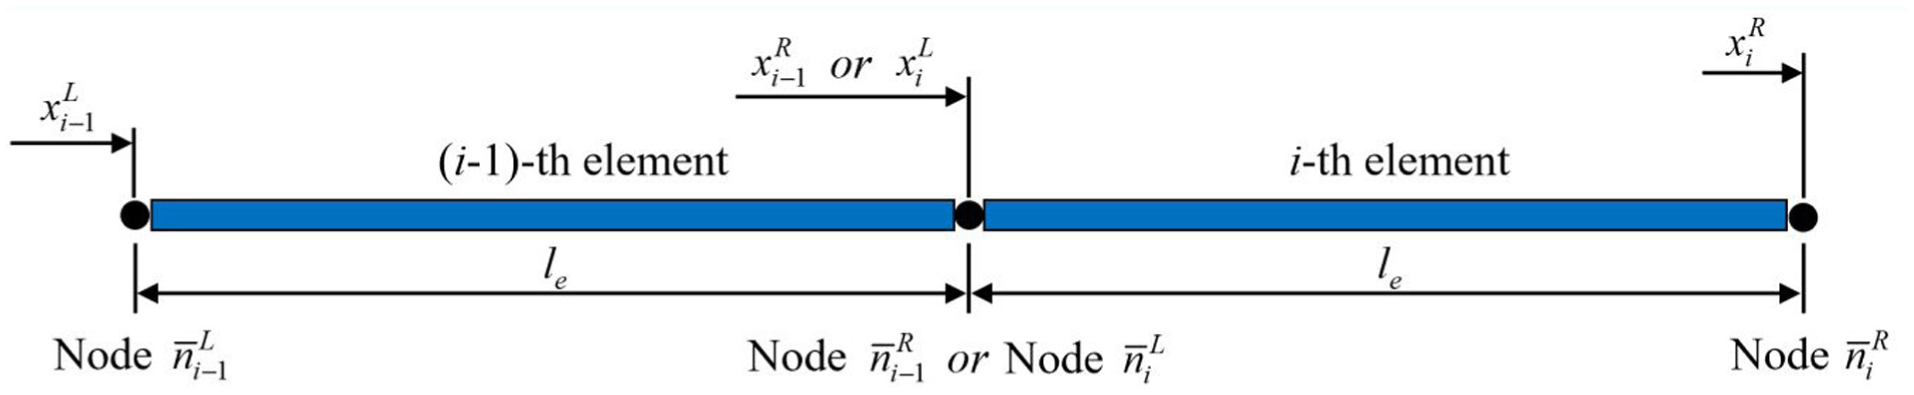
A node connecting the (i−1)th and ith elements.
FE solution of TFs under moving loads
The TF is typically defined as the ratio of FTs of two responses measured at different locations on the beam.
4
Applying the FT to Equation (1), one can obtain

where
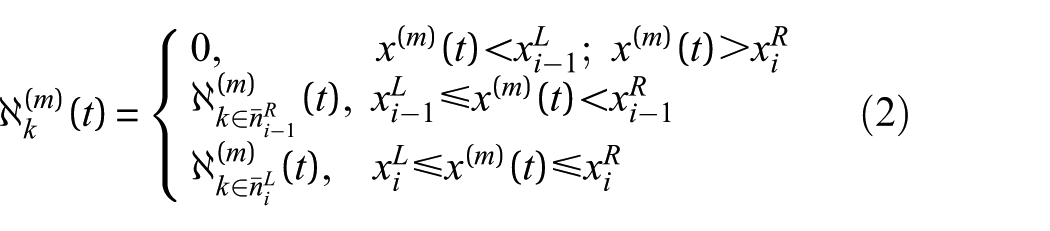
According to Equation (2),
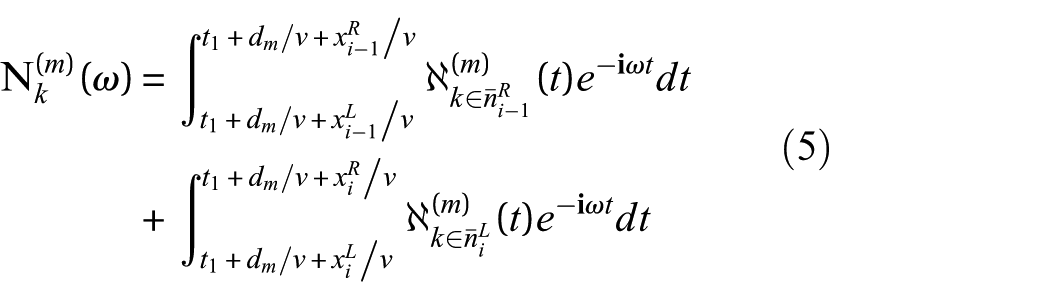
As
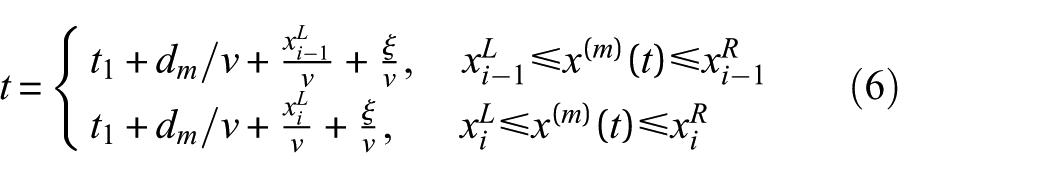
Equation (5) can be further rearranged as:
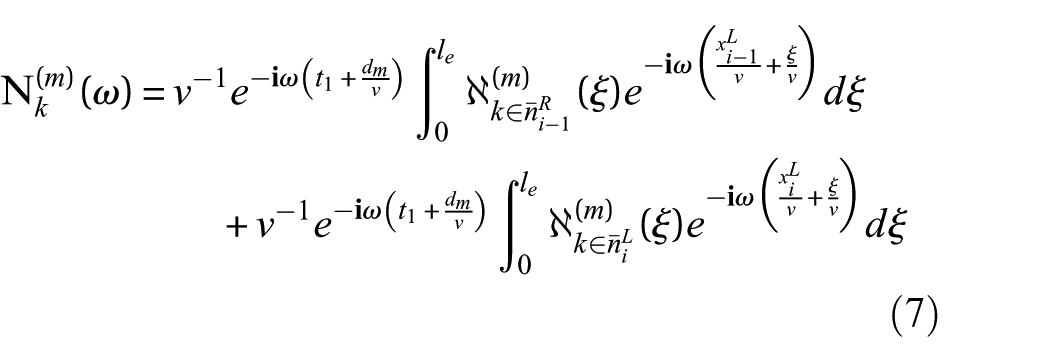
It is worth noting that

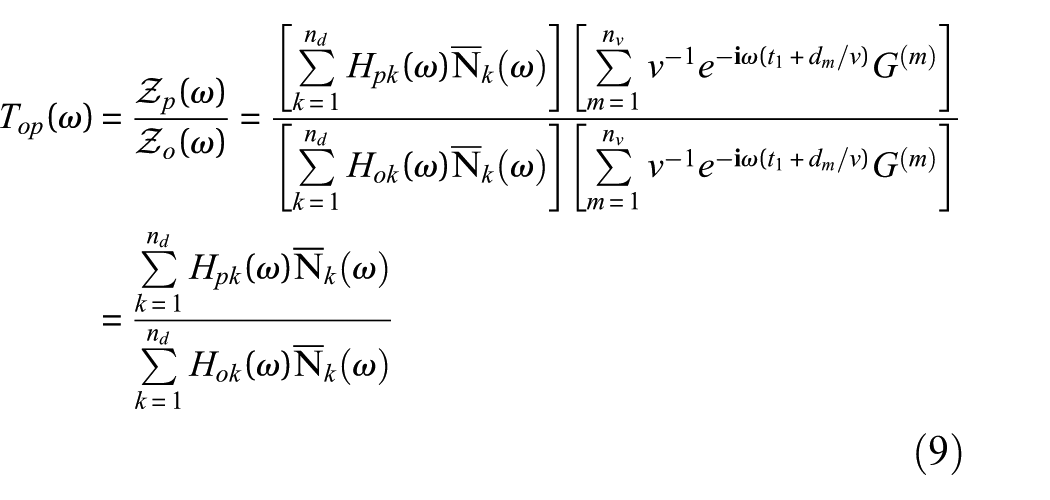
By substituting Equation (8) into Equation (4), the FE solution of TF
Physical properties of TFs under moving loads
The FE solution of TFs for beam-like structures under moving loads is derived as Equation (9). This solution exhibits two significant properties of the TF:
Property 1: The TF
is independent of the unknown input spectra when all moving loads pass the beam at a constant speed
As demonstrated by Equation (9), the magnitude
Property 2: The TF
only depends on the FRFs of the beam and the FTs of the elemental shape functions
As evident from Equation (9), each component of the TF
Property 1 highlights the robustness of the TF, remaining unaffected by unknown moving loads. Property 2 emphasizes its capability to reflect structural dynamic characteristics and establish correlations with structural conditions. These two properties firmly position the TF as a reliable damage-sensitive feature, providing a solid theoretical foundation for developing a damage detection method that can operate independently of unknown input spectra.
Anomaly detection based on input-independent probabilistic feature distance measure
As demonstrated in the “Physical properties of TFs under moving loads” section, the TF proves to be a reliable damage-sensitive feature for detecting damage in a beam subjected to moving loads, as it only depends on the FRFs of the beam and the FTs of the elemental shape functions while being independent of the unknown input spectra. For a monitored beam installed with
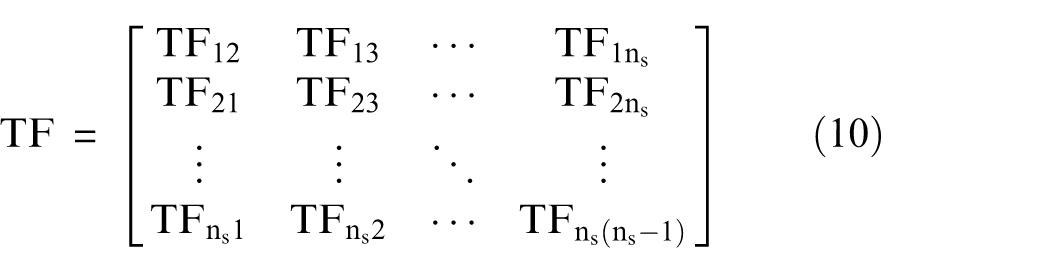
The TF matrix provides more comprehensive information for damage detection in comparison to a single TF. However, performing statistical inference and analysis on such high-dimensional data is challenging for damage detection.
To alleviate the challenges associated with the high-dimensional TF matrix, deep learning provides an effective solution for dimensionality reduction by leveraging its powerful capabilities in information fusion and pattern analysis. Among various deep learning models, the VAE stands out for its ability to transform high-dimensional data into low-dimensional probability distributions using Bayesian variational inference. 31 This process enables the extraction of probabilistic features while reducing dimensionality.
In this section, an anomaly detection method based on an input-independent probabilistic feature distance measure is developed by combining the physical properties of TFs with the probabilistic feature extraction capability of the VAE. This integration represents a paradigm shift from data-intensive approaches toward a physics-informed strategy, effectively bypassing the need for labeled damage data or load-conditioned training sets that most existing methods require. Specifically, the TF matrix is employed as the input data to the VAE for damage detection. The physical properties of TFs enable the features extracted by the VAE to remain unaffected by moving loads, effectively addressing the challenge of collecting diverse training datasets under various load conditions. Concurrently, the probabilistic feature extraction capability of the VAE allows for the extraction of low-dimensional probabilistic features from the high-dimensional TF matrix, reducing the computational complexity of the damage detection process. By integrating TFs and the VAE, a probabilistic feature distance measure—represented by the KL divergence, which quantifies the dissimilarity between probability distributions across different structural conditions—is formulated as an input-independent anomaly score. Furthermore, an anomaly threshold is established using EVT, which models the tail behavior of maximum anomaly scores, improving detection accuracy and reducing false positives.
VAE for low-dimensional probabilistic feature extraction from TF matrix
The VAE model, originally developed as a generative model, integrates Bayesian inference into deep neural networks, allowing for the efficient extraction of low-dimensional probabilistic features in the latent space.
42
As depicted in Figure 4, the VAE model consists primarily of an encoder
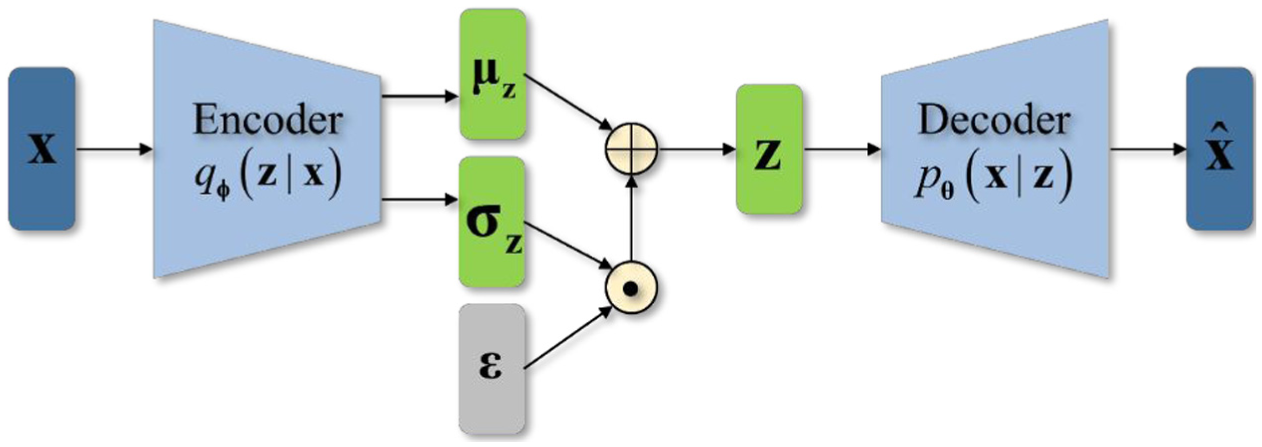
Conceptual illustration of the VAE model. VAE: variational autoencoder.
Based on Bayesian inference, the data

where
where
To train a VAE, the negative ELBO is typically minimized using the backpropagation algorithm and stochastic gradient method. However, the process of sampling vector
In this study, the VAE model is trained using the TF matrix, enabling the encoder to proficiently compress the high-dimensional TF matrix into a low-dimensional latent feature. Importantly, this compressed latent feature can be characterized by the mean
Input-independent probabilistic feature distance
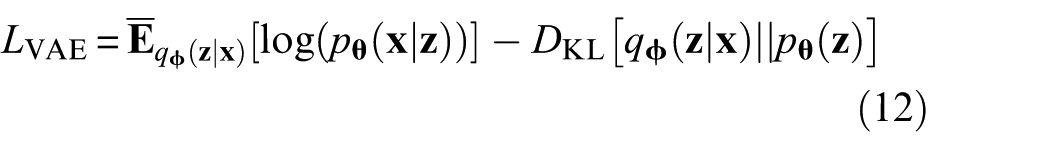
The KL divergence is a commonly used measure to quantify the dissimilarity between a probability distribution and a reference distribution. It equals zero when the two distributions are identical and takes a non-negative value to indicate their dissimilarity. For two continuous probability density functions,
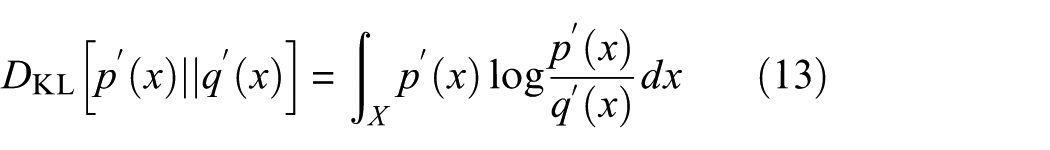
In this study, as shown in Equation (12), the extracted probabilistic distribution is constrained to approximate the prior distribution. This constraint facilitates that similar data in the high-dimensional space retain their similarity in the low-dimensional latent space, leading to the formation of a compact and meaningful probabilistic feature representation. Typically, only the TF matrix from a baseline state is available for training a VAE. By optimizing the parameters of the VAE with this baseline dataset, probabilistic features extracted from new data collected under normal conditions closely align with the prior distribution, resulting in a small KL divergence. Conversely, when the bridge enters an abnormal state, the extracted features deviate from the normal features, leading to a larger KL divergence. Leveraging the TF’s independence from moving loads, the KL divergence calculated from the extracted features serves as an input-independent probabilistic feature distance, effectively acting as an anomaly score to indicate bridge damage. Figure 5 provides a conceptual illustration of this input-independent probabilistic feature distance. For the extracted multivariate GD
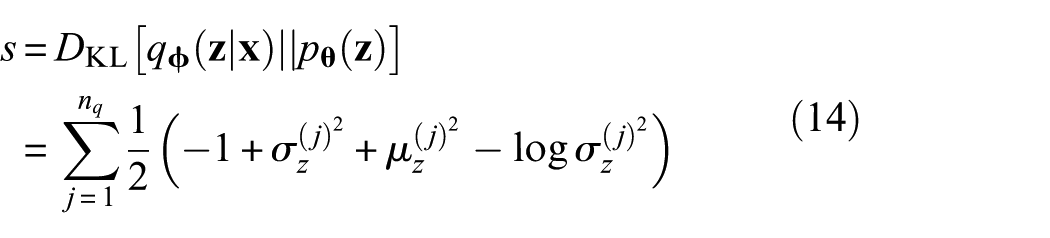
where
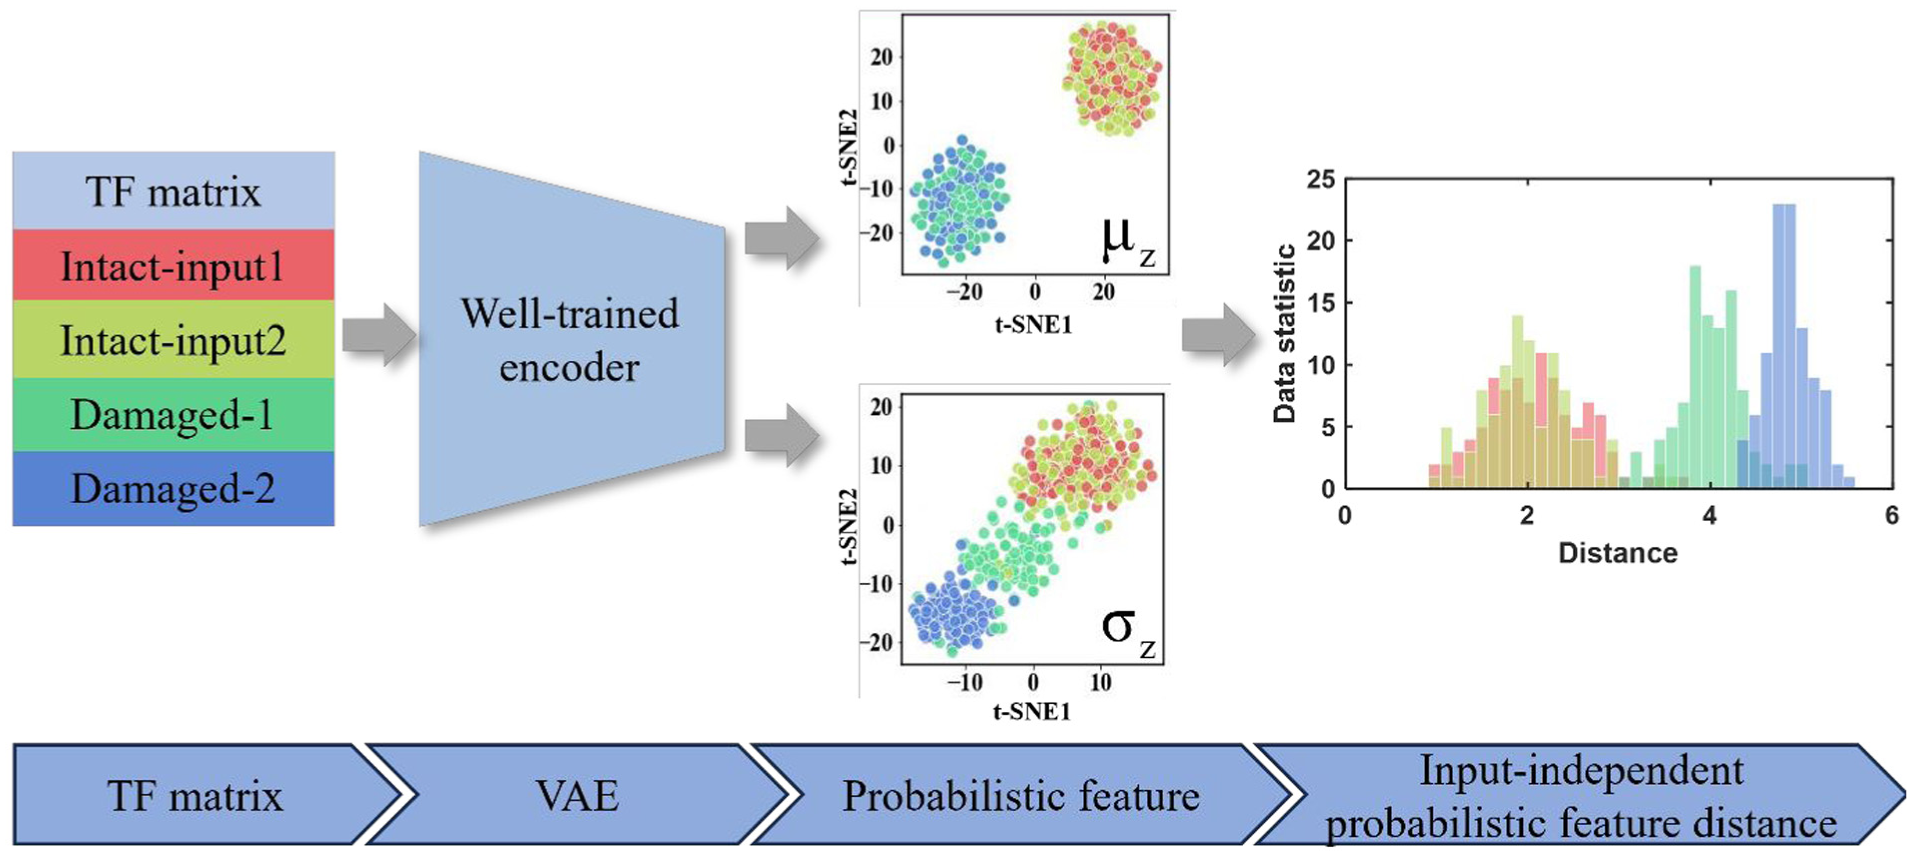
Conceptual illustration of the input-independent probabilistic feature distance.
EVT for anomaly detection threshold determination
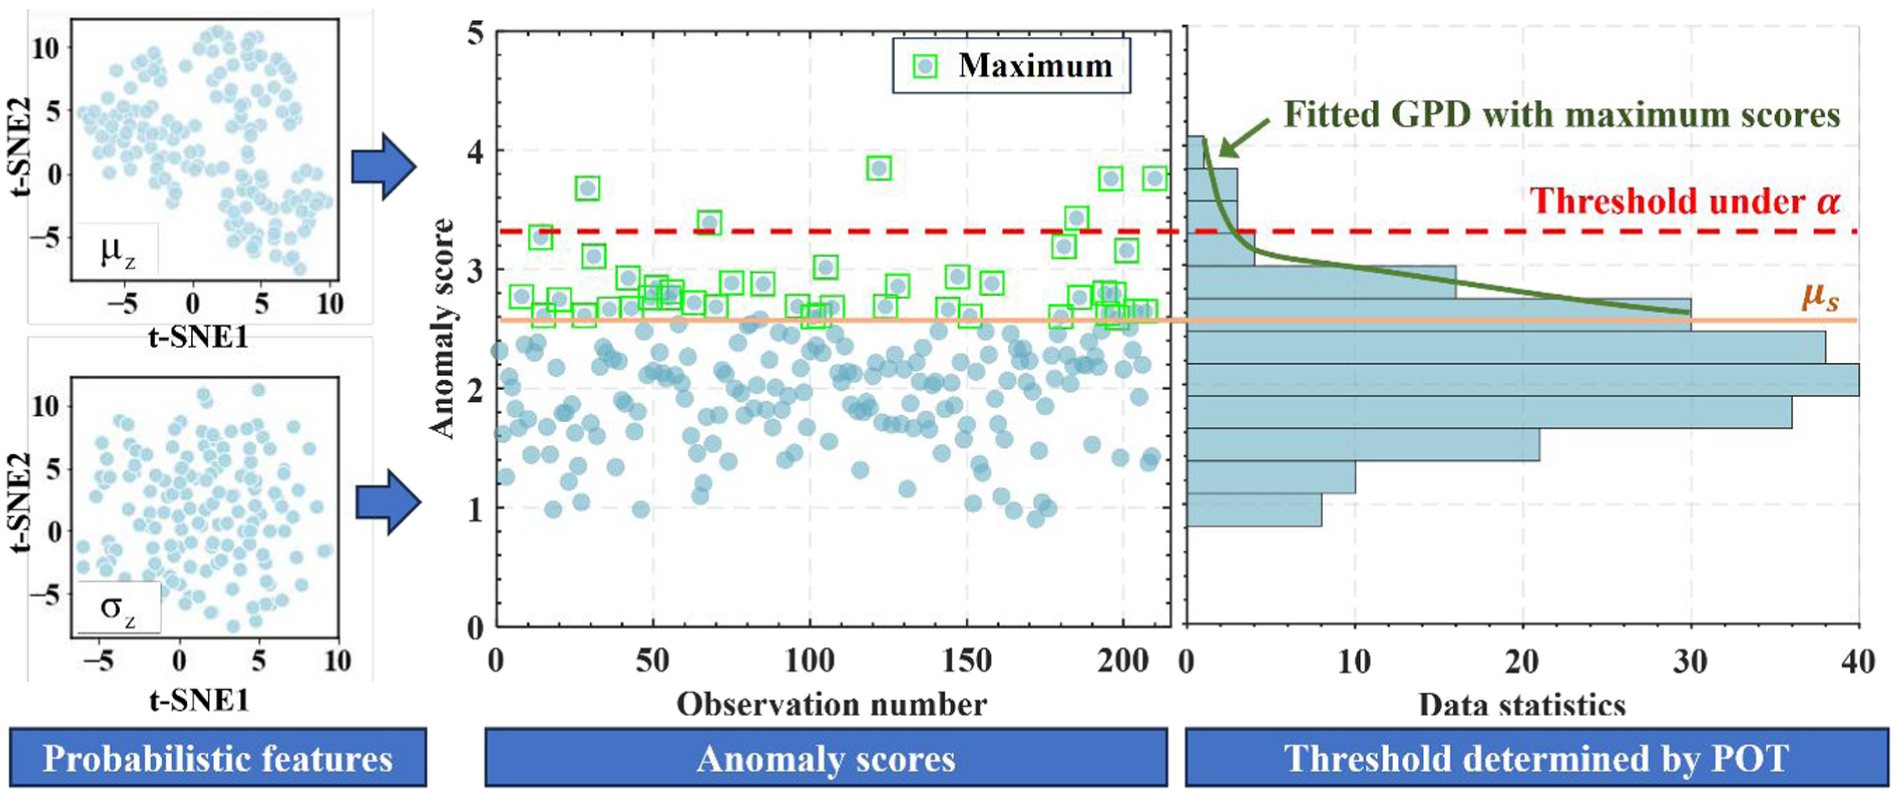
Determining an appropriate threshold is a crucial step in distinguishing anomaly scores between normal and abnormal structural conditions. A common approach involves selecting a user-defined significance level and calculating the threshold using the inverse cumulative distribution function (CDF), 43 based on an assumed distribution of all anomaly scores under the baseline state. However, using the full set of anomaly scores to model the distribution often fails to adequately capture its tail behavior, leading to an inferior threshold and compromised detection performance. To address this issue, EVT provides a more effective solution by focusing on modeling the tail of the distribution using only the maximum anomaly scores observed under the baseline state.44,45 In this study, the peaks-over-threshold (POT) approach, rooted in EVT, 46 is employed to determine a threshold for anomaly detection.
Figure 6 illustrates the schematic view of the POT approach. This approach focuses exclusively on the maximum anomaly scores that exceed a predefined threshold, denoted as
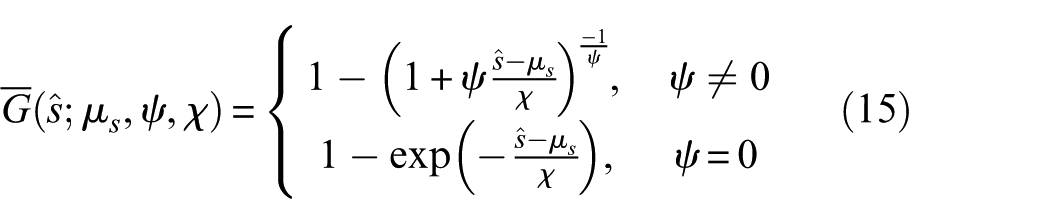
where
Schematic view of the POT approach for threshold determination. POT: peaks-over-threshold.
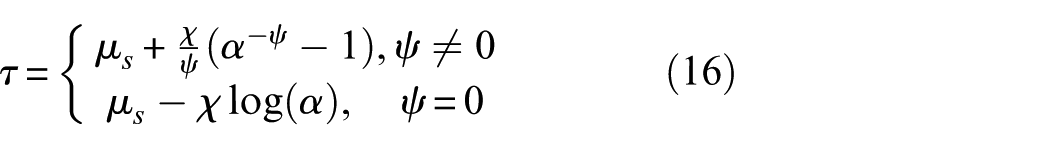
The selection of the threshold
Sort all anomaly scores under normal states in descending order.
Sequentially select the first r sorted anomaly scores as the maximum scores, with the threshold
Estimate the GPD parameters for the selected maximum scores and perform the AD test, recording the corresponding test statistic
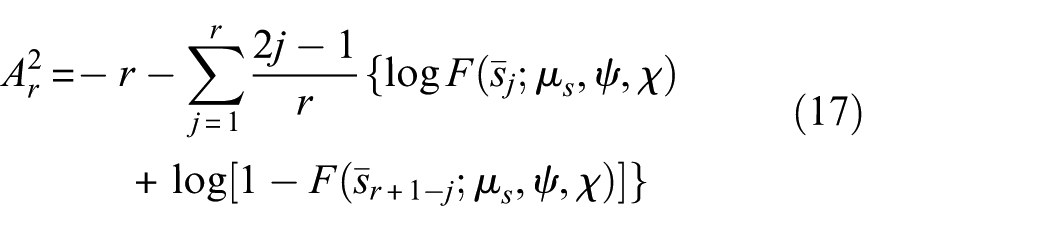
where
The optimal threshold
Flowchart of the proposed anomaly detection method
The flowchart of the proposed anomaly detection method is presented in Figure 7, with the following steps:
Step (1): Training phase:
Construct a training dataset comprising the TF matrix obtained from Equation (10) when the bridge is in its baseline state;
Train a VAE with the training dataset according to the method introduced in “VAE for low-dimensional probabilistic feature extraction from TF matrix” section;
Extract probabilistic features from the training dataset using the well-trained VAE;
Compute input-independent probabilistic feature distances as anomaly scores by Equation (14);
Determine an alarm threshold based on EVT, as described in “EVT for anomaly detection threshold determination” section.
Step (2): Testing phase:
Obtain the TF matrix of the bridge in a potentially damaged state using Equation (10);
Extract the probabilistic features from the TF matrix using the well-trained VAE;
Compute the anomaly score based on the extracted probabilistic features using Equation (14);
Assess the structural condition by comparing the anomaly score with the alarm threshold.
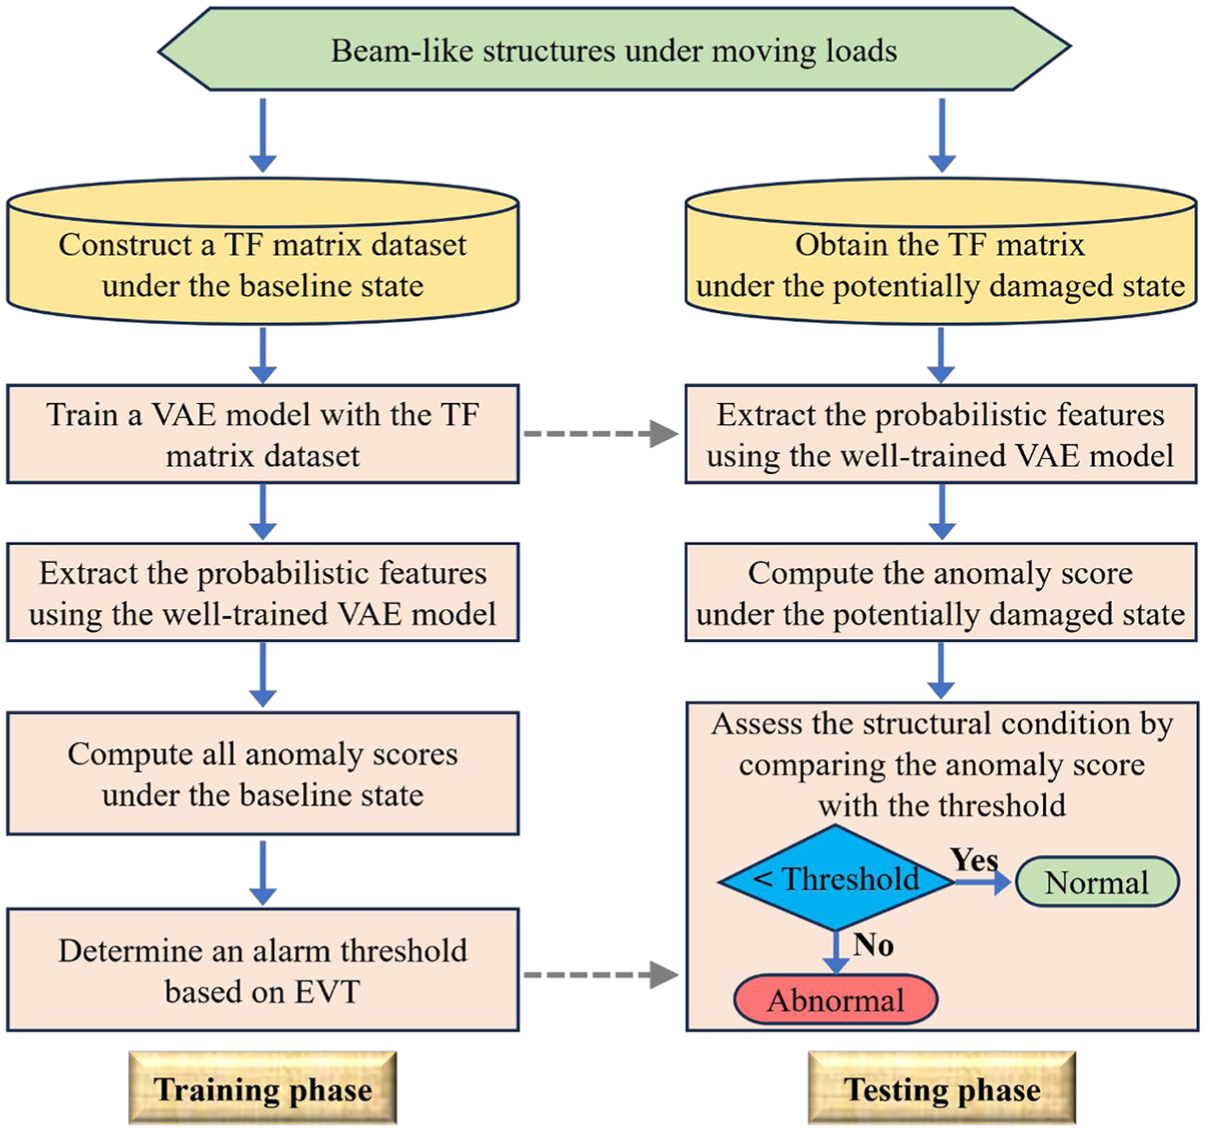
Flowchart of the proposed anomaly detection method.
It is noted that although the size of the TF matrix increases with the number of sensors, its assembly remains computationally tractable. Each TF is computed as a simple ratio of FFTs, which is a low-cost operation and can be readily parallelized. Moreover, the probabilistic feature extraction and anomaly score computation require only a single forward pass through the well-trained encoder, ensuring high computational efficiency. Consequently, the proposed method supports near-real-time anomaly detection.
Numerical studies
A simply supported beam with a length of 30 m, as shown in Figure 8, was used to validate the performance of the proposed anomaly detection method in numerical studies. The beam possessed the following physical properties: mass density
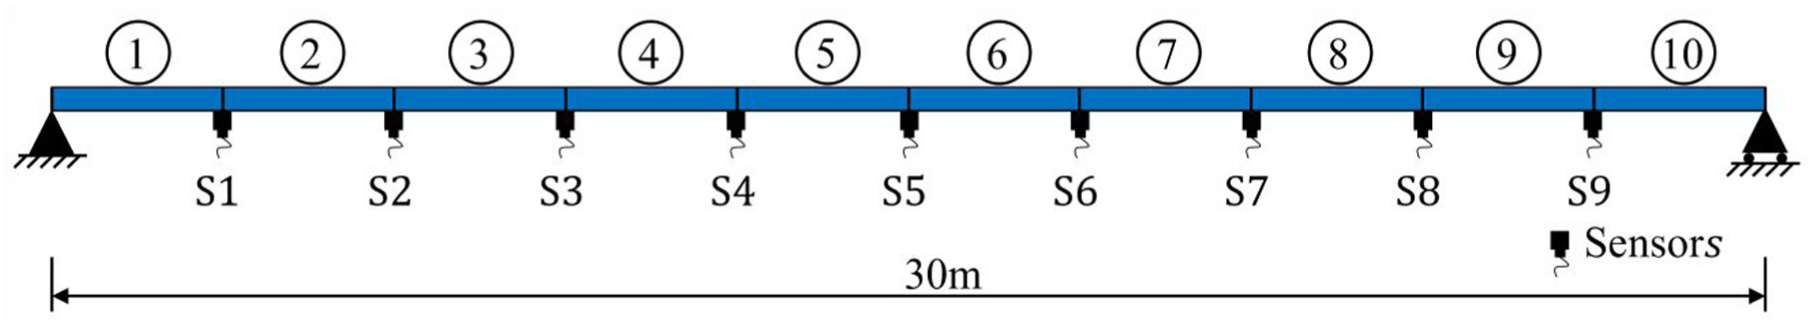
A simply supported beam divided into ten zones by nine sensors.
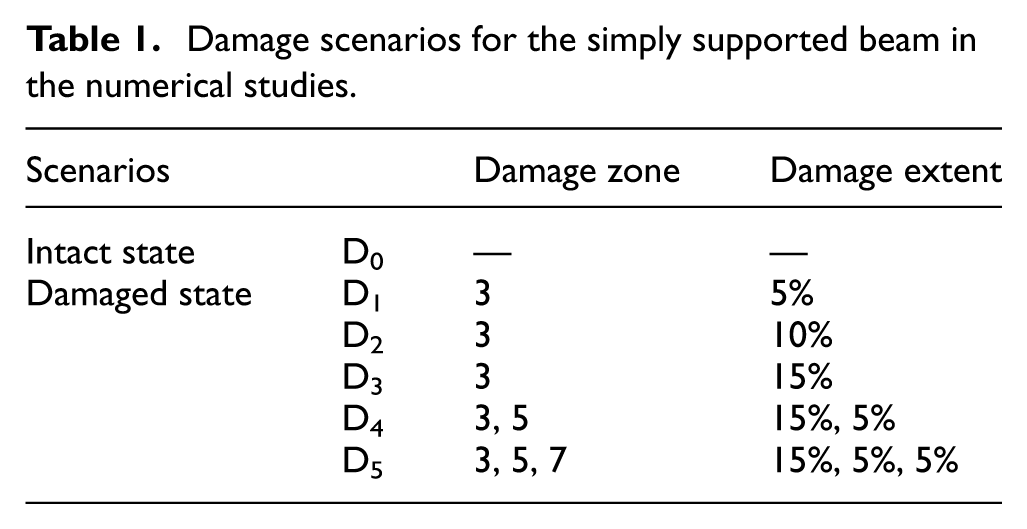
Damage scenarios for the simply supported beam in the numerical studies.
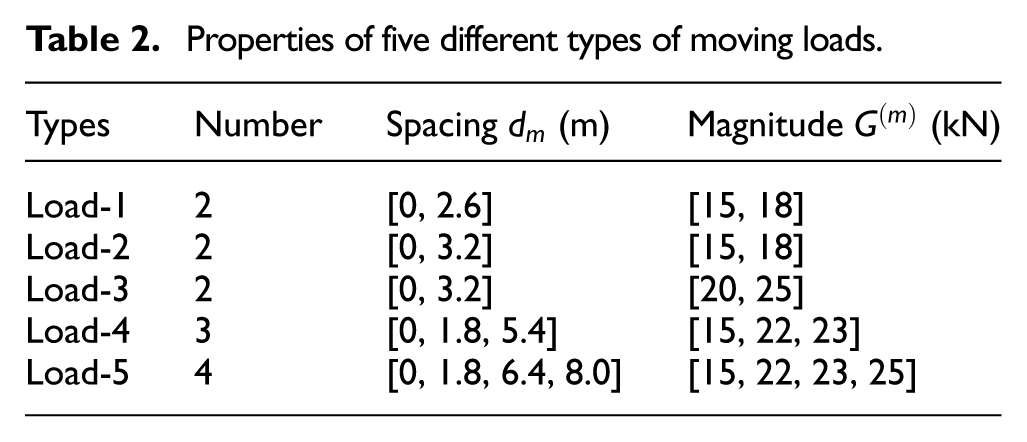
Properties of five different types of moving loads.
Validation of the physical properties of TFs
Validation of property 1
To validate property 1, which states that the TFs are independent of unknown input spectra when all moving loads pass over the beam at the same speed, five different types of moving loads, as listed in Table 2, were applied to the intact beam D0. As shown in Figure 9, the amplitude of the fast Fourier transform (FFT) of acceleration from sensor S3 varies for the different moving loads. However, Figure 10 demonstrates that the TFs
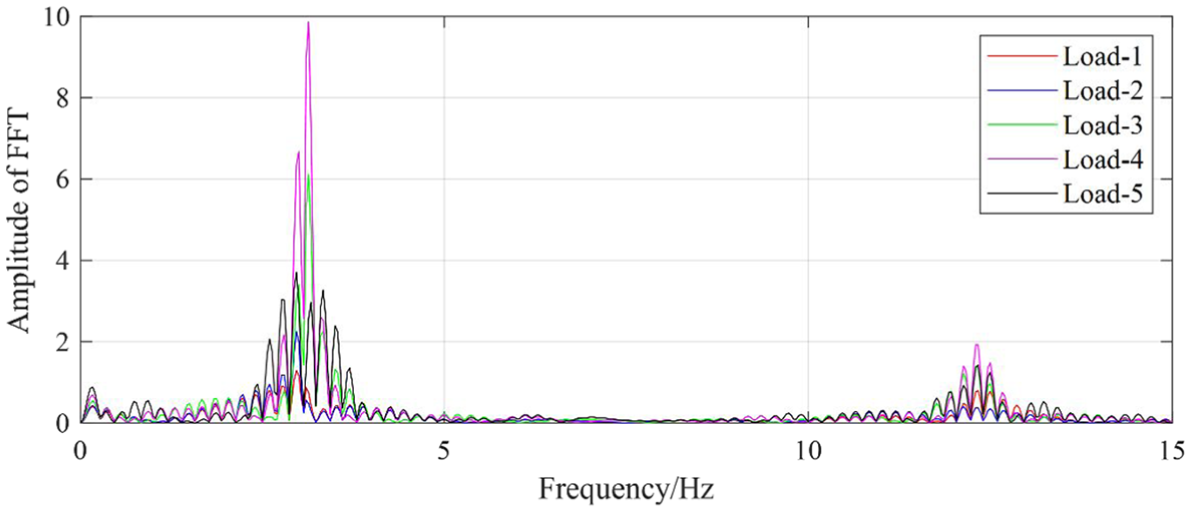
Amplitude of FFT of the accelerations from sensor S3 under different moving loads. FFT: fast Fourier transform.
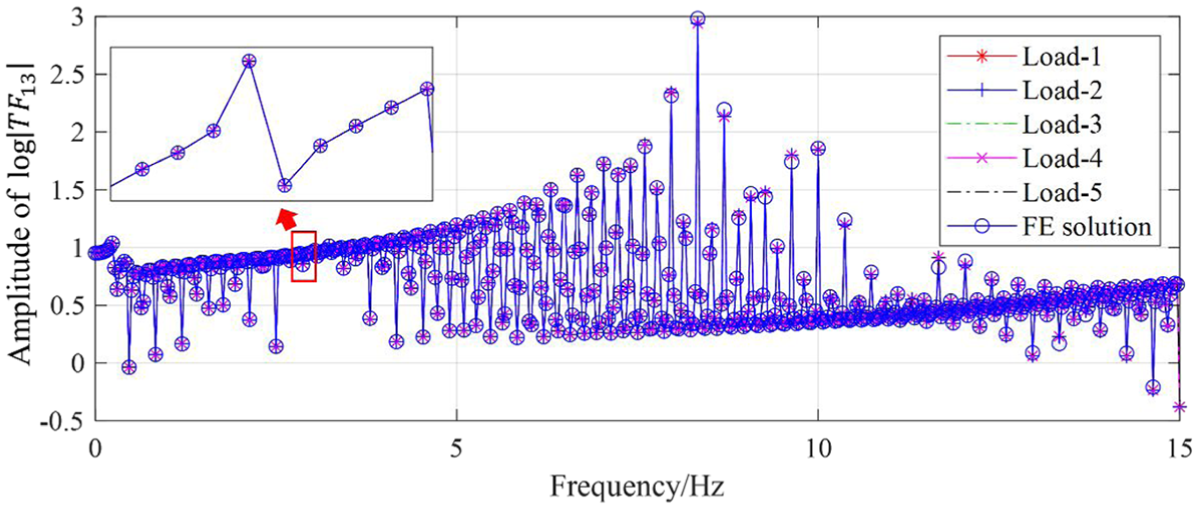
TFs
Validation of property 2
To validate property 2, which states that the TFs only depend on the FRFs of the beam and the FTs of the elemental shape functions, Figure 11 presents a comparison of the TFs
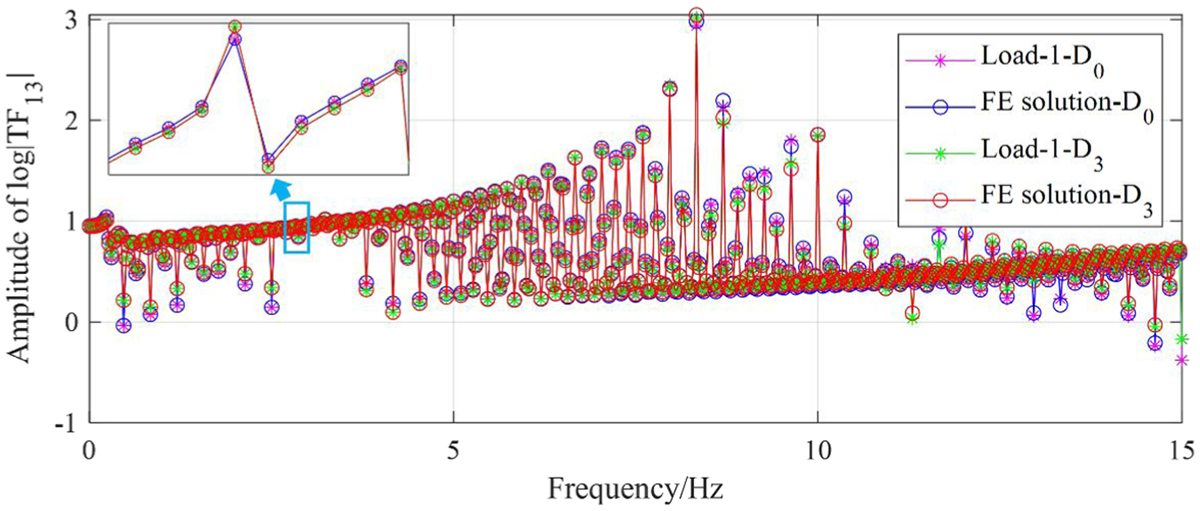
TFs
Verification of the proposed anomaly detection method
In the proposed anomaly detection method, the VAE model was trained using only the dataset corresponding to the intact beam D0. During the training phase, a normal dataset consisting of 300 TF matrix samples was constructed. Each TF matrix was generated using Equation (10) based on acceleration responses obtained when “Load-1” passed over the intact beam. To simulate measurement noise, zero-mean Gaussian noise with a standard deviation of 5% of the noise-free acceleration was added. The resulting TF matrix dataset was then divided into training and validation sets in a 7:3 ratio.
In the testing phase, a dataset of 1000 TF matrix samples was prepared, each contaminated with 5% measurement noise. Among these, 500 samples were generated by applying the five different moving loads from Table 2 to the intact beam D0, with 100 samples per load type. In each sample, zero-mean Gaussian noise was added to simulate measurement uncertainty, and the TF matrix was computed from the resulting noisy responses. The remaining 500 samples were generated by applying “Load-1” to the five different damaged beams D1–D5 listed in Table 1, with 100 samples per damage state. This setup allowed for a comprehensive evaluation of the proposed method under different load conditions and structural damage scenarios.
Training phase
A VAE model was implemented using PyTorch in Python 3.7. The configuration and hyperparameters of the VAE were initially chosen based on relevant literature in the field and further refined through a trial-and-error process. 33 The final configuration and hyperparameters, illustrated in Figure 12, were determined based on the lowest loss function value observed on the validation set across all trials. The encoder of the VAE comprises an input layer, three convolutional blocks, and two fully connected layers. Each convolutional block includes a convolutional layer, a max-pooling layer, and a Tanh activation function. The decoder mirrors the structure of the encoder but in reverse, replacing the max-pooling layers with up-sampling layers. The VAE was trained for 300 epochs with a batch size of 64 and a learning rate of 0.001 using the Adam optimizer. The training process was conducted on a standard personal computer equipped with an Intel Core i7-9700 CPU and 16 GB of RAM.
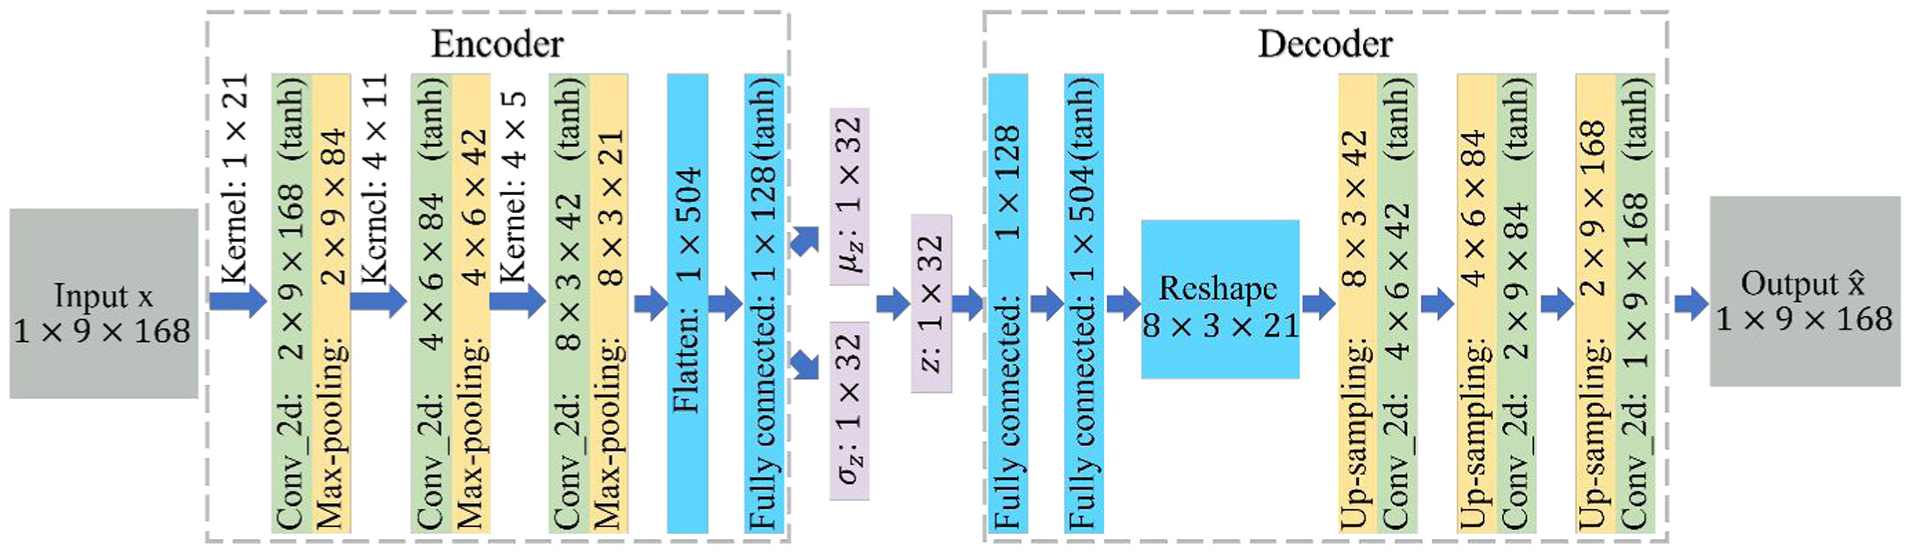
The configuration and hyperparameters of the VAE model for the beam. VAE: variational autoencoder.
In addition to obtaining a well-trained VAE model, determining the alarm threshold is another task during the training phase. First, anomaly scores for all TF matrix samples in the normal dataset were computed based on the input-independent probabilistic features extracted by the trained VAE. Then, an optimal GPD was fitted using the POT approach. The threshold for fitting was selected where the AD test statistic reached its minimum value of 0.27. Based on this fitted model, the alarm threshold for anomaly detection at a 0.05 significance level 46 was determined to be 3.31. Figure 13 displays the anomaly scores for both the training and validation datasets, showing that no false positives occurred in the validation dataset.
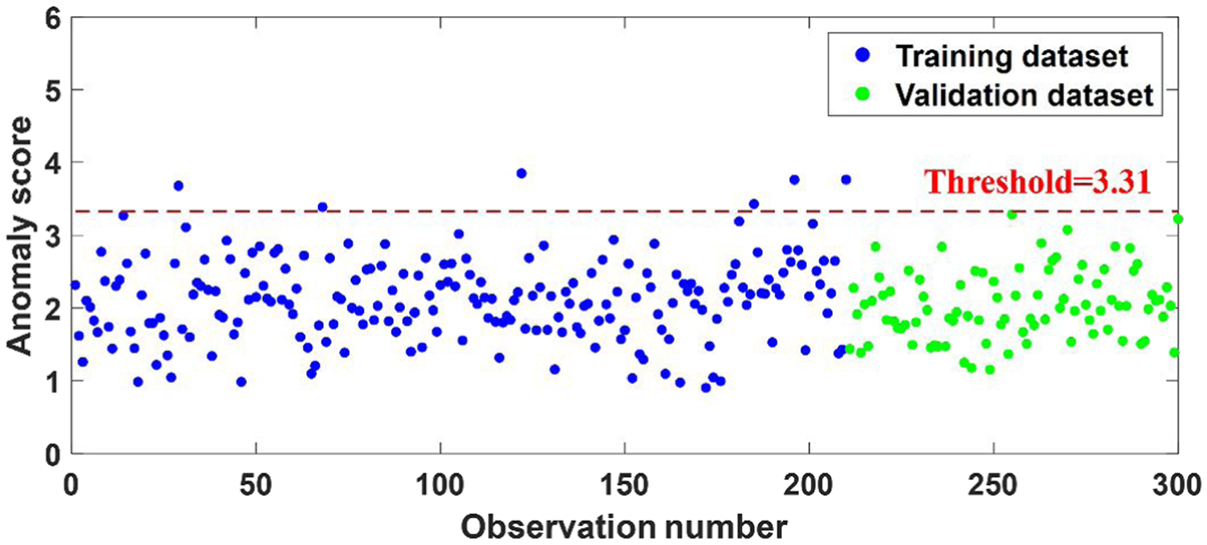
Anomaly scores for both the training and validation datasets in the numerical studies.
Testing phase
The anomaly detection results for the testing dataset are presented in Figure 14. As shown in Figure 14(a), the anomaly scores for samples corresponding to the intact state D0 of the beam exhibit consistent fluctuations within a similar range, consistently falling below the alarm threshold, even under different moving loads. This indicates that the probabilistic features extracted from the TF matrix samples by the well-trained VAE are unaffected by the moving loads, leading to input-independent probabilistic feature distances and enabling the proposed method to robustly and accurately identify the normal state of the beam. In contrast, the anomaly scores for the beam in different damage states D1–D5 surpass the alarm threshold, with the anomaly scores increasing as the degree of damage rises. This demonstrates the effectiveness of the proposed method in detecting abnormal states of the beam. To provide a quantitative overview of the anomaly detection results, a confusion matrix is presented in Figure 14(b). Notably, among the 1000 observations in the testing dataset, only 4 false negatives and 12 false positives are recorded, resulting in an accuracy of 98.4%. These results validate that the proposed anomaly detection method can operate independently of unknown input spectra and achieve satisfactory structural condition assessments.
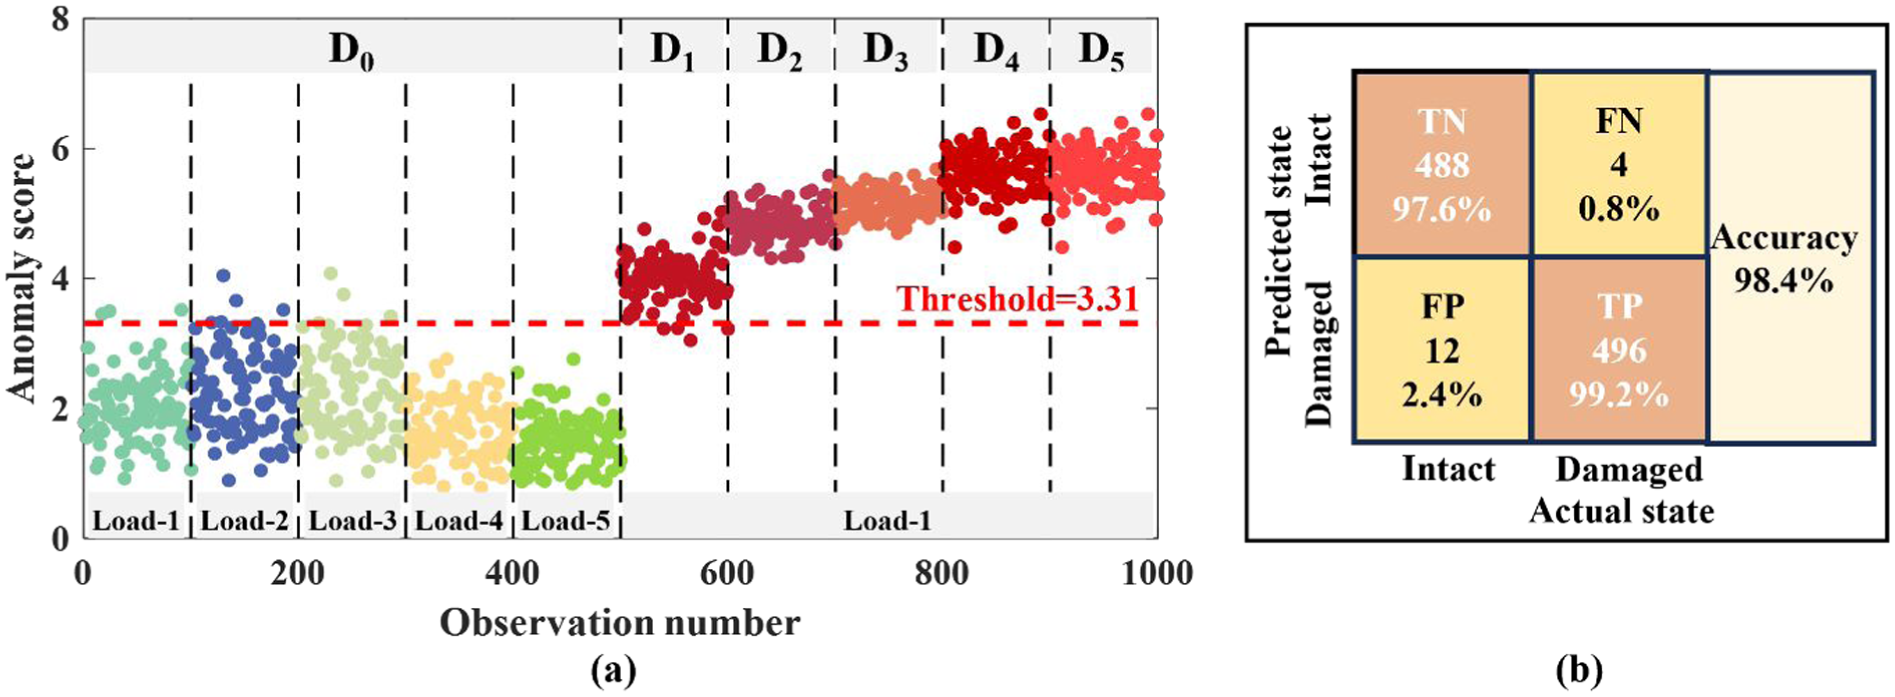
Anomaly detection results for the testing dataset in the numerical studies: (a) anomaly scores and (b) confusion matrix.
Comparative study
To further evaluate the performance of the proposed method, referred to as TF-VAE-EVT, three alternative approaches were tailored for comparative analysis:
(a) FFT-VAE-EVT: In the first approach, the TF matrix in the proposed method was replaced with an FFT matrix as the input data for the VAE. The FFT signals were directly calculated from the measured accelerations and organized into a matrix analogous to the TF matrix.
(b) TF-AE-EVT: The second approach utilized an AE as the feature extractor instead of the VAE. Anomaly scores were then calculated based on the Mahalanobis squared distance 48 of the deterministic features extracted by the AE.
(c) TF-VAE-GD: The third approach assumed that the anomaly scores for the normal dataset followed a GD. The alarm threshold was set as two standard deviations above the mean of the anomaly scores. 43
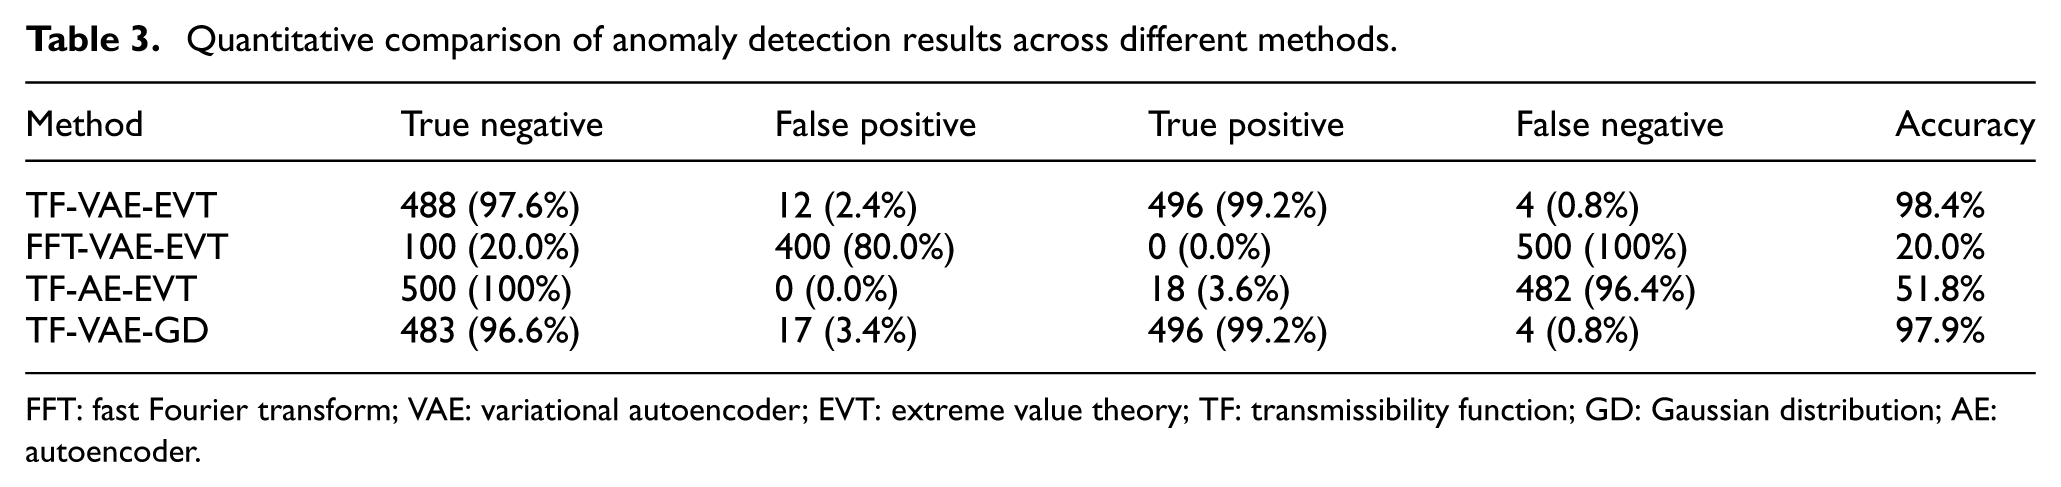
Except for these modifications, the implementation procedures for these alternative approaches were consistent with the proposed TF-VAE-EVT method. Figure 15 presents the anomaly detection results obtained from the three comparative methods. As shown in Figure 15(a), when the bridge in state D0 is subjected to different moving loads not encountered during training, the anomaly scores from the FFT-VAE-EVT method vary across the different loads and even exceed the alarm threshold. This indicates that the FFT matrix is more susceptible to the influence of moving loads compared to the TF matrix, which remains unaffected. Figure 15(b) demonstrates that the anomaly scores under abnormal states are not distinctly separated from those under the normal state, indicating the inferior damage detection performance of the TF-AE-EVT method in comparison to the proposed TF-VAE-EVT method. This can be attributed to the constraint of probabilistic distributions imposed on the latent features in the VAE model, which results in more compact normal probabilistic features that are easier to distinguish from abnormal features. Furthermore, as shown in Figure 15(c), the TF-VAE-GD method determines a smaller threshold than the proposed method, resulting in more false positives. This discrepancy arises because the GD model is fitted to the entire set of anomaly scores, which may not accurately capture the tail of the distribution, leading to an inadequate threshold. Table 3 provides a quantitative comparison of the performance across these methods, clearly showing that the proposed TF-VAE-EVT method outperforms the alternatives in terms of accuracy for damage detection.
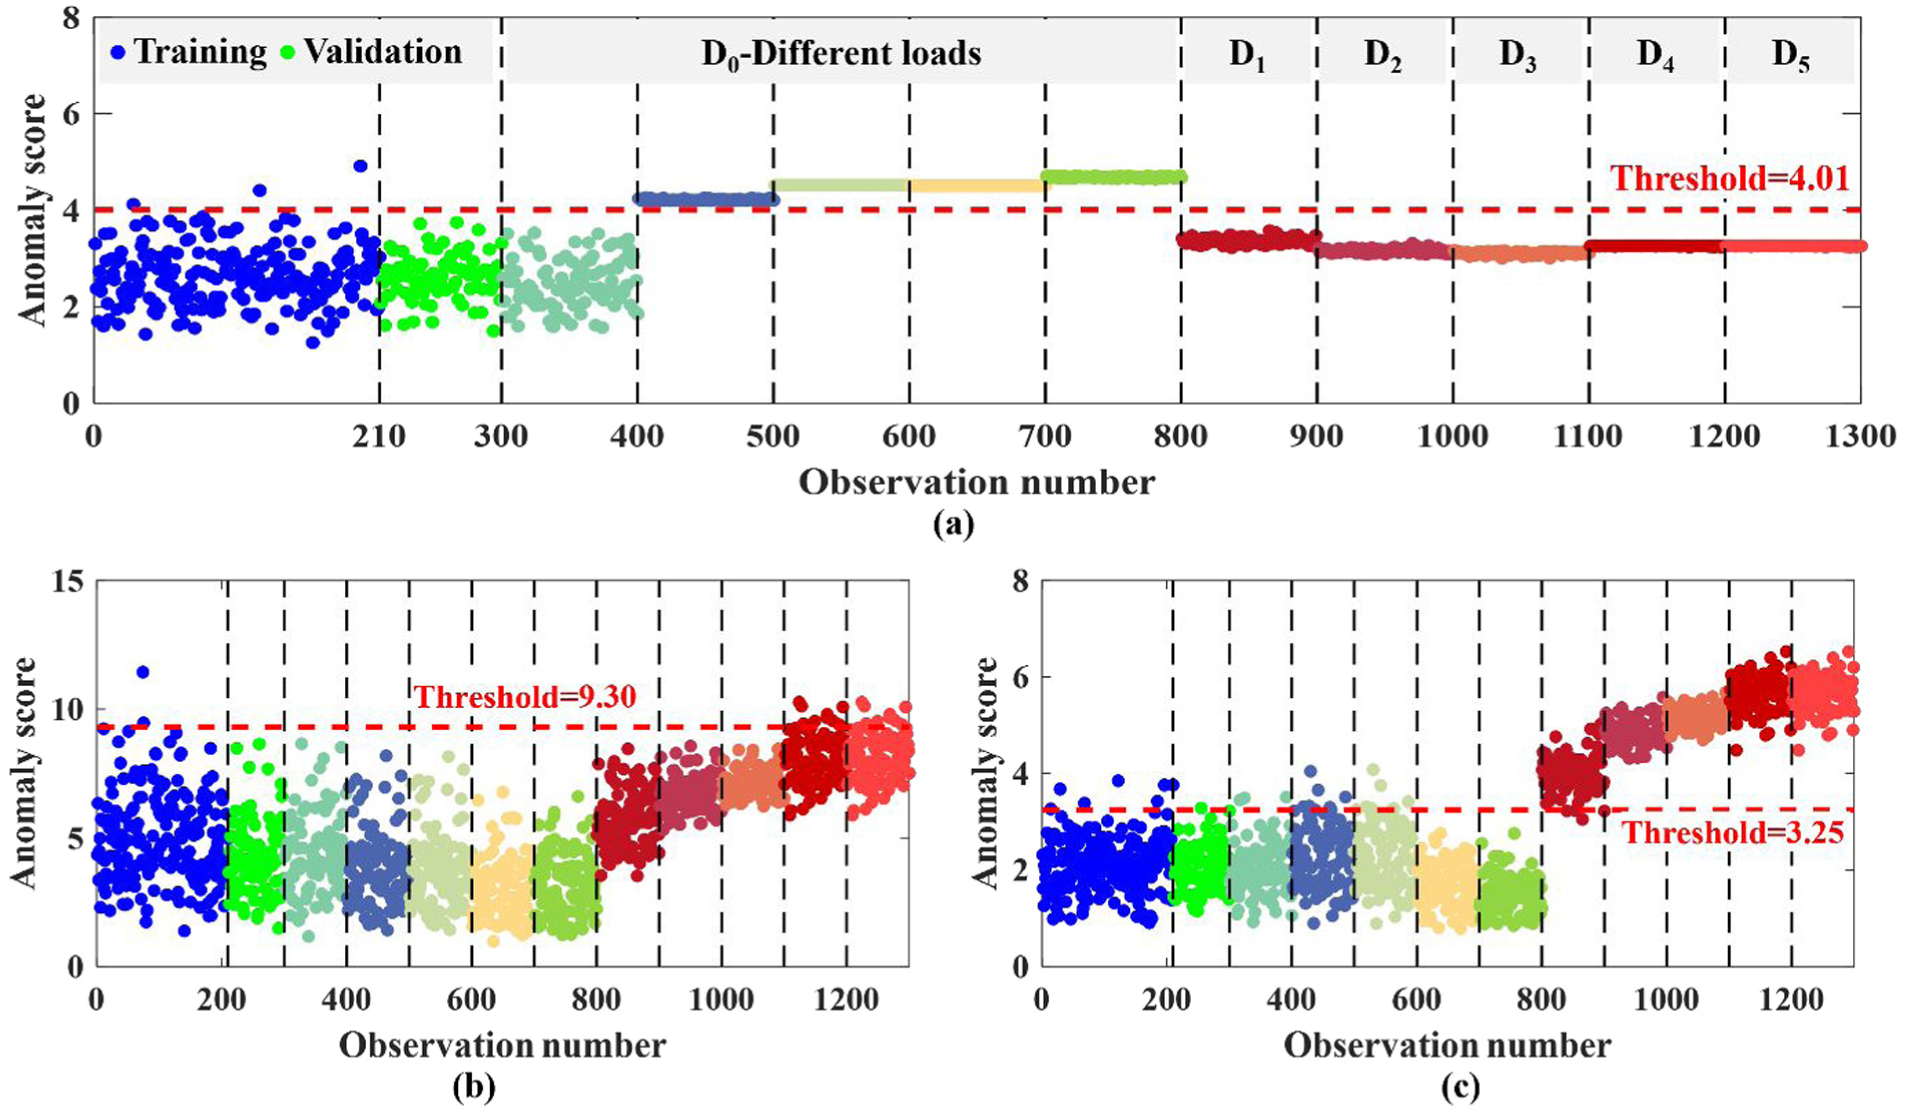
Anomaly detection results obtained from different methods: (a) FFT-VAE-EVT, (b) TF-AE-EVT, and (c) TF-VAE-GD. FFT: fast Fourier transform; VAE: variational autoencoder; EVT: extreme value theory; TF: transmissibility function; GD: Gaussian distribution; AE: autoencoder.
Quantitative comparison of anomaly detection results across different methods.
FFT: fast Fourier transform; VAE: variational autoencoder; EVT: extreme value theory; TF: transmissibility function; GD: Gaussian distribution; AE: autoencoder.
Experimental studies
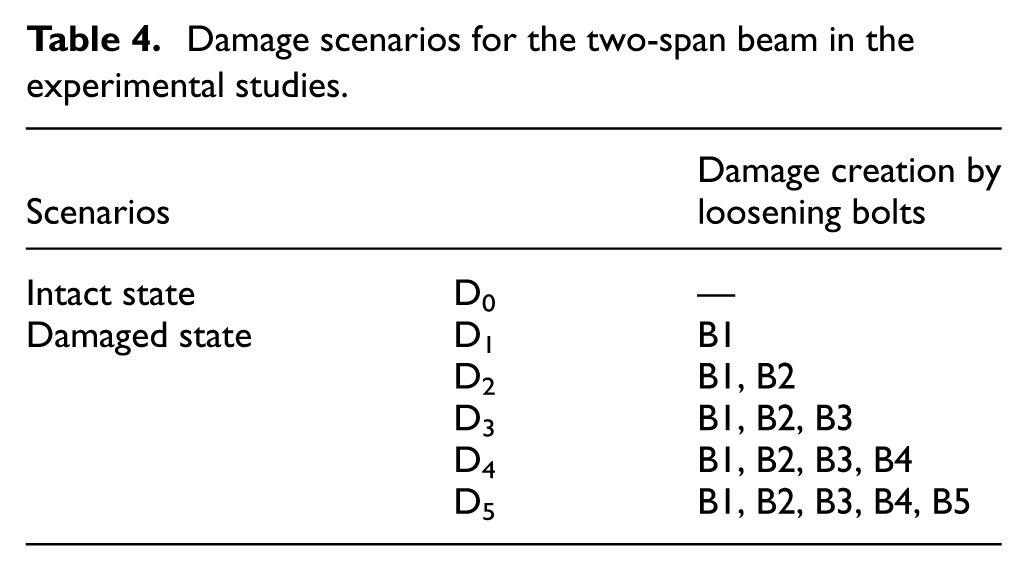
To further validate the effectiveness of the proposed anomaly detection method, several experimental studies were conducted in a laboratory using a two-span continuous beam and a vehicle model, as shown in Figure 16. The beam, with a total length of 2.4 m, was constructed from polymethyl-methacrylate, which has an elastic modulus of approximately 2.51 GPa and a density of around 120 kg/m3. As shown in Figure 16(a), the beam was reinforced with stiffening bars that were tightly fastened using bolts. Figure 16(b) presents the vehicle model that could traverse the beam at constant speed. The vertical view of the beam in Figure 16(c) shows the specific locations of the stiffening bars, where bolts were intentionally loosened to create artificial damage, as well as the locations of the accelerometers used for response measurement. Figure 16(d) shows the data acquisition system, which recorded the acceleration responses at a sampling rate of 1000 Hz. In addition to the intact state, five damage states were introduced, as detailed in Table 4, by progressively loosening the bolts in different stiffening bars. Specifically, in the damaged state D5, all bolts in bars B1–B5, as indicated in Figure 16(c), were loosened.
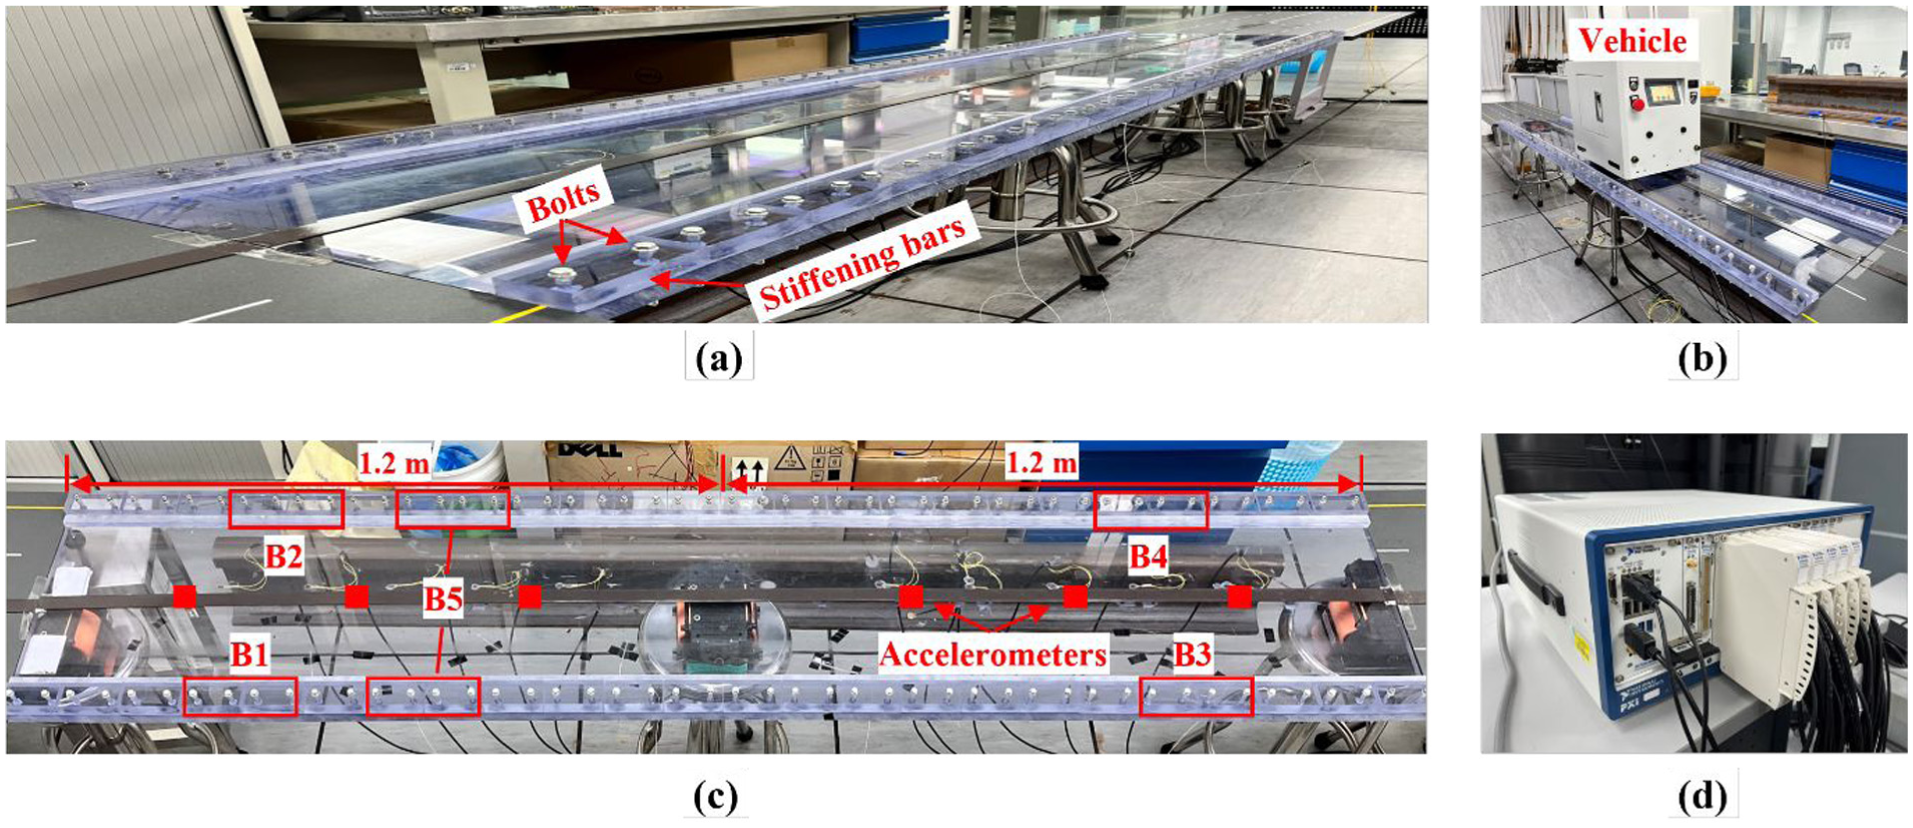
Experimental configuration: (a) a two-span beam, (b) a vehicle model, (c) schematic view of locations of the accelerometers and loosened bolts, and (d) data acquisition system.
Damage scenarios for the two-span beam in the experimental studies.
VAE model training and threshold estimation in the intact state
When the beam was in its intact state, a TF matrix dataset was generated by running the vehicle model over the beam for a total of 150 trials. This normal dataset was then divided into training and validation sets at a 7:3 ratio. Following the training procedure described in the numerical study, a VAE model, illustrated in Figure 17, was developed to extract low-dimensional probabilistic features from the TF matrix samples. Note that the configuration and hyperparameters of this VAE differ from those in the numerical study because of a difference in the size of the input TF matrix, which is related to the number of sensors attached to the bridge. Using these extracted features, input-independent probabilistic feature distances were computed as anomaly scores for the samples in the normal dataset. Subsequently, an alarm threshold for anomaly detection was determined to be 2.59 at a significance level of 0.05, 46 based on a GPD model fitted using the POT approach, with the fitting threshold selected where the AD test statistic reached its minimum value of 0.14. Figure 18 presents all anomaly scores for both the training and validation datasets alongside the alarm threshold. This visualization demonstrates that only one anomaly score in the validation dataset exceeds the threshold.
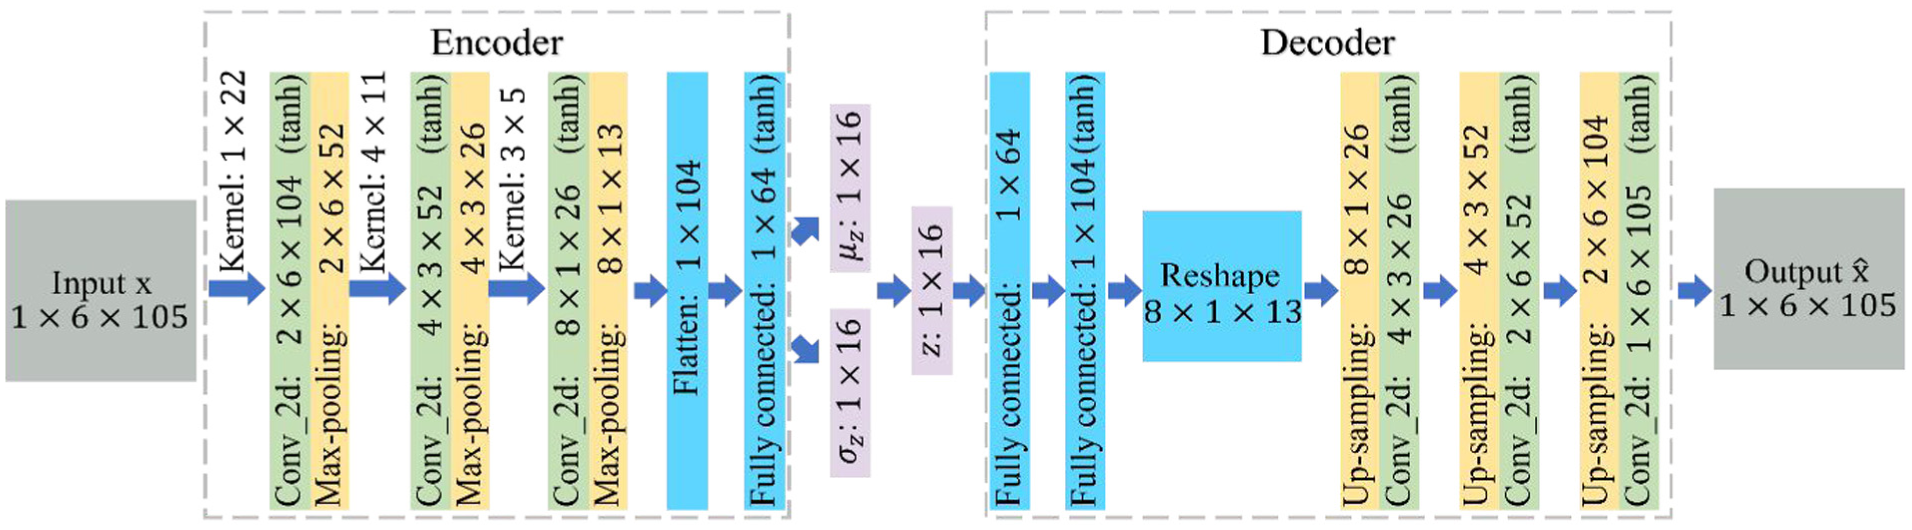
The configuration and hyperparameters of the VAE model for the two-span beam. VAE: variational autoencoder.
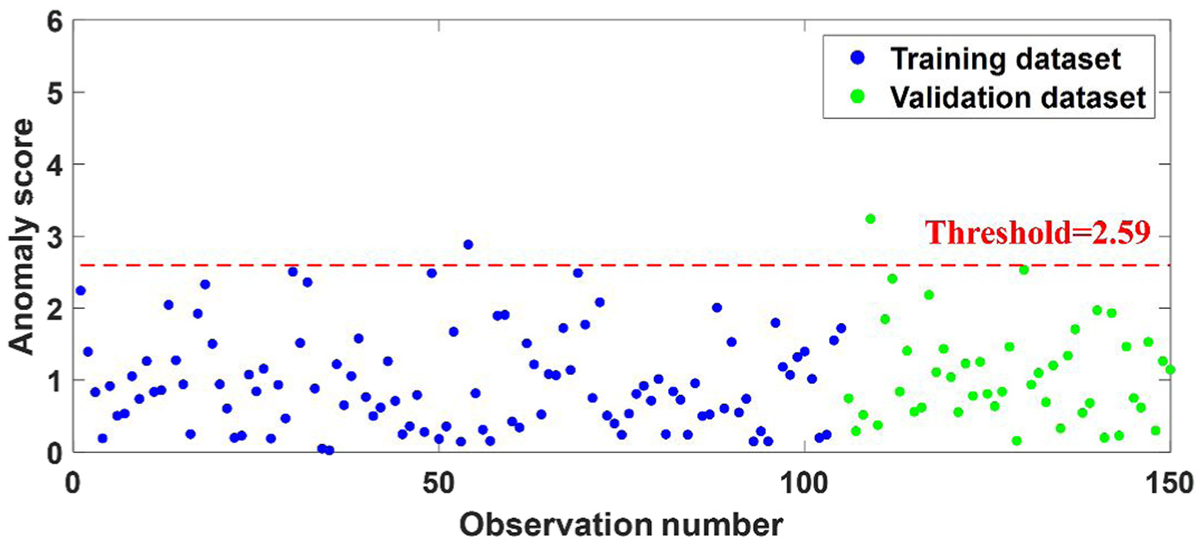
Anomaly scores for both the training and validation datasets in the experimental studies.
Anomaly detection results under possibly damaged states
In the testing phase, a dataset of 100 TF matrix samples was prepared, consisting of 50 samples collected under intact state D0 and 50 samples from the damaged states (D1–D5), with 10 samples for each damaged state. The anomaly detection results obtained using the proposed method are shown in Figure 19. As shown in Figure 19(a), all anomaly scores corresponding to the intact state fall below the alarm threshold, while those for the damaged states consistently exceed the threshold. Furthermore, the anomaly scores exhibit an increasing trend across the five progressive damage states, demonstrating the capability of the proposed method to not only detect structural anomalies but also provide a relative quantification of the damage extent. To further illustrate the detection performance, a confusion matrix is presented in Figure 19(b). The results reveal no false positives or false negatives, yielding an accuracy of 100%. These findings confirm the effectiveness and robustness of the proposed method in achieving accurate structural anomaly detection.
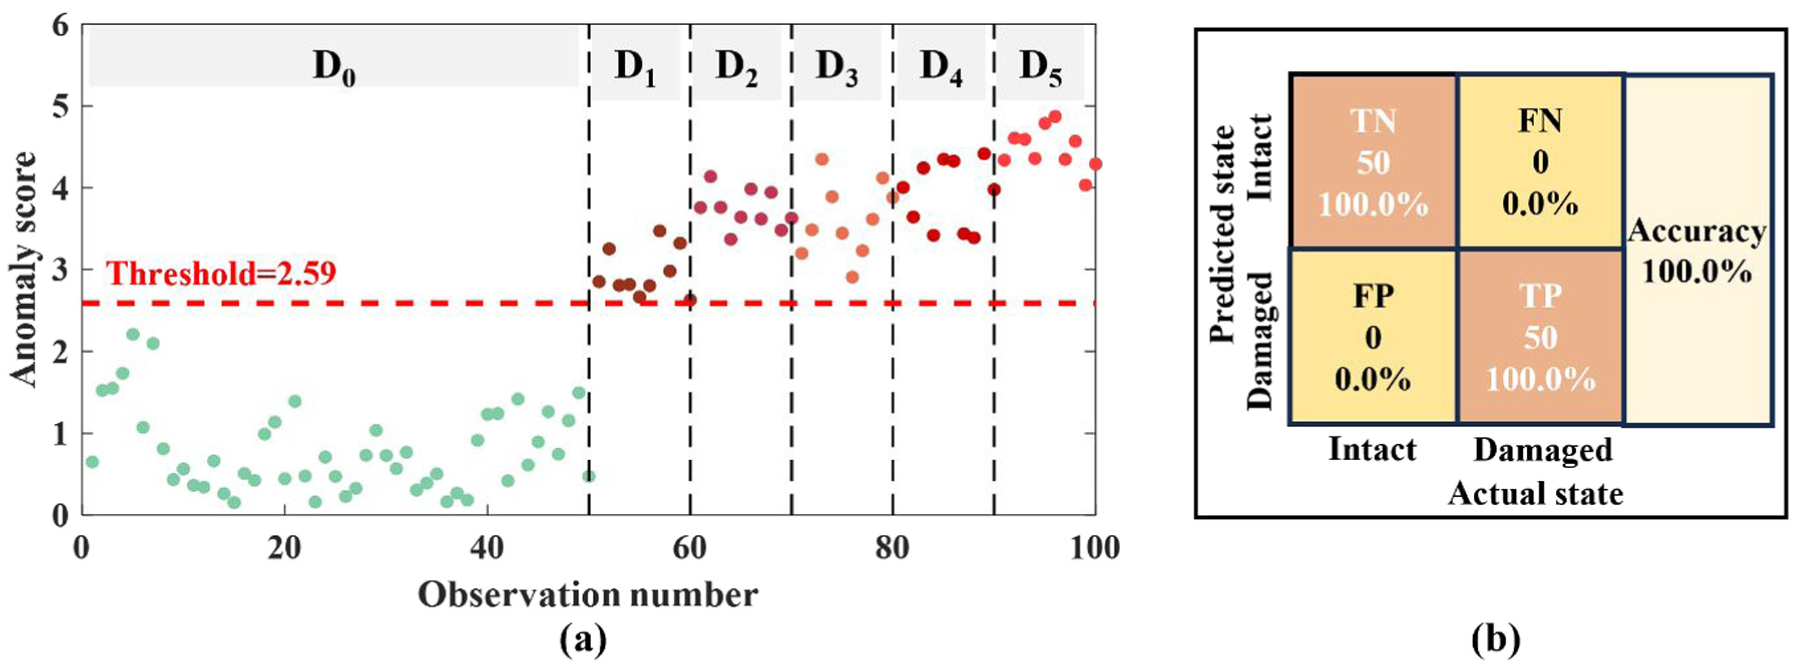
Anomaly detection results for the testing dataset in the experimental studies: (a) anomaly scores and (b) confusion matrix.
To further assess the performance of the proposed method, a comparative analysis was conducted using the three alternative approaches developed in the numerical studies. The anomaly scores generated by these three approaches for all datasets in the experimental studies are presented in Figure 20. In addition, a quantitative comparison of the detection results on the testing dataset is provided in Table 5. The results indicate that both FFT-VAE-EVT and TF-AE-EVT achieve lower accuracy compared to the proposed method, TF-VAE-EVT. Although TF-VAE-GD achieves the same accuracy as the proposed method on the testing dataset, it exhibits inferior performance in both the training and validation sets, with seven additional false positives compared to the results shown in Figure 18. Overall, the proposed method outperforms the alternative approaches, providing more satisfactory anomaly detection results.
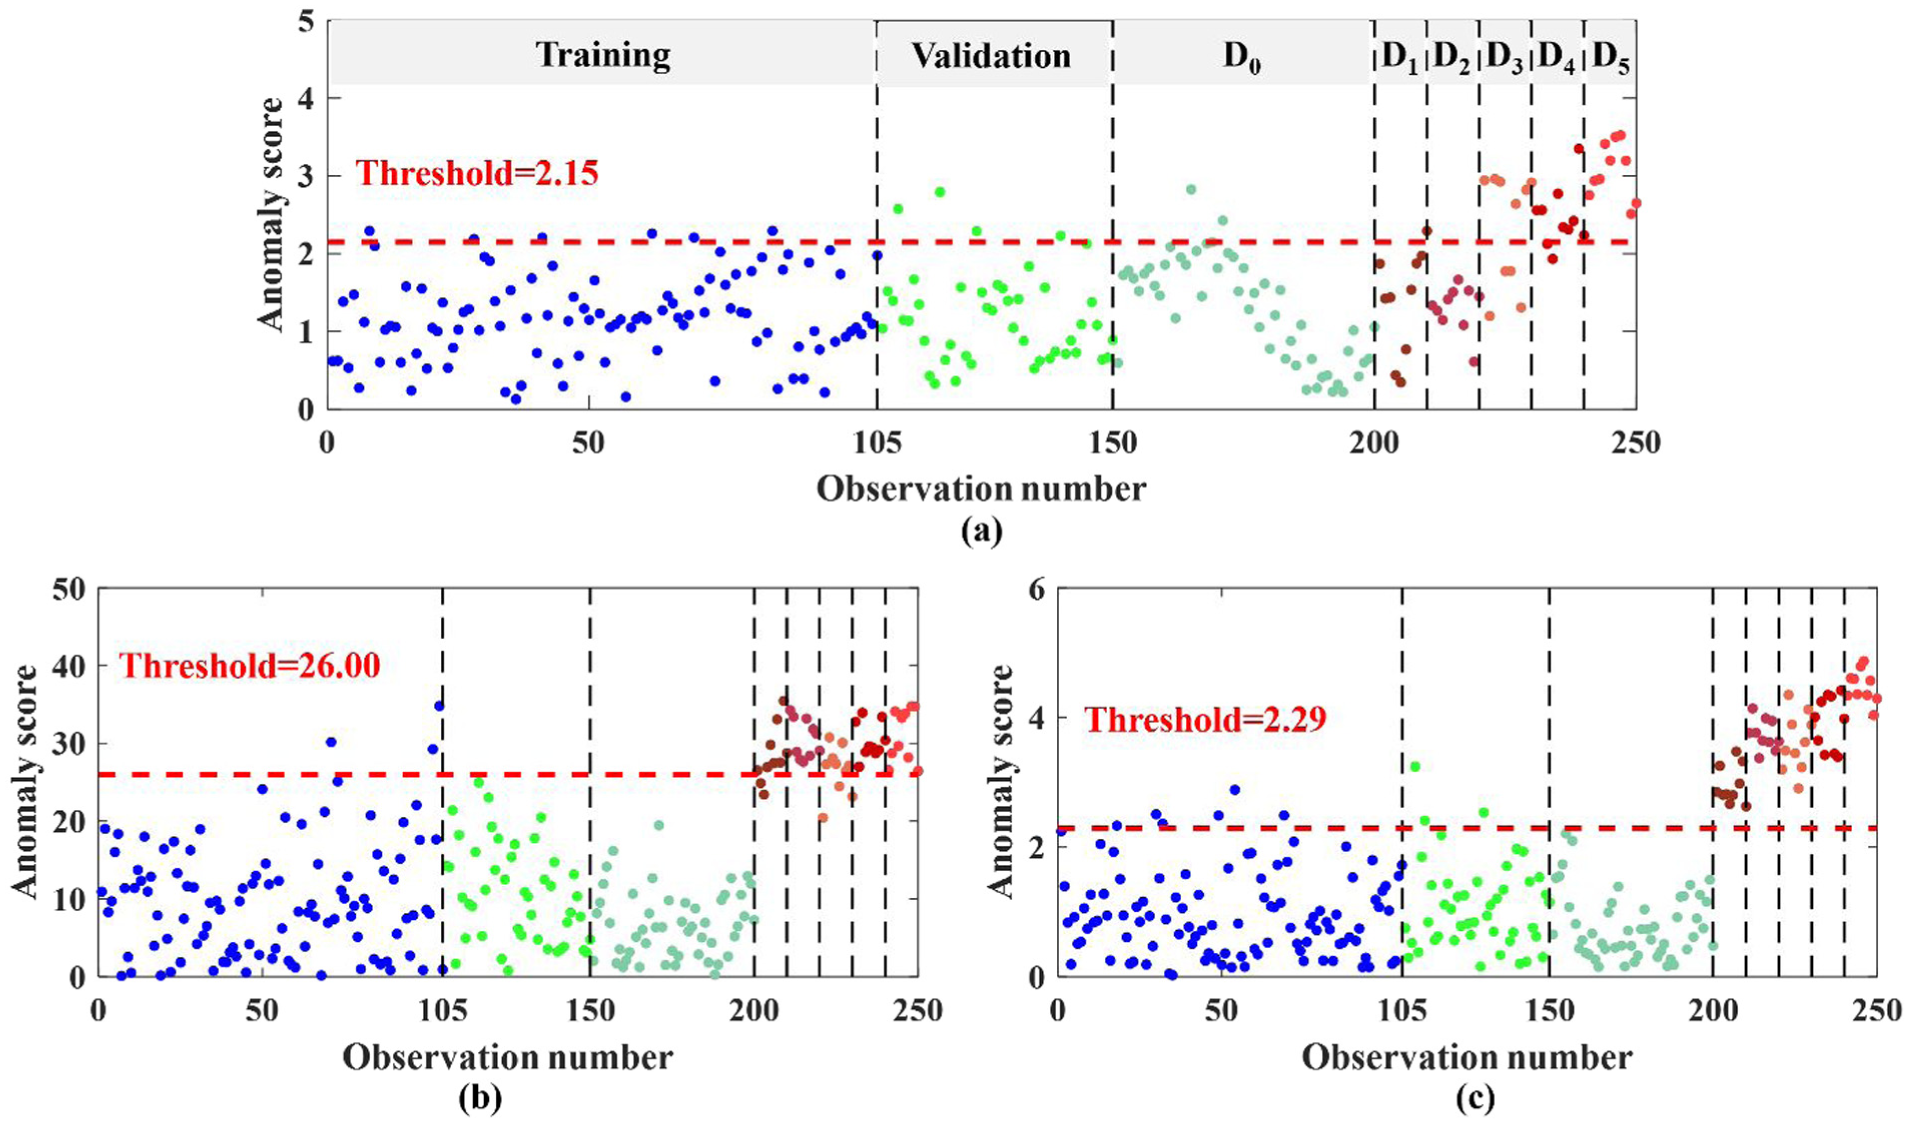
Anomaly detection results in the experimental studies using different methods: (a) FFT-VAE-EVT, (b) TF-AE-EVT, and (c) TF-VAE-GD. FFT: fast Fourier transform; VAE: variational autoencoder; EVT: extreme value theory; TF: transmissibility function; GD: Gaussian distribution; AE: autoencoder.
Quantitative comparison of anomaly detection results in the experimental studies.
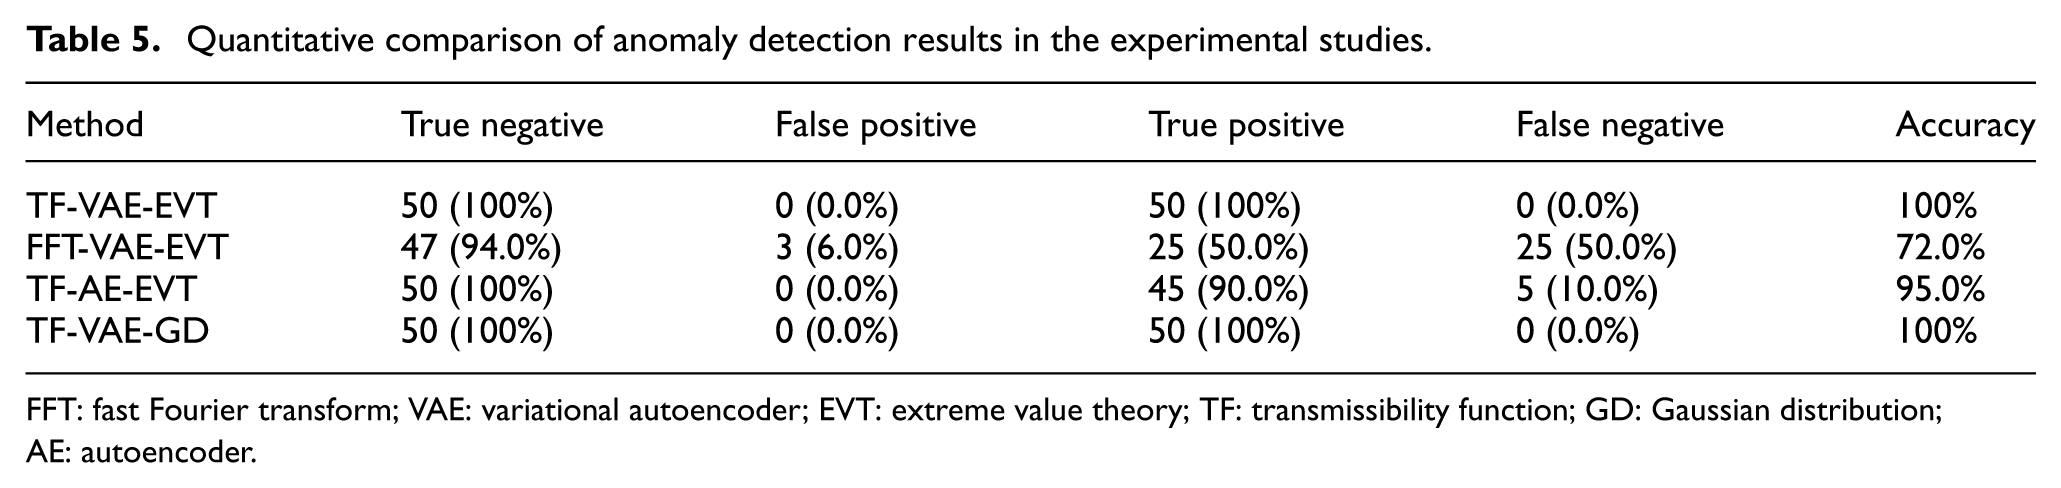
FFT: fast Fourier transform; VAE: variational autoencoder; EVT: extreme value theory; TF: transmissibility function; GD: Gaussian distribution; AE: autoencoder.
Conclusions
Bridge damage detection using responses under moving loads has attracted growing attention in recent years. However, challenges related to load measurement or identification often complicate the detection process. While TF is widely used for damage detection due to its advantage of being insensitive to excitations, most existing research has focused on TF under fixed input or ambient excitations, leaving a gap in understanding its potential under moving loads. This study addresses this research gap by deriving the FE solution for TF under moving loads, offering valuable insights into its fundamental properties. It is shown that TF under moving loads is independent of unknown input spectra when all moving loads travel at the same velocity. Furthermore, the TF can be expressed in terms of the FRFs of the beam and the FTs of elemental shape functions. These theoretical findings establish the TF under moving loads as a reliable indicator of structural condition, laying a solid foundation for developing a moving-load-insensitive anomaly detection method for bridges. By combining the physical properties of TF with the probabilistic feature extraction capability of the VAE, this study proposes a novel bridge anomaly detection method. The method computes input-independent probabilistic feature distances as anomaly scores using KL divergence, which measures the dissimilarity between input-independent probabilistic features under the baseline condition and those under potential damage scenarios. To enhance detection accuracy and reduce false positives, an alarm threshold for anomaly detection is determined using EVT, leveraging its advantage of modeling the tail behavior of anomaly scores. The proposed method was validated through numerical studies on a simply supported beam and experimental tests on a two-span beam. The results demonstrate its effectiveness in detecting structural anomalies under moving loads. Moreover, the observed increase in anomaly scores with higher damage levels suggests the potential of the method to provide relative quantification of damage severity, offering valuable insights for damage assessment. Overall, the proposed property-guided unsupervised learning method represents a meaningful theoretical and methodological advance, paving the way for reliable and efficient anomaly detection in bridges under moving loads.
As an exploratory study, the mathematical derivations in this study are based on the assumption that a moving vehicle can be simplified to several concentrated moving loads traveling at a constant speed. However, future research should investigate the influence of factors such as vehicle-bridge interaction, road surface roughness, and environmental variations on the performance of the proposed method. While the method successfully detected stiffness-related anomalies induced by bolt loosening in the experimental studies, further validation in field tests involving more realistic deterioration modes such as concrete cracking and steel corrosion is essential to assess its practical applicability. In addition, ongoing efforts are directed toward establishing a more straightforward relationship between the TF and the local stiffness parameters of the bridge, aiming to enhance the capability of TF for damage localization and quantification.
Footnotes
Funding
The authors disclosed receipt of the following financial support for the research, authorship, and/or publication of this article: Financial support to complete this study was provided by the Science and Technology Development Fund, Macau SAR (file no.: 0120/2025/AMJ, 0038/2024/RIB1, 0094/2021/A2, 001/2024/SKL, 0002/2025/EQP), the Research Committee of University of Macau (file no.: MYRG-GRG2024-00119-IOTSC, MYRG2025-00270-IOTSC, and MYRG-GRG2024-00175-FST-UMDF), and Guangdong-Hong Kong-Macau Joint Laboratory Program (project no.: 2020B1212030009). The views and opinions in this article are those of the authors and do not necessarily reflect those of the sponsors.
Declaration of conflicting interests
The authors declared no potential conflicts of interest with respect to the research, authorship, and/or publication of this article.