
Abstract
Structural health monitoring (SHM) based on electrical resistance is a promising technology for ensuring the integrity of engineering structures. While electrical resistance measurement is effective for monitoring damage, extracting information related to the target damage from resistance signals typically requires additional signal decoupling techniques. To circumvent this limitation, this article proposes a crack monitoring method that provides a distinct damage signature based on the electrical double-layer capacitance effect. The core concept is that the ingress of an electrolyte into a crack alters the monitoring circuit from a purely ohmic to a capacitive system. This transformation generates a unique charge–discharge signature monitorable using a polarity-reversing voltage. The method was validated through theoretical modeling and experiments on short carbon fiber-reinforced polymer-matrix composites. Results confirm that this charge–discharge signature serves as a reliable qualitative indicator of crack presence. Furthermore, the method demonstrates excellent robustness across a wide range of applied voltages (0.5–5 V) and electrolyte concentrations (0–25/100 g water NaCl solution), showing high tolerance to crack orientation and location on nonplanar structures. By shifting the focus from interpreting quantitative resistance variations to recognizing a physically grounded capacitive signature, this study provides a novel perspective for crack monitoring, enabling more definitive damage identification in complex environments.
Keywords
Introduction
Advanced composite materials, formed by introducing conductive fillers (such as short carbon fibers (SCFs)) into an insulating polymer matrix, have found widespread applications in critical fields such as aerospace,1,2 smart wearables,3,4 wind power, 5 and civil engineering6–8 due to their excellent mechanical properties and specific functionalities, including electrical conductivity and sensing. However, while the incorporation of functional fillers enhances performance, it often leads to reduced toughness and increased brittleness. This alters the failure mode of the material from plastic yielding to brittle fracture.9,10 Consequently, real-time monitoring of the structural integrity of these composites—particularly the monitoring of microcracks at an early stage—is crucial for ensuring safety and preventing catastrophic failure.
Structural health monitoring (SHM) provides a viable solution for ensuring the safety and reliability of engineering structures by enabling real-time monitoring and evaluation of damage. Among various SHM strategies, leveraging the inherent electrical properties of conductive composites for in situ damage monitoring has become a research hotspot in recent years, owing to advantages such as self-sensing capabilities, distributed measurement, and low cost.11–14 Current electrical monitoring methods primarily include electrical resistance tomography,15,16 direct resistance measurement,17,18 and resistance network models.19,20 The core principle of these methods is that internal damage (e.g., cracks) disrupts the conductive network, causing changes in the global or local electrical resistance, thereby enabling in situ crack perception.21,22 Jiang and Wu
23
monitored bending cracks in nano-carbon black/steel fiber concrete under three-point bending, revealing a logarithmic relationship between the fractional change in resistance (FCR) and crack opening displacement, where the sudden FCR increase indicates the initial cracking load. Kim
24
constructed hierarchical composites by growing multiwalled carbon nanotubes (MWCNTs) directly on CF fabrics via chemical vapor deposition; their double cantilever beam tests established a correlation between resistance change and crack length, confirming that the MWCNT-enhanced composites exhibited significantly improved sensitivity (∼30%) during interlaminar fracture. Similarly, Ding et al.
21
fabricated self-sensing cementitious composites with hierarchical CF-CNT fillers for maglev girder monitoring, where engineering tests showed a sudden change in electrical signals upon crack occurrence. Al-Bahrania and Cree
25
established an inverse relationship between the irreversible postimpact resistance change and the energy absorption capacity in MWCNT/glass/epoxy nanocomposites. This electrical parameter serves as a damage factor for partial damage quantification. Gao et al.,
26
in their study on the cyclic electrical response of carbon nanotube network-embedded composites, proposed the damaged resistance change (
Furthermore, researchers have extracted specific features from resistance changes and utilized third-party verification to validate their relationship with cracks. Chen et al.
27
achieved in situ damage monitoring by embedding mesh-structured piezoresistive sensors in glass fiber-reinforced composites, demonstrating that the peaks in the derivative of the resistance versus strain curve characterize damage initiation and propagation stages, showing good correlation with acoustic emission signals. Roshan et al.
28
developed self-sensing cement-sand with multi-walled carbon nanotubes (MWCNTs)/graphene nanoplatelets (GNPs) They characterized crack initiation and propagation using abrupt peaks in the
However, the ultimate goal of monitoring methods is the definitive evaluation and quantification of damage. While electrical resistance measurement is a highly sensitive technique, distinguishing damage-induced resistance changes from environmental fluctuations remains a challenge in practical applications. On the one hand, due to the material’s piezoresistive nature, operational strain can induce resistance variations. On the other hand, the resistance baseline is susceptible to environmental factors such as temperature, 29 humidity (or water 30 ), contact conditions,31,32 and creep behavior. 33 Since these factors all manifest as quantitative changes in resistance values, strictly decoupling the crack signal from these environmental interferences often requires complex compensation algorithms. Consequently, in complex environments, additional algorithms are often required to decouple the resistance information related to target damage (e.g., cracks) from the superimposed resistance changes, thereby achieving an accurate assessment of crack presence. This objective can be approached by establishing generalized correlations between cracks and electrical parameters through extensive testing or machine learning—relationships that are validated by third-party means.34,35 Alternatively, it necessitates the development of an electrical monitoring method that exhibits a characteristic response specific to a particular type of damage, such as cracking.
Proceeding from the second approach mentioned above, this study proposes a novel crack monitoring method for conductive composites within a specific resistivity range based on interfacial electrochemical effects. The core concept is that when an electrolyte (e.g., NaCl solution) infiltrates a crack in the composite, an electrical double-layer (EDL) forms at the interface between the conductive filler and the electrolyte.36,37 This structure is electrically equivalent to a tiny capacitor, and its emergence fundamentally alters the electrical characteristics of the monitoring circuit. Unlike traditional methods, this approach aims to capture a qualitative change—a shift from a purely ohmic to a capacitive response—following crack initiation. By applying a polarity-reversing direct current (DC) voltage, this qualitative change can be clearly identified through the characteristic charge–discharge signature in the current response. Since this characteristic signal emerges where none existed previously (representing a qualitative emergence from a null baseline), rather than manifesting merely as a numerical variation, it offers distinct advantages. While environmental factors (e.g., strain-induced changes or moisture absorption) may alter the magnitude of the equivalent capacitance,38–40 they do not by themselves reproduce the characteristic overshoot–decay transient observed after electrolyte ingress into the crack under the present monitoring configuration. Therefore, this method provides a crack-associated capacitive signature for scenarios in which crack initiation is accompanied by electrolyte ingress, offering a potentially reliable monitoring strategy in complex environments.
This article first elucidates the physical mechanism of the proposed method and then establishes an equivalent circuit model to characterize the EDL and its role within the monitoring system. A series of experiments were subsequently conducted using conductive SCF-reinforced polymer-matrix composites (SCFRPCs) to systematically validate the method. We further examined the influence of parameters such as voltage, concentrations of the electrolyte, and crack geometry (angle, position) on the monitoring signal. The results demonstrate that this method maintains strong robustness and applicability even for complex, nonplanar structures, thereby providing an innovative, highly reliable, and low-cost solution for the SHM of advanced composite materials.
Principle of the monitoring method
Monitoring principle
The physical basis of the crack monitoring method proposed in this article is the capacitive effect of the EDL, which forms at the interface between the conductive filler and the electrolyte after the electrolyte enters a crack in the conductive composite. In its pristine state, the material’s conductive network predominantly exhibits ohmic characteristics under DC testing conditions. However, in scenarios such as composite pipelines and CFRP wings41,42 where contact with electrolytes occurs during service, once a crack forms, electrolytes like transported fluids or environmental moisture may enter the crack, as shown in Figure 1(a) and (b). The conductive fillers (such as SCFs) within the conductive composite are excellent electronic conductors, whereas the aqueous medium that infiltrates the crack acts as an ionic conductor due to the presence of impurity ions. According to electrochemical principles, when these two types of conductors come into contact, an EDL structure with a thickness on the nanometer scale naturally forms at the macroscopic interface. This structure can store a large amount of charge, rendering it electrically equivalent to a capacitor. 43 Consequently, a significant equivalent capacitance is introduced into the monitoring circuit, fundamentally altering the electrical response of the entire system.
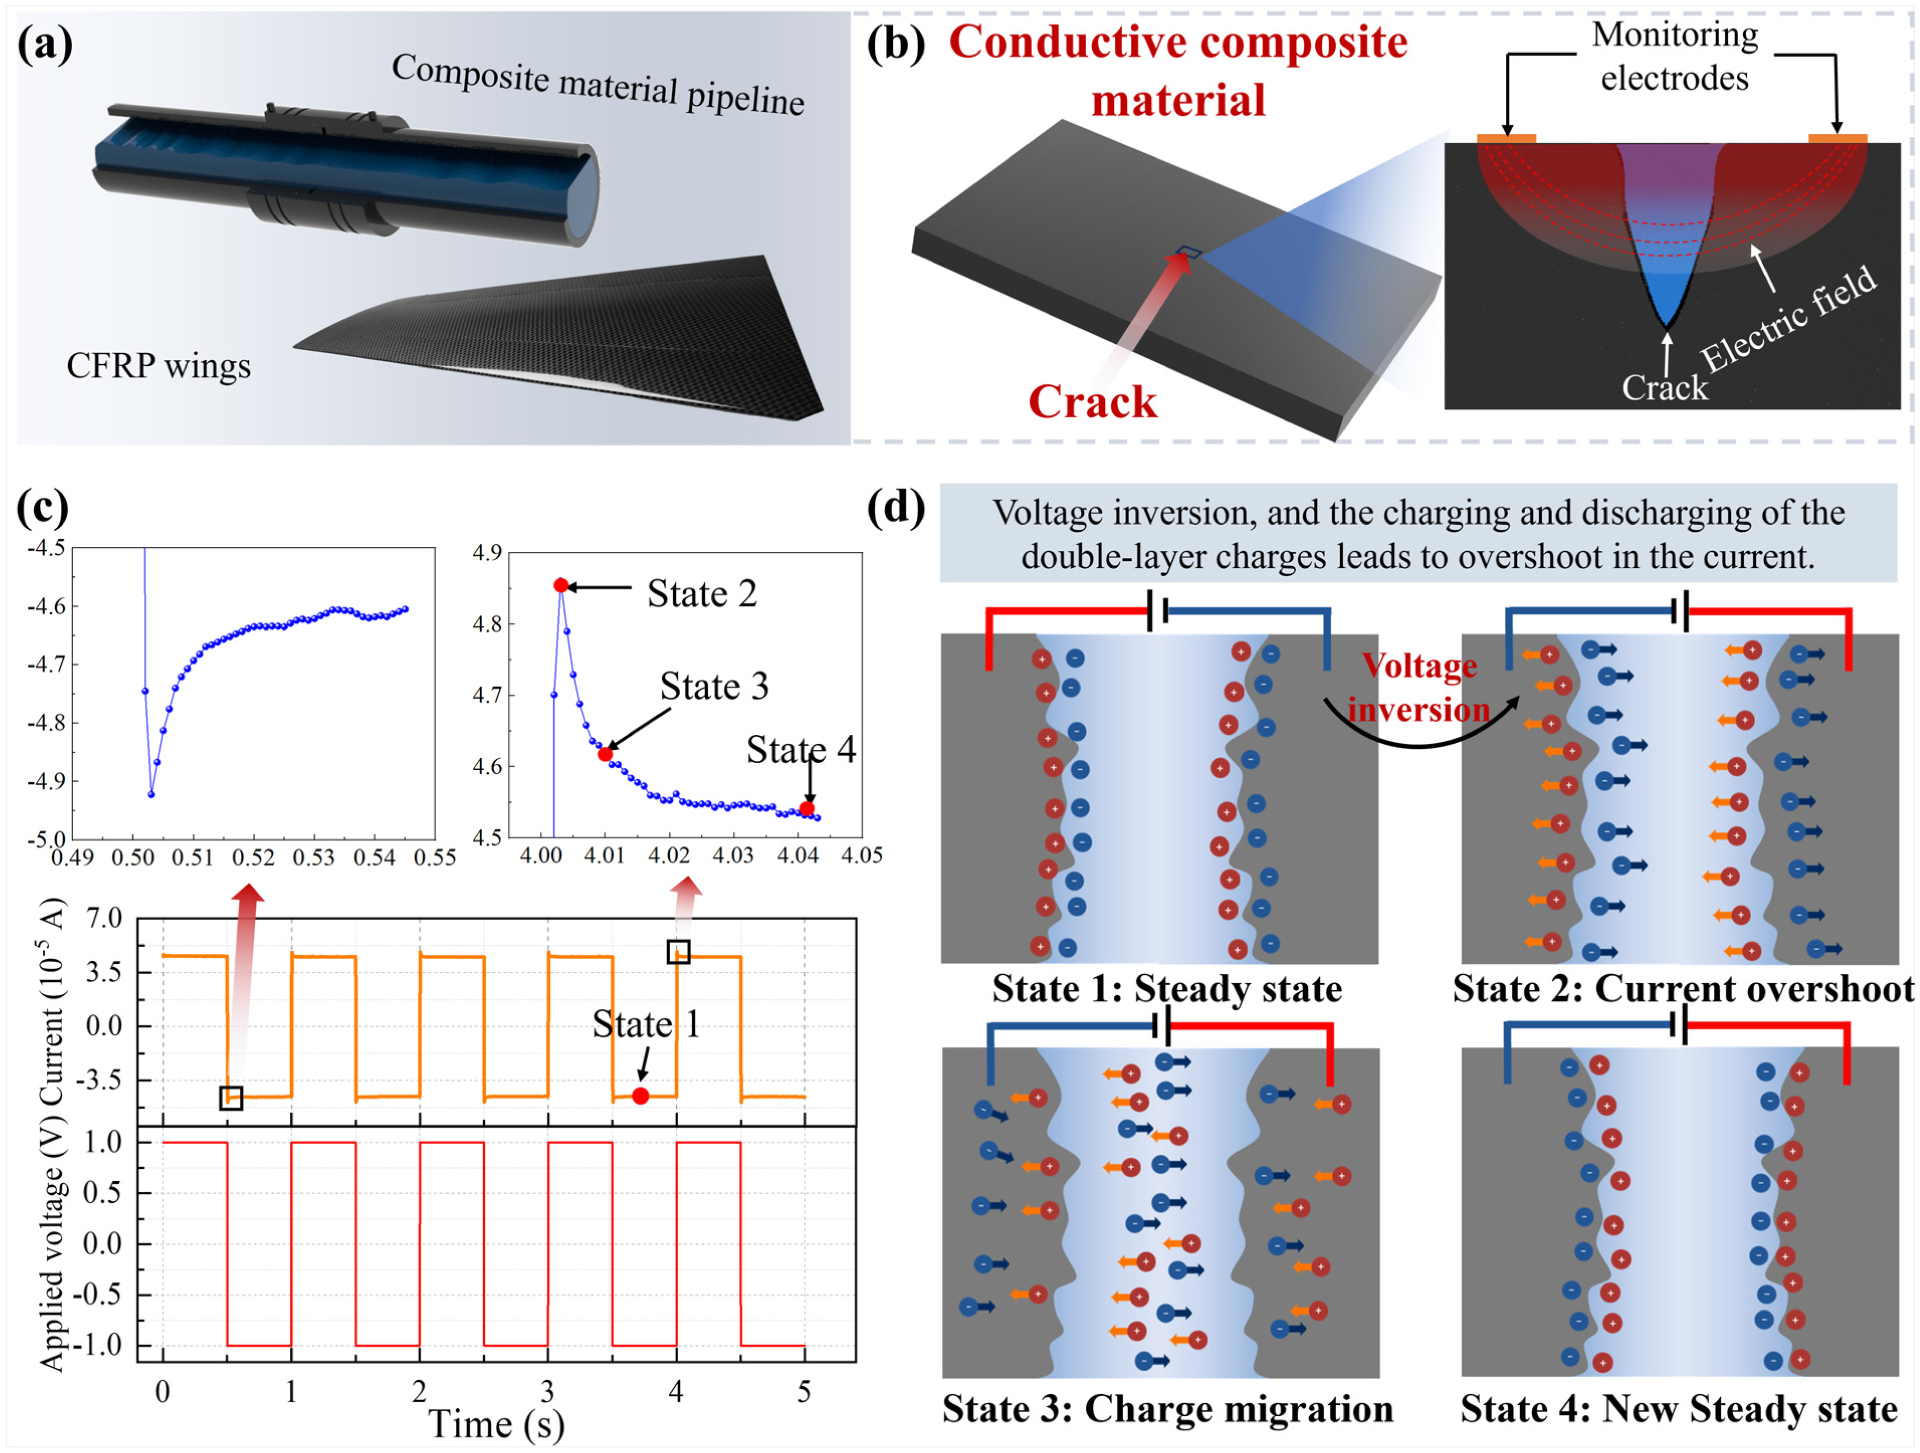
Principle of the proposed monitoring method: (a) scenarios with electrolytes present in the service environment, such as composite pipelines and CFRP wings; (b) schematic of an electrolyte-filled crack in a conductive composite; (c) the characteristic charge–discharge signature observed in the current response upon reversal of the applied voltage; and (d) the underlying interfacial mechanism showing four key stages: steady state, current overshoot, charge migration, and a new steady state. CFRP: carbon fiber-reinforced polymer.
This crack-induced capacitance can be clearly identified by applying a DC voltage of alternating polarity: when the monitoring circuit is purely ohmic, the current reverses instantaneously with equal magnitude upon voltage polarity reversal; however, when a significant equivalent capacitance exists in the circuit, the current reversal is accompanied by a transient current overshoot, where the excess charge originates from the charge stored in the capacitor. The dynamic response process is illustrated in Figure 1(c) and (d). When a constant voltage is applied across the material, ions within the electrolyte migrate under the electrostatic force toward the oppositely charged crack walls and gradually accumulate, creating a charging current. As the charging process concludes, the current stabilizes at a steady-state value (state 1). At this point, if the voltage polarity is abruptly reversed, the charge previously accumulated in the EDL is rapidly released and moves in the opposite direction under the new electric field. This generates a transient discharge/recharge current greater than the steady-state current, which manifests as a distinct current overshoot peak in the measurement curve (state 2). The ions subsequently migrate and accumulate on the other crack wall (state 3), and the system once again reaches electrochemical equilibrium under the new voltage direction, with the current decaying back to a stable state (state 4). This transient process, comprising a “steady-overshoot-decay” sequence, serves as direct evidence of the presence of a crack.
To support the physical interpretation of this method, the dry-crack and electrolyte-filled-crack states were compared using both frequency-domain and time-domain measurements. The results show that the dry specimen does not exhibit an observable polarity-reversal overshoot under the present monitoring conditions, whereas electrolyte ingress into the crack introduces a clear transient overshoot–decay response. This contrast indicates that liquid ingress adds a substantial interfacial charge-storage contribution to the overall electrical response of the system.
The implementation of this monitoring method remains straightforward for engineering applications. It requires no complex sensor architecture; simply applying an alternating square-wave voltage via electrodes and monitoring the current response is sufficient to obtain the electrical characteristics of the damage-specific response associated with structural cracks, thereby determining structural integrity.
Theoretical analysis
To analyze the electrical response of the system depicted in Figure 1, we propose an equivalent circuit model, as illustrated in Figure 2(a), to describe the current flow within the monitoring circuit under an applied voltage. Upon the application of an electric field, the current is partitioned into two primary pathways. The first, designated as path 1, traverses the crack. This path originates at one electrode and sequentially passes through the SCFRPCs (RS), the first EDL, the electrolyte (RW), the second EDL, and the subsequent section of the SCFRPCs (RS) before reaching the opposite electrode. The second pathway, labeled path 2, bypasses the crack entirely, flowing directly through the bulk SCFRPCs, which act as a shunt resistor RX. For path 1, the EDL structure at each crack face is modeled by a parallel combination of a double-layer capacitance, C, and a charge-transfer resistance, RCT. Physically, RCT represents the resistance to faradaic processes (i.e., charge transfer via electrochemical reactions) occurring at the EDL interface.44,45 The aqueous solution is treated as an ohmic resistor RW. For path 2, the bulk composite material that shunts the current around the crack is modeled as a single resistor, RX.
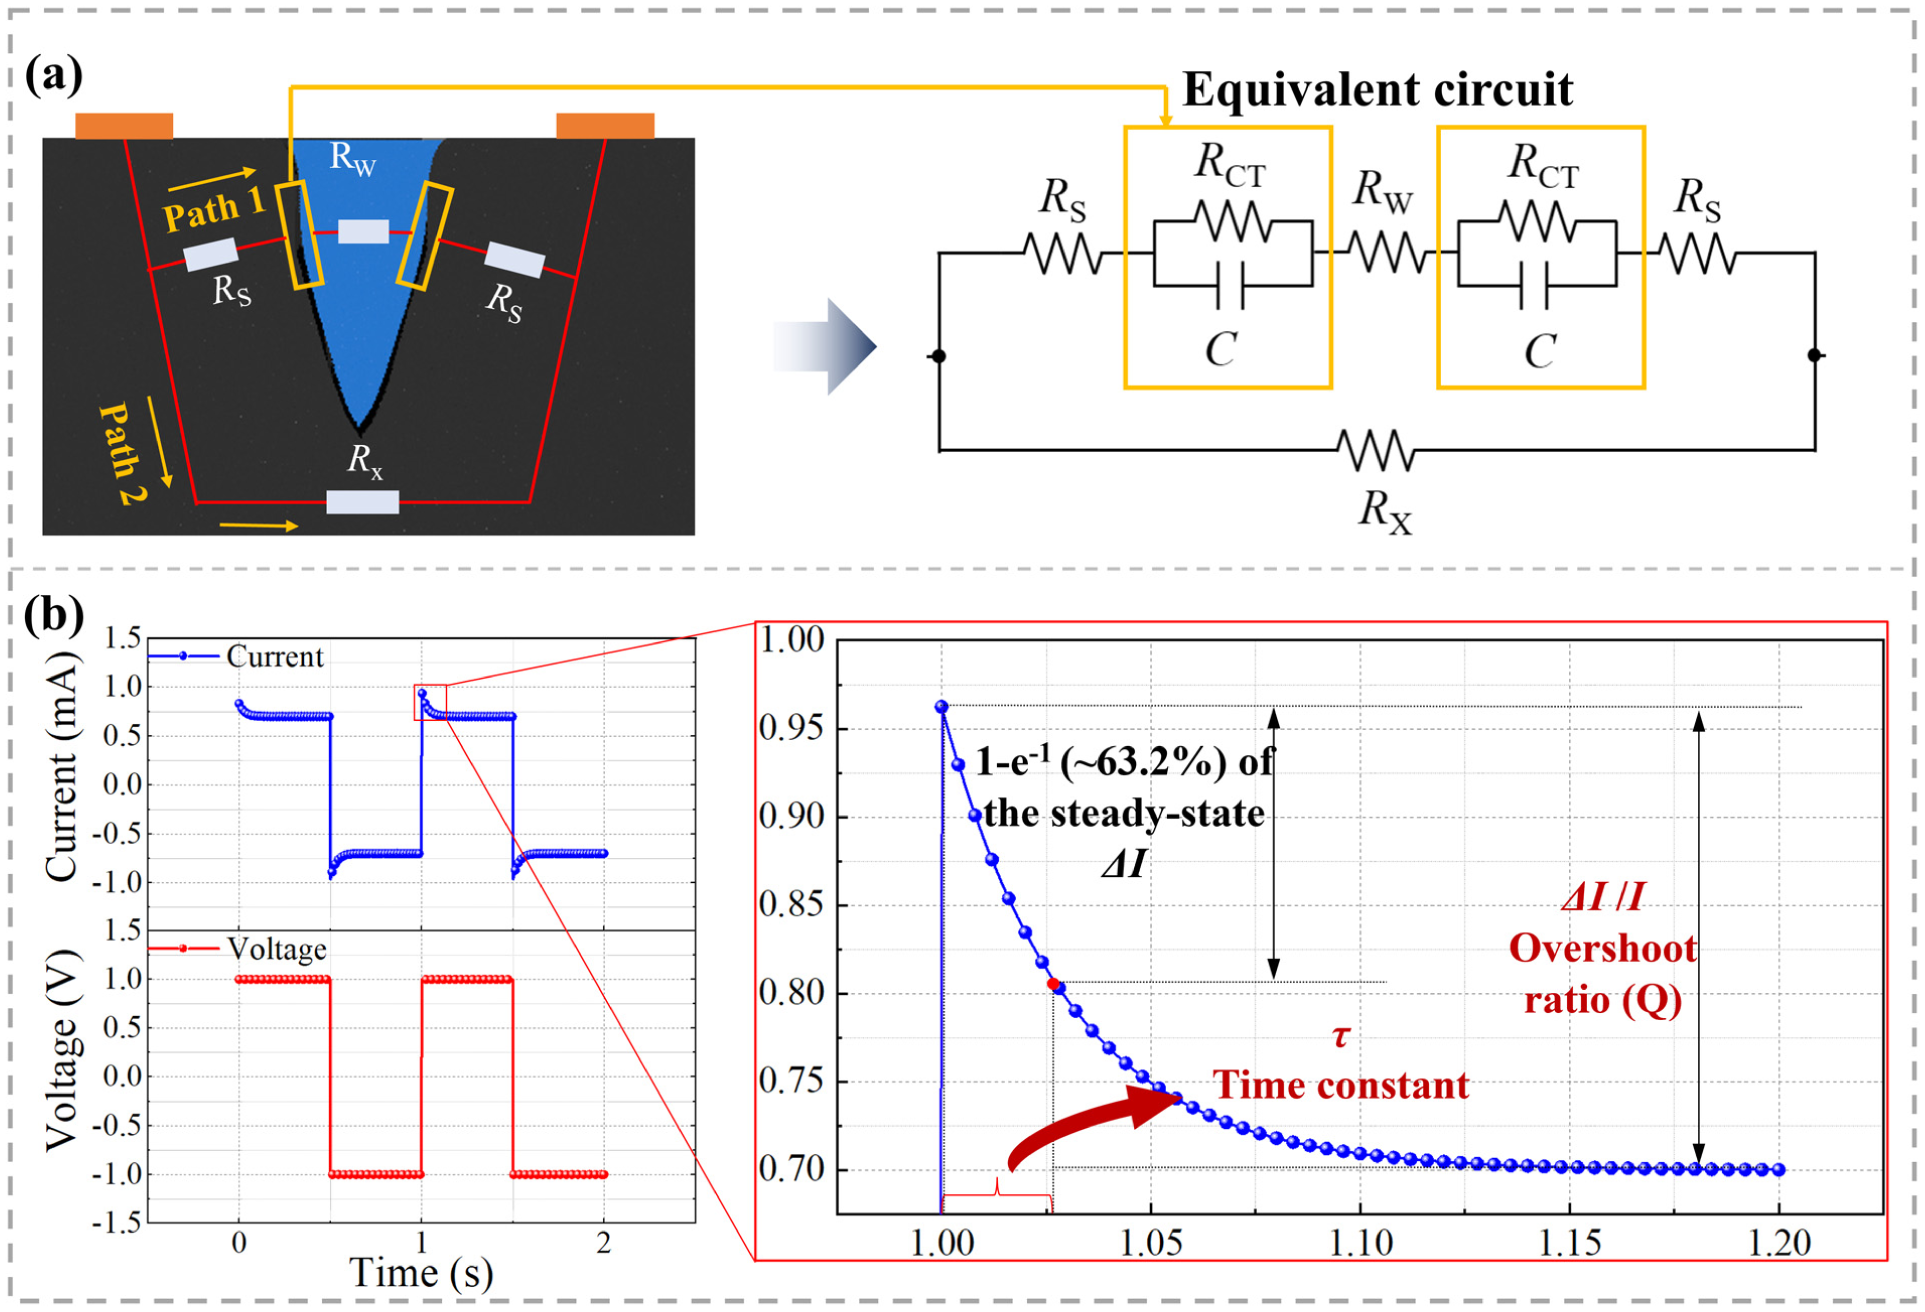
Equivalent circuit model and key characteristic parameters: (a) construction of the equivalent circuit model, illustrating the partitioning of current into path 1 (through the crack) and path 2 (bypassing the crack) and (b) definition of the two key parameters used to characterize the charge–discharge phenomenon: the current overshoot (ΔI) and the time constant (τ).
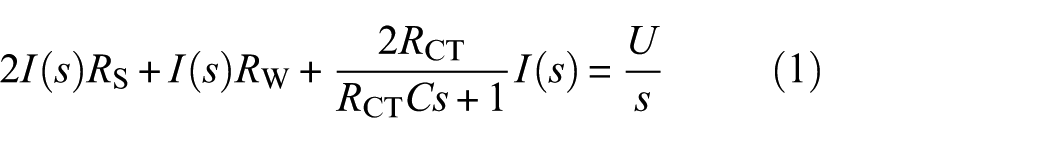
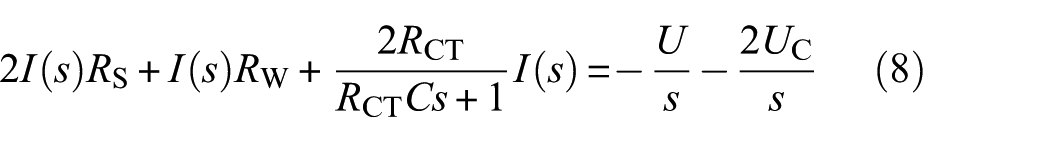
To derive the key electrical quantities that characterize the transient response during voltage polarity reversal, we analyze path 1 of the equivalent circuit shown in Figure 2(a). The time-dependent current response, I(t), is obtained by applying Kirchhoff’s voltage law and solving the resulting differential equation via the Laplace transform. The governing equation for the circuit in the Laplace domain is as follows, where U denotes the magnitude of the step voltage applied across the terminals, and where I(s) represents the Laplace transform of I(t):
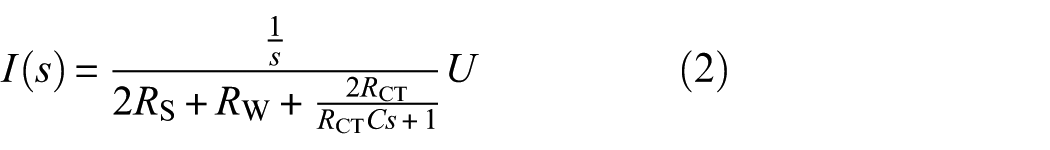
Solving Equation (1) for I(s) yields:
Applying the inverse Laplace transform to convert the expression back to the time domain gives the current through path 1, I(t):
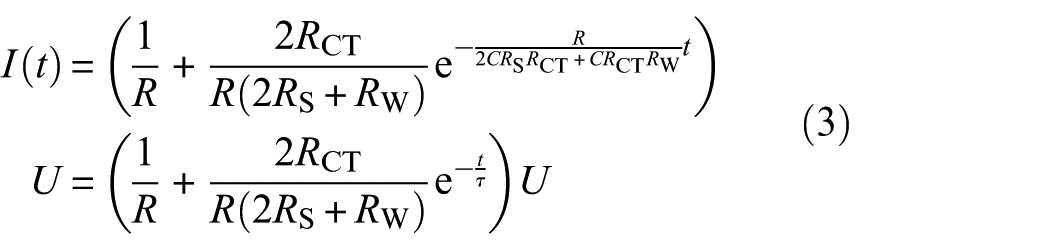
where we define:
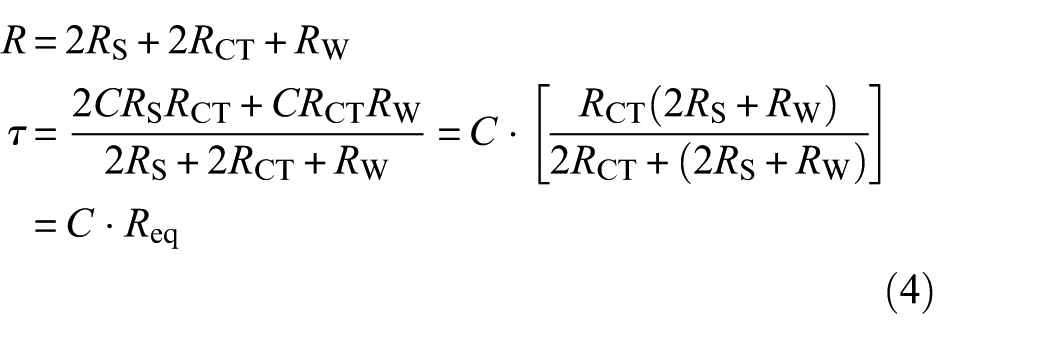
where
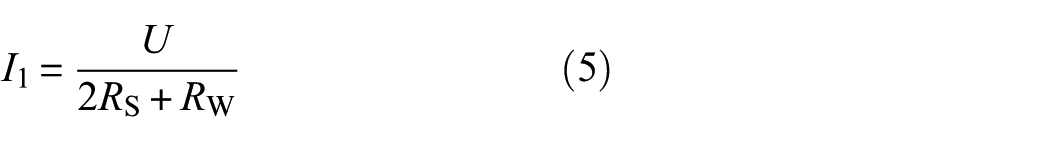
From this equation, the initial current at t = 0 (denoted as I1) can be derived as follows:
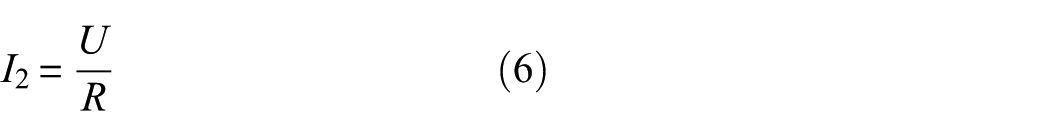
The steady-state current (I2) as t → ∞ is
Note that I1 > I2. This initial overshoot occurs because the first application of voltage must charge the initially uncharged double-layer capacitors, resulting in a transient charging current.
Once the circuit reaches the steady state, the voltage across each capacitor, UC, which is needed to calculate the response after polarity reversal, is

Following a similar procedure, the circuit equation in the Laplace domain after the voltage polarity is reversed (from +U to −U) is formulated via Kirchhoff’s law. Note that the initial voltage on the capacitors now contributes to the response:
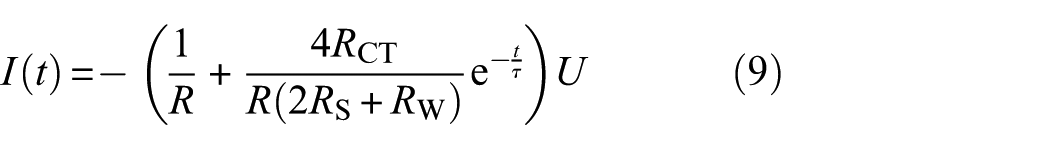
Solving for I(s) and applying the inverse Laplace transform yields the new time-domain current:
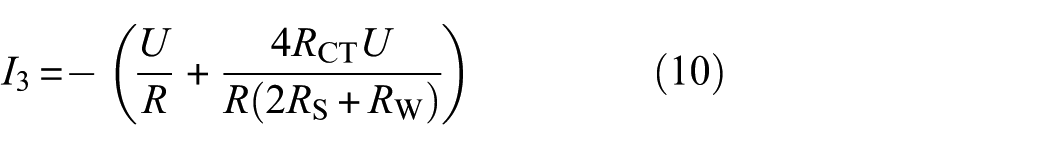
The instantaneous current at the moment of polarity reversal (t = 0 in the new time frame), denoted as I3, is as follows:
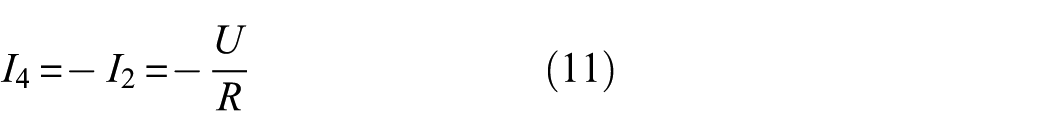
The new steady-state current, I4, is as follows:
The current through the shunt path (path 2),

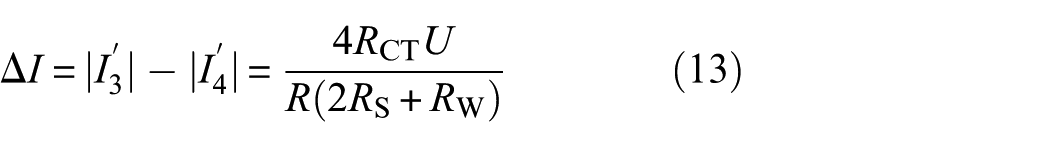
The magnitude of the current overshoot, ΔI, immediately following the polarity reversal is the difference between the peak current and the steady-state current:
Notably, both the time constant (τ) and the magnitude of the current overshoot (ΔI) are independent of the shunt resistance RX. On the basis of the preceding derivations, the magnitudes of the key currents are related as follows:

This inequality explains why the initial overshoot current, observed upon the first application of voltage (t = 0), is smaller than the overshoot generated during subsequent polarity reversals.
Applicable range of material resistivity
Every physical monitoring technique has a specific operational window, and the method proposed herein, which is based on the EDL charge–discharge phenomenon, is no exception. We found that the efficacy of this method is critically dependent on the bulk electrical resistivity of the conductive composite. This dependence not only defines the technology’s scope of applicability but also helps to explain why this conceptually straightforward principle has not been widely exploited for composite monitoring: it requires the material to possess a specific range of electrical conductivity.
To quantitatively assess this effect, we introduce a key dimensionless metric: the overshoot ratio (Q), which is defined as the ratio of the peak current overshoot (ΔI) to the final steady-state current (
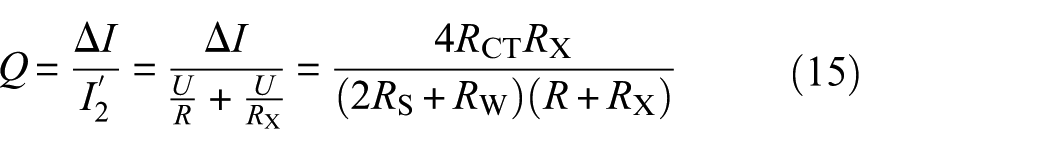
This ratio provides a direct measure of the characteristic signal’s (ΔI) strength relative to the background steady-state current, serving as the primary criterion for determining whether the charge–discharge phenomenon can be reliably monitored. Mechanistically, the material’s bulk resistivity governs the overshoot ratio (Q) by influencing both the series resistance (RS) and the parallel shunt resistance (RX) in the equivalent circuit model. As illustrated in Figure 3(a) and (c), this leads to two limiting cases. For materials with extremely high resistivity (insulators), the total steady-state current (
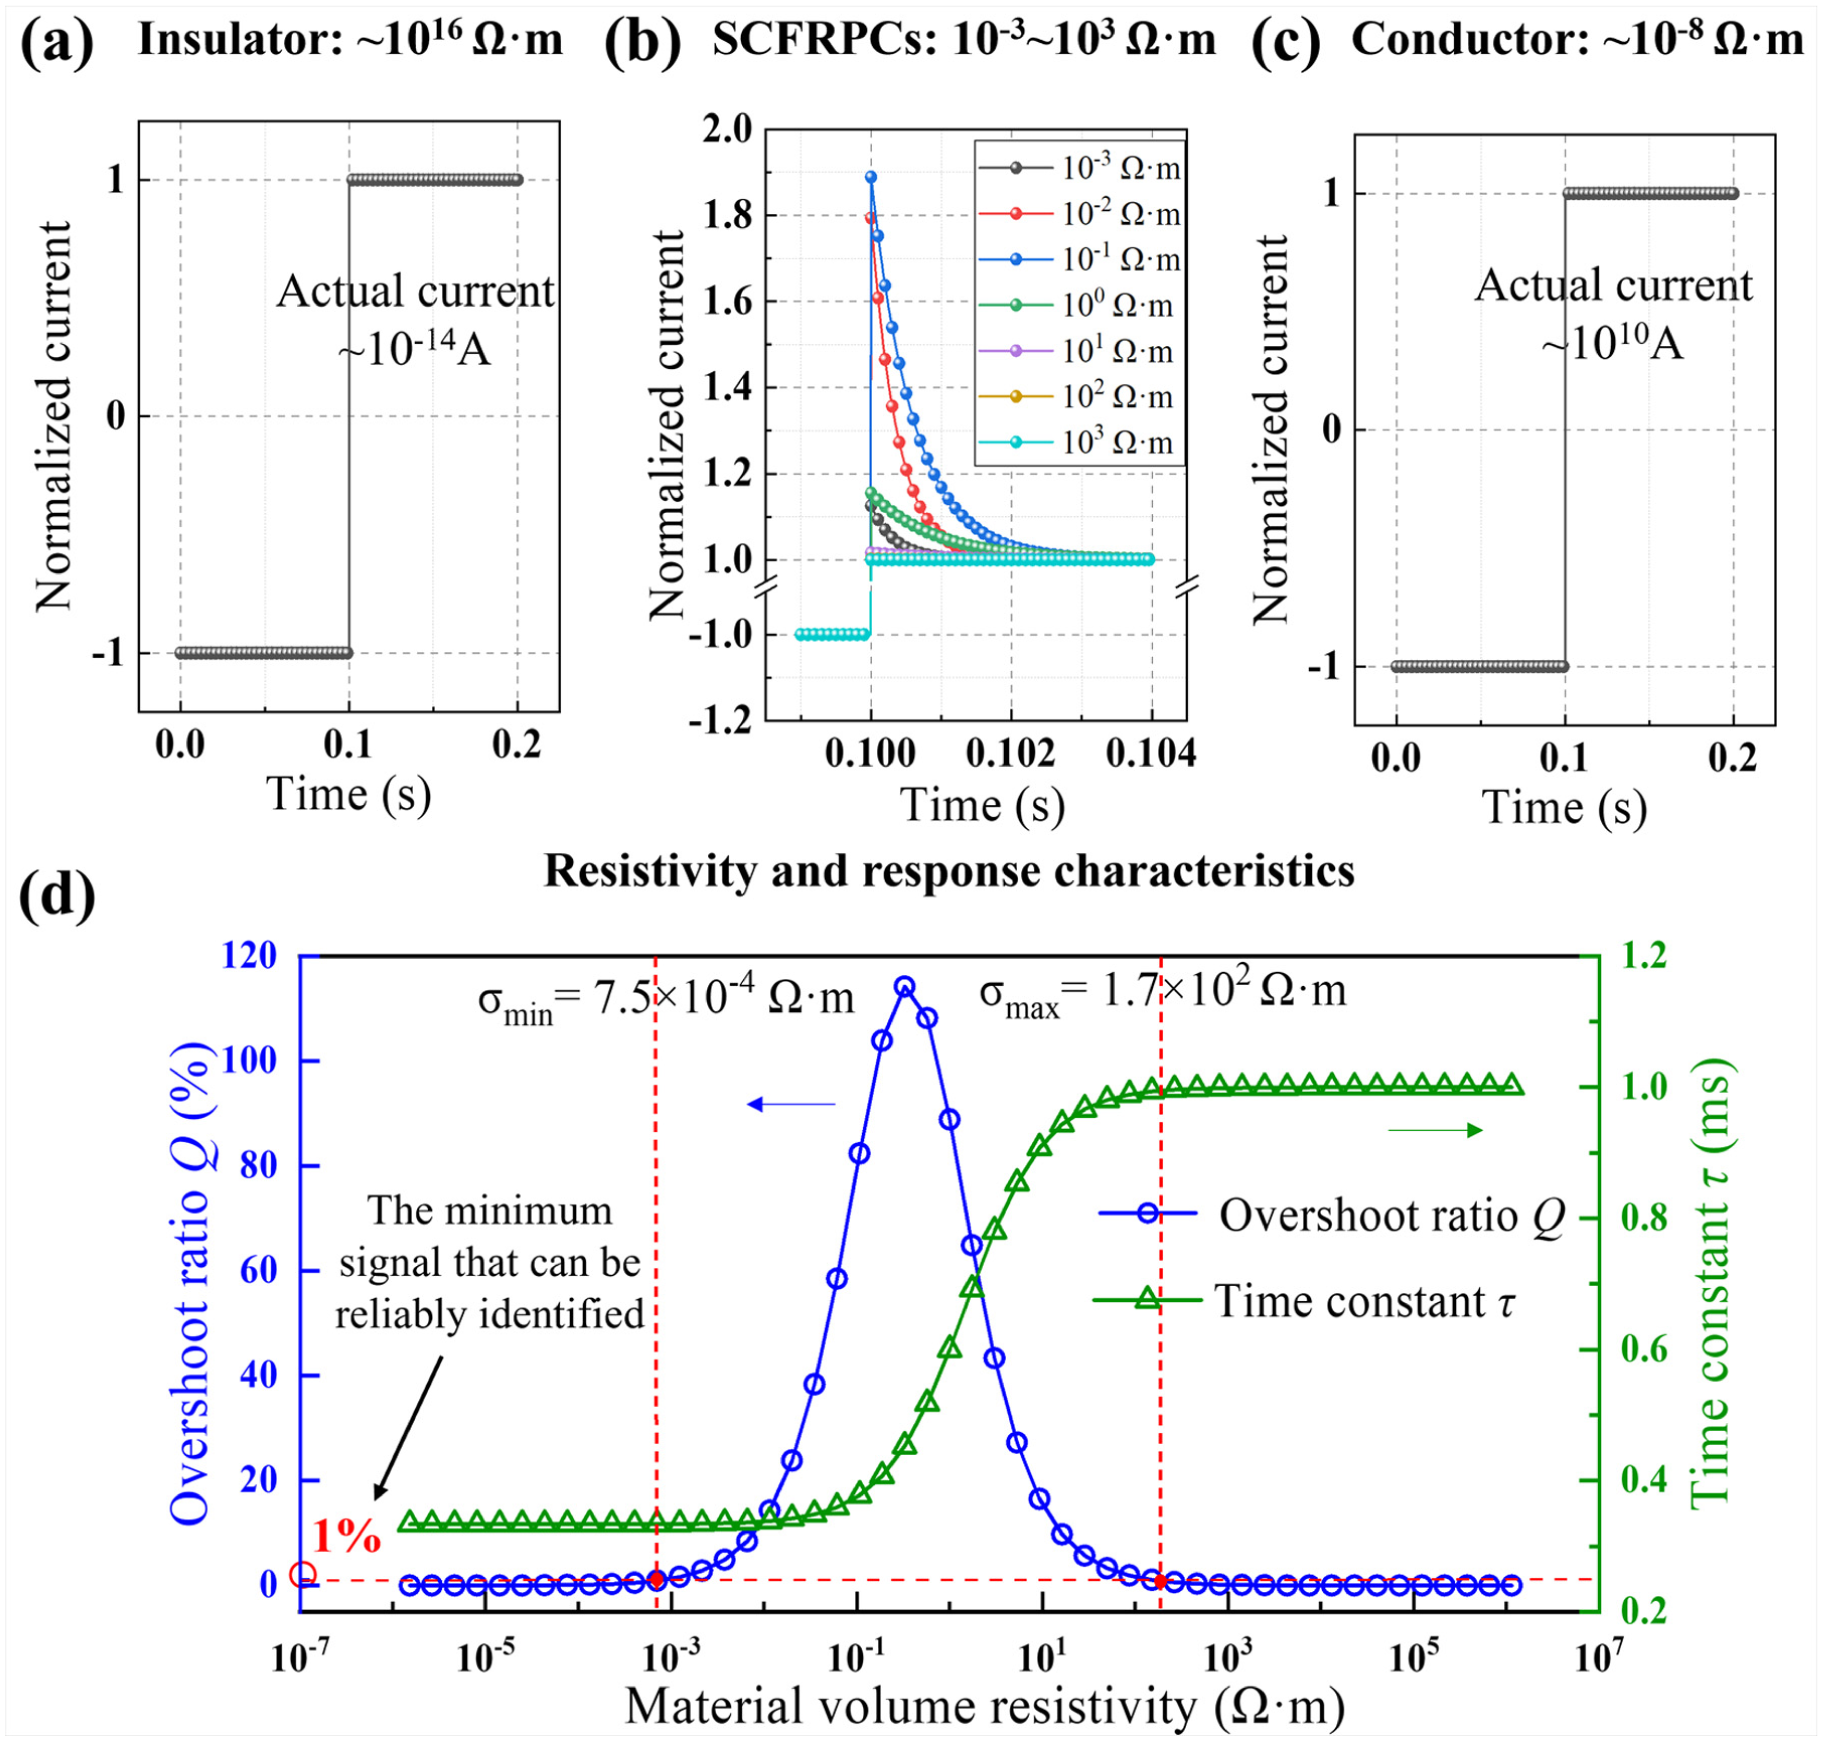
Theoretical analysis defines the applicable resistivity range for the monitoring method. (a–c) Simulated normalized current responses upon voltage reversal for materials with different bulk resistivities: (a) an insulator (∼1016
To quantitatively define the method’s applicable range, we conducted a parametric analysis based on the equivalent circuit model proposed in “Theoretical analysis” section. Importantly, this analysis uses bulk resistivity as a case study to demonstrate a systematic paradigm for establishing the operational boundaries of the method. In this analysis, the interfacial parameters (C and RCT), electrolyte resistance (RW), and geometric factors were held constant, treating bulk resistivity as the sole variable. Figure 3(d) reveals that the overshoot ratio (Q) exhibits a nonmonotonic trend, initially increasing and then decreasing with rising bulk resistivity. By setting a practical monitoring threshold of 1% for Q, the simulation identifies an effective operational window of approximately 10−3 to 102
Finally, it should be noted that the theoretical model developed here is not limited to analyzing the effect of bulk resistivity. It serves as a powerful analytical tool for systematically investigating the influence of other key parameters—such as the electrolyte type, crack dimensions, and interfacial degradation—on the signal efficacy. Consequently, the model can provide tailored design guidance for applying this technology in specific scenarios.
In summary, the theoretical model established in this article provides a solid theoretical foundation for the proposed monitoring method. The model not only elucidates the fundamental reasons for the method’s specific range of applicable material resistivity but also establishes the overshoot ratio and time constant as two key metrics for assessing signal monitorability. The analysis indicates that the signal is most readily captured only when both parameters lie within an optimal range. For example, a large overshoot ratio combined with a small time constant would require a high sampling frequency from the monitoring hardware, whereas a small overshoot ratio could be easily obscured by noise. Furthermore, the model reveals the complex, coupled relationships among various physical parameters under practical conditions. For example, a change in the electrolyte concentration simultaneously affects both the electrolyte resistance (RW) and the EDL interfacial properties (C and RCT) This complexity makes it challenging to predict the response of a real-world system through purely theoretical analysis, thereby necessitating experimental investigation for validation and refinement. Therefore, before this method can be translated into engineering applications, it is crucial to experimentally investigate the core engineering parameters that are decisive for the design of a monitoring system. Accordingly, the subsequent sections of this article focus on investigating the influence of two such factors: the monitoring voltage and the electrolyte concentration. The former, as the excitation signal for the monitoring system, is a primary input parameter whose magnitude must be determined during hardware development, as it directly affects the signal’s characteristics and strength. The latter represents a critical and highly variable environmental factor that has a profound and coupled influence on the entire electrochemical behavior within the crack. It is therefore a key factor in assessing the method’s robustness and operational limits. A systematic study of these two fundamental parameters is thus intended to provide the foundational experimental data and guidance required for parameter optimization and field application of this technology.
Experimental
Materials and specimen fabrication
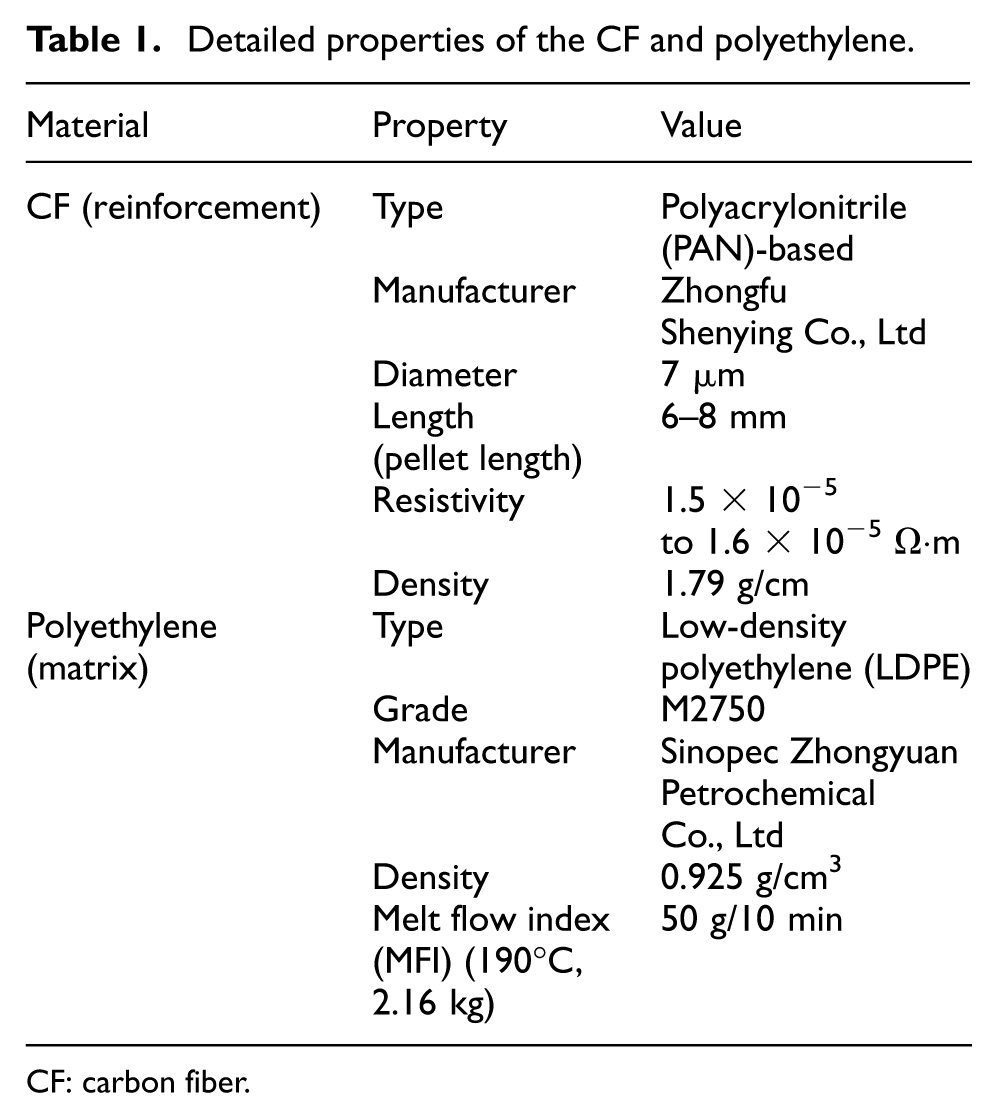
In this study, the SCFRPCs used were SCF-reinforced polyethylene. The key properties of the constituent reinforcement and matrix materials are detailed in Table 1. The fabrication process involved two main stages: the first being the preparation of composite pellets via a continuous fiber impregnation and chopping process, and the second being the manufacturing of test specimens via injection molding. On the basis of the findings of Yao et al.,46,47 an SCF content of 10 wt.% (corresponding to a volume fraction of approximately 5.43 vol%) was selected to ensure that the composite’s bulk resistivity fell within the optimal range determined in “Applicable range of material resistivity” section. The detailed fabrication procedure is schematically illustrated in Figure 4.
Detailed properties of the CF and polyethylene.
CF: carbon fiber.
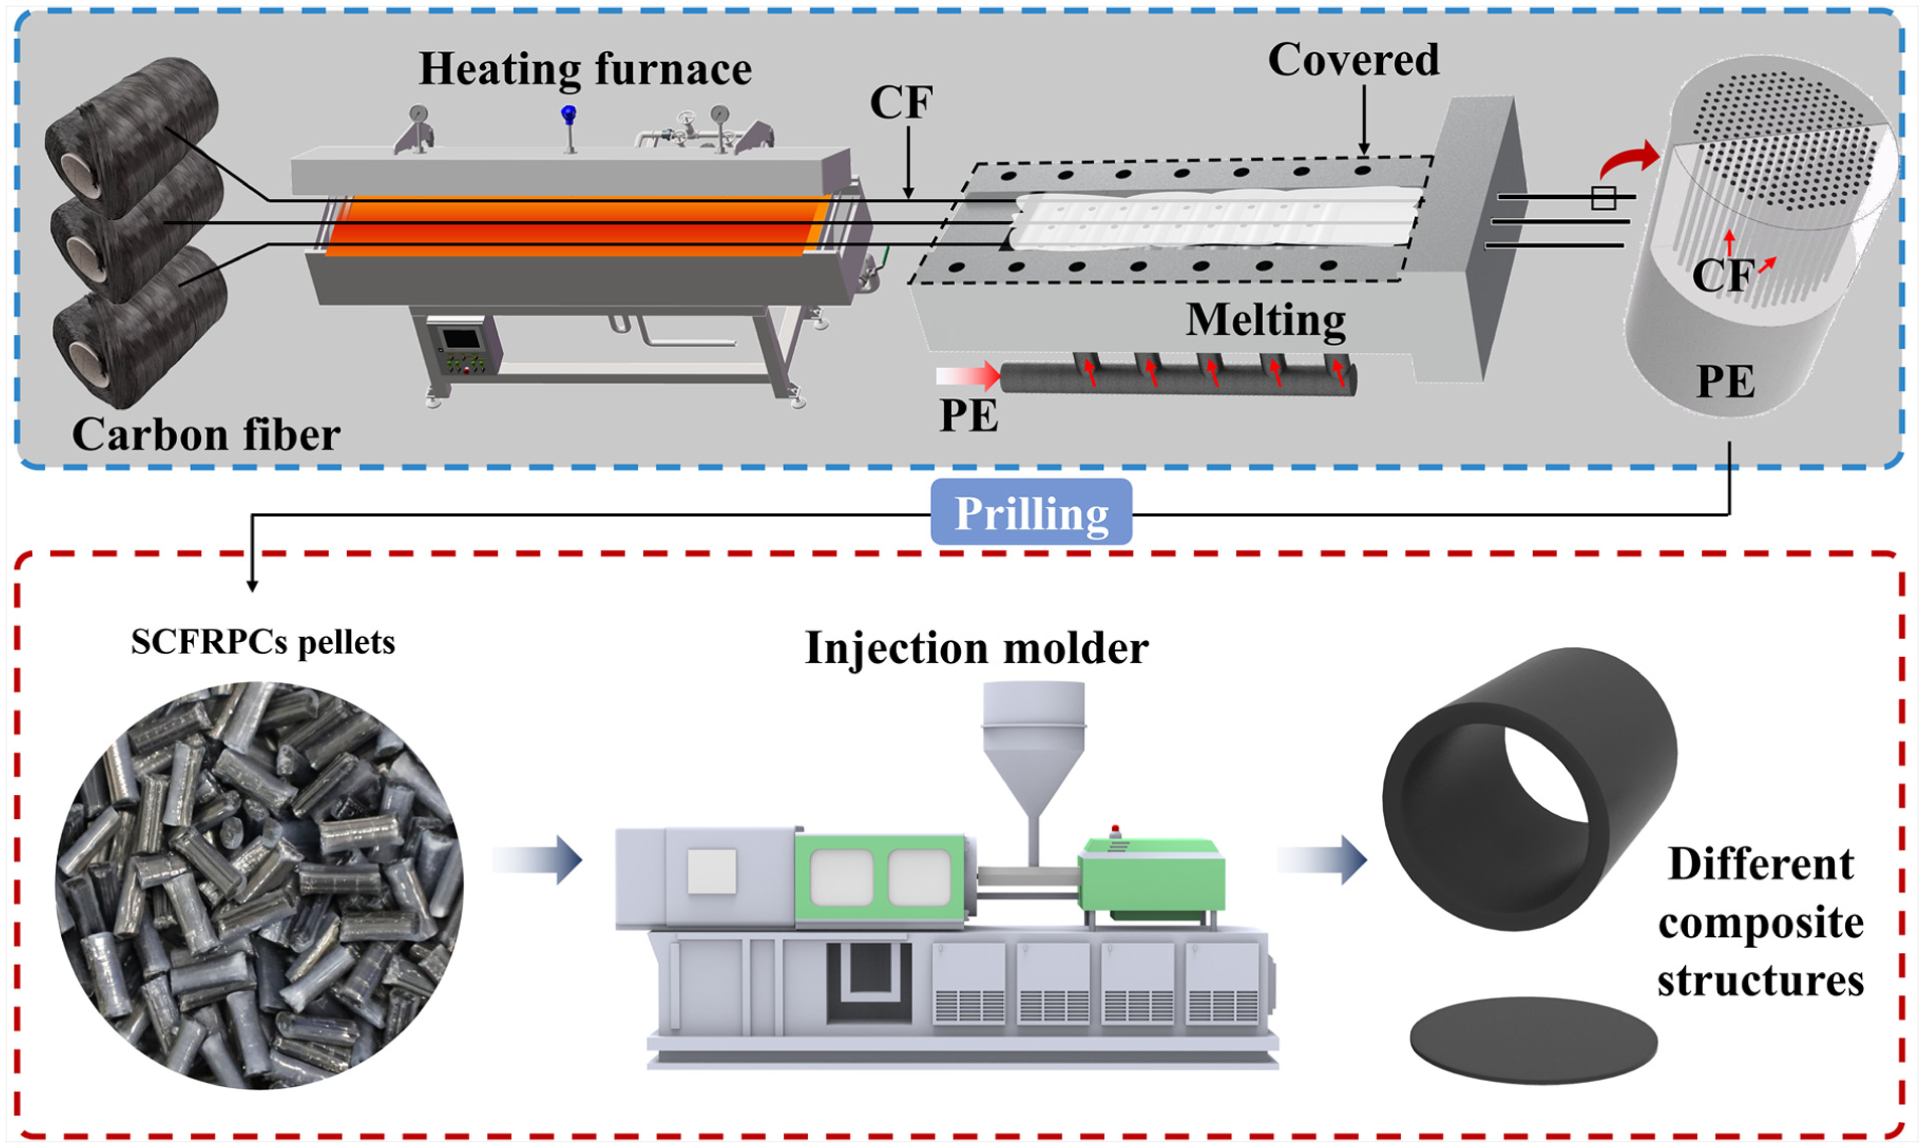
Schematic illustration of the two-stage fabrication process for the SCFRPCs specimens. The first stage (top panel) involves the impregnation of continuous CFs with molten PE to produce SCFRPCs pellets. The second stage (bottom panel) consists of injection molding these pellets into the final cylindrical and disc-shaped specimens. SCFRPC: short carbon fiber-reinforced polymer-matrix composite; CF: carbon fiber.
The first stage focused on the preparation of the SCFRPCs pellets. In this stage, continuous CF tows were drawn from a creel and passed through a continuous electric resistance heating oven for preheating to approximately 120°C. This step was primarily to ensure the removal of any adsorbed moisture from the fiber surface, promoting better adhesion and wetting during impregnation. The preheated fibers were subsequently fed into a custom-designed impregnation die, where they were thoroughly infused with molten polyethylene (PE, M2750) resin to ensure the complete encapsulation of each individual fiber by the PE matrix. After cooling, the resulting continuous composite strands were fed into a pelletizer and chopped into cylindrical SCFRPCs pellets of uniform length.
The second stage involved the injection molding of the test specimens. The SCFRPCs pellets prepared in the first stage were used as the raw material and were thoroughly dried prior to molding. The dried pellets were then loaded into the hoppers of the injection molding machines. During the process, the pellets were heated, melted, and injected into custom-designed molds. By using different molds and specific equipment, two types of specimens were produced for subsequent experiments. First, for fundamental prototype verification, disc-shaped specimens (90 mm in diameter, 2 mm in thickness) were fabricated using a laboratory-grade PNX40III-2A machine (NESSEI Plastic Industrial Co., Ltd, Hanishina, Japan) at an injection temperature of 200°C. Second, to validate the method on a larger structure, hollow cylindrical specimens (110 mm in inner diameter, 13 mm in wall thickness) were produced using an industrial-grade HDW-S500 machine (Ningbo Yalishi Machinery Co., Ltd, Ningbo City, China), also at an injection temperature of 200°C.
The effective bulk electrical resistivity along the longitudinal axis (the primary current path) was measured to be approximately (27.07 ± 0.08)
Experimental setup and procedure
As illustrated in Figure 5, the electrochemical measurements were performed using a CHI660F electrochemical workstation (Chenhua Instruments, Shanghai, China). The chronoamperometry mode was selected for this study, as it allows for the application of an alternating square-wave voltage of varying amplitudes and periods while simultaneously recording the system’s real-time current response. This workstation supports a maximum sampling rate of 1 MHz, allowing us to select the optimal rate for each experiment. For the main crack monitoring demonstrations (e.g., “Validation of the monitoring principle” section), we set the sampling rate to 1 kHz (a 0.001 s interval), which was sufficient to capture the transient phenomena. For the detailed parametric studies (“Parametric study of disc-shaped specimens” section), we used a high-resolution 100 kHz sampling rate, as described later, to more completely capture the transient overshoot peaks. A two-electrode setup was employed: the working electrode lead from the workstation was connected to one end of the specimen, whereas the counter electrode and reference electrode leads were shorted together and connected to the opposite end.
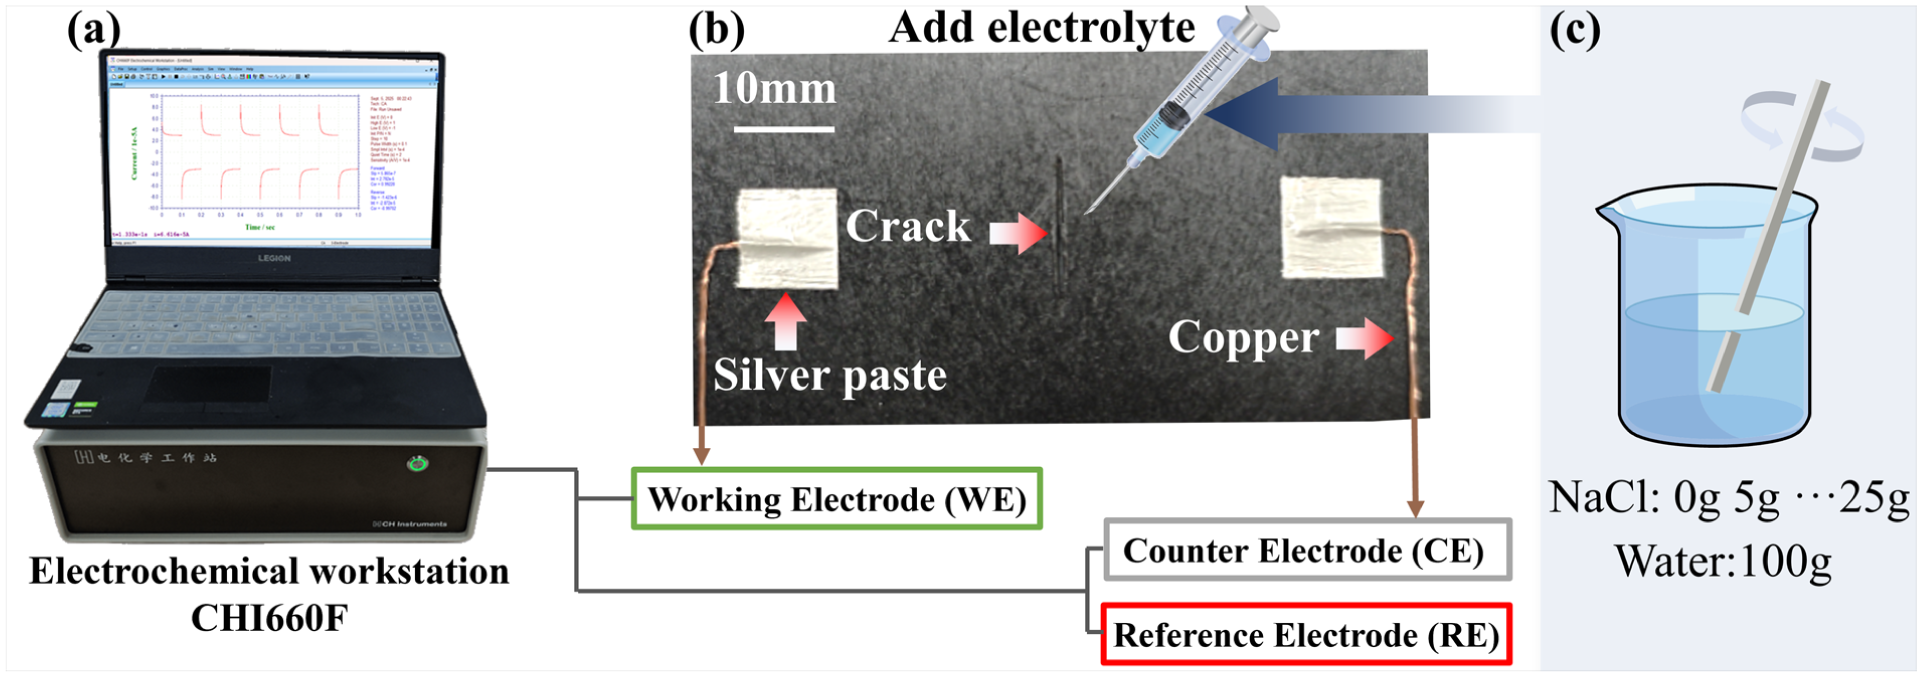
The experimental setup: (a) CHI660F electrochemical workstation for data acquisition; (b) specimen showing the crack, electrodes, and connection schematic; and (c) preparation of NaCl solutions.
The experiments were conducted on a disc-shaped specimen featuring a premachined crack, with copper foil electrodes attached to the surface on opposite sides of the crack. The measurement axis between the electrodes was aligned parallel to the preferred fiber orientation (injection flow direction), as its volume resistivity (∼27.07 Ω·m) falls within the optimal theoretical window (“Applicable range of material resistivity” section) required to generate the EDL signature. Measurements were performed under two distinct conditions: a “dry crack” state and a “electrolyte-filled crack” state. It should be noted that the manual injection of the electrolyte in this experiment was employed solely to simulate fluid ingress under controlled conditions. In practical engineering applications (e.g., fluid-transporting pipelines), the electrolyte would naturally infiltrate and fill the crack upon damage initiation. During the tests, a square-wave voltage with periodically reversing polarity was applied to the specimens under both conditions, and the resulting current response was recorded in real time. The primary objective was to observe whether the characteristic charge–discharge phenomenon appeared in the current curve at the moment of voltage polarity reversal. For the subsequent parametric studies, specimens with a larger premachined crack were utilized to amplify the interfacial response, ensuring a high signal-to-noise ratio for quantitative analysis.
To investigate the effect of the monitoring voltage on the signal characteristics, the voltage varied from 0.5 to 5.0 V, a range selected to be compatible with typical industrial microcontrollers. The voltage amplitude was controlled via the accompanying software interface. Simultaneously, to study the influence of the electrolyte concentration, solutions with NaCl contents of 0, 5, 10, 15, 20, and 25 g/100 g water were prepared. To ensure data reliability between measurements, the crack was thoroughly rinsed with distilled water and completely dried before the introduction of each new solution. These parametric studies were conducted at a high sampling rate of 100 kHz to acquire high-resolution data for analysis. For each experimental condition, the reported values for the overshoot ratio and time constant represent the average of measurements from three consecutive polarity reversal cycles.
Microstructural characterization
Micro-CT was used to characterize the internal microstructure of the as-prepared CFRP composites. For this purpose, rectangular specimens (2 × 2 × 2 mm3) were analyzed using a SKYSCAN 1272 scanner (Bruker Co., Ltd, Berlin, Germany) at a pixel resolution of 1.5 μm. The primary objective of this analysis was to visualize the three-dimensional (3D) distribution of the conductive fillers and to confirm the formation of an interconnected conductive network within the polymer matrix. To further characterize the internal microstructure of the fabricated SCFRPCs, the specimens were analyzed by scanning electron microscopy (SEM, SU-3500, Hitachi, Tokyo, Japan). The specimens were first cryo-fractured by immersion in liquid nitrogen followed by immediate fracture to expose a fresh cross-section without plastic deformation. Prior to imaging, the fracture surfaces were coated with a thin layer of gold to ensure conductivity. The resulting SEM images were used to analyze the dispersion and orientation of the SCFs within the polyethylene matrix, as well as the fiber–matrix interfacial bonding.
Results and discussion
Microstructures of the composites
As illustrated in Figure 6, the micro-CT scan results provide a direct visualization of the 3D spatial distribution of the SCFs within the polyethylene matrix. Quantitative analysis based on the micro-CT data yields a fiber orientation coefficient
48
(
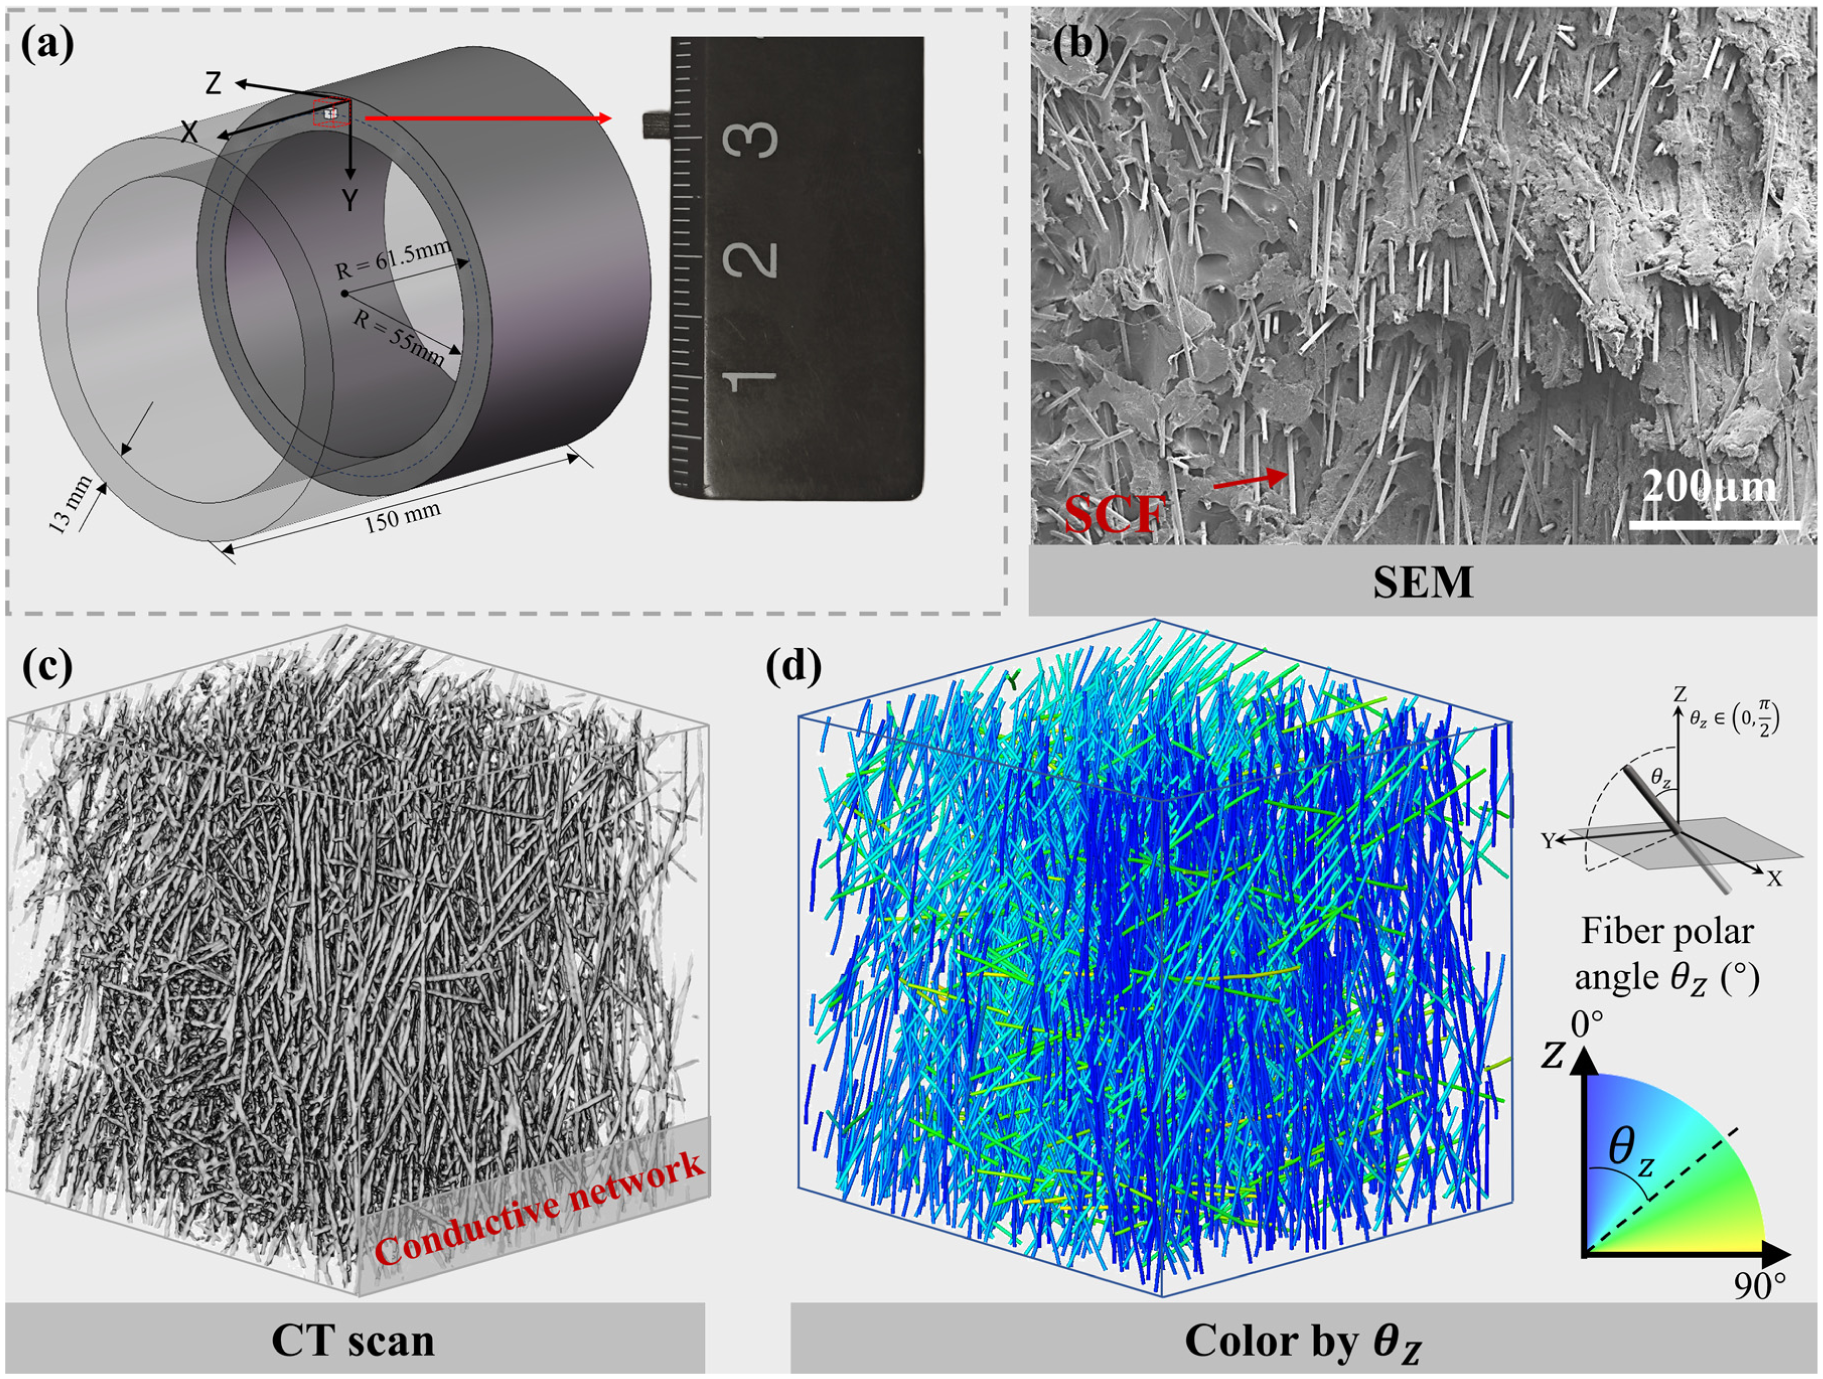
Microstructural characterization of the SCFRPCs: (a) schematic of the sampling location from the hollow cylindrical specimen and a photograph of the prepared 2 × 2 × 2 mm3 specimen, (b) SEM micrograph showing the fiber dispersion and interfacial bonding, (c) micro-CT reconstruction of the internal structure, visualizing the percolated conductive network, and (d) micro-CT visualization colored by fiber orientation angle, revealing the flow-induced alignment characteristics. SCFRPC: short carbon fiber-reinforced polymer-matrix composite; SEM: scanning electron microscopy; CT: computed tomography.
Taken together, the micro-CT and SEM results confirm the successful fabrication of SCFRPCs featuring a well-formed, percolated conductive network. This internal microstructure, consisting of interconnected conductive fibers, not only serves as the origin of the material’s electrical conductivity but also provides the crucial microstructural foundation for the proposed sensing mechanism: when a crack initiates, a sufficient number of fibers are exposed at the crack faces to form an effective EDL. 52
Validation of the monitoring principle
The experimental results are presented as current–time (I–t) curves in Figure 7. For the specimens with a dry crack, the current response (orange curve) exhibits a nearly perfect square-wave shape, mirroring the profile of the applied voltage. This indicates that under these conditions, the monitoring circuit behaves as a purely ohmic system. The current is directly proportional to the voltage, and upon polarity reversal, it instantaneously flips its sign without any observable transient charge–discharge effects. Although a minimal background capacitance may exist, its characteristic time scale is on the sub-microsecond level according to the electrochemical impedance spectroscopy EIS-based estimate presented in the Supplemental Material. Under the present measurement configuration and time resolution, this background contribution is not expected to produce an observable polarity-reversal overshoot, which is consistent with the nearly ohmic macroscopic response observed for the dry crack.
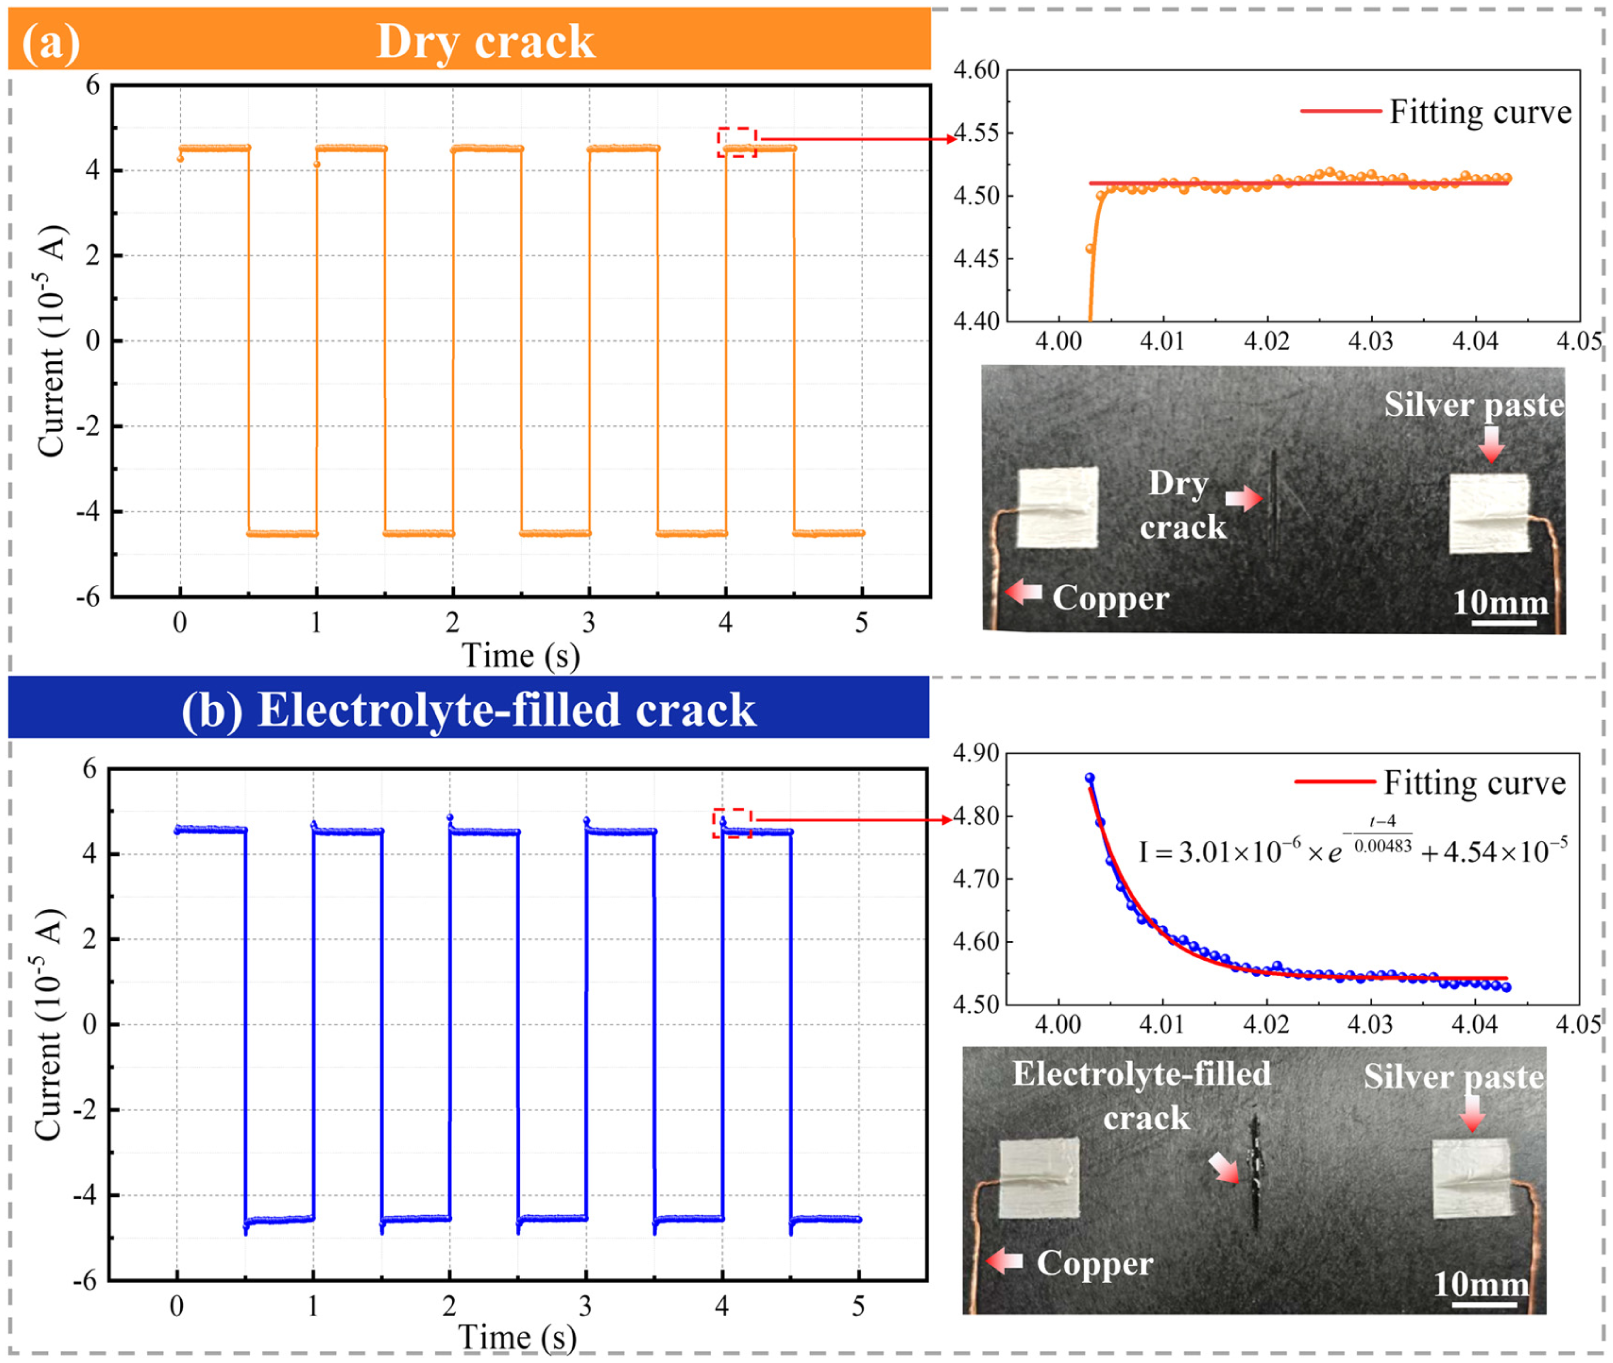
Comparison of the current response for (a) dry crack and (b) electrolyte-filled crack. The electrolyte-filled crack exhibits the characteristic charge–discharge signature, whereas the dry crack shows a purely ohmic response.
However, upon the introduction of an electrolyte into the same crack, the current response (blue curve) undergoes a fundamental change. The most prominent feature is the appearance of a sharp current peak, or overshoot, at each moment of voltage polarity reversal, which far exceeds the steady-state value. Following this peak, the current gradually decays and settles at a new steady-state level. This distinctive “overshoot-decay” transient behavior is the classic signature of a capacitive element charging and discharging in a DC circuit, corresponding to the charge–discharge phenomenon explicitly labeled in Figure 7.
Qualitative inductance (L), capacitance (C), and resistance (R) (LCR) measurements showed a substantial capacitance increase after liquid ingress (Supplemental Figure S3). EIS and time-domain charge integration likewise revealed a markedly larger effective charge-storage component in the electrolyte-filled crack state than in the dry state (Supplemental Figures S2 and S4). These results indicate that electrolyte ingress introduces an additional interfacial charge-storage process at the newly wetted conductive crack surfaces, giving rise to the observed overshoot–decay transient upon polarity reversal.
Parametric study of disc-shaped specimens
Effect of the applied voltage
A significant charge–discharge phenomenon was observed across the entire tested voltage range of 0.5–5.0 V. Figure 8(a) to (f) shows the current response at the moment of polarity reversal for different applied voltages, plotted as the normalized current (the ratio of the instantaneous current to its final steady-state value). In all cases, a sharp peak current that far exceeded the steady-state value was observed, which then gradually decayed. Figure 8(g) shows the two key characteristic parameters—the overshoot ratio and the time constant—as a function of the applied voltage. The results reveal a distinct trend: as the voltage increases to 3.0 V, the overshoot ratio increases from 94% to a peak of 127%. Above 3.0 V, it decreases back to 104%. This nonmonotonic behavior suggests that the effect of voltage on the overshoot ratio is not unidirectional but is governed by a competitive mechanism.
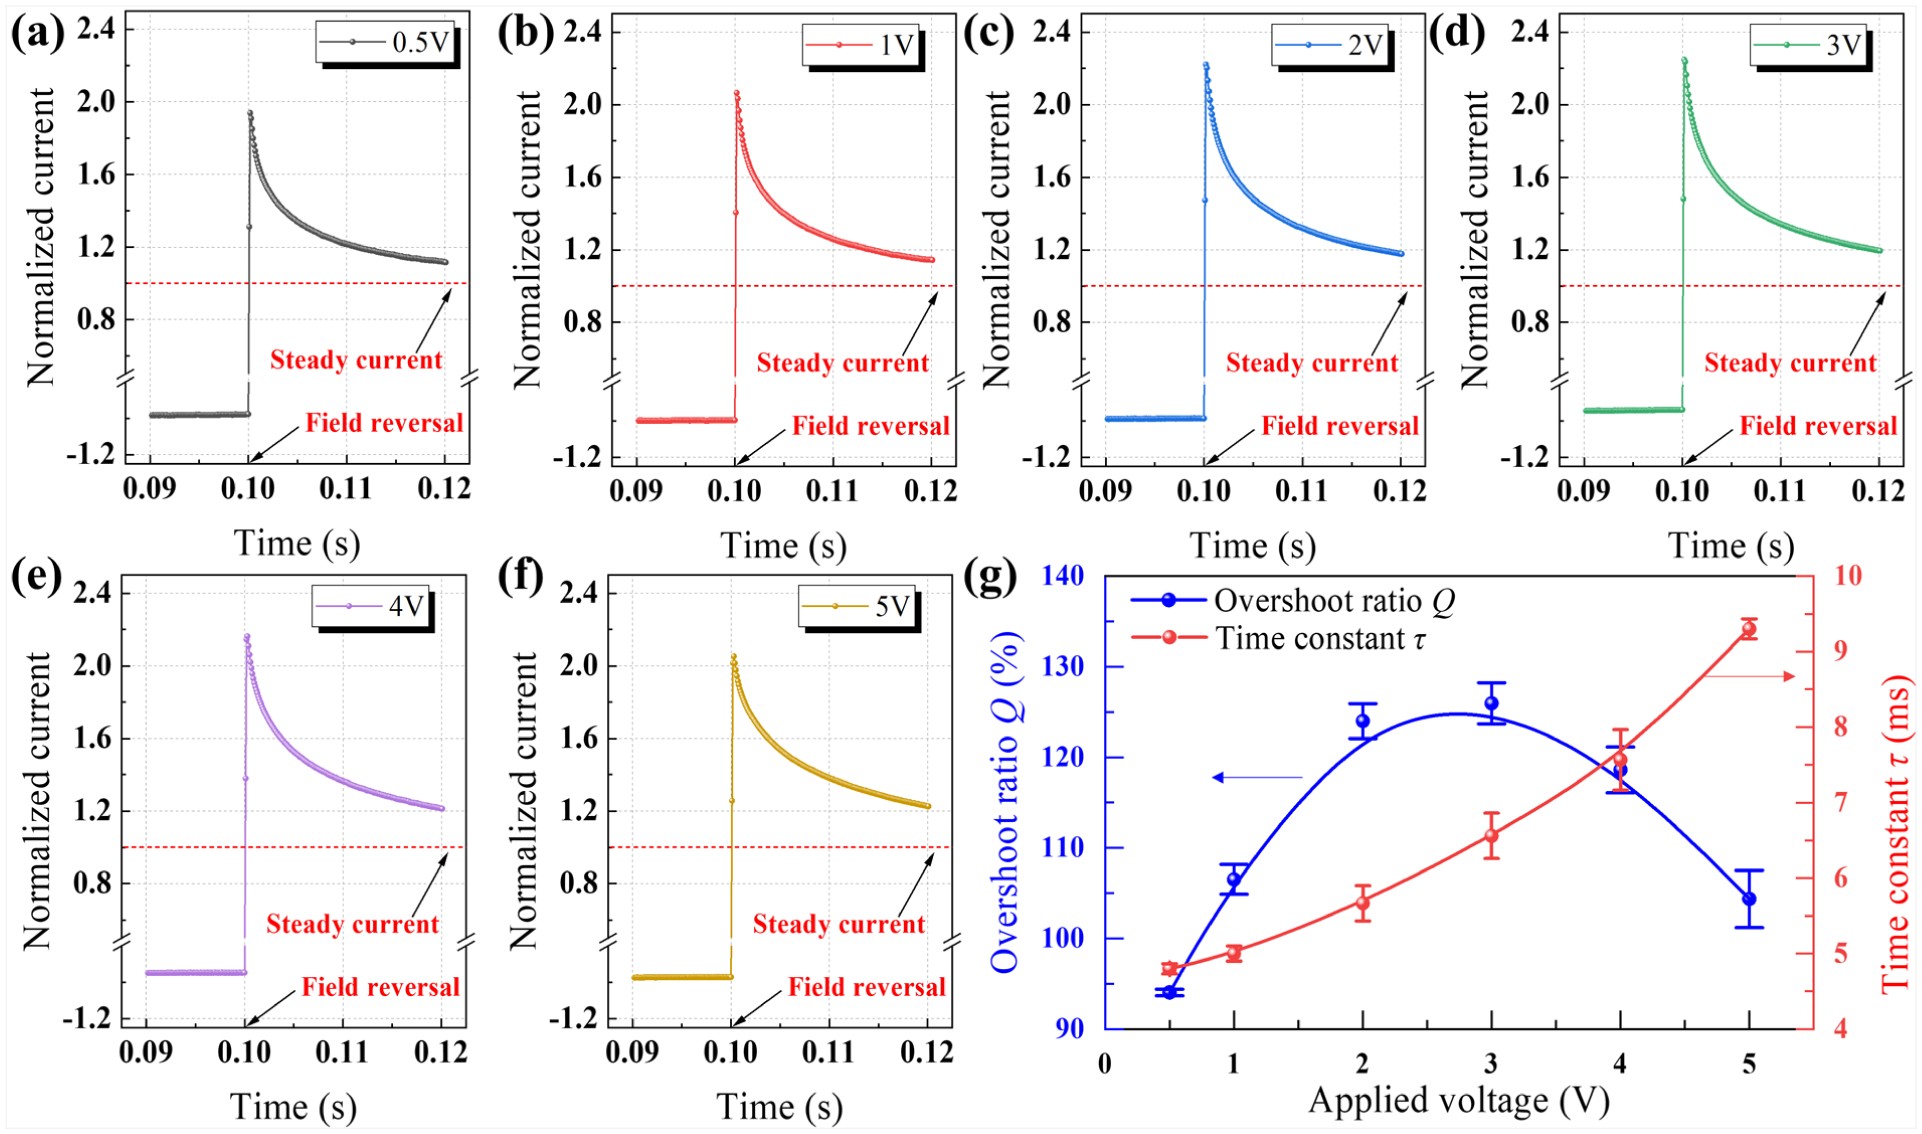
Effect of applied voltage on the charge–discharge phenomenon. (a–f) Normalized current responses recorded under different applied voltages. (g) Overshoot ratio and time constant extracted from the decay curves, plotted as a function of the applied voltage.
The applied voltage primarily influences the charge-transfer resistance (RCT) of the EDL. As derived from Equation (13), the overshoot ratio increases with RCT. Coupling this with the observed trend, we can infer that RCT itself exhibits a nonmonotonic, “increase–then–decrease” behavior as the applied voltage increases. This deviates from the behavior predicted by the idealized Butler–Volmer model, suggesting the presence of more complex physicochemical processes at the crack interface. We attribute this phenomenon to a competitive mechanism involving the adsorption and desorption of interfacial species. Specifically, in the lower voltage range, the specific adsorption of chloride ions (Cl−) may act as an inhibitor, blocking electrochemically active sites on the CF surface and thereby increasing RCT. Conversely, at higher voltages, a combination of potential-induced desorption of these inhibiting ions and a general acceleration of electrochemical kinetics likely dominate, leading to a significant decrease in RCT.53,54 This finding highlights the importance of understanding and accounting for complex interfacial behavior when utilizing electrochemical methods for SHM under real-world conditions.
On the other hand, the time constant (τ) monotonically increases with the applied voltage. This behavior can be explained by Equation (4), which shows that τ increases with both the double-layer capacitance (C) and the charge-transfer resistance (RCT). While RCT exhibits nonmonotonic behavior with increasing voltage, the EDL capacitance (C) is known to increase continuously and rapidly as the applied electric field increases. 55 The observed monotonic increase in the time constant strongly suggests that, across the entire voltage range tested, the increase in the EDL capacitance (C) is the dominant factor governing the trend of τ. Its effect completely masks the nonmonotonic changes in RCT, resulting in an overall continuous increase in the time constant.
Effect of the electrolyte concentration
To investigate the influence of a crack’s internal chemical environment on the monitoring signal, this study further examined the dependence of the charge–discharge parameters on the electrolyte concentration. Experiments were conducted with cracks filled with NaCl solutions of varying concentrations, from which the overshoot ratio and time constant (τ) were extracted. For reference, the typical salinity of seawater is about 3.5 g NaCl/100 g water. The dependence of these parameters on the concentration is plotted in Figure 9(g). The plot clearly shows that the two parameters exhibit markedly divergent trends as the NaCl content changes.
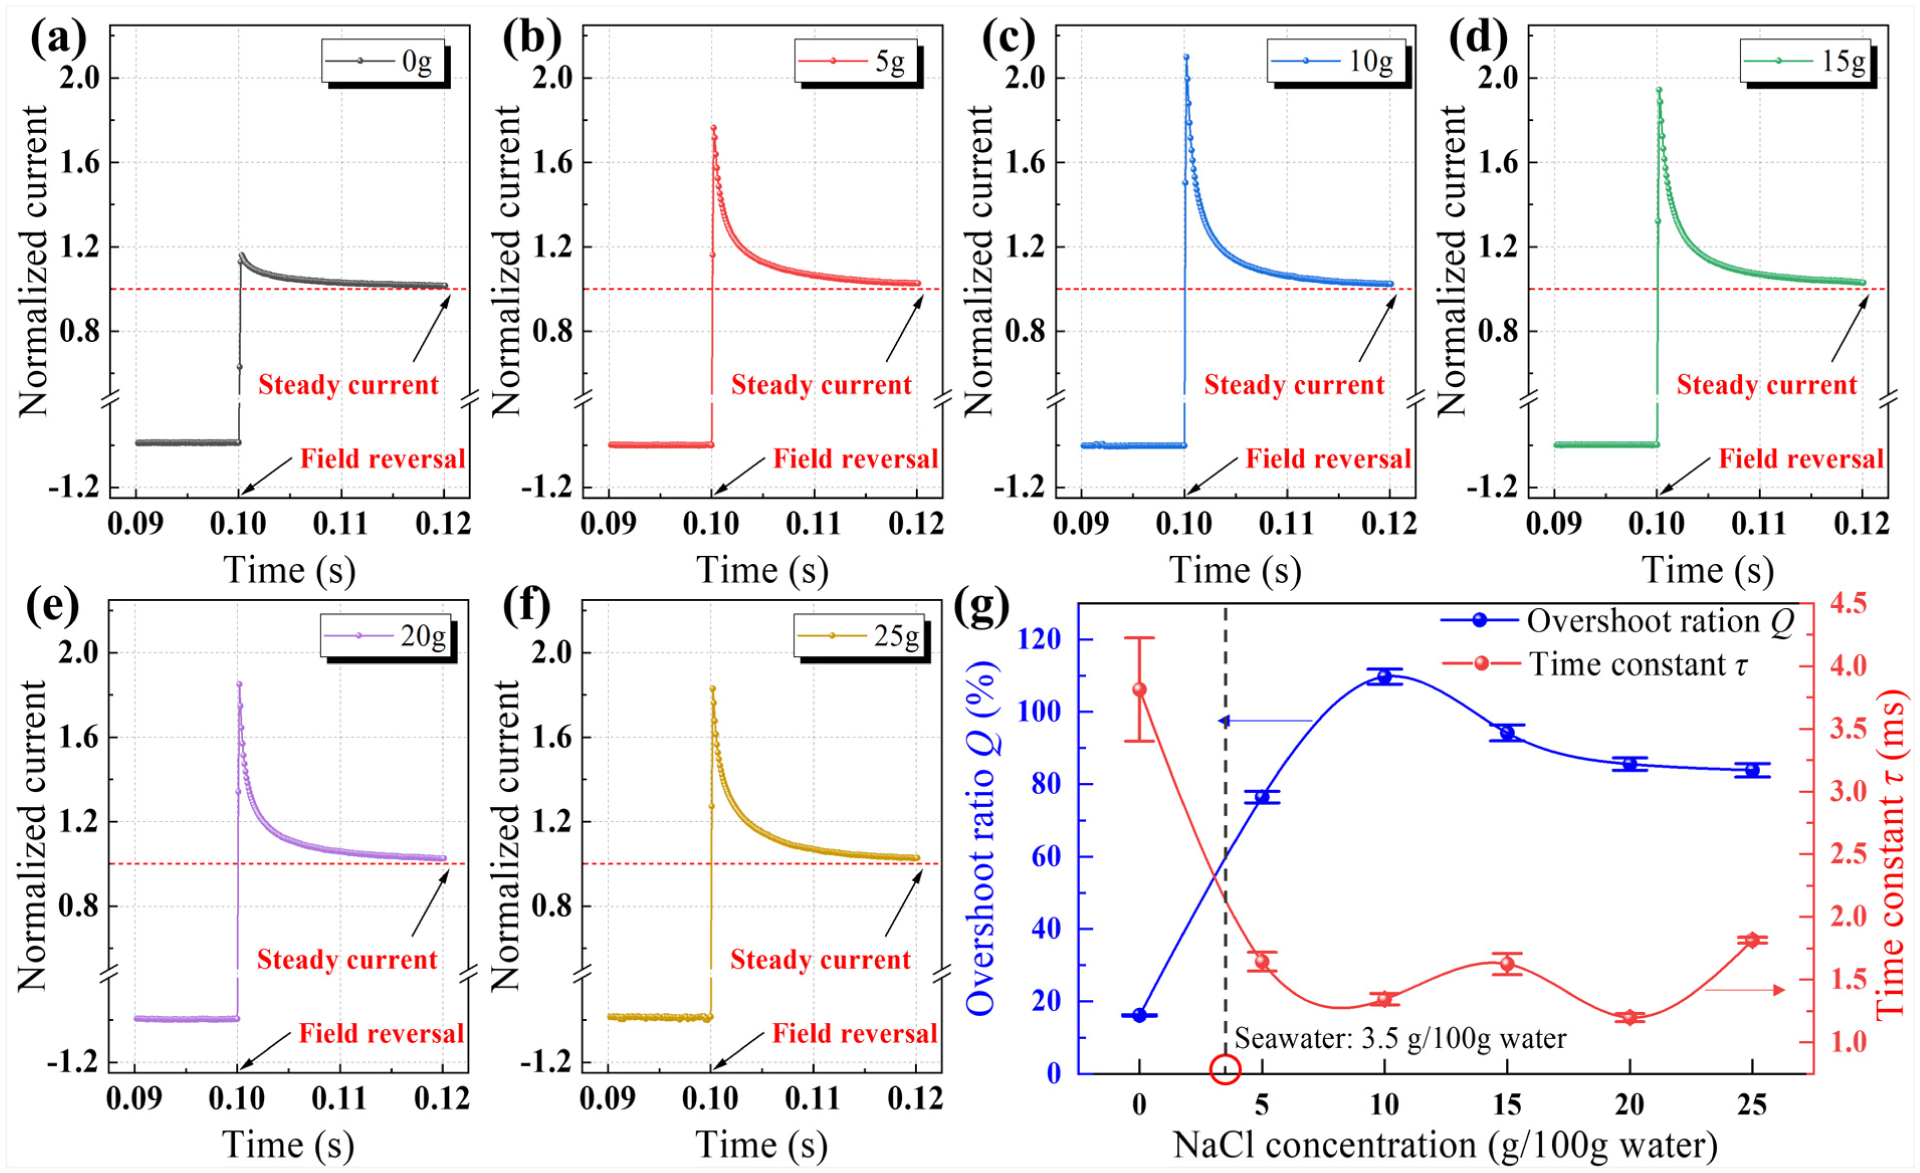
Effect of the electrolyte concentration on the charge–discharge characteristics. (a–f) Normalized current response at NaCl contents ranging from 0 to 25 g/100 g water. (g) The extracted overshoot ratio and time constant plotted as a function of concentration.
The time constant, τ (red curve), shows a strong negative correlation with the solution concentration, reaching a maximum of 4.0 ms in pure water (0/100 g water). As the NaCl content increases, τ decreases sharply, eventually stabilizing at a lower value of 1.5 ms for NaCl contents above 10/100 g water. In contrast, the overshoot ratio (blue curve) displays nonmonotonic behavior. It begins at its lowest point in pure water, increases rapidly with increasing concentration to a peak value of 112% at an NaCl content of 12/100 g water, and then gradually decreases at higher concentrations.
These divergent trends reveal that the electrolyte concentration influences the monitoring signal through two distinct physicochemical mechanisms. The trend of the time constant (τ) is governed primarily by the bulk resistance of the NaCl solutions within the crack, RW. At low concentrations, particularly in pure water, the scarcity of charge carriers results in poor conductivity and hence a significantly increased RW. This large series resistance markedly slows the EDL charging process, leading to a larger τ. As the NaCl content increases, the abundance of Na+ and Cl− ions dramatically increases the conductivity of the solution. This causes a sharp decrease in RW, which in turn leads to the rapid decrease and stabilization of τ.
Unlike the time constant, the nonmonotonic behavior of the overshoot ratio points to more complex interfacial electrochemical processes, with its trend primarily reflecting changes in the charge-transfer resistance (RCT). We attribute this “increase–then–decrease” trend to the specific adsorption of Cl− ions on the CF surface. In the low-to-medium concentration range, the adsorption of Cl− may inhibit or poison the active sites on the electrode surface, impeding the charge-transfer process and thereby causing an increase in RCT,56,57 which manifests macroscopically as an increasing overshoot ratio. Conversely, as the concentration increases beyond the peak, the high ionic strength environment may induce restructuring of the EDL, facilitating easier charge transfer and consequently causing RCT to decrease.
In summary, the influence of the electrolyte concentration on the monitoring signal is twofold. The variation in the time constant (τ) corresponds primarily to changes in the bulk property of the electrolyte (its conductivity), whereas the overshoot ratio reflects the more complex dynamics of an interfacial property (the interplay of charge transfer and surface adsorption kinetics). This finding not only elucidates the rules governing the concentration effect on the monitoring signal but also demonstrates the potential for gaining a deeper understanding of the crack’s internal chemical environment by analyzing multiple transient characteristic parameters.
Application on composite structure
To validate the engineering applicability of the proposed monitoring method for nonplanar geometries and to investigate its sensitivity to crack orientation, a series of tests were conducted on a hollow cylindrical specimen. As shown in Figure 10, a pair of electrodes was placed on the curved surface, and three premachined cracks were introduced between them at different angles relative to the electrode-to-electrode axis: 0° (perpendicular), 45°, and 90° (parallel). Tests were conducted on each of the three cracks after they were filled with an aqueous medium. The applied voltage and NaCl content for these tests were set to 3.0 V and 10/100 g water, respectively, as these conditions were found to produce a pronounced signal in the preceding parametric study.
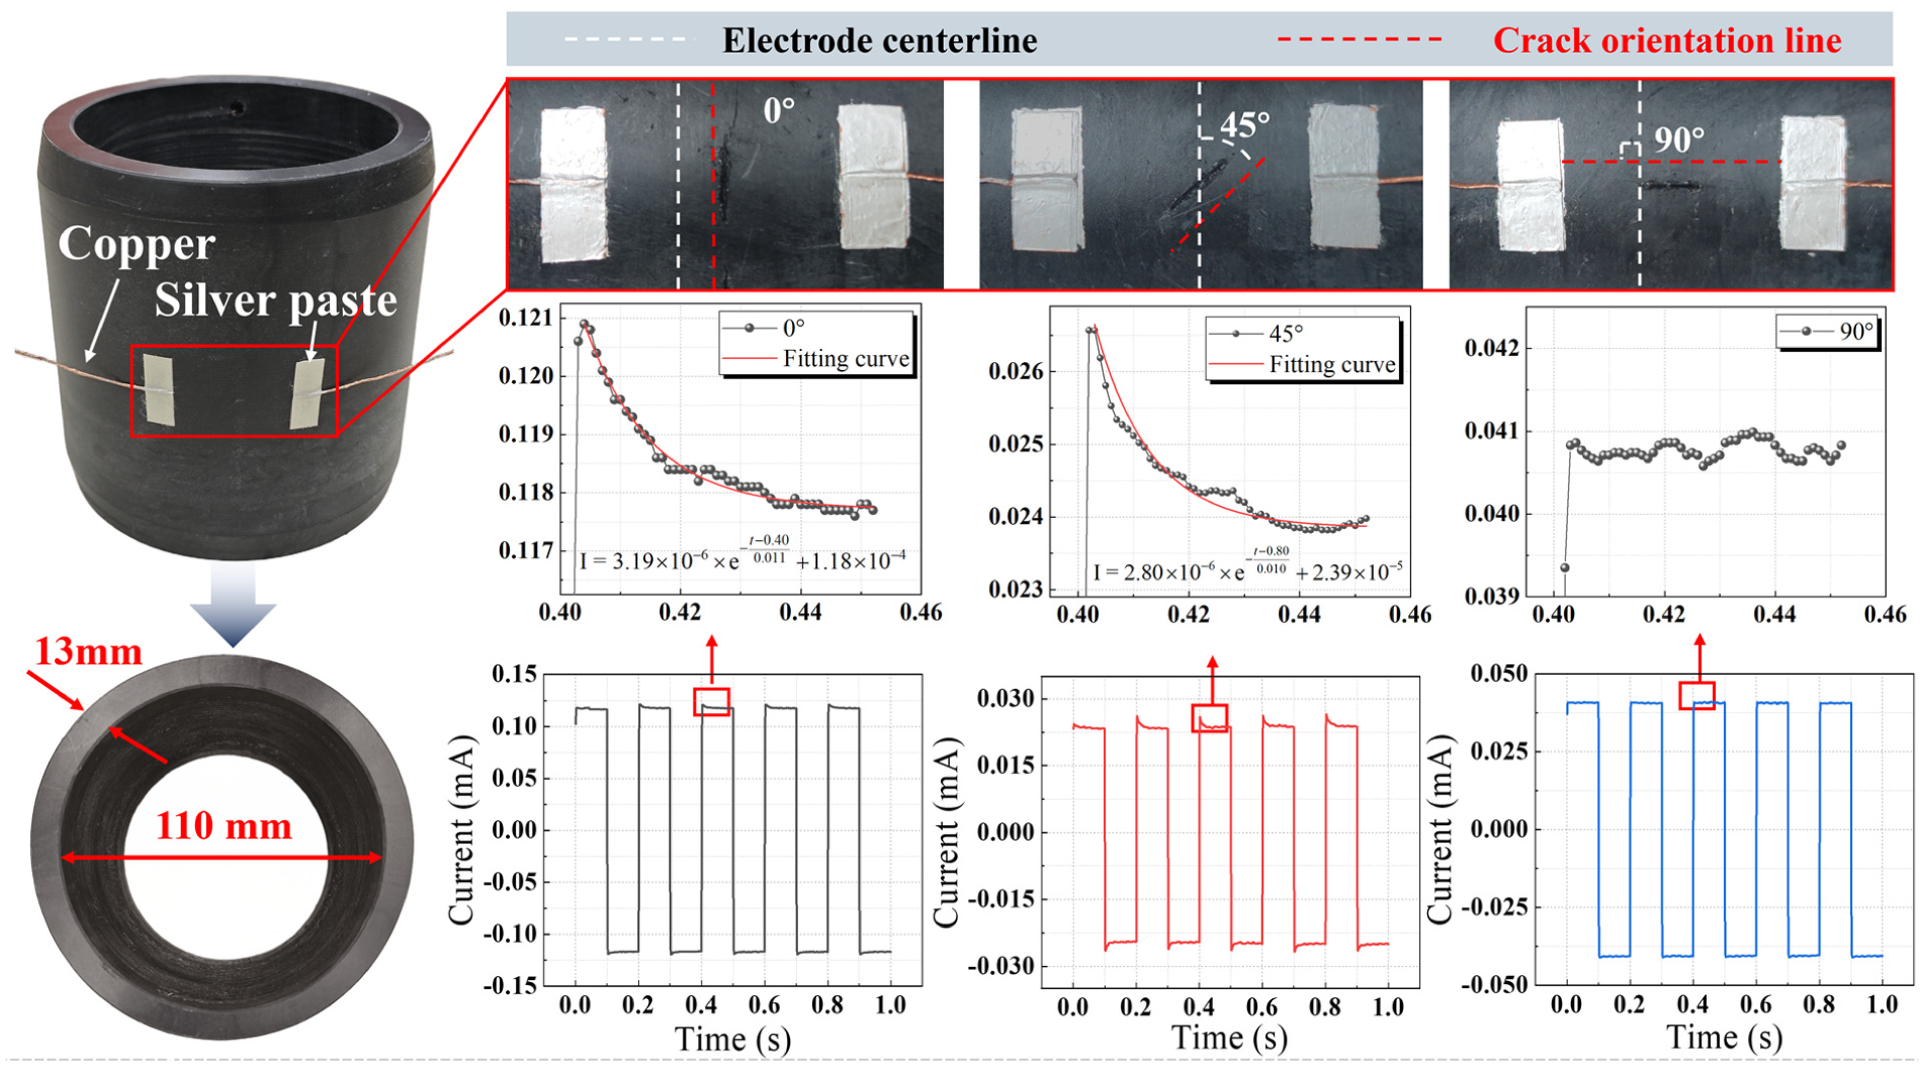
Monitoring results for cracks with different orientations on a cylindrical specimen. The current responses are shown for cracks oriented at 0° (perpendicular), 45°, and 90° (parallel) relative to the electrode axis. A distinct charge–discharge signature is evident for the 0° and 45° cases but is absent for the 90° case.
The experimental results clearly delineate the method’s operational scope and robustness under nonideal conditions. As shown in Figure 10, when the crack orientation was 0° and 45°, the current–time (I–t) curves both exhibited distinct charge–discharge characteristics—namely, a significant current overshoot upon voltage reversal followed by exponential decay. This confirms that the monitoring method is effective as long as the crack path intersects the primary current pathway. Exponential fitting of the decay curves yielded response time constants of approximately 11 ms for the 0° crack and 10 ms for the 45° crack. In stark contrast, when the crack was oriented at 90°, the monitored signal showed no observable charge–discharge effect. The I–t curve was a perfect square wave, synchronized with the applied voltage. This indicates that the monitoring method fails when the crack is oriented parallel to the primary current pathway.
This set of comparative results provides important insight into the method’s intrinsic working mechanism and its boundary conditions. The generation of the monitoring signal relies on the current being forced to flow through the EDL capacitance formed at the conductive filler–electrolyte interface. For the 0° crack, the path is perfectly perpendicular to the current flow, maximizing the portion of current that traverses the crack interface and thus produces the clearest signal. For the 45° crack, the path intersects the current flow obliquely. The results demonstrate that the method possesses sufficient sensitivity to monitor a significant charge–discharge signature even in this nonideal configuration, highlighting its robustness. For the 90° crack, the path is nearly parallel to the current flow. The vast majority of the current bypasses the high-resistance, electrolyte-filled crack, opting instead for the lower-resistance path through the conductive composite on either side. Because the monitoring circuit does not effectively engage with the EDL capacitance, no signal is generated. This outcome is consistent with theoretical expectations and further validates the proposed mechanism. In practical engineering, this directional sensitivity is effectively managed through optimized sensor layouts. Specifically, electrodes are arranged based on structural loading analysis to target probable crack directions. Additionally, employing orthogonal electrode arrays or grid patterns ensures that at least one current path intersects the damage regardless of orientation, thereby eliminating monitoring blind spots.
In summary, these experiments on a curved structure demonstrate that the proposed method is not only effective but also highly adaptable to damage orientation. It does not require the damage to be perfectly perpendicular to the monitoring direction and remains robust even at significant angular deviations. This characteristic greatly enhances the practical engineering value of this technology for addressing real-world damage, which can occur in various forms and orientations.
Similarly, in practical engineering applications, the location of damage is often random and may not occur in the ideal position at the geometric center between the monitoring electrodes. Therefore, to assess the method’s tolerance or robustness to spatial deviations in crack location, we further investigated the effect of a crack’s offset distance from the electrode centerline on the monitoring signal. As depicted in Figure 11, the experiment was conducted on a single specimen by introducing electrolyte-filled cracks at three different locations: position 1 (centered), position 2 (moderately offset), and position 3 (severely offset, near the electrode edge).
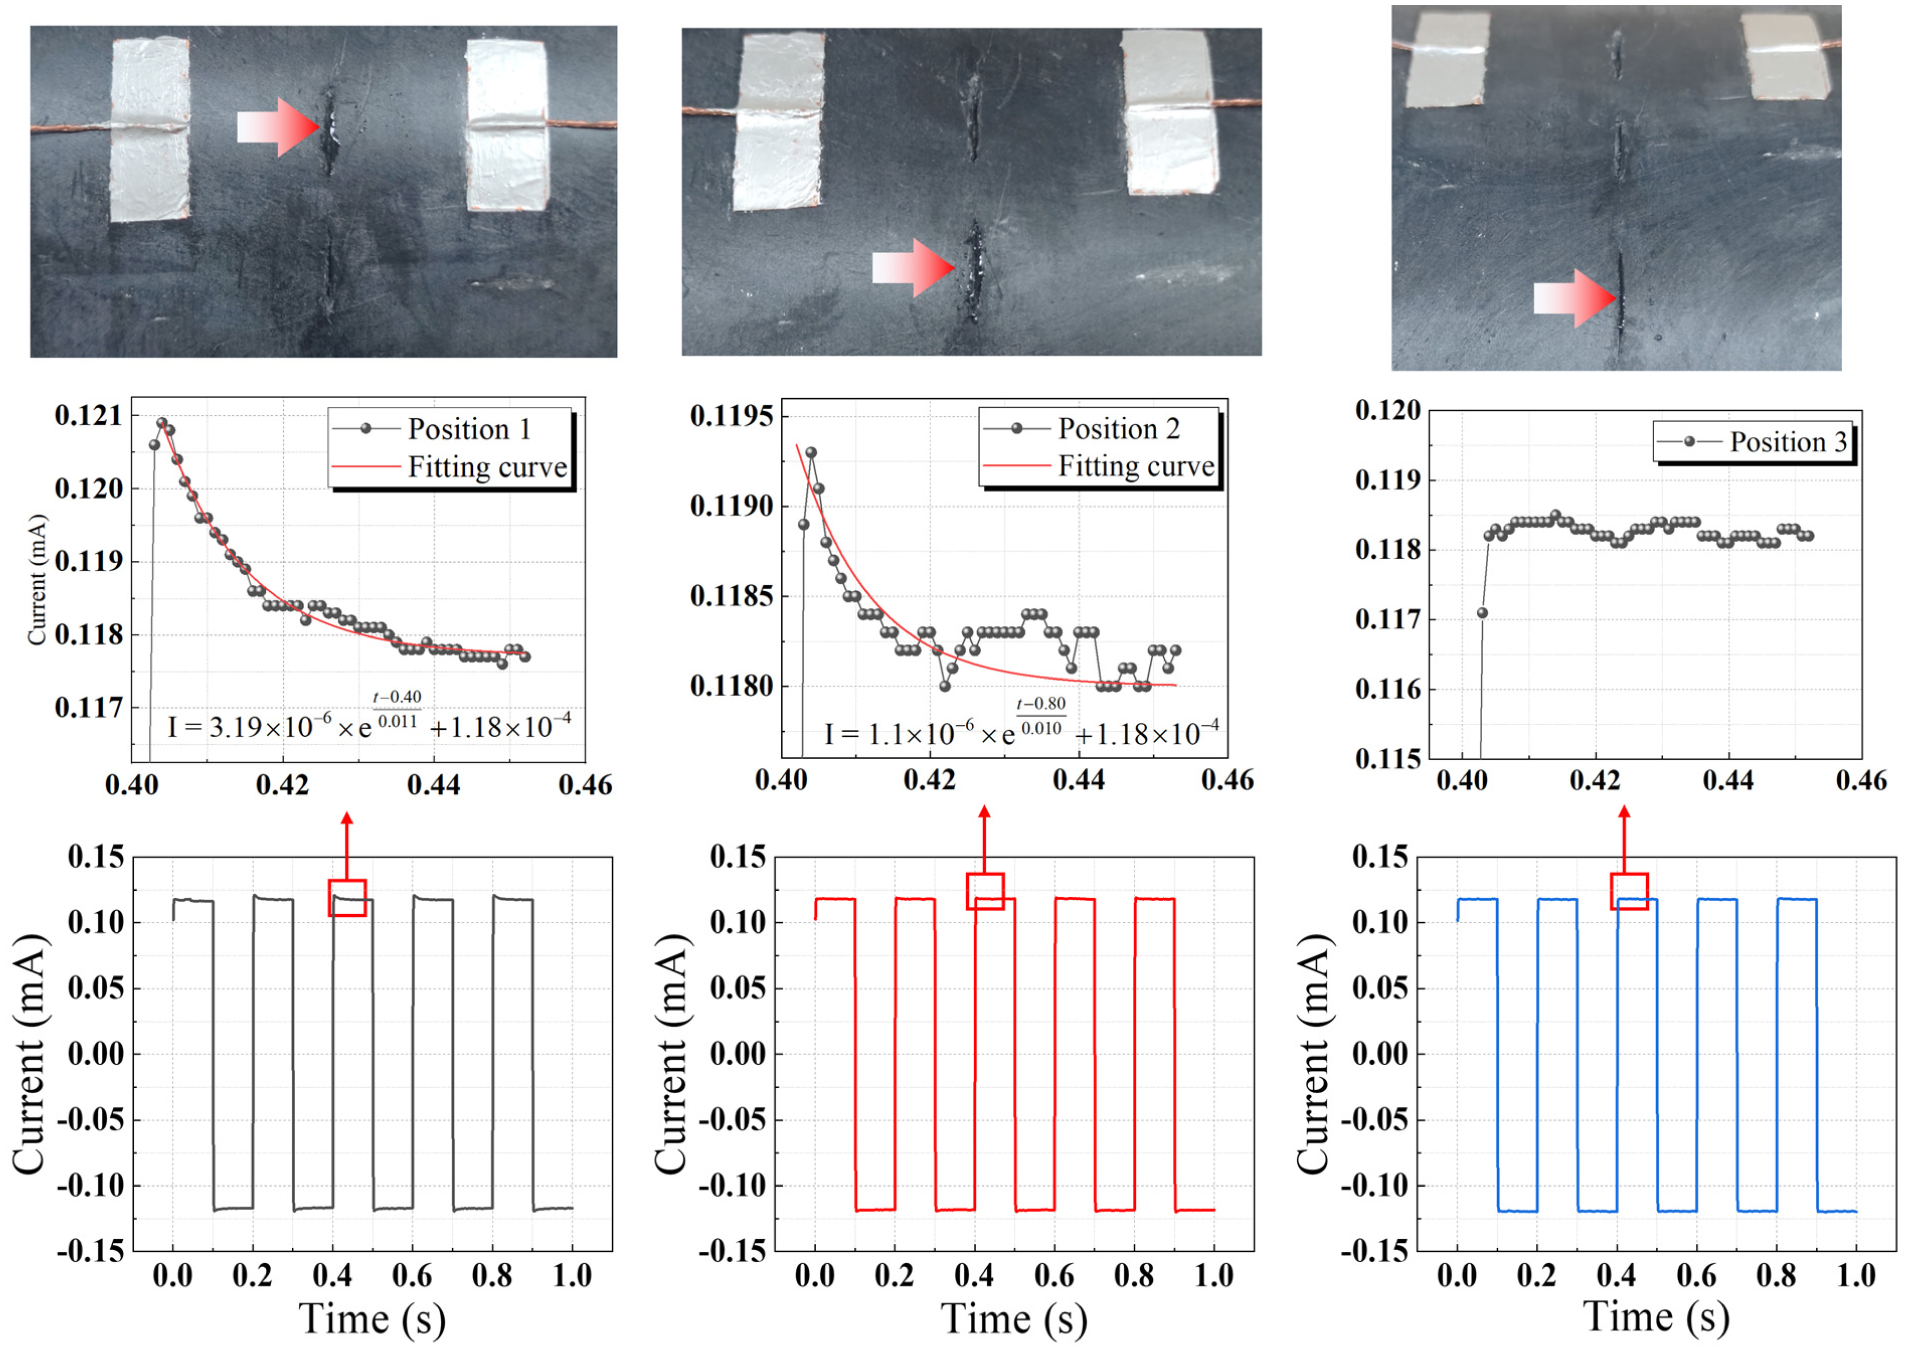
Monitoring results for cracks at different offset distances from the electrode centerline. Current responses are shown for a crack located at the center (position 1), moderately offset (position 2), and severely offset (position 3). The charge–discharge signature is clearly monitored in the first two positions but is absent in the third position, highlighting the tolerance of the method to positional offsets.
The results clearly demonstrate that the method possesses good robustness within a certain range of positional deviation. The I–t curves show that for cracks at central position 1 and moderately offset position 2, the signals both exhibit distinct charge–discharge characteristics, namely, a significant current overshoot upon voltage reversal. Exponential fitting of the decay curves yielded a response time constant of 11 ms for position 1 and approximately 10 ms for position 2. However, when the crack moved to severely offset position 3, the charge–discharge signature disappeared completely. The I–t curve reverted to a perfect square wave synchronized with the applied voltage, indicating the failure of the method at this location.
This set of results further validates and deepens the understanding of the method’s working mechanism, which is governed by the electric field and current density distribution between the electrodes. At positions 1 and 2, the crack is located within the effective coverage area of the electric field. A substantial portion of the current is forced to pass through the NaCl solution in the crack, allowing the EDL capacitance to be effectively probed. Successful monitoring at position 2 highlights the method’s strong practical utility, as it does not require the crack to be precisely centered. In contrast, position 3 lies in a fringe region, or “blind spot,” of the field distribution. The monitoring current preferentially flows along the lowest impedance path directly between the electrodes and is unlikely to detour through the crack in this remote location. Since the circuit fails to incorporate the crack’s EDL capacitance, no capacitive signature is produced. This expected failure clearly defines the effective sensing area of the method.
While a high-precision workstation was used for laboratory validation, the required sampling rate (∼1 kHz) is well within the capabilities of standard, low-cost industrial microcontrollers (which typically guarantee >10 kHz sampling rates even at 0.5% accuracy). This ensures that for practical engineering applications, the system remains cost-effective for large-scale deployment without relying on expensive high-speed data acquisition equipment.
Conclusion
In this study, a crack monitoring method for conductive composites possessing a specific range of electrical resistivity was proposed and validated, leveraging the charge–discharge phenomenon of the EDL. By shifting the monitoring paradigm from measuring small quantitative resistance changes to identifying a distinct qualitative capacitive pattern, this work presents a straightforward, low-cost, and reliable solution for in-situ SHM. The key contributions and findings of this work are as follows:
A monitoring principle and a corresponding theoretical model were established. The method identifies cracks by monitoring a qualitative shift in the circuit’s electrical response—from purely ohmic to capacitive—which manifests as a distinct current overshoot signature. An equivalent circuit model was developed to elucidate this mechanism, and key performance metrics, including the overshoot ratio and time constant, were defined. Results indicate that the response characteristic exhibits a nonmonotonic trend—initially increasing and then decreasing—with rising material resistivity, thereby defining a specific applicable range (identified as approximately 10−3 to 102
The influence of key operational parameters was thoroughly investigated to guide the monitoring practice. The analysis revealed a nonmonotonic relationship between the monitoring signal and both applied voltage and electrolyte concentration. Specifically, the overshoot ratio reached a maximum of 127% at an optimal voltage of 3.0 V, and a peak of 112% at an NaCl content of around 12/100 g water. The underlying electrochemical mechanisms for these trends, involving competitive ion adsorption and changes in bulk conductivity, were discussed, providing a basis for parameter optimization in future applications.
The method’s engineering applicability and robustness were demonstrated on a nonplanar composite structure. The tests, conducted using the optimized parameters (3.0 V voltage), confirmed that the monitoring is tolerant to significant deviations in crack orientation and location from the ideal, centered position. This verified the method’s utility for monitoring randomly occurring damage in complex-geometry components, highlighting its potential for future engineering applications.
Based on the EDL effect, this study establishes a monitoring method with distinct damage signatures, offering a promising solution for the diagnosis of structural cracks in fields such as fluid-transporting pipelines and marine engineering. While this study has demonstrated the feasibility and robustness of the proposed method, several avenues remain for further investigation to fully realize its potential in diverse operational environments. Future work will focus on quantitatively evaluating the monitoring sensitivity and resolution limits of the system. Additionally, the quantitative relationship between electrode layout parameters (e.g., dimensions, spacing) and signal intensity will be optimized. Furthermore, the capability of surface-mounted electrodes to monitor internal or subsurface damage warrants further in-depth exploration. These studies will aim to establish a comprehensive design guideline for deploying this capacitive monitoring technique in large-scale composite structures.
Supplemental Material
sj-docx-1-shm-10.1177_14759217261447542 – Supplemental material for Crack monitoring of short carbon fiber reinforced polymer-matrix composites based on the double-layer capacitance effect
Supplemental material, sj-docx-1-shm-10.1177_14759217261447542 for Crack monitoring of short carbon fiber reinforced polymer-matrix composites based on the double-layer capacitance effect by Deyi Wang, Riwu Yao, Xinwei Zong, Quan Gu, Min Yan, Yangdong Xiang and Jianfeng Shi in Structural Health Monitoring
Footnotes
Author contributions
Funding
The authors disclosed receipt of the following financial support for the research, authorship, and/or publication of this article: This work was supported by the Zhejiang Provincial Natural Science Foundation of China under grant no. LQ24E050003, Key R&D Program of Shandong Province (grant no. 2024CXGC010311), and National Natural Science Foundation of China (grant nos. 52305427 and 52175150).
Declaration of conflicting interests
The authors declared no potential conflicts of interest with respect to the research, authorship, and/or publication of this article.
Data availability statement
The datasets used and/or analyzed during the current study are available from the corresponding author on reasonable request.
Supplemental material
Supplemental material for this article is available online.
References
Supplementary Material
Please find the following supplemental material available below.
For Open Access articles published under a Creative Commons License, all supplemental material carries the same license as the article it is associated with.
For non-Open Access articles published, all supplemental material carries a non-exclusive license, and permission requests for re-use of supplemental material or any part of supplemental material shall be sent directly to the copyright owner as specified in the copyright notice associated with the article.