
Abstract
To address the challenges of significant feature distribution discrepancies across different working conditions and the difficulty in distinguishing fine-grained faults in rolling bearings, a dynamic weighted joint distribution adaptation (DW-JDA) network is proposed. The method integrates a continuous wavelet transform (CWT) preprocessing module, a depthwise separable convolution (DSConv) based feature extractor, and a novel entropy-weighted discriminative joint distribution alignment (EW-DJDA) mechanism. First, one-dimensional vibration signals are converted into two-dimensional time–frequency images via CWT to fully capture the time–frequency characteristics of nonstationary signals. Then, a hybrid backbone network based on DSConv is constructed to efficiently extract spatial features. Simultaneously, the EW-DJDA module is introduced, which dynamically adjusts the alignment weights of marginal and conditional distributions according to the prediction uncertainty in the target domain, effectively mitigating negative transfer. Furthermore, to tackle the issue of ambiguous decision boundaries, a Hard Negative Margin Softmax loss function is proposed, which explicitly increases the distance between the target class and the strongest interfering class, thereby enhancing the model’s discriminability for hard-to-distinguish samples. Experiments on the Central South University, Case Western Reserve University, and Beijing Jiaotong University datasets demonstrate that DW-JDA achieves average diagnostic accuracies of 99.55, 99.92, and 99.91%, respectively, showing competitive or best average performance among the compared transfer learning methods. Particularly under strong noise conditions with signal-to-noise ratio = −2 dB, the model maintains an average accuracy of 97.71%, exhibiting excellent robustness and generalization capability.
Keywords
Introduction
Rolling bearings are the core components of rotating machinery systems, serving a pivotal role in critical infrastructure such as high-speed trains, wind turbines, and aerospace engines. Their primary function is to support mechanical loads and transmit power with minimal friction.1–4 However, these components operate inevitably under harsh and complex industrial environments, characterized by heavy loads, continuous speed variations, and strong background noise. Such extreme conditions render bearings highly susceptible to surface degradation and structural fatigue. A minor defect, if not detected and rectified in its early stages, can rapidly propagate, compromising the reliability of the entire mechanical system and potentially precipitating catastrophic economic losses or severe safety incidents. 5 Consequently, the development of intelligent and robust fault diagnosis methodologies is not merely a technical preference but an industrial imperative.
In the past decades, fault diagnosis has evolved from traditional signal processing to intelligent data-driven paradigms. Traditional methods largely relied on manual feature engineering, requiring domain experts to extract statistical indicators or spectral features based on prior physical knowledge. However, these manual processes are labor-intensive and often fail to capture complex, nonlinear fault patterns hidden in high-dimensional data. In recent years, with the exponential growth of industrial data and computing power, deep learning (DL) techniques, such as convolutional neural networks and recurrent neural networks, have achieved remarkable success.6–9 By automatically learning hierarchical feature representations from raw vibration signals, DL models have significantly reduced the reliance on human intervention and improved diagnosis accuracy.6,10
Despite these advancements, the practical deployment of standard DL models faces a fundamental obstacle: they predominantly operate under the assumption that the training and testing data are independent and identically distributed. 11 In real-world engineering scenarios, such as high-speed train operations, working conditions fluctuate continuously. 12 Changes in rotational speed result in shifts in characteristic fault frequencies, while variations in load alter the amplitude modulation of vibration signals. These physical changes lead to a significant distribution shift between the labeled data collected under controlled conditions and the unlabeled monitoring data acquired during actual operation.13–16 Consequently, a model trained on a specific source domain often suffers from severe performance degradation when transferred to an unseen target domain. To mitigate this issue, unsupervised domain adaptation (UDA) methods17–20 have been extensively adopted. The core objective of UDA is to minimize the distribution discrepancy between domains by mapping them into a shared feature subspace, thereby facilitating the transfer of diagnostic knowledge from the source domain to the unlabeled target domain.21–23 Building on this concept, recent advancements have successfully applied domain adaptation frameworks to tackle specific environmental and operational variations. For instance, fine-tuning DL frameworks have been developed to effectively palliate data distribution shifts in rotary machine fault detection. 24 Furthermore, to address environmental variability, novel domain-adaptive networks have been proposed to ensure temperature-resilient structural health monitoring. 25
Although UDA-based approaches have demonstrated promising potential, existing research still faces two critical bottlenecks regarding distribution alignment strategies and decision boundary discriminability, which limit their performance in complex, variable-condition scenarios. Most current UDA methods suffer from the dilemma of static alignment.26–28 Joint distribution adaptation (JDA) aims to align both the global marginal distribution and the class-aware conditional distribution. However, existing methods typically aggregate these two alignments using equal or static weights, failing to account for the dynamic nature of the learning process.29,30 The credibility of conditional distribution alignment is inherently dependent on the accuracy of pseudo-labels in the target domain. In the early training stages, the classifier’s predictions are often ambiguous or incorrect. Forcibly imposing strong conditional alignment based on these erroneous pseudo-labels causes the model to align samples to the wrong classes, exacerbating error propagation. This phenomenon, known as negative transfer,31–33 severely hinders model convergence. A mechanism that can dynamically perceive the reliability of pseudo-labels and adjust the alignment focus is largely missing in current literature. At the decision boundary level, traditional UDA diagnosis models typically employ the standard Softmax loss for classification.34–36 While Softmax effectively maximizes the probability of the correct class, it does not explicitly impose constraints on the geometric structure of the feature space. In bearing fault diagnosis, signals from different fault types or different severity levels often exhibit highly similar spectral patterns and temporal characteristics. These hard negative samples reside dangerously close to the decision boundaries.37,38 Softmax loss only ensures that the samples are correctly classified, but it does not guarantee a sufficient safety margin between classes. Without dedicated mechanisms to enforce sufficient interclass margin and separability, even minor domain shifts can cause these ambiguous samples to cross the decision boundary, resulting in misclassification.
To address these aforementioned challenges, this article proposes a novel fault diagnosis framework termed DW-JDA. This framework integrates time–frequency analysis, uncertainty-aware domain alignment, and margin-based classification into a unified architecture. First, to fully capture transient fault features under nonstationary conditions, one-dimensional vibration signals are transformed into two-dimensional time–frequency images via continuous wavelet transform (CWT). This allows the model to leverage the powerful feature extraction capabilities of depthwise separable convolution (DSConv) while retaining time–frequency localization. Second, to resolve the static alignment dilemma, an entropy-weighted discriminative joint distribution alignment (EW-DJDA) strategy is introduced. This mechanism utilizes the information entropy of the target predictions as a proxy for uncertainty. It dynamically regulates the contribution of marginal and conditional alignments, prioritizing global alignment in the early stages and gradually shifting focus to fine-grained class alignment as pseudo-labels become reliable, thus effectively preventing negative transfer. Finally, to enhance boundary robustness, an Hard Negative Margin Softmax (HNM-Softmax) loss function is designed. Unlike standard Softmax, HNM-Softmax imposes a rigorous additive margin penalty specifically on the most confusable hard negative classes. This forces the model to learn more discriminative features, pushing hard samples away from the decision boundary and ensuring robustness against domain shifts.
The main contributions of this article are summarized as follows:
A fault diagnosis framework (DW-JDA) is proposed. By organically integrating CWT with deep feature extraction, the model effectively extracts domain-invariant representations across variable operating conditions.
An EW-DJDA strategy is developed. This method adaptively balances the importance of global and fine-grained alignment based on prediction uncertainty, ensuring a smooth and stable optimization process.
An HNM-Softmax loss function is designed to specifically target hard-to-distinguish samples. It enhances the model’s discriminative power by maximizing the decision margin between the target class and the most competitive negative classes.
Extensive experiments on three datasets (Central South University (CSU), Case Western Reserve University (CWRU), and Beijing Jiaotong University (BJTU)) demonstrate that the proposed method achieves competitive performance across varying-speed transfer tasks.
Methodology
To address the significant fault feature distribution discrepancies and the challenge of distinguishing confusable samples in rolling bearings under cross-working-condition scenarios, a DW-JDA based on DSConv and hard negative sample mining is proposed, as shown in Figure 1.
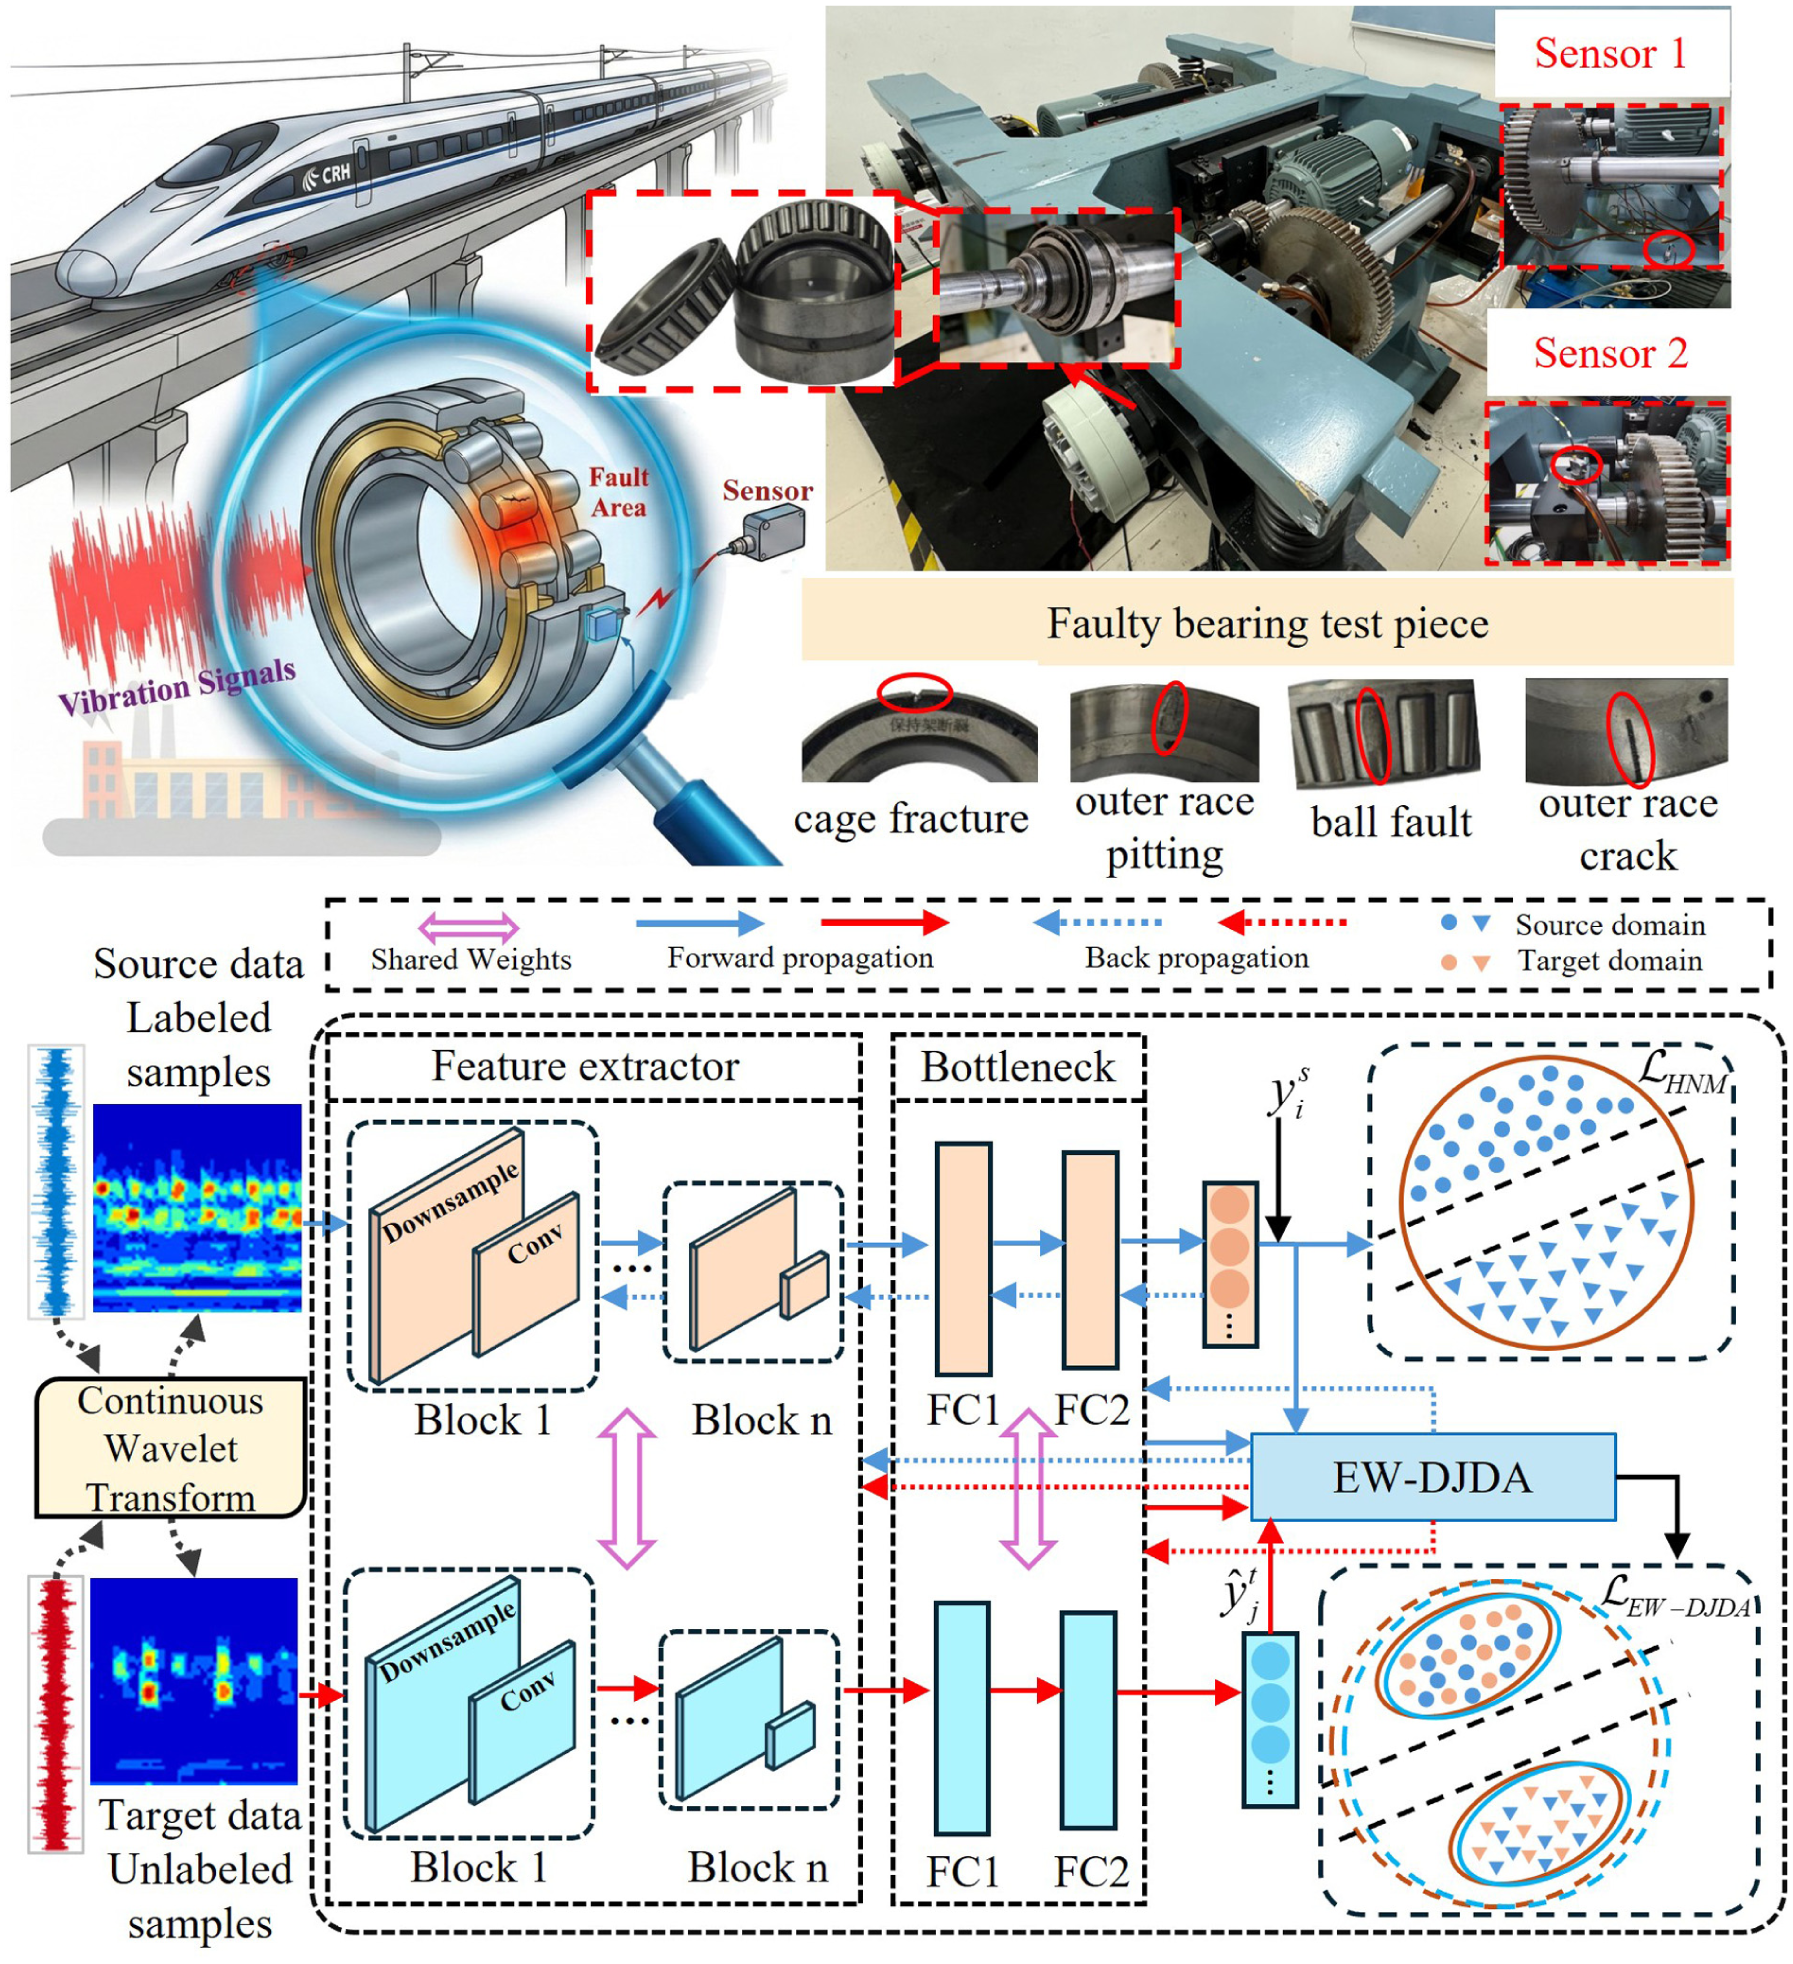
Schematic diagram of rolling bearing fault diagnosis model.
The framework consists of three main components: a data preprocessing module based on CWT, a DSConv-based hybrid network for feature extraction, and a domain adaptation module that incorporates the HNM-Softmax classifier and EW-DJDA.
The framework is designed to learn discriminative features from labeled source domain data and generalize them to the unlabeled target domain through multilevel distribution alignment strategies.
DSConv-based hybrid network for feature extraction
Due to the pronounced nonstationary and nonlinear characteristics of vibration signals in rolling bearings, directly feeding raw one-dimensional signals into the network often fails to effectively capture transient impact components. Therefore, this article first employs CWT to convert one-dimensional time-domain vibration signals into two-dimensional time–frequency images. CWT provides excellent localization properties in both the time and frequency domains simultaneously, effectively revealing multiscale time–frequency texture features in fault signals and supplying rich informational input for subsequent deep feature extraction. The computational formula for the wavelet transform is given by:
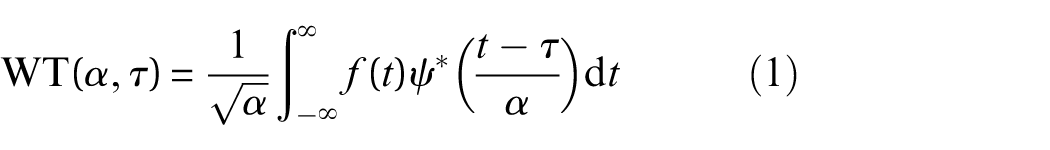
where
In the feature extraction stage, to ensure strong feature representation capability while reducing model parameters and computational complexity, this article adopts the backbone network structure based on DSConv proposed in our previous work MPAIT-Net. 39 Unlike standard convolution, DSConv decomposes the standard convolution operation into two sequential steps: Depthwise Convolution and Pointwise Convolution.
Specifically, let the input feature map be denoted as
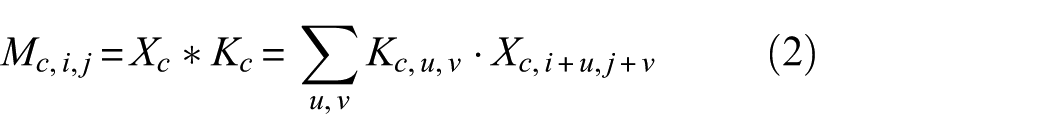
where
Subsequently, pointwise convolution employs
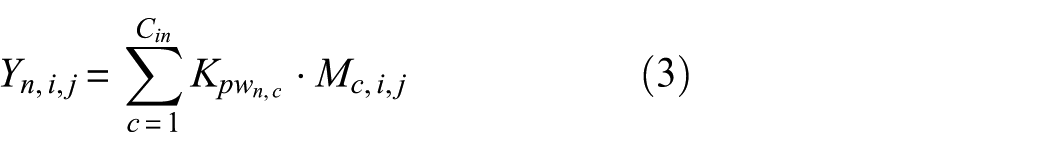
where
Through this decomposition, the computational cost is significantly reduced. Assuming an output channel number of
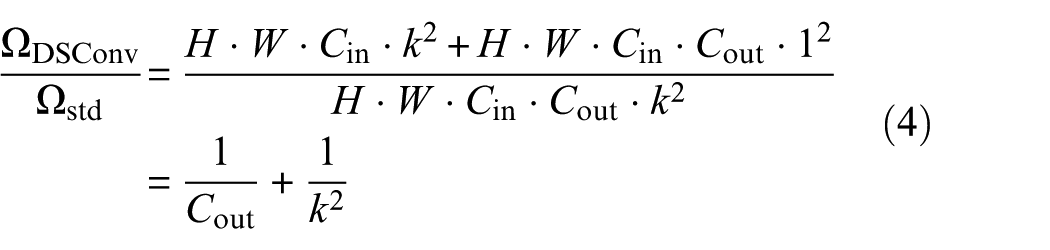
This formula indicates that as the number of channels and kernel size increase, DSConv significantly reduces computational load compared to standard convolution. After extracting local spatial features using these DSConv-based MPAConv blocks, the feature maps are processed through a patch convolution (Patch_conv) and rearrange operation to generate token sequences. These sequences are then fed into an improved vision transformer module. By combining the local inductive bias of DSConv with the global receptive field of the transformer, the complete backbone network (as detailed in Table 2) achieves highly robust and comprehensive feature representations. The extracted high-dimensional features are then mapped to a low-dimensional shared feature space via a fully connected bottleneck layer (Bottleneck), enabling subsequent alignment and classification by the classifier and domain adaptation module.
Entropy-weighted discriminative joint distribution alignment
To achieve discriminative feature learning with hard alignment for unlabeled target samples, an EW-DJDA module is designed in the shared feature space, as shown in Figure 2. This module is jointly optimized with the classification loss during the domain adaptation stage, guiding the feature extraction network to simultaneously reduce the marginal distribution discrepancies and class-conditional distribution discrepancies between the source and target domains, thereby obtaining more discriminative domain-invariant features.
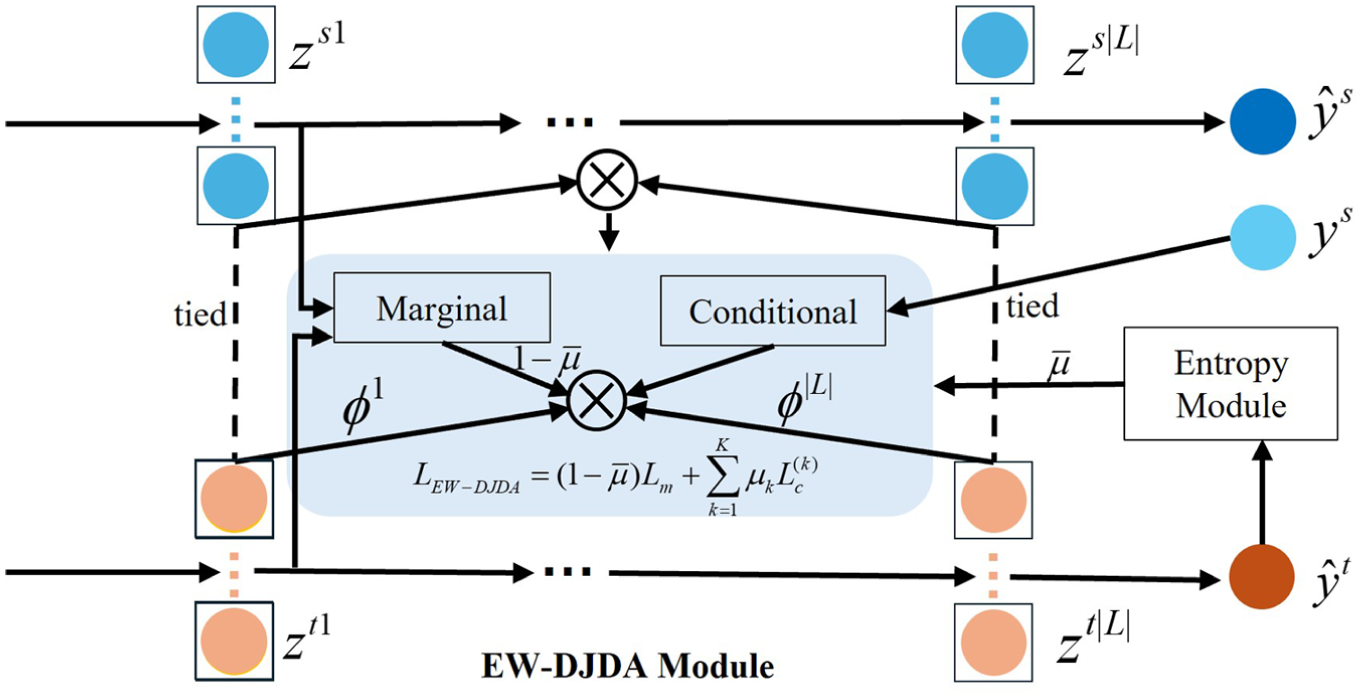
Schematic diagram of the EW-DJDA module. EW-DJDA: entropy-weighted discriminative joint distribution alignment.
Source domain and target domain samples are mapped to a shared feature space through a weight-shared feature extractor, yielding deep features
The detailed procedure is as follows: Let the feature extraction network be denoted as

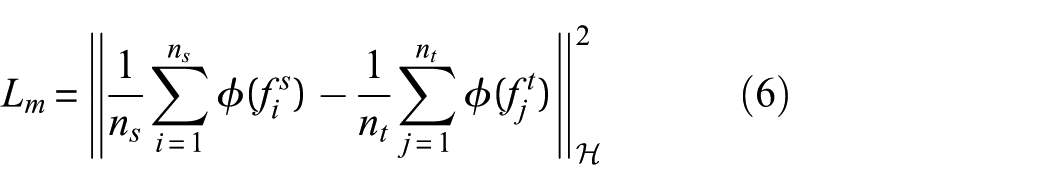
First, the Multikernel maximum mean discrepancy is employed to measure the distance between the source and target domains at the global distribution level, thereby facilitating marginal distribution alignment. Let
Building upon marginal alignment, a class-conditional distribution alignment term is introduced to further enhance feature discriminability. Ground-truth labels

Pseudo-labels are obtained as
where
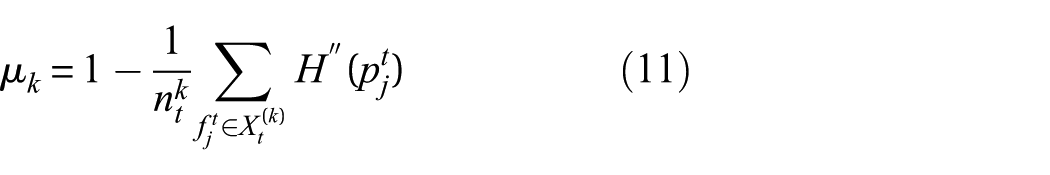
Since pseudo-label quality in the target domain is poor in early training and gradually improves, directly enforcing strong conditional alignment may lead to erroneous alignment. To address this, an adaptive weight
which is normalized by the number of classes:
Lower
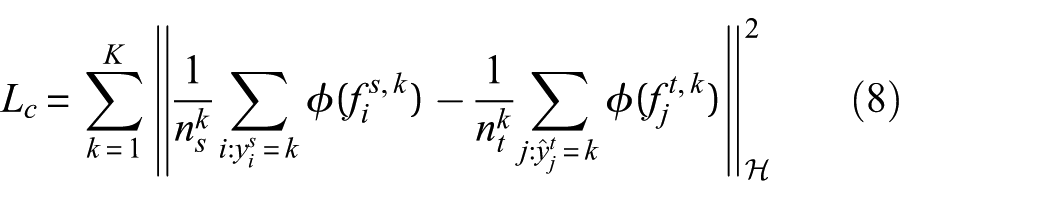
where
It is worth noting that although Equation (8) utilizes hard pseudo-labels, the potential negative transfer caused by noisy predictions is effectively suppressed by the classwise reliability weighting mechanism
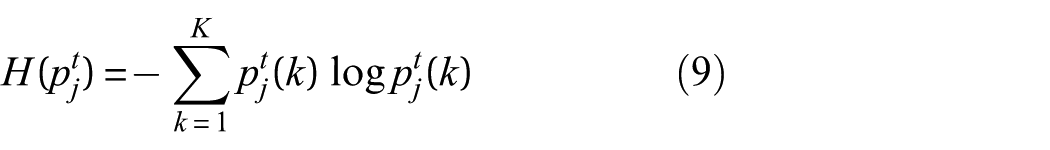
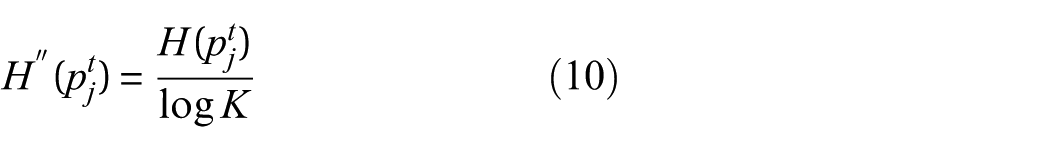
To maintain the balance between global marginal alignment and fine-grained conditional alignment, the loss for the entropy-weighted discriminative joint distribution alignment (
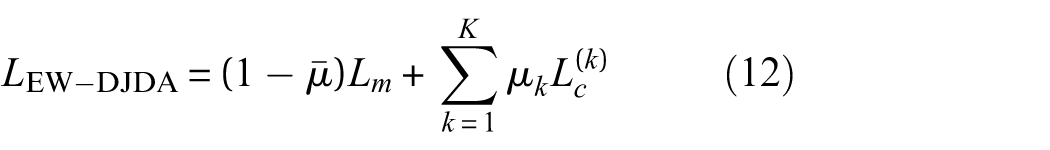
where
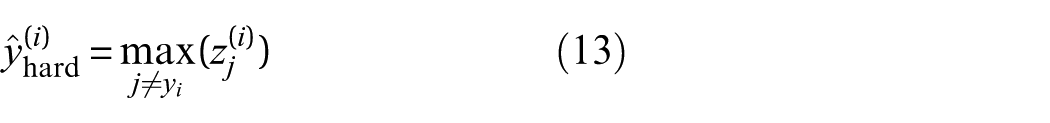
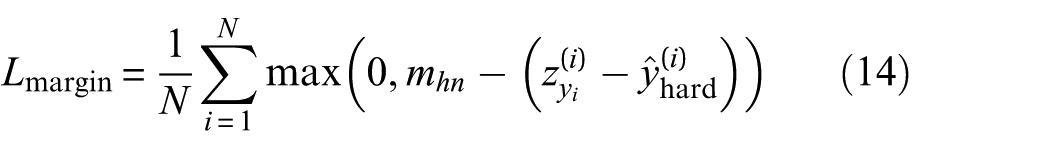
Hard-Negative Margin Softmax
Conventional loss functions optimize global probability distributions by treating all negative classes equally, but in fault diagnosis, feature confusion mainly occurs between similar classes, and ignoring hard negatives near decision boundaries can lead to misclassifications under domain shifts. To improve discriminability for confusable faults, we propose HNM-Softmax, which applies relative margin constraints to explicitly increase the distance between the target class and the most confusable interfering class, as shown in Figure 3.
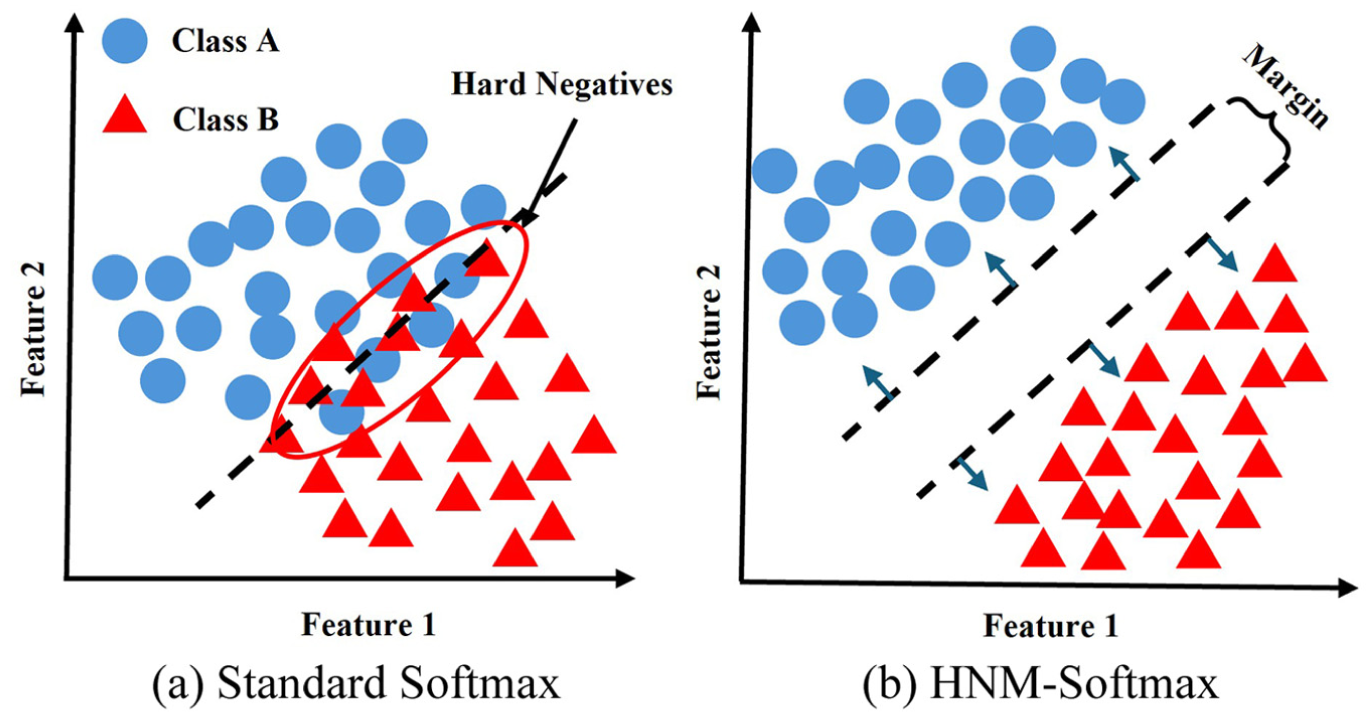
Schematic diagram of decision boundaries in the feature space. (a) Standard Softmax leads to confusion of difficult-to-classify samples at the boundaries and (b) HNM-Softmax introduces relative margin constraints, significantly increasing the inter-class distance. HNM-Softmax: Hard Negative Margin Softmax.
For an input sample
Here,
where
Ultimately, the HNM-Softmax loss

where
The overall optimization objective of HNM-Softmax is to explicitly maximize the margin and separability between confusable classes, ensuring robust decision boundaries. Through this targeted hard negative suppression strategy, the feature extractor learns discriminative features with clearer decision boundaries, thereby effectively supporting the EW-DJDA module in achieving more precise alignment under complex operating conditions.
Optimization objective and model training
The overall optimization objective comprises two components: one is the hard negative margin classification loss

where
Considering the training stability of deep domain adaptation networks, enforcing alignment in the early stages of training, when the feature extractor has not yet extracted effective discriminative features, may induce negative transfer. To mitigate this, a staged training strategy is adopted in this paper. When the training epoch is less than the threshold
Experimental analysis and validation
To comprehensively validate the effectiveness of the proposed method and its generalization capability across different operating conditions, three bearing datasets were selected for experimental evaluation. These include one laboratory self-constructed dataset and two publicly available datasets: the CWRU dataset and the BJTU dataset. The datasets encompass a wide range of rotational speeds from low to high, varying sampling frequencies, and complex fault patterns, thereby providing diverse data support for assessing the diagnostic performance of the model. Detailed parameter information for the three datasets is presented in Table 1.
Detailed information of the dataset.
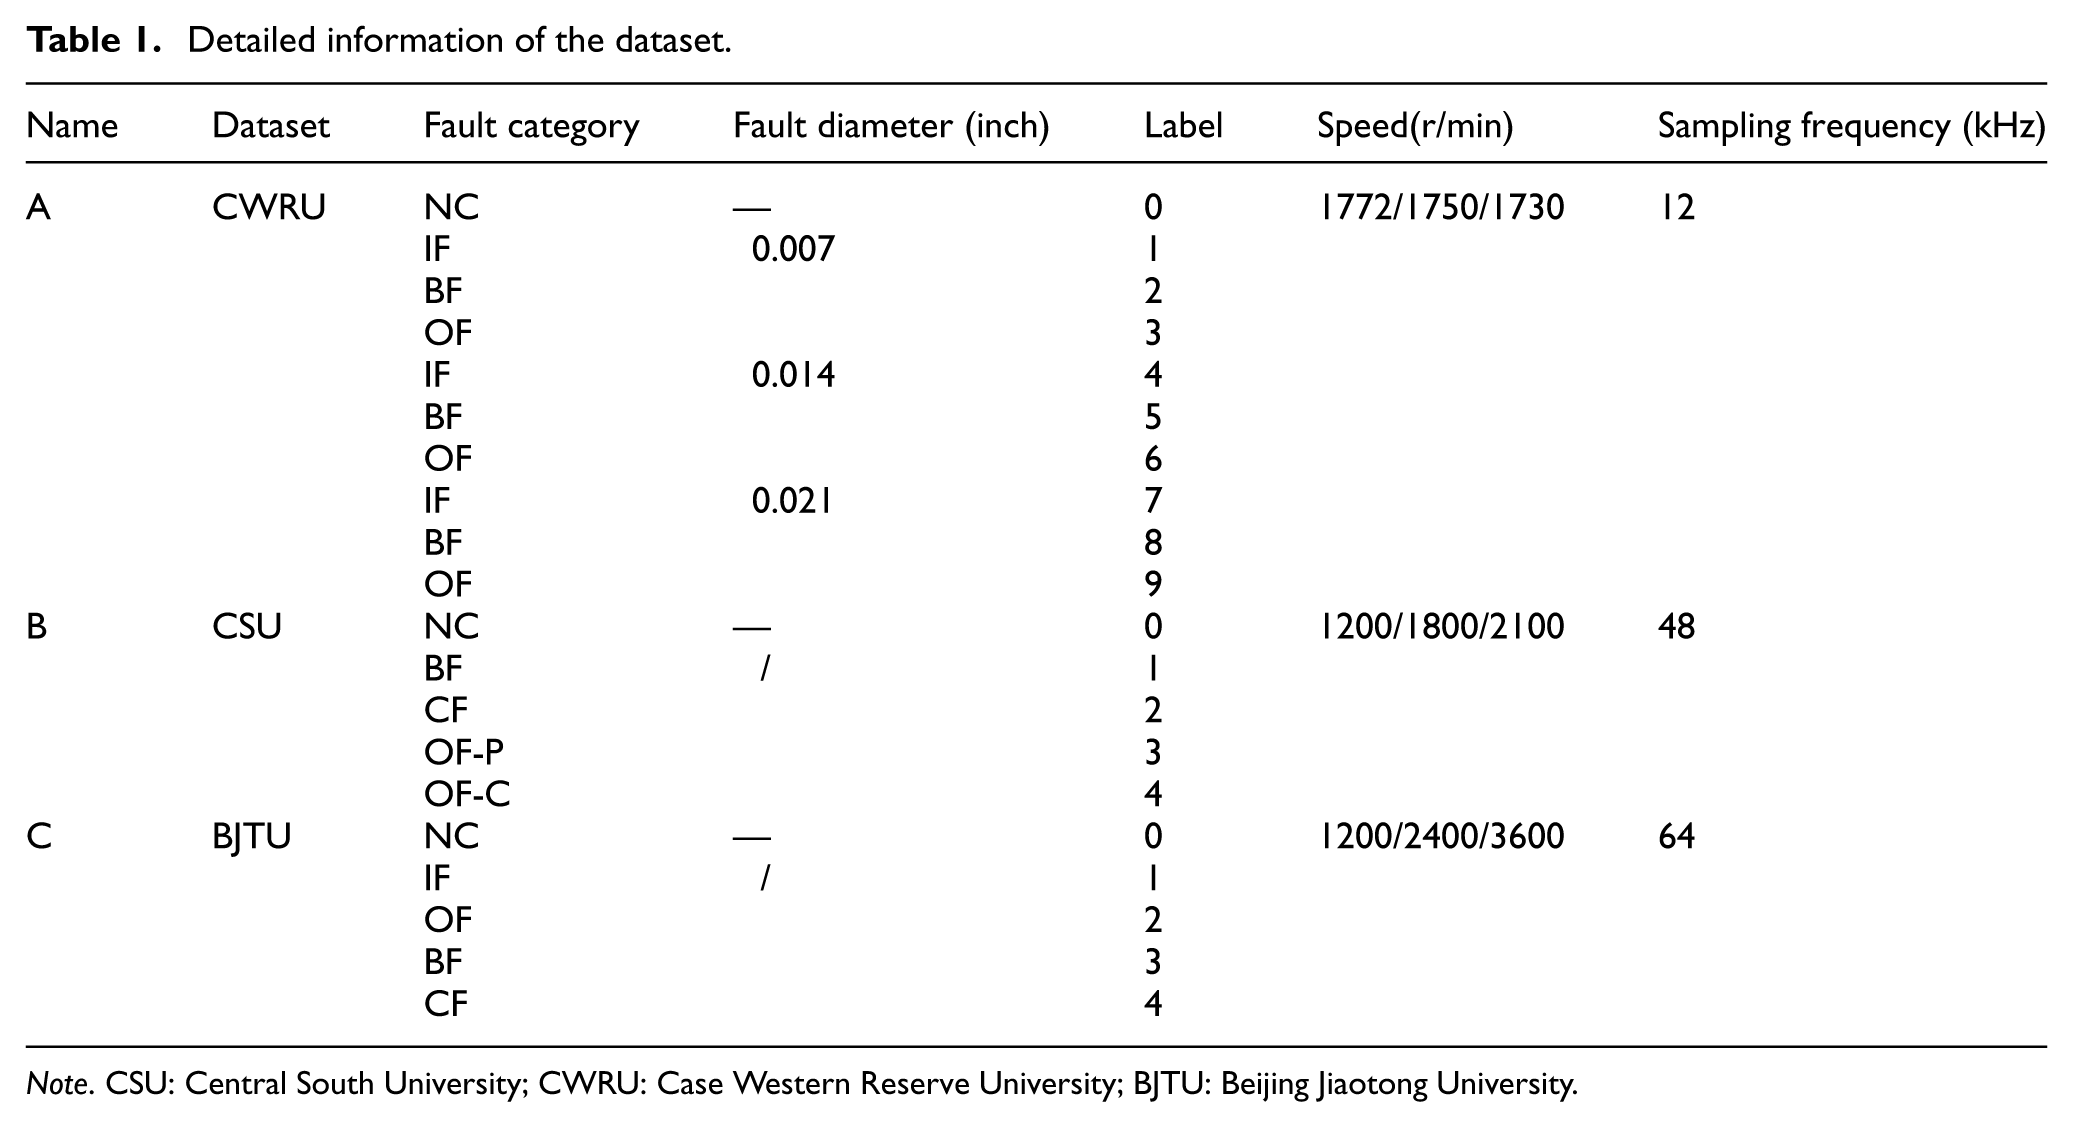
Note. CSU: Central South University; CWRU: Case Western Reserve University; BJTU: Beijing Jiaotong University.
CSU dataset: This dataset was acquired from a small bogie test rig at the Key Laboratory of Rail Traffic Safety, Ministry of Education, CSU, as shown in Figure 4. Vibration signals were recorded at a sampling frequency of 48 kHz. The data encompass three operating speeds: 1200, 1800, and 2100 r/min. This dataset emphasizes complex fault scenarios, including five distinct health states: normal condition (NC), ball fault (BF), cage fracture (CF), and two specific outer race faults (outer race pitting (OF-P) and outer race crack (OF-C)). In contrast to the simplified fault classifications in other datasets, it incorporates specific damage patterns such as pitting and cracking (OF-P and OF-C) as well as cage fracture (CF).
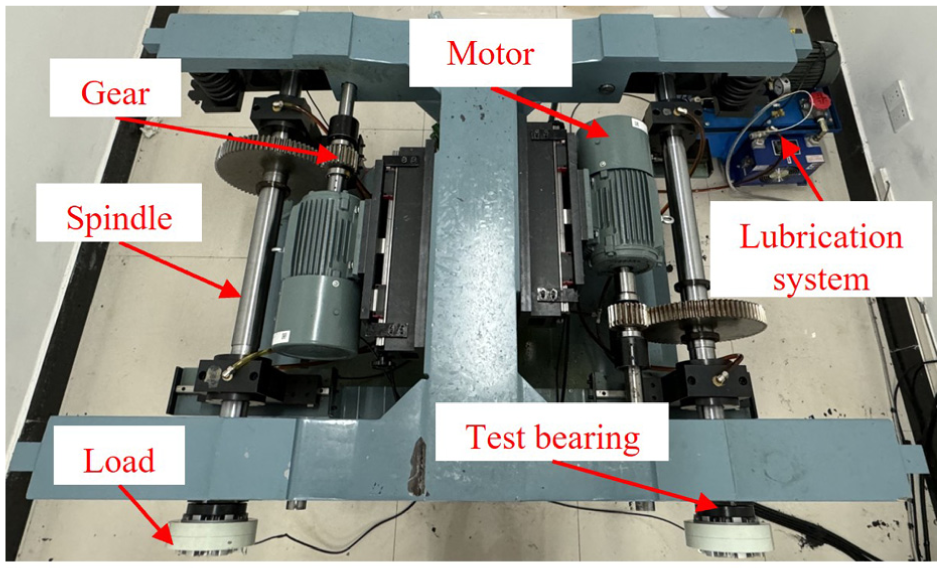
Small bogie test bench.
CWRU dataset 40 : This dataset originates from the CWRU Bearing Data Center. The experiments were conducted using a test rig comprising an electric motor, a torque transducer, and a dynamometer. Vibration signals were acquired from the drive-end bearings and fan-end bearings at a sampling frequency of 12 kHz. The dataset encompasses three distinct rotational speeds: 1772, 1750, and 1730 r/min. The bearing health conditions include one normal state (NC) and three different fault types: inner race fault (IF), ball fault (BF), and outer race fault (OF). For each fault type, single-point defects were introduced via electro-discharge machining, with fault severities categorized into three levels (fault diameters): 0.007, 0.014, and 0.021 inches. Consequently, for each rotational speed, the dataset comprises 10 distinct health states (one normal state + three fault types × three fault diameters).
BJTU dataset 41 : This dataset is sourced from the test rig at BJTU. It encompasses high-speed operating conditions, with motor rotational speeds set to 1200, 2400, and 3600 r/min, respectively. Vibration signals were recorded at a sampling frequency of 64 kHz. The dataset includes five bearing health states: normal condition (NC), inner race fault (IF), outer race fault (OF), ball fault (BF), and cage fracture (CF).
To further validate the robustness and effectiveness of the proposed method under variable operating conditions, cross-condition diagnostic experiments were designed within the aforementioned three datasets. These experiments simulate common rotational speed fluctuation scenarios in industrial settings by adopting a transfer learning paradigm: data from one specific speed serve as the source domain, while data from different speeds are treated as the target domain for cross-domain fault diagnosis. All experiments were conducted on a unified computing platform to ensure fair comparisons. The hardware environment features an Intel Core i5-12600KF CPU and an NVIDIA GeForce RTX 4070Ti SUPER GPU. The software development environment is based on the Windows operating system, utilizing Python 3.9 as the programming language, with the model implemented under the PyTorch 2.2.1 DL framework and GPU acceleration enabled via CUDA 12.1.
The initial learning rate was set to 0.001, and the Adam optimizer was employed for model parameter updates. To prevent overfitting and enhance generalization capability, a weight decay coefficient of 2 × 10⁻⁴ was applied. The total number of training epochs was set to 100. To ensure that the feature extractor acquires sufficient discriminative features from the source domain prior to domain alignment, a staged training strategy was adopted: the domain adaptation starting epoch was set to 30, meaning that only source domain classification training is performed in the first 30 epochs, after which the domain adaptation loss is formally introduced for cross-domain transfer optimization from epoch 30 onward. Additionally, a step-wise learning rate scheduling mechanism was incorporated during training, with a decay factor of 0.1 applied automatically at epochs 50 and 75. These specific milestones were determined through empirical observation of the training loss curves during preliminary experiments. Specifically, after the domain adaptation module is activated at epoch 30, the loss typically begins to plateau around epoch 50. Applying the first decay at this stage allows the optimizer to overcome local oscillations and reach a better minimum. The second decay at epoch 75 facilitates fine-grained parameter tuning in the final stages, thereby promoting stable convergence.
The sliding window length is set to 1024 samples, with a sliding step size of 1024. Time-series segments are obtained via this sliding window approach, and each segment is subsequently subjected to CWT. The sample acquisition process is illustrated in Figure 5. The detailed architecture of the model is presented in Table 2.
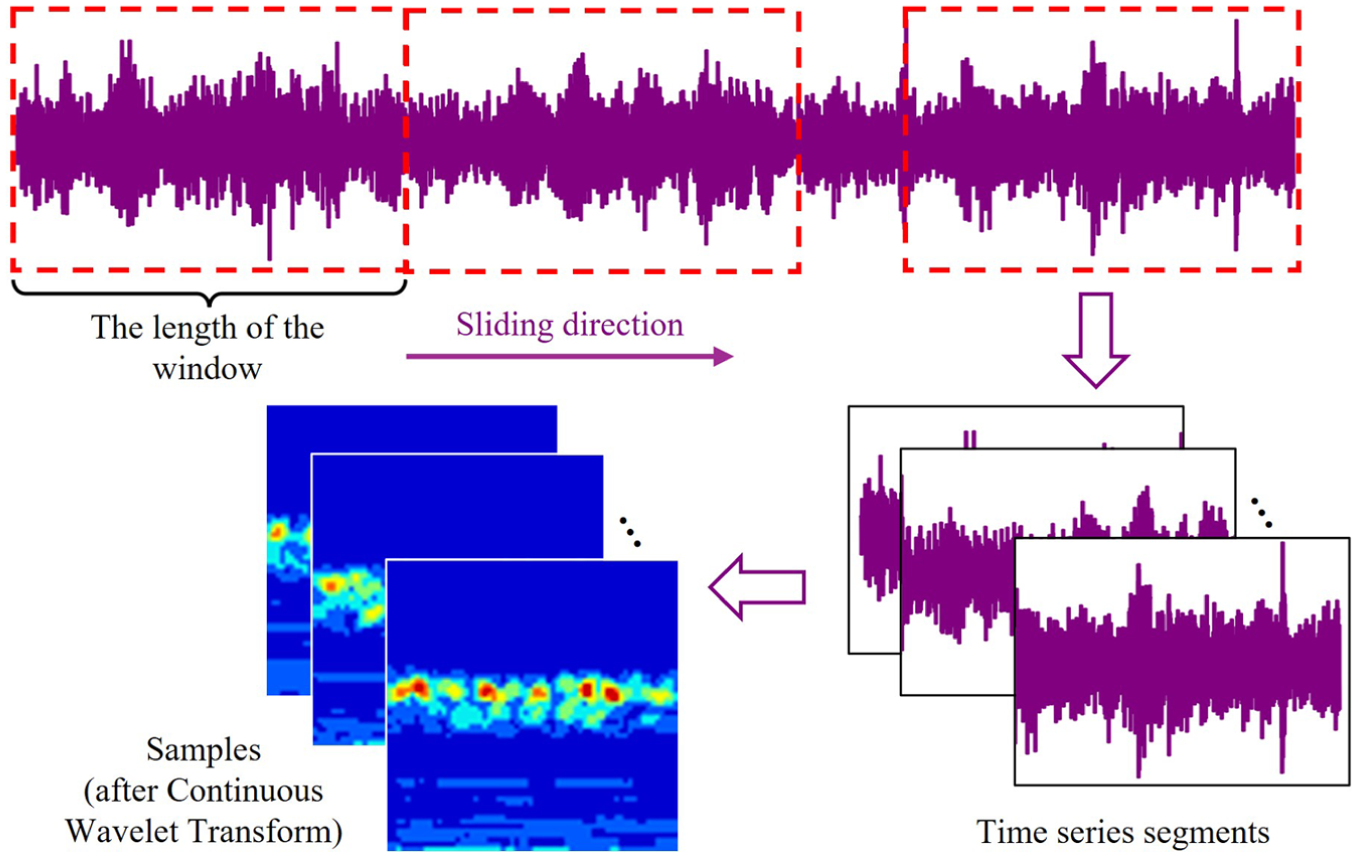
Sample acquisition process.
Detailed structure of the model.
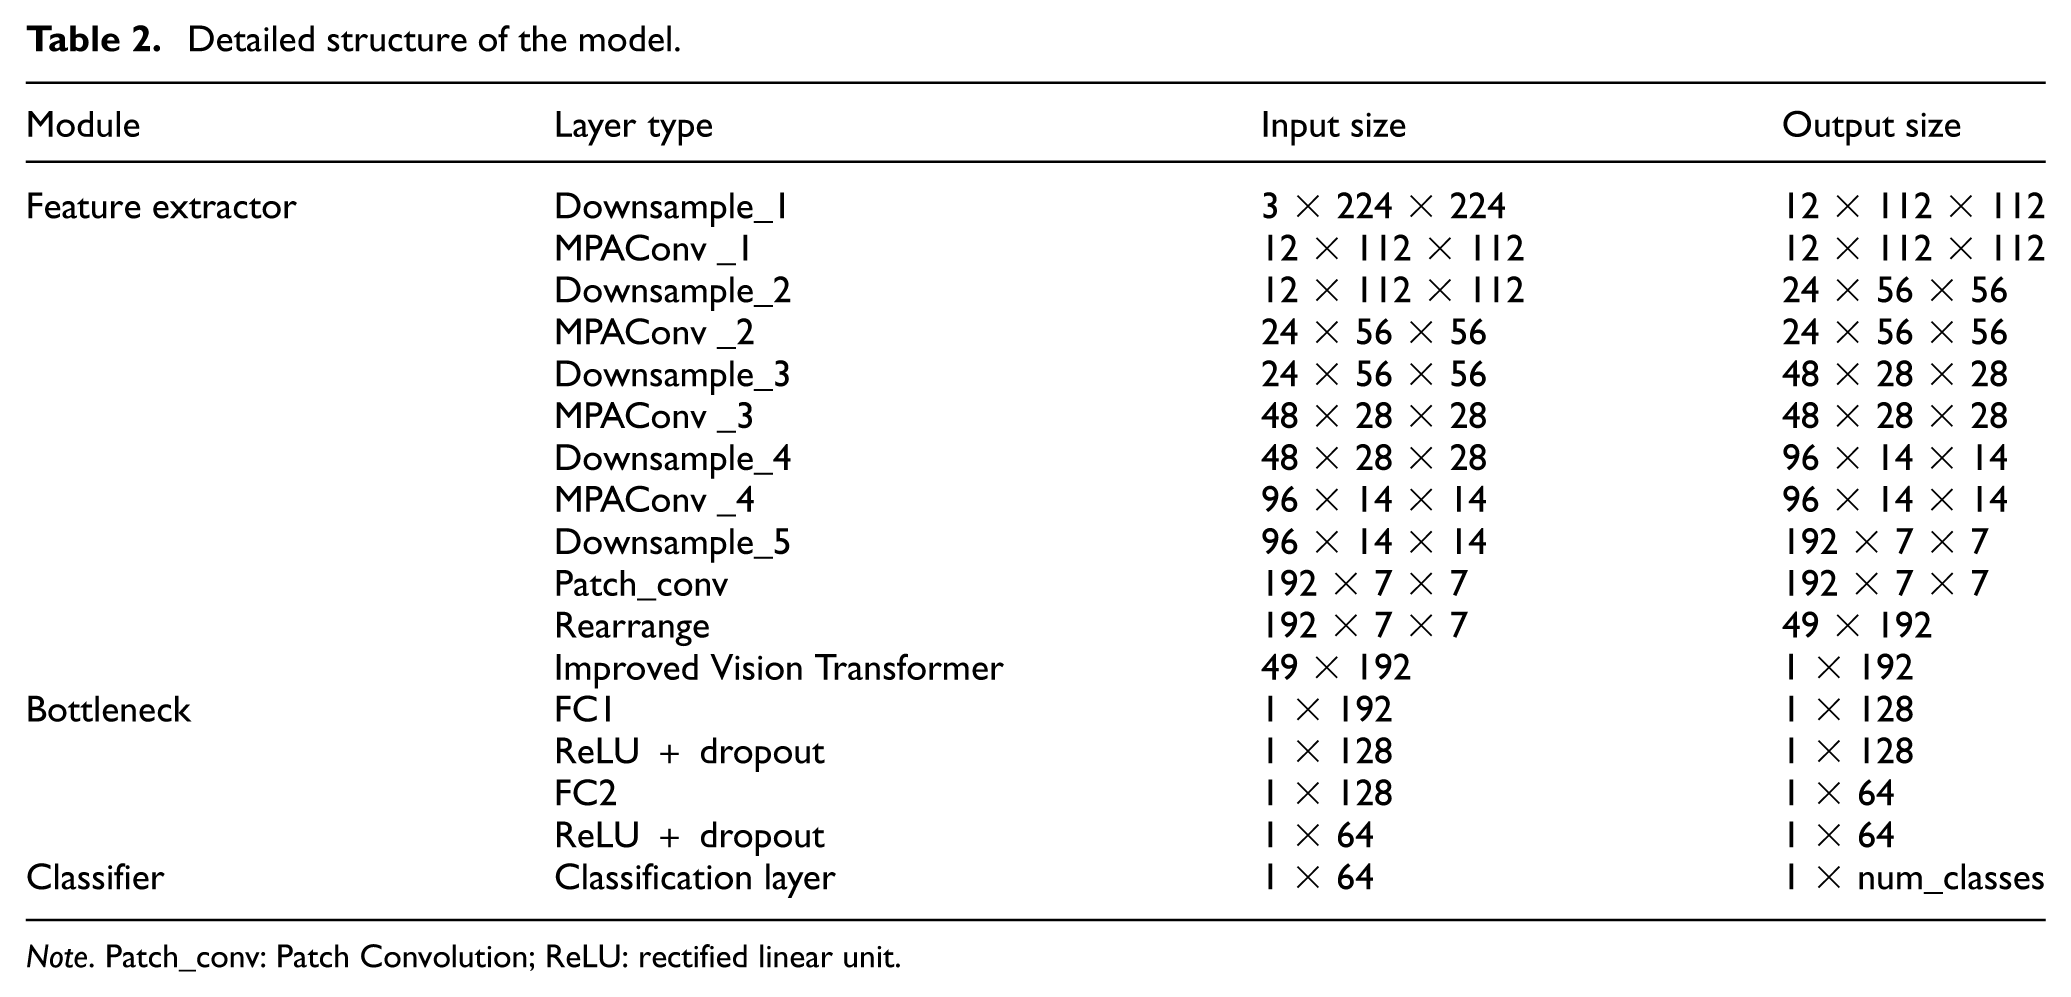
Note. Patch_conv: Patch Convolution; ReLU: rectified linear unit.
To rigorously prevent any potential data leakage during model training and evaluation, the data preparation protocol follows a strict split order. Given the UDA paradigm, the training (source) and testing (target) domains are naturally partitioned by their distinct physical operating conditions (e.g., different rotational speeds). This physically guarantees that the train and test domains are split prior to any segmentation at the raw acquisition level. Therefore, all segments derived from a single raw recording are exclusively kept within a single domain partition, strictly eliminating cross-domain leakage.
Furthermore, the utilized sliding window length is 1024 points with a step size of 1024 points, ensuring that all time-series segments are strictly nonoverlapping. Taking the CSU dataset as a representative example, each raw acquisition record for a specific health state under a given speed contains exactly 245,760 raw data points. Applying the nonoverlapping sliding window yields exactly 240 derived segments per class for each domain. Consequently, a complete single domain comprising five health states contains a total of 1,228,800 raw data points, which translates to exactly 1200 independent segments. Within each domain, these independent segments are then randomly partitioned into 80% for model training/adaptation and 20% for validation, strictly maintaining class balance without segment overlap.
To comprehensively evaluate the performance superiority of the proposed method, representative classical DL models and state-of-the-art domain adaptation methods were selected as baselines for comparison. The compared methods include conditional adversarial domain adaptation network (CADAN), 42 deep discriminative domain adaptation network (DDDAN), 43 deep correlation alignment (DCORAL), 44 domain-adversarial neural network (DANN), 45 adaptive intermediate class-wise distribution alignment (AICDA), 46 and dynamic joint distribution adaptation (DJDA). 47 To mitigate the effects of randomness in network initialization and optimization, each transfer task was repeated independently five times under identical settings. The final result reported in the tables is the arithmetic mean of the five target-domain accuracies, and the corresponding standard deviation is also provided.
Experiments based on the CSU dataset
This section evaluates the effectiveness of DW-JDA under complex fault modes and varying speeds using the self-built CSU dataset. This dataset incorporates diverse failure modes, such as pitting, cracks, and cage breakage. To mimic the operational variations inherent in industrial environments, six cross-condition transfer tasks (TB1–TB6) were established by pairing data from three distinct speeds: 1200, 1800, and 2100 r/min. Detailed task settings and the resulting average diagnostic accuracies for all models are presented in Tables 3 and 4, respectively.
Cross-condition transfer tasks on the CSU dataset.
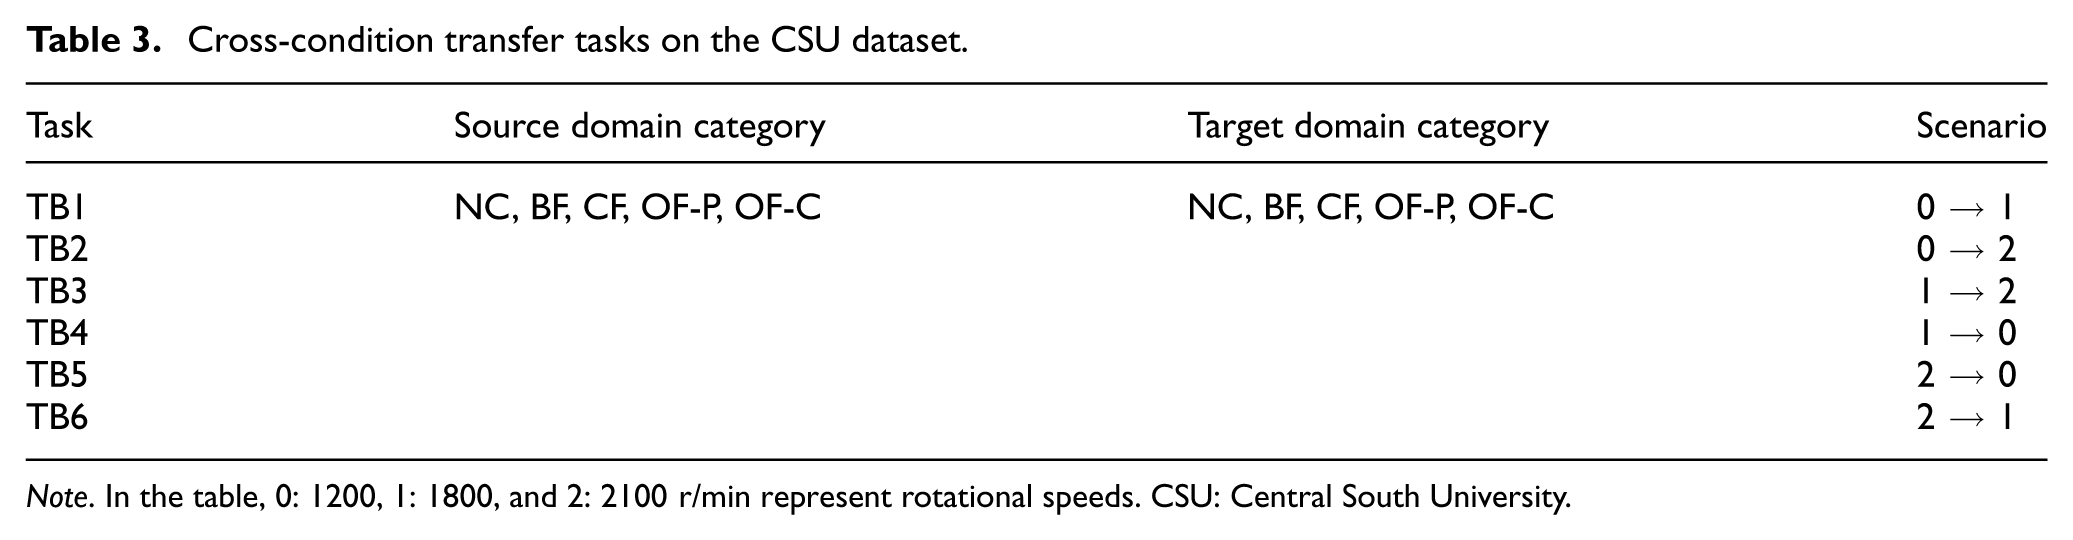
Note. In the table, 0: 1200, 1: 1800, and 2: 2100 r/min represent rotational speeds. CSU: Central South University.
Diagnostic accuracy (%) on the CSU dataset.
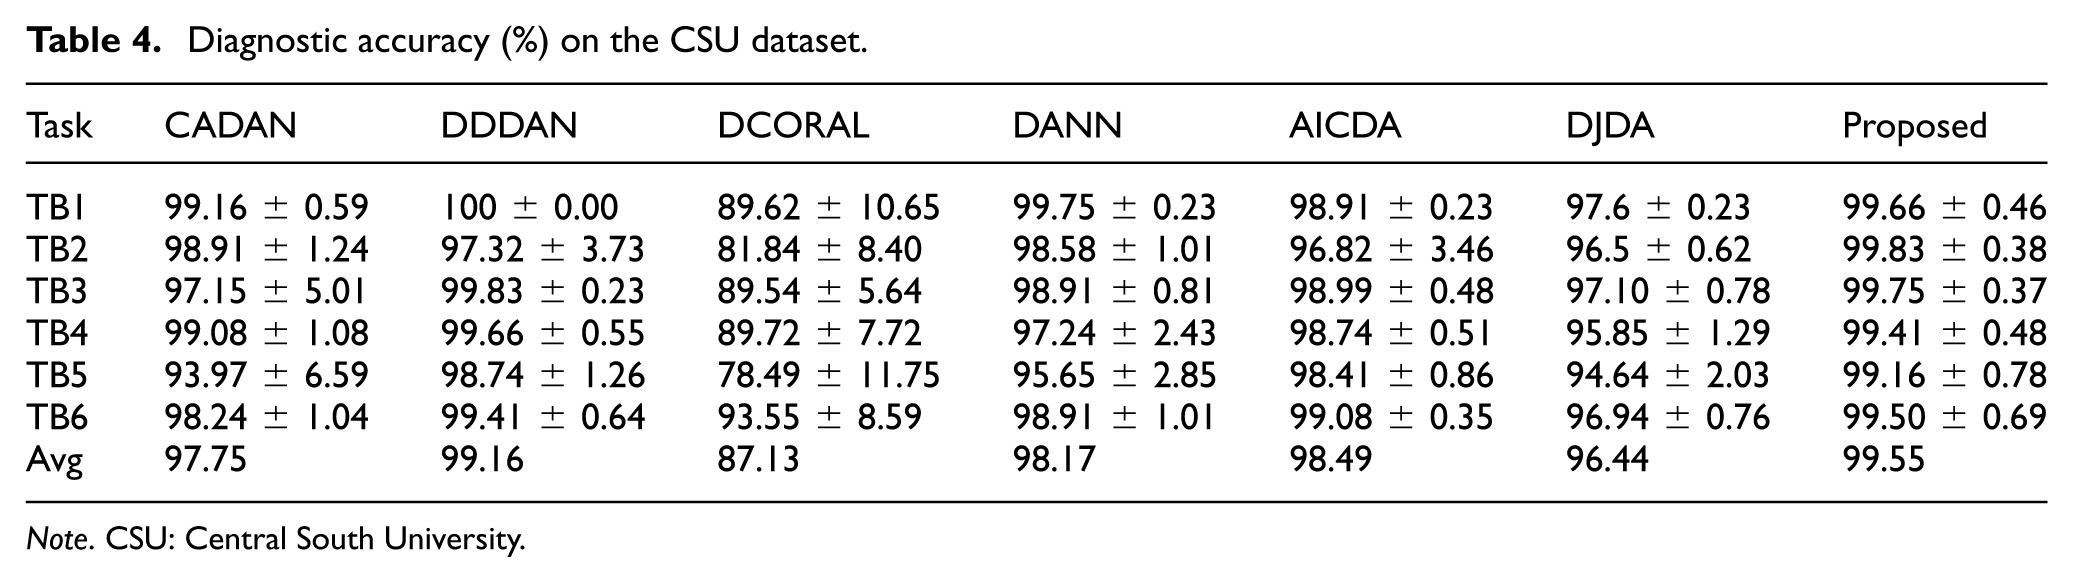
Note. CSU: Central South University.
As shown in Table 4 and Figure 6, the proposed method achieves the highest or among the highest mean accuracies across the transfer tasks, while maintaining low run-to-run variability, achieving an average accuracy of 99.55% across all transfer tasks and showing competitive or best average performance among the compared transfer learning methods. The bar chart and corresponding error bars in Figure 6 further illustrate the exceptional stability of the proposed method across independent trials. Unlike DCORAL, which suffers significant performance degradation and severe variance (up to 11.75% in task TB5), the proposed method maintains accuracy consistently above 99% with standard deviations strictly constrained below 0.8% (0.37–0.78%) across all tasks.
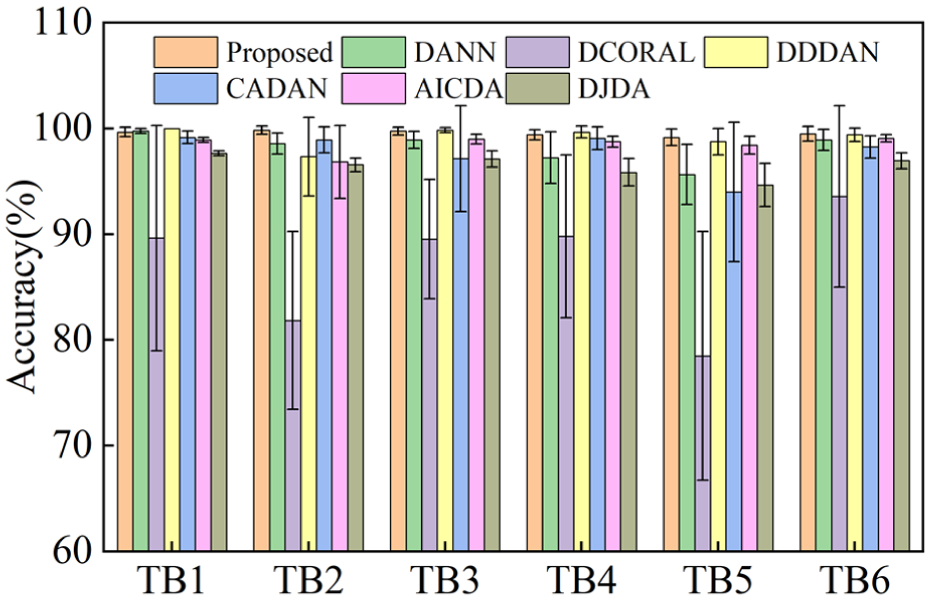
Average accuracy of each method on the CSU dataset. CSU: Central South University.
CADAN and DDDAN display localized fluctuations (up to 6.59% for CADAN in TB3 and TB5, and 3.73% for DDDAN in TB2); AICDA generally maintains small variances but struggles noticeably in TB2 (3.46%); and DANN and DJDA demonstrate moderate stability but still experience variances up to 2.85 and 2.03%, respectively, in TB5.
To further evaluate the discriminative ability of the model in handling complex fault modes, the TB5 transfer task was selected for confusion matrix visualization analysis, as shown in Figure 7(a). It can be seen that even under conditions with large speed variations, the proposed method achieves 100% classification accuracy across all fault categories. Notably, the CSU dataset contains two easily confused fine-grained faults: outer race pitting (OF-P) and outer race cracks (OF-C), as illustrated in Figure 8.
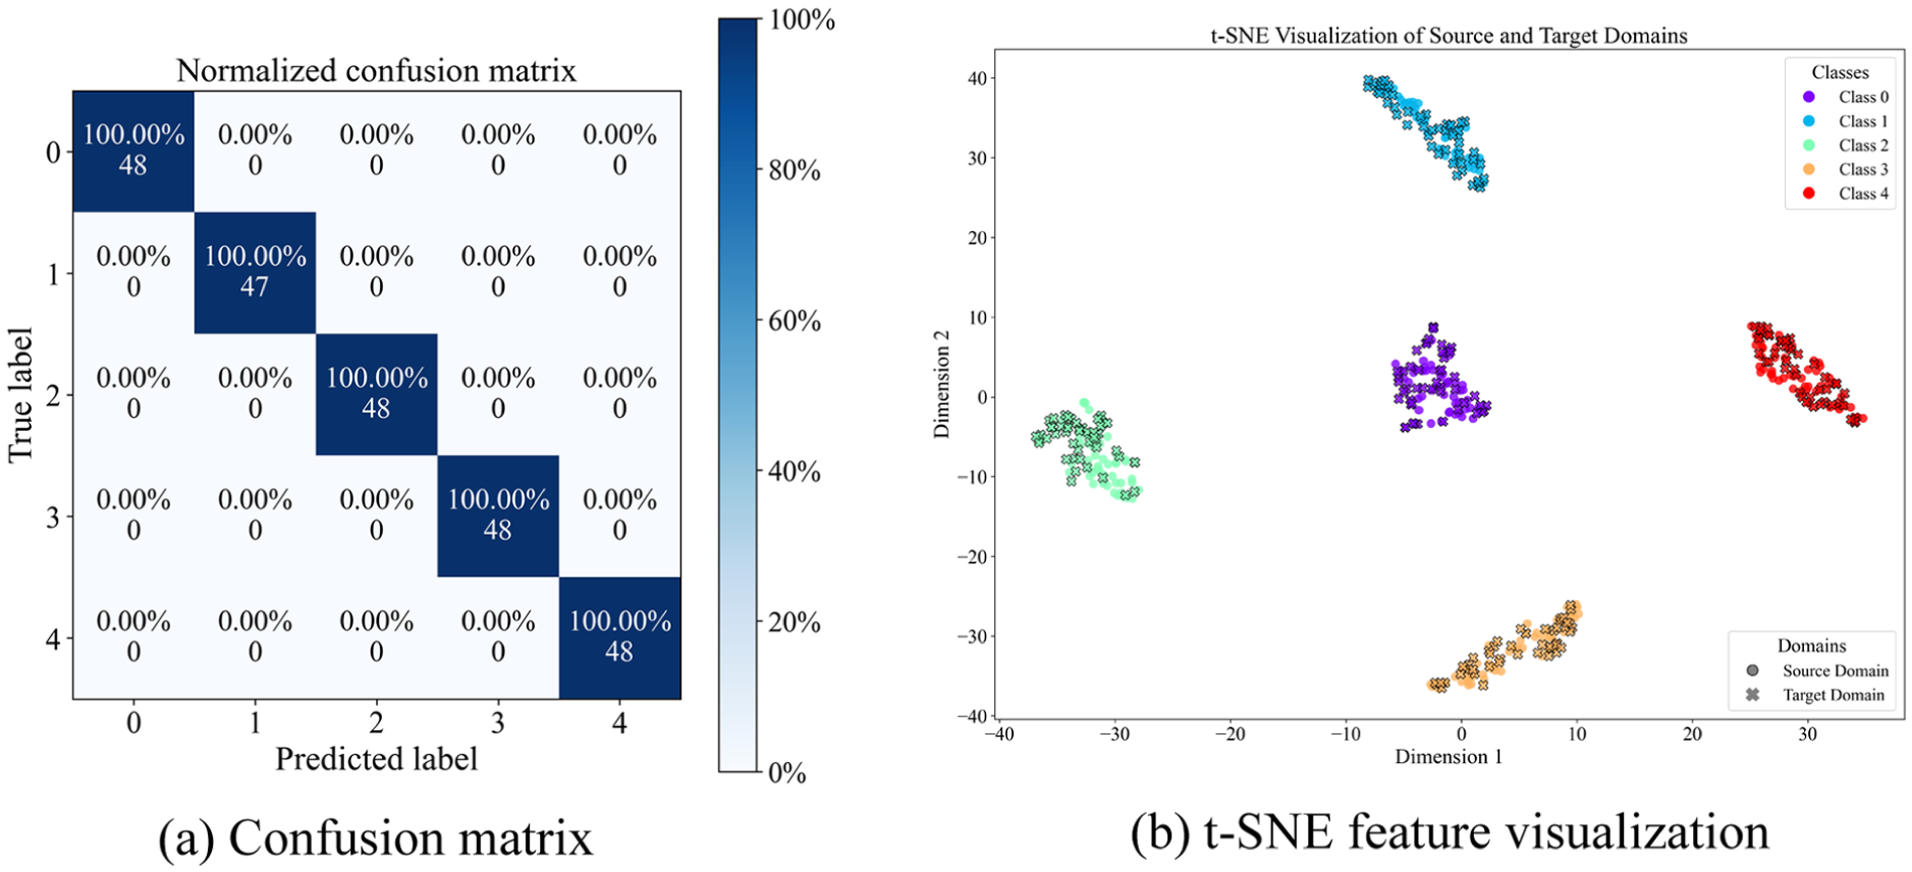
Visual analysis of TB5 task: (a) confusion matrix and (b) t-SNE feature visualization. t-SNE: t-distributed stochastic neighbor embedding.
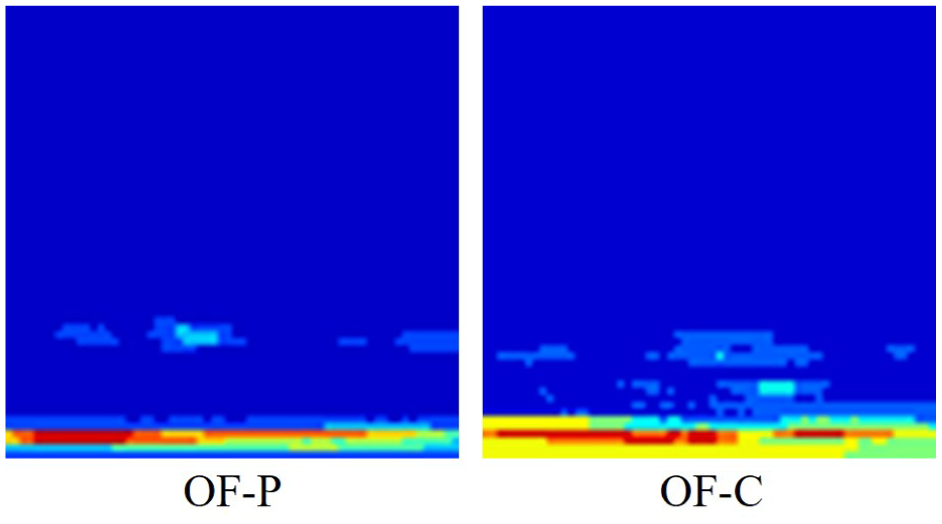
Time–frequency plots of OF-P and OF-C signals after CWT processing. CWT: continuous wavelet transform.
Furthermore, to visually demonstrate the domain alignment effect in the feature space, Figure 7(b) presents the t-distributed stochastic neighbor embedding (t-SNE) visualization of the high-dimensional features for the TB5 task. Samples of different health states form clearly bounded clusters in the two-dimensional space. This implies that despite the speed discrepancy between domains, the EW-DJDA module effectively reduces the differences in marginal and conditional distributions via its dynamic weighting strategy. Consequently, robust domain-invariant features are extracted, ensuring the model’s generalization performance on the target domain.
Experiments based on the CWRU dataset
To validate the effectiveness of the model on a standard benchmark, this section employs the CWRU dataset for experimentation. As one of the most widely used public datasets in the field of bearing fault diagnosis, CWRU includes three subtle speed variations (1772, 1750, and 1730 r/min) induced by different loads. By using these three operating conditions interchangeably as source and target domains, six transfer tasks (TA1 to TA6) were designed. Detailed descriptions are provided in Table 5.
Cross-condition transfer tasks on the CWRU dataset.
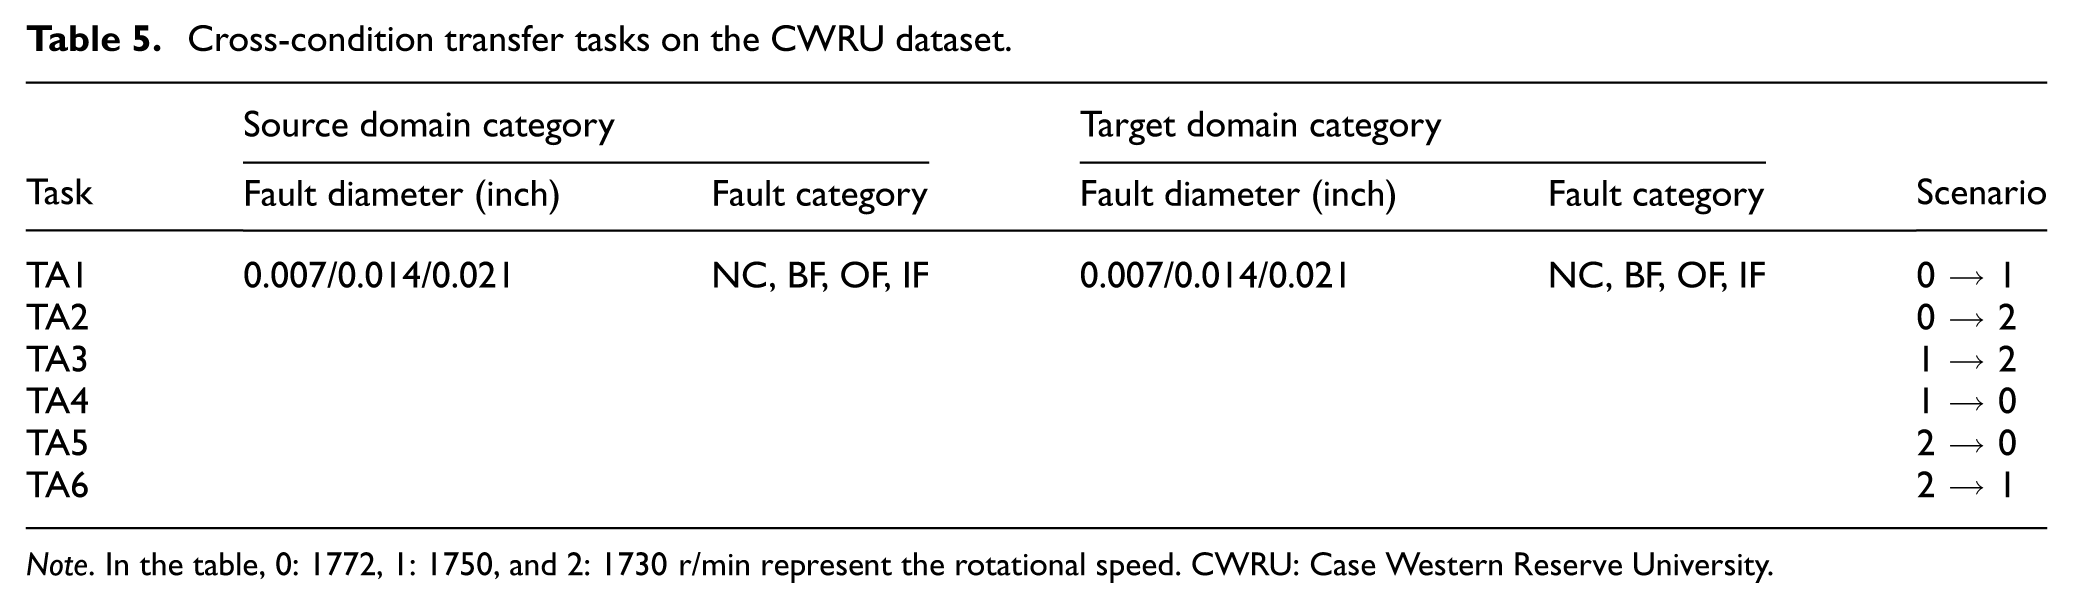
Note. In the table, 0: 1772, 1: 1750, and 2: 1730 r/min represent the rotational speed. CWRU: Case Western Reserve University.
Based on the experimental results presented in Table 6, the proposed method achieves highly competitive performance across six cross-domain transfer tasks on the CWRU dataset, with an average accuracy of 99.92%. Notably, in the two more challenging tasks, TA2 and TA5, which involve the largest rotational-speed discrepancies, the proposed method maintains nearly 100% diagnostic accuracy. These results indicate that the proposed method is effective in extracting domain-invariant features and mitigating the domain shift caused by varying operating conditions.
Diagnostic accuracy (%) on the CWRU dataset.
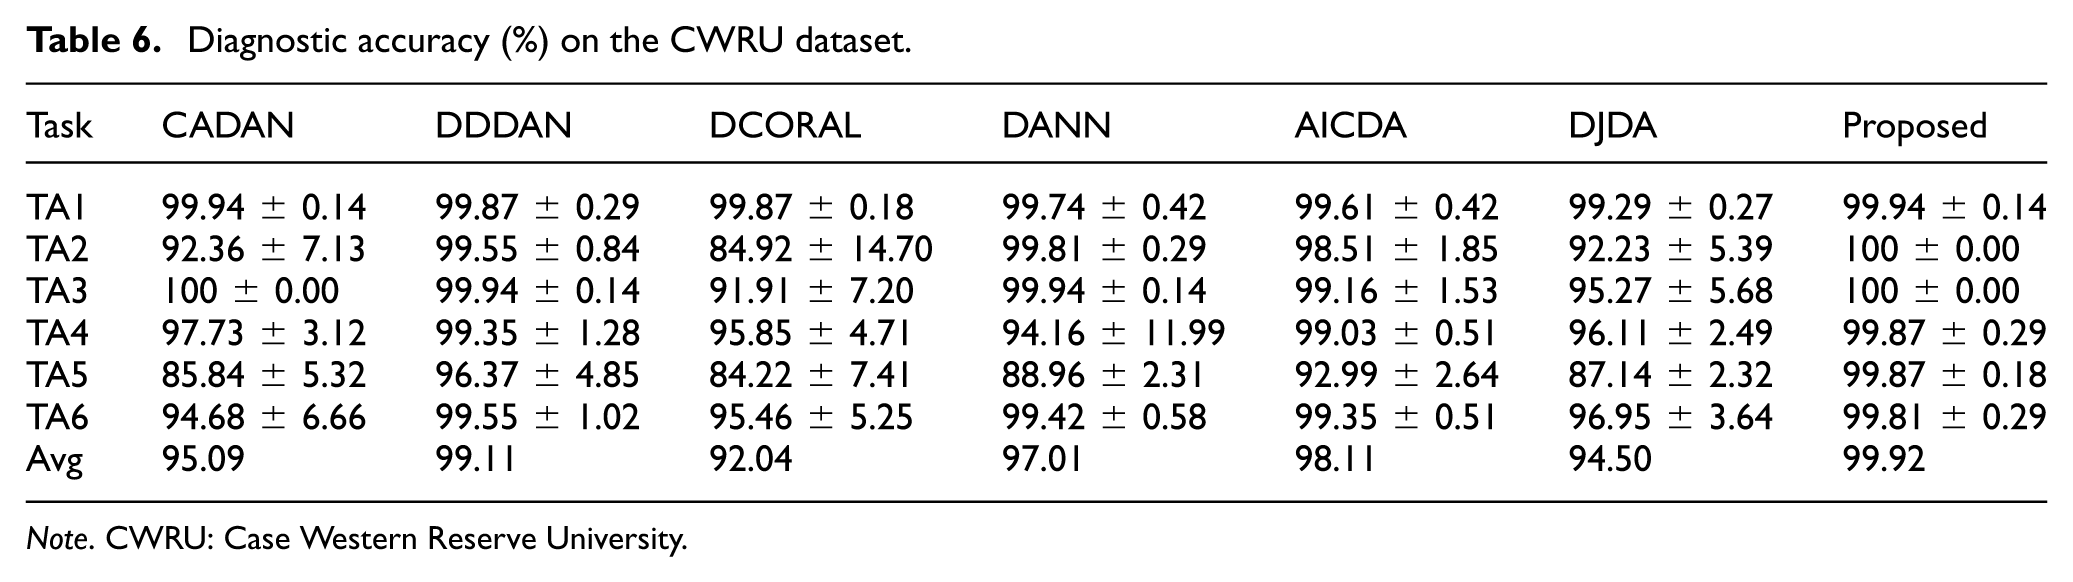
Note. CWRU: Case Western Reserve University.
Furthermore, the error bar analysis in Figure 9 shows that the proposed method exhibits low run-to-run variability across repeated experiments. While some comparison methods show larger performance fluctuations under speed changes, the proposed method maintains competitive accuracy together with stable generalization behavior.
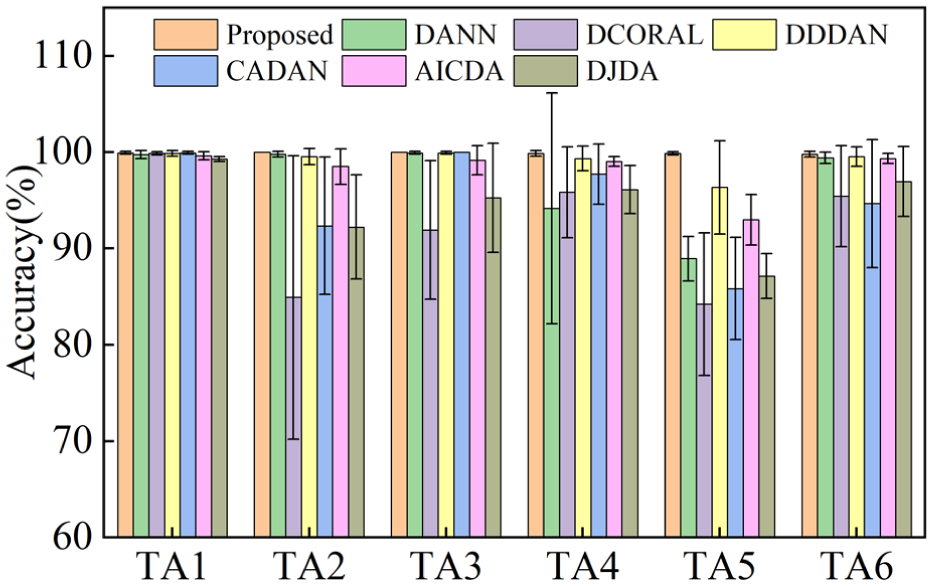
Average accuracy of each method on the CWRU dataset. CWRU: Case Western Reserve University.
Figure 10(a) and (b) presents the normalized confusion matrices for the proposed method and DDDAN on the TA5 task’s worst-case results. DDDAN struggles to distinguish faults of varying severities, specifically different diameters of the same Ball Fault type. As shown in Figure 10(b), this causes significant mutual misclassification: 62.50% of label 2 (0.007 inch) samples are misclassified as label 8 (0.021 inch), and 86.96% of label 8 samples are misclassified as label 2.
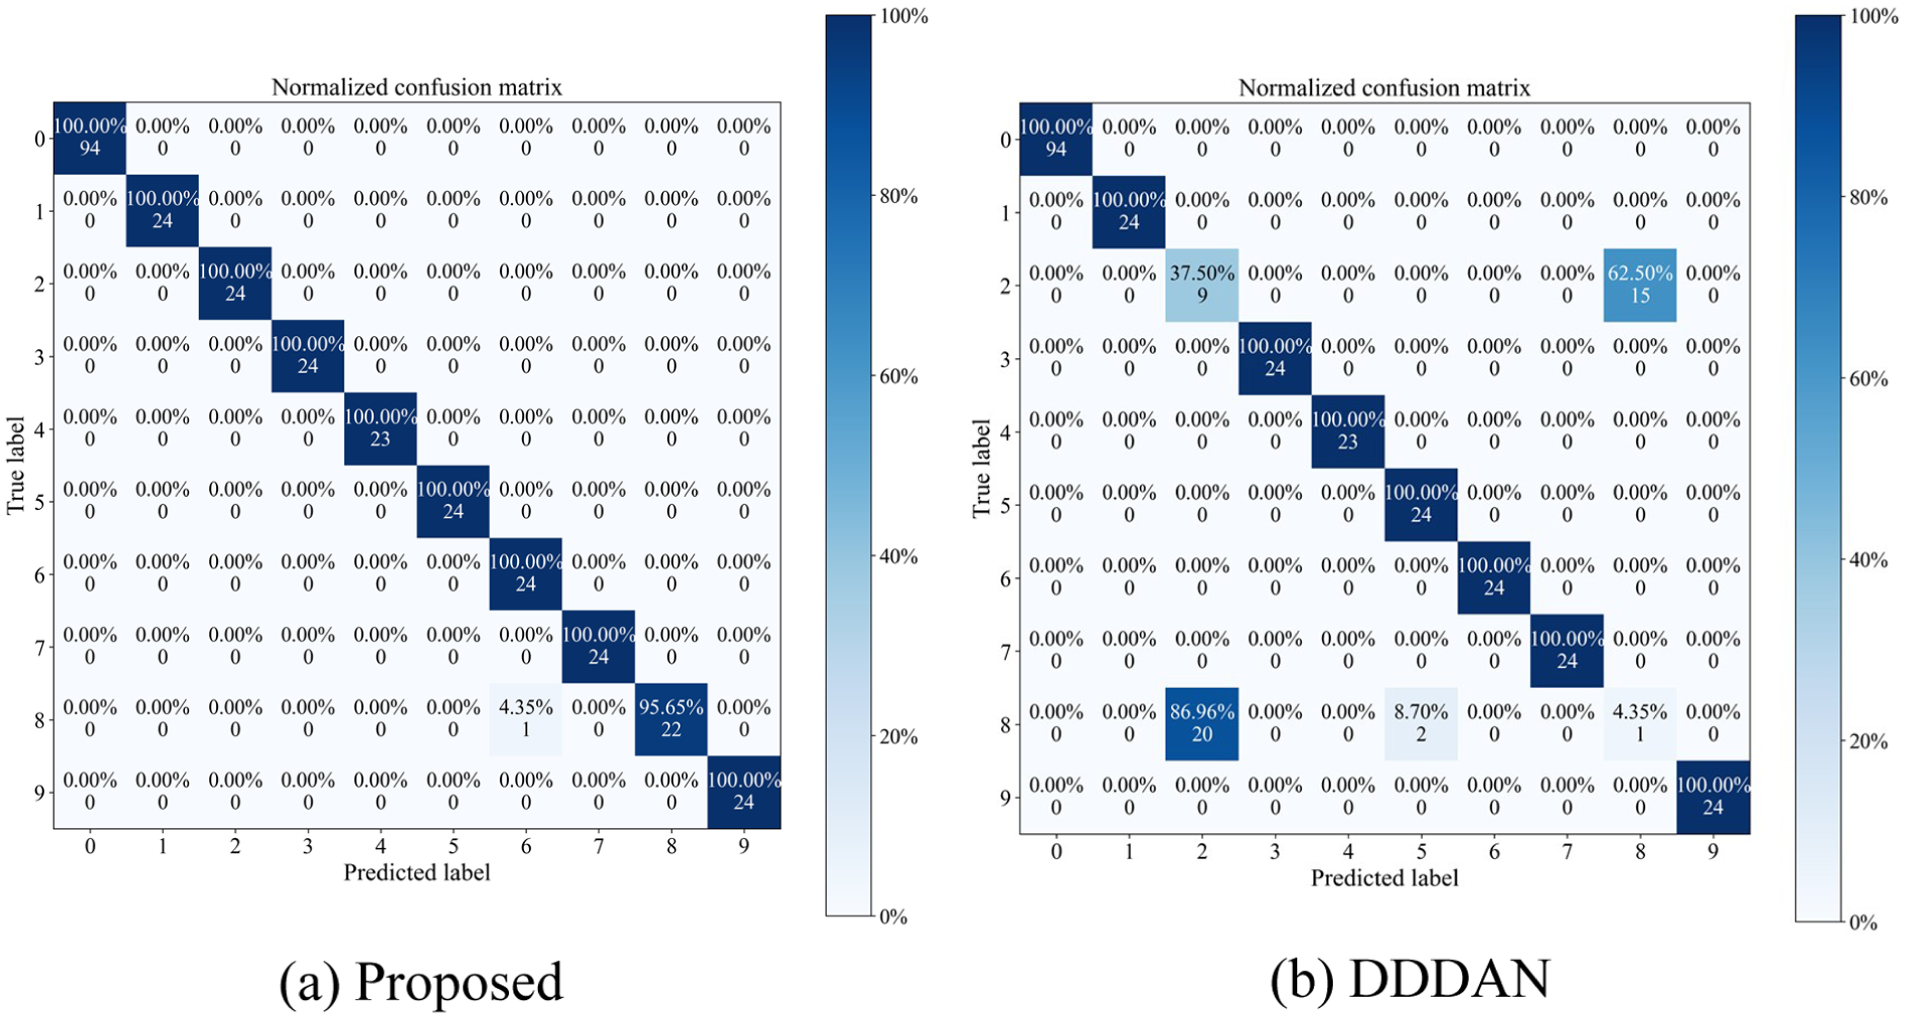
Confusion matrix for the TA5 migration task: (a) proposed and (b) DDDAN.
The proposed method effectively rectifies this issue. Figure 10(a) shows the recognition accuracy for label 2 improving to 100%, while label 8 accuracy reaches 95.65%. This indicates that by mining hard negative samples near the decision boundary, HNM-Softmax enables the model to learn fine-grained features that differentiate fault severities, maintaining robust diagnostic capabilities even under conditions with subtle interclass differences.
Experiments based on the BJTU dataset
To evaluate the model’s generalization ability under significant speed discrepancies, the public dataset from BJTU was employed for testing. Unlike the previous two datasets, the BJTU dataset is characterized by a substantial speed span (ranging from 1200 to 3600 r/min), which imposes greater challenges on feature alignment. Based on three operating conditions (1200, 2400, and 3600 r/min), six cross-domain tasks (TC1–TC6) were constructed, as shown in Table 7. The detailed diagnostic results of each model on the BJTU dataset are presented in Table 8.
Cross-condition transfer tasks on the BJTU dataset.
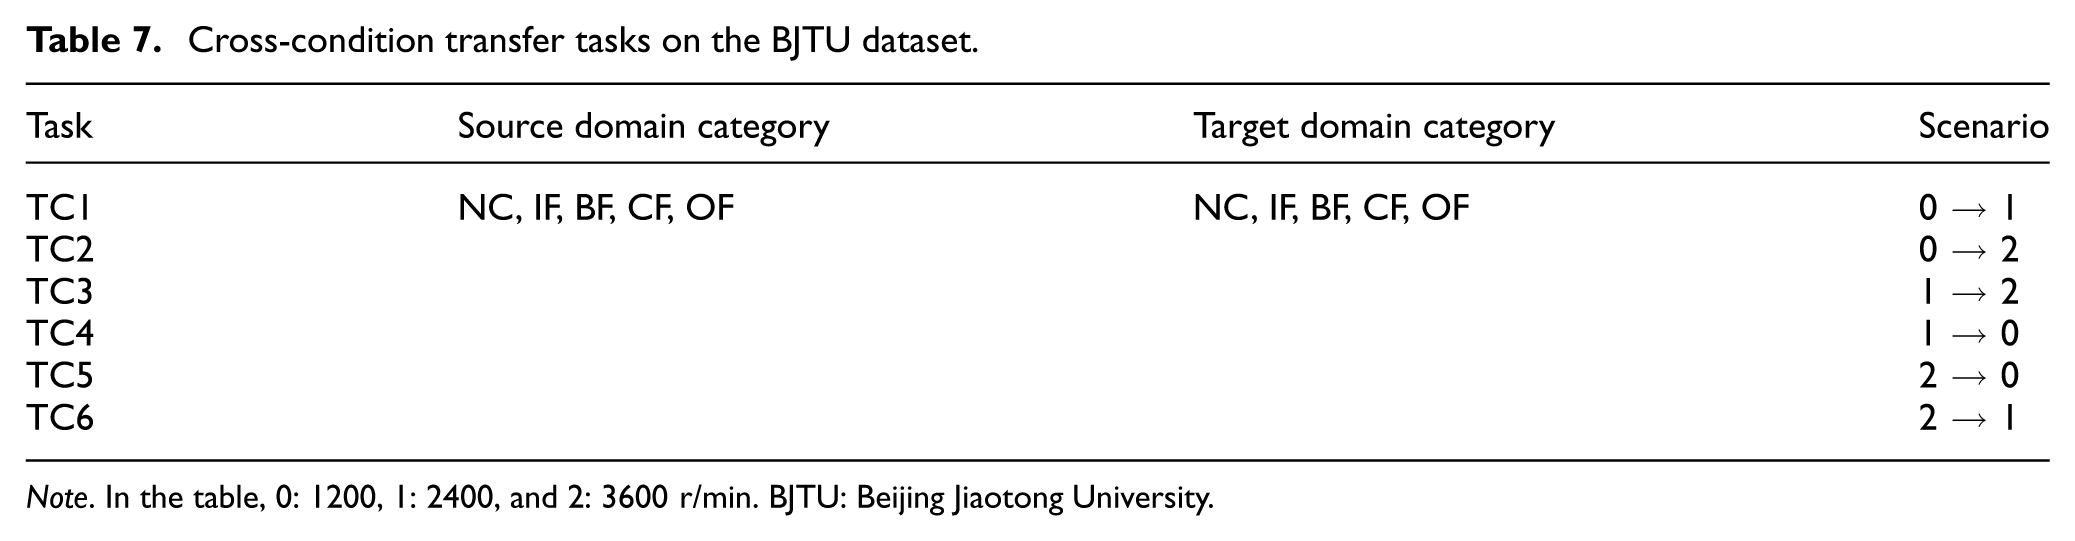
Note. In the table, 0: 1200, 1: 2400, and 2: 3600 r/min. BJTU: Beijing Jiaotong University.
Diagnostic accuracy (%) on the BJTU dataset.
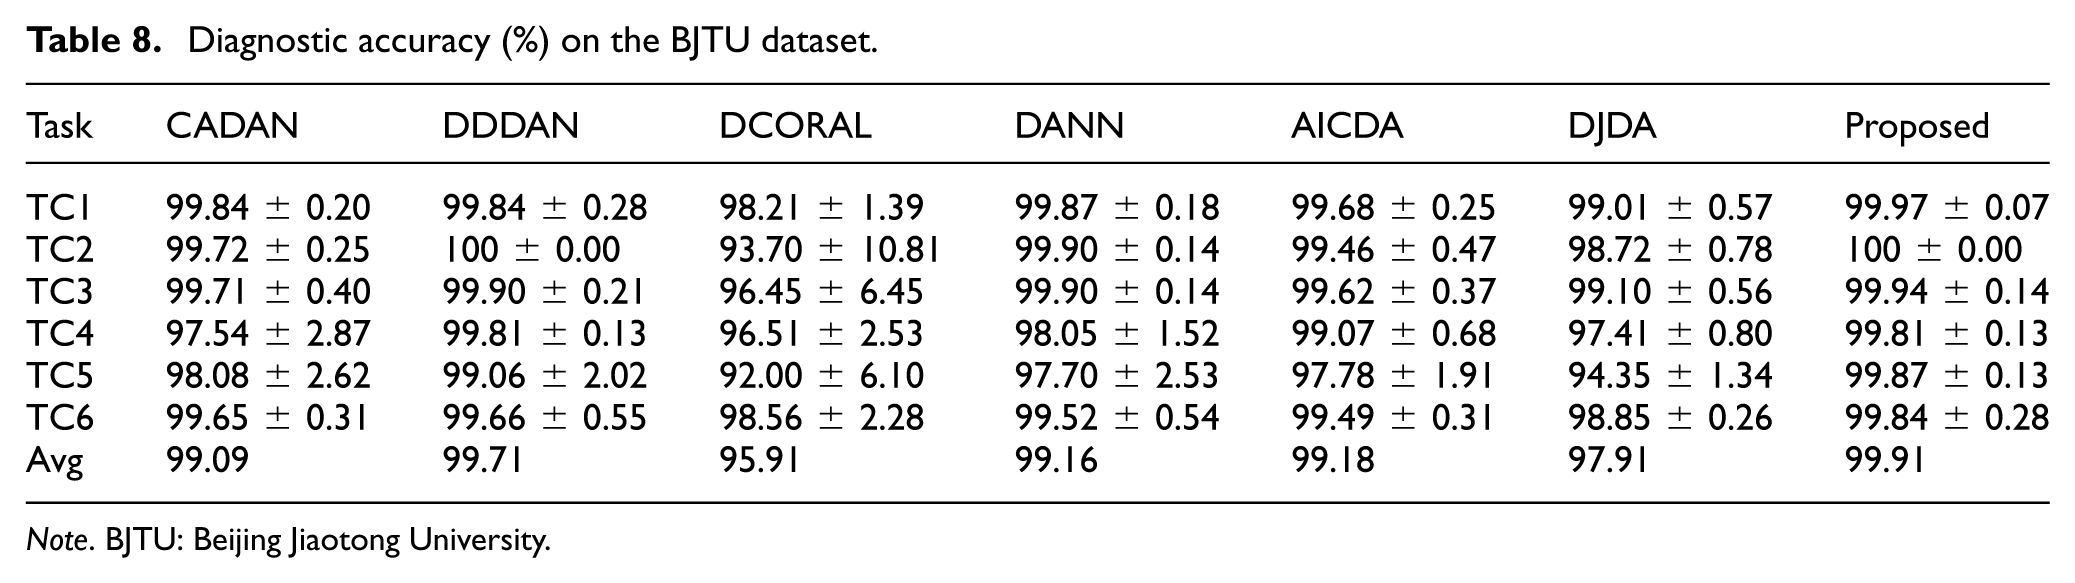
Note. BJTU: Beijing Jiaotong University.
As illustrated in Table 8 and Figure 11, the proposed DW-JDA method achieves the highest average accuracy on this dataset and exhibits low run-to-run variability. Although DDDAN remains a strong competitor, the overall results indicate that the proposed method provides competitive accuracy together with stable diagnostic performance across diverse operating conditions. In contrast, some comparison methods show larger performance fluctuations on more challenging transfer tasks.
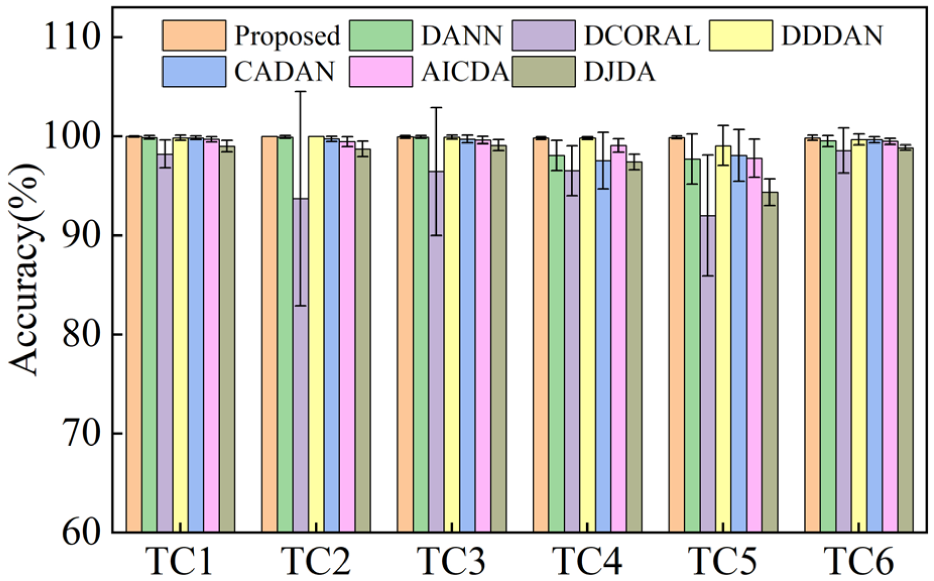
Average accuracy of different methods on the BJTU dataset. BJTU: Beijing Jiaotong University.
To verify the feature learning capability under large-span operating conditions, Figure 12 displays the t-SNE feature visualization results for the TC5 task (3600 → 1200 r/min). As depicted, multiple competitive baseline methods exhibit varying degrees of feature distribution degradation. Both DJDA (Figure 12(g)) and DCORAL (Figure 12(c)) display severe category aliasing, failing to distinctively separate several proximal health states and showing numerous outliers. While DANN (Figure 12(d)) and CADAN (Figure 12(e)) achieve coarse separation, they are characterized by looser clustering with features significantly dispersed. AICDA (Figure 12(f)) shows improvement over these, yet its clusters remain less compact. DDDAN maintains comparable performance to the proposed method.
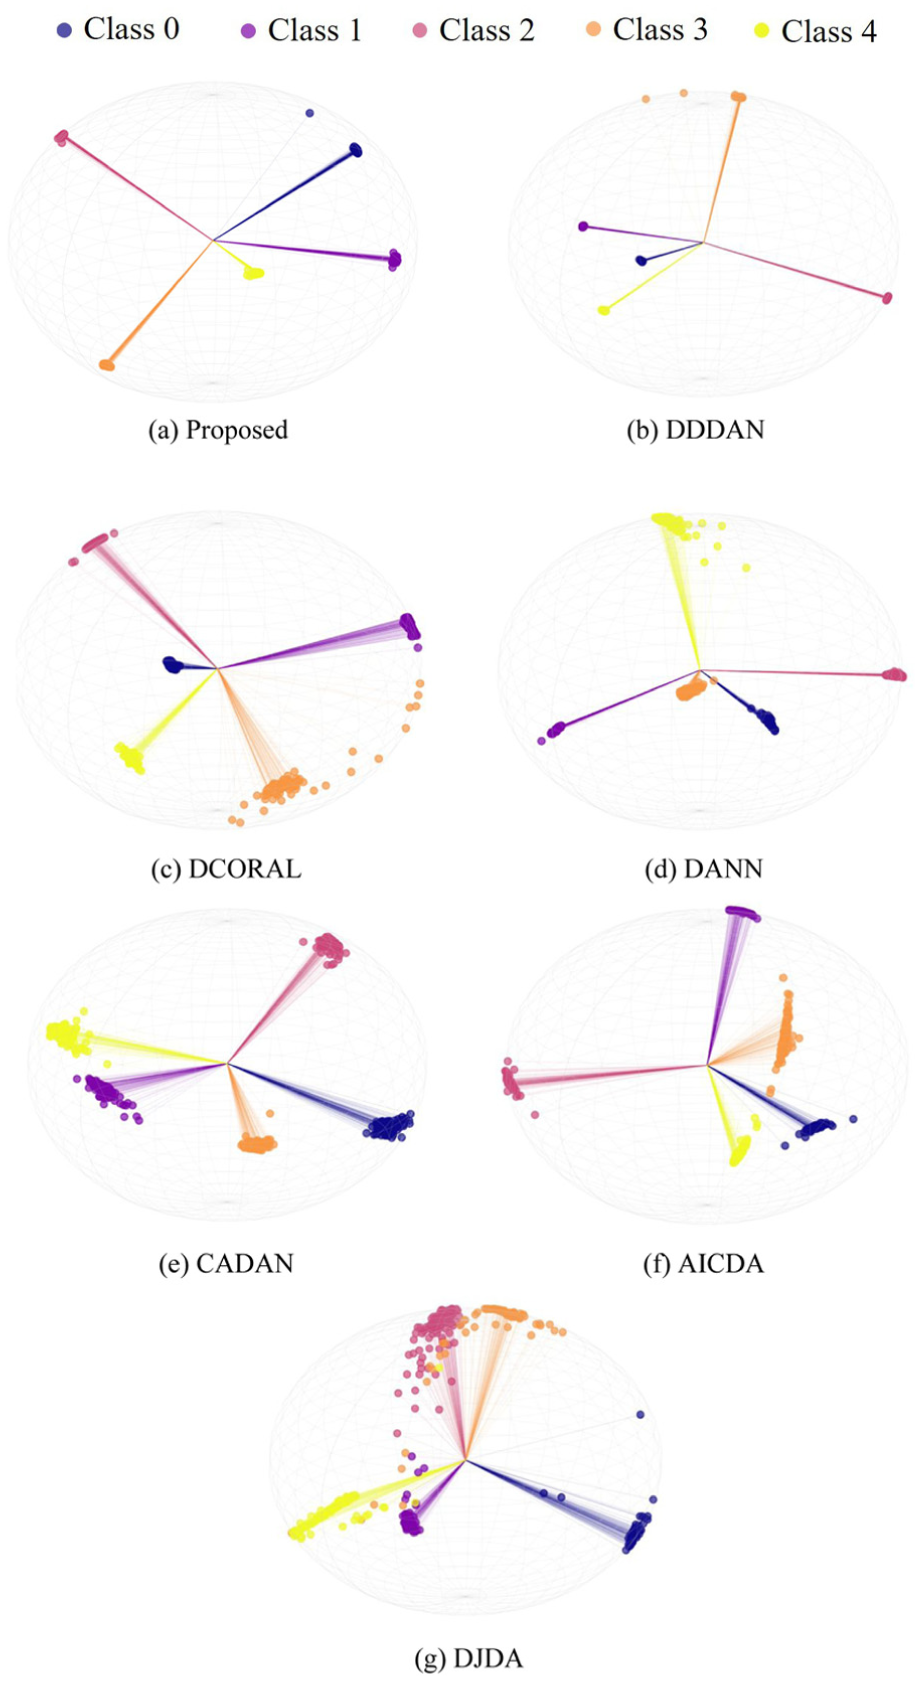
t-SNE feature visualization of the TC5 task: (a) proposed, (b) DDDAN, (c) DCORAL, (d) DANN, (e) CADAN, (f) AICDA, and (g) DJDA. t-SNE: t-distributed stochastic neighbor embedding.
In contrast, the proposed method yields clearer interclass separation and better-organized feature distributions. These observations suggest that the hard-margin constraints introduced by HNM-Softmax may improve inter-class separation, which is consistent with the competitive discriminative performance observed under wide-span operating conditions.
Experiments under noisy conditions
In actual high-speed train operating environments, early fault signals from rolling bearings are weak and easily submerged by strong background noise such as wheel-rail friction, aerodynamic noise, and mechanical resonance. This noise not only degrades the signal-to-noise ratio (SNR) but also blurs the feature distribution boundaries between the source and target domains, thereby exacerbating the negative impact of domain shift. 48 To comprehensively evaluate the anti-interference ability and robustness of the DW-JDA model under extreme working conditions, Gaussian white noise was introduced into the original vibration signals to construct composite signals with varying SNRs. The formula for calculating SNR is defined as follows:
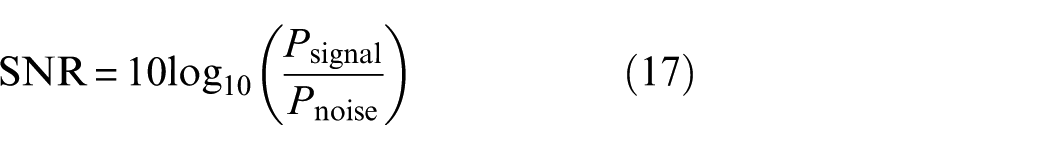
where
When SNR = −2 dB, signal features are severely obscured by noise, serving as an extreme test for the feature extraction capability of fault diagnosis models. The diagnostic results of each model under strong noise conditions are shown in Table 9 and Figure 13.
Diagnostic accuracy (%) of cross-condition transfer tasks at SNR = −2.
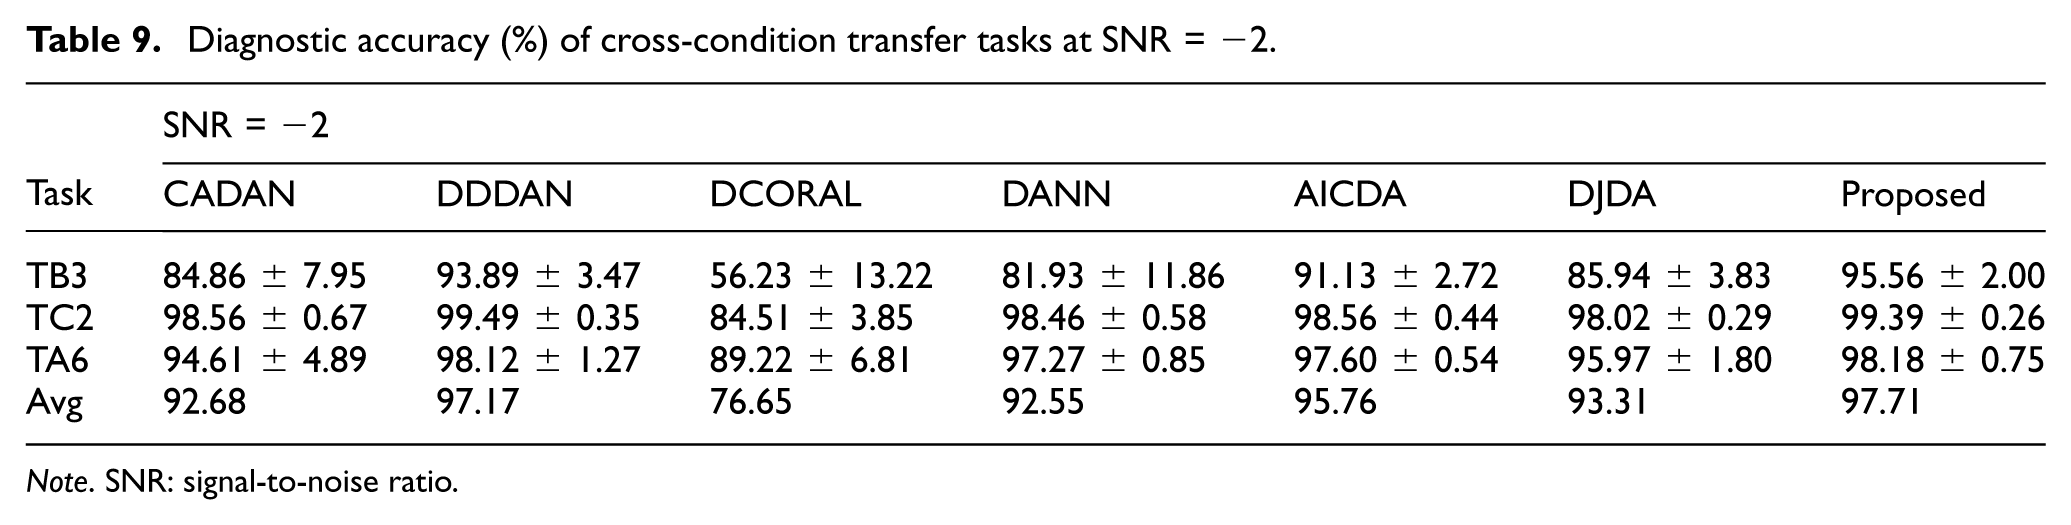
Note. SNR: signal-to-noise ratio.
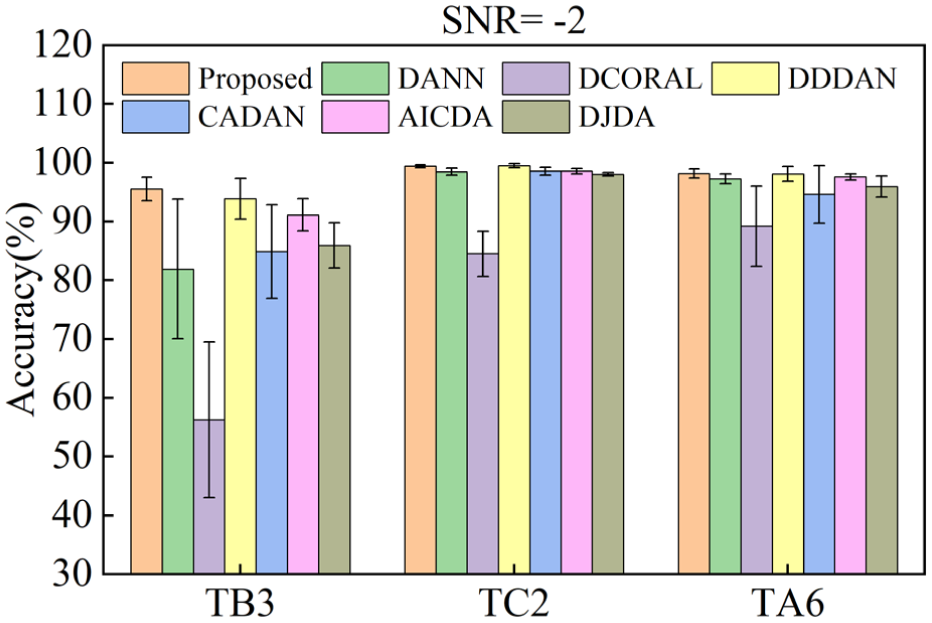
Average accuracy of each method under SNR = −2 conditions.
As illustrated in Table 9 and Figure 13, the proposed DW-JDA network achieves the highest average accuracy under severe noise (SNR = −2), yielding an average accuracy of 97.71%. While baseline methods like DCORAL and CADAN suffer severe performance degradation (averaging 76.65 and 92.68%, respectively), even competitive adaptation networks such as AICDA (95.76%) and DJDA (93.31%) fall short of the proposed model’s overall robustness. This advantage is particularly evident on the challenging CSU dataset (task TB3: 1800 → 2100 r/min). Despite the presence of complex fault modes, DW-JDA attains a 95.56% accuracy with minimal standard deviation (±2.00%), substantially outperforming DDDAN (93.89%), AICDA (91.13%), DJDA (85.94%), and DANN (81.93%). This resilience is primarily driven by the HNM-Softmax mechanism. Severe noise typically causes feature drift that easily breaches standard Softmax decision boundaries; however, HNM-Softmax enforces a strict safety margin against hard negative samples, preserving precise classification boundaries even when feature representations are heavily blurred.
When the noise intensity decreases to SNR = 2 dB, the performance of all models recovers, with detailed results shown in Table 10 and Figure 14. The average accuracy of DW-JDA rises to 99.01%, maintaining highly competitive performance. Notably, in the TC2 task (1200 → 3600 r/min) on the BJTU dataset, DW-JDA achieves a classification accuracy of 99.90%.
Diagnostic accuracy (%) of cross-condition transfer tasks at SNR = 2.
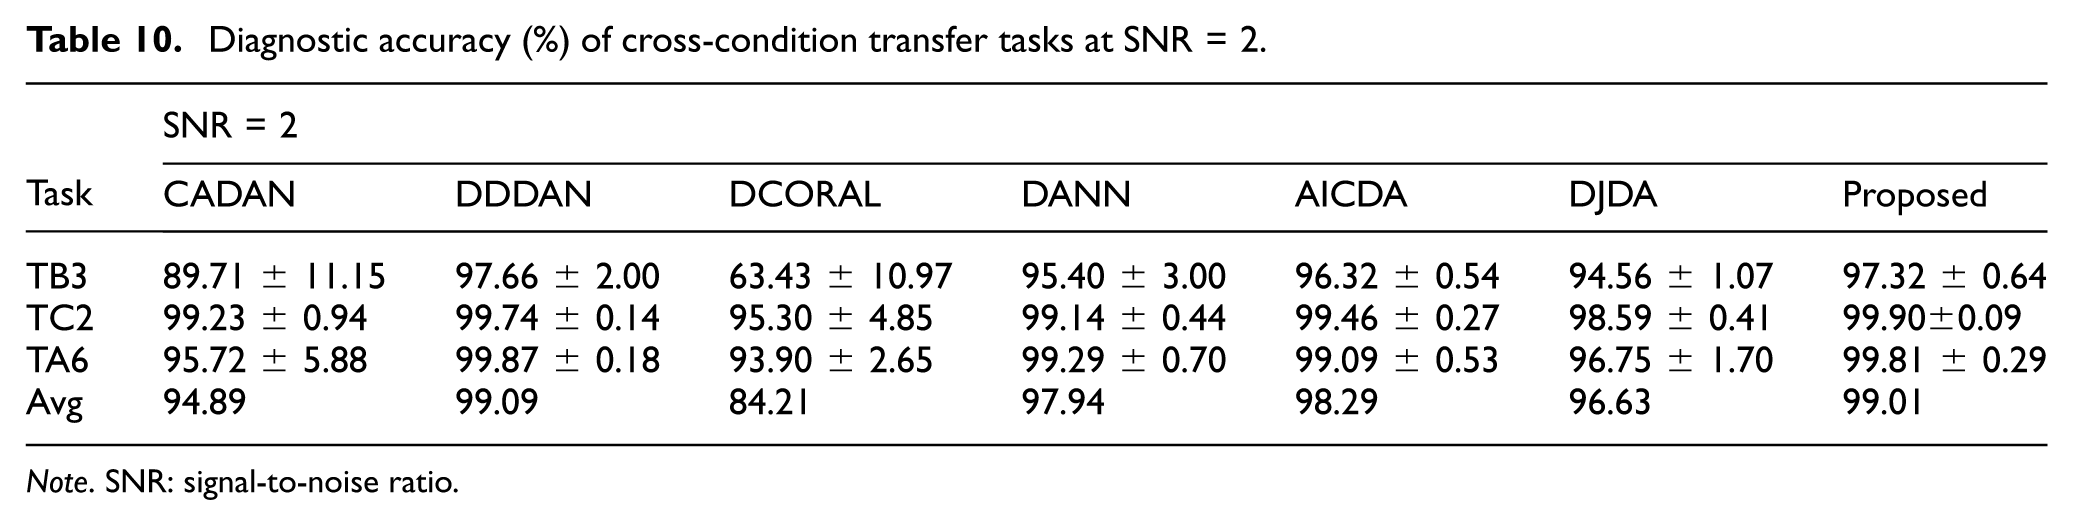
Note. SNR: signal-to-noise ratio.
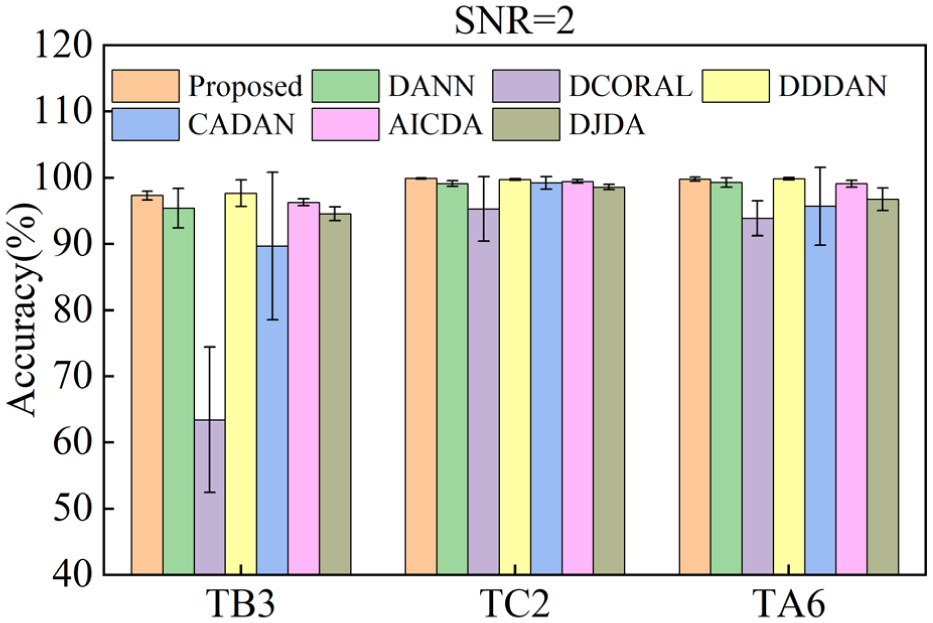
Average accuracy of each method under SNR = 2 conditions.
Comparing the results between SNR = −2 dB and SNR = 2 dB reveals that DW-JDA exhibits minimal performance fluctuation (a difference of only 1.3%), demonstrating strong stability. In contrast, the average accuracy of DCORAL fluctuates by as much as 7.56%. This stability may be partly attributed to the EW-DJDA module. The introduction of noise increases the uncertainty of predictions in the target domain. Through its dynamic weighting mechanism, EW-DJDA can automatically reduce the weight of conditional distribution alignment when entropy values are high. This behavior may help alleviate negative transfer caused by noise interference, thereby supporting effective feature alignment across different signal-to-noise ratios.
To intuitively evaluate the feature learning capability of the proposed method in cross-domain tasks, t-SNE is employed to visualize the high-dimensional features of task TB3 on the CSU dataset under the condition of SNR = −2 dB. Figure 15 shows the feature clustering results of the proposed method and the comparison methods under this noisy condition.
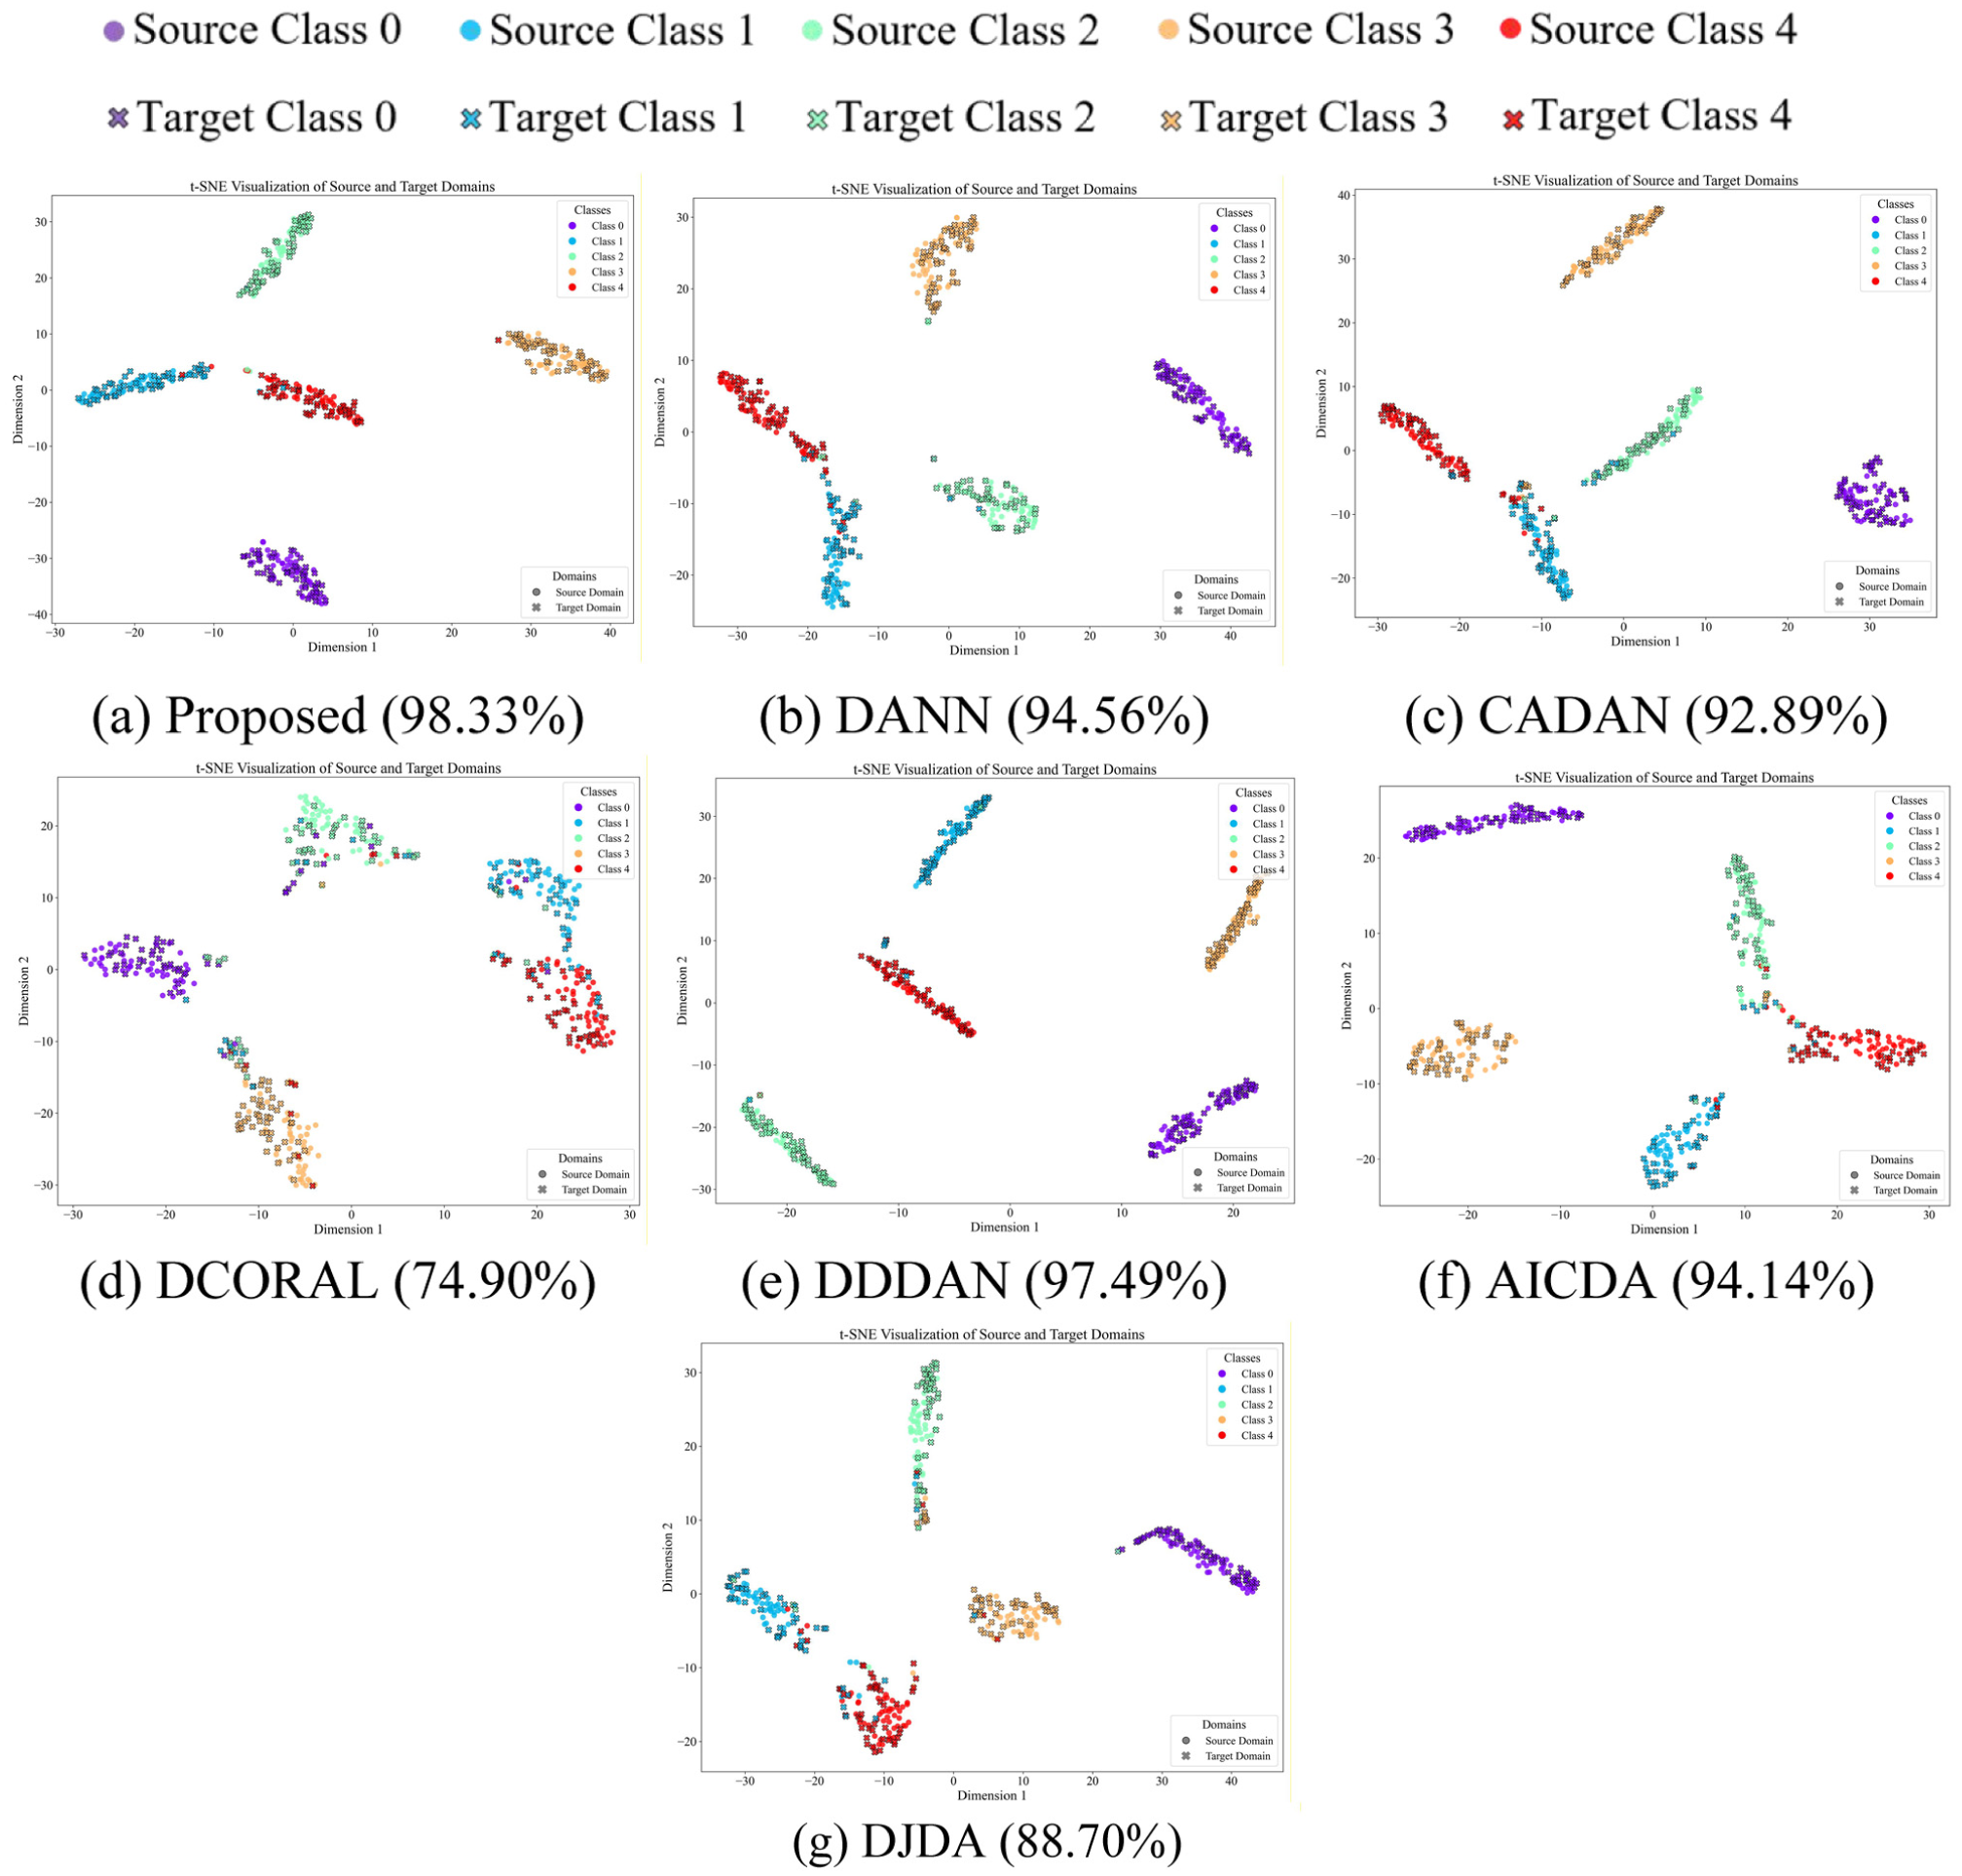
t-SNE visualization in task TB3 on the CSU dataset when SNR = −2: (a) proposed (98.33%), (b) DANN (94.56%), (c) CADAN (92.89%), (d) DCORAL (74.90%), (e) DDDAN (97.49%), (f) AICDA (94.14%), and (g) DJDA (88.70%). t-SNE: t-distributed stochastic neighbor embedding; CSU: Central South University; SNR: signal-to-noise ratio.
As shown in Figure 15(a), the proposed method exhibits relatively clear decision boundaries in the target domain for task TB3 under a severe −2 dB SNR condition. The visualization suggests that the proposed approach enlarges the interclass gaps and improves overall feature separability. In the mixed visualizations, circles represent the source domain and crosses represent the target domain; better adaptation is reflected by closer categorywise overlap between the two domains.
Compared with the baseline methods, the proposed method shows clearer inter-class separation and better cross-domain feature congruence. DCORAL suffers from severe feature overlap under harsh noise, while DJDA also exhibits noticeable domain shifts between source and target samples of the same category. CADAN and AICDA achieve moderate alignment, but visible discrepancies remain near the decision boundaries. DANN further improves cross-domain alignment, whereas DDDAN and the proposed method show comparatively better category-wise overlap. Overall, the visualizations suggest that the proposed method achieves more organized feature distributions and stronger robustness under extreme noise interference, which is consistent with its competitive diagnostic performance.
Ablation experiment
To rigorously isolate the specific contributions of key components and evaluate their synergistic effects on cross-domain diagnosis, an ablation study was conducted. The framework was deconstructed into modules to create three distinct variants, as outlined in Table 11.
Comparison of ablation experiment settings.
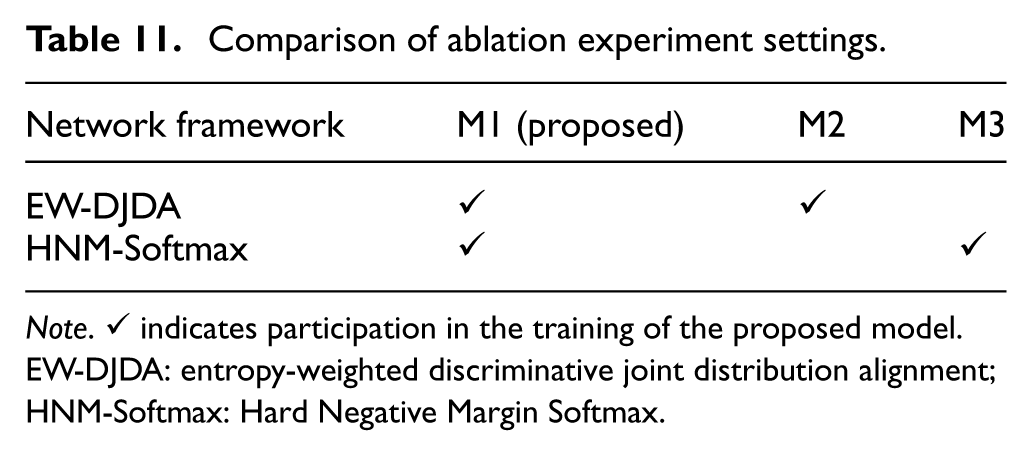
Note. ✓ indicates participation in the training of the proposed model. EW-DJDA: entropy-weighted discriminative joint distribution alignment; HNM-Softmax: Hard Negative Margin Softmax.
M1 (proposed): The full model, incorporating both EW-DJDA and HNM-Softmax. M2: Preserves the EW-DJDA module but substitutes the classification loss with standard Cross-Entropy Loss. This setup is designed to assess the efficacy of HNM-Softmax in mining hard-to-classify samples and refining decision boundaries. M3: Retains the HNM-Softmax loss while excluding the domain adaptation alignment strategy. This setup serves to validate the capability of EW-DJDA in bridging distribution shifts and mitigating negative transfer.
To ensure a fair comparison and strictly isolate the performance gains from the adaptation mechanisms, all ablation variants (M1, M2, and M3) are implemented using the identical hybrid backbone architecture (comprising MPAConv blocks and the improved vision transformer, as detailed in “DSConv-based hybrid network for feature extraction” section and Table 2). By keeping the backbone architecture identical across M1, M2, and M3, any performance differences can be attributed to the presence or absence of EW-DJDA and to the use of HNM-Softmax versus the standard cross-entropy loss, rather than to architectural changes.
To verify the robustness of the model under extreme working conditions, experiments were conducted in a strong noise environment (SNR = −2 dB). Transfer tasks were selected from the three datasets: CSU (TB3), BJTU (TC2), and CWRU (TA6). Each task was repeated independently five times to obtain the average value, and the results are shown in Table 12 and Figure 16.
Diagnostic accuracy (%) on each task when SNR = −2.
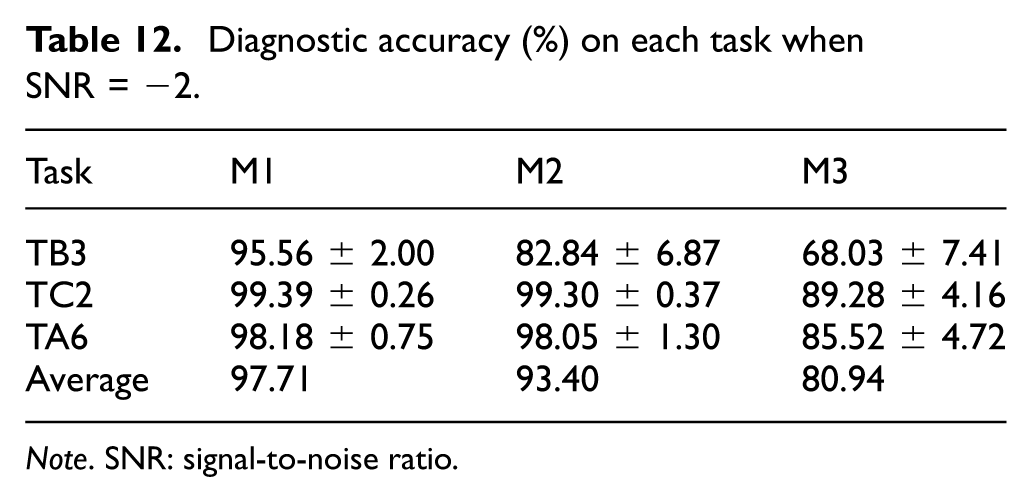
Note. SNR: signal-to-noise ratio.
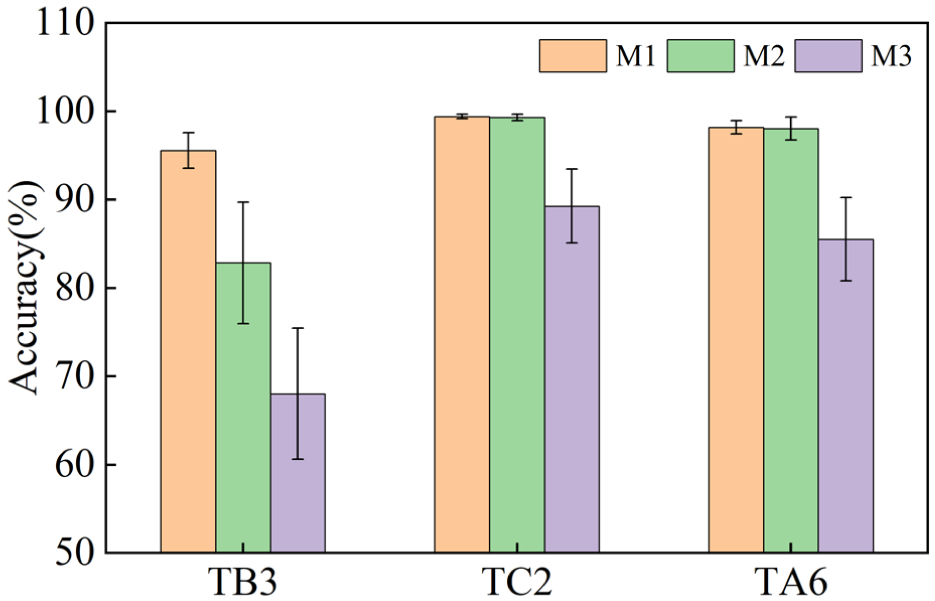
Ablation experiment accuracy.
Experimental results demonstrate that HNM-Softmax enhances the model’s discriminative ability, particularly for easily confused classes. In the CSU TB3 task, which contains highly similar fault features (such as pitting and cracks), M1 achieved a 12.72% improvement over M2. This proves that HNM-Softmax effectively decouples blurred boundaries by enforcing larger inter-class margins.
To visually corroborate this effect, Figure 17 illustrates the feature distributions of M2 and M1 for the TB3 task. As shown in Figure 17(a), without the hard negative margin constraint (M2), the features of highly similar fault classes remain loosely distributed and are prone to blurring near the decision boundaries. Conversely, Figure 17(b) demonstrates that the complete model (M1) exhibits clear and distinct feature clusters by explicitly maximizing the angular margin between confusable classes, thereby providing direct geometric proof for the efficacy of HNM-Softmax in enhancing interclass separability.
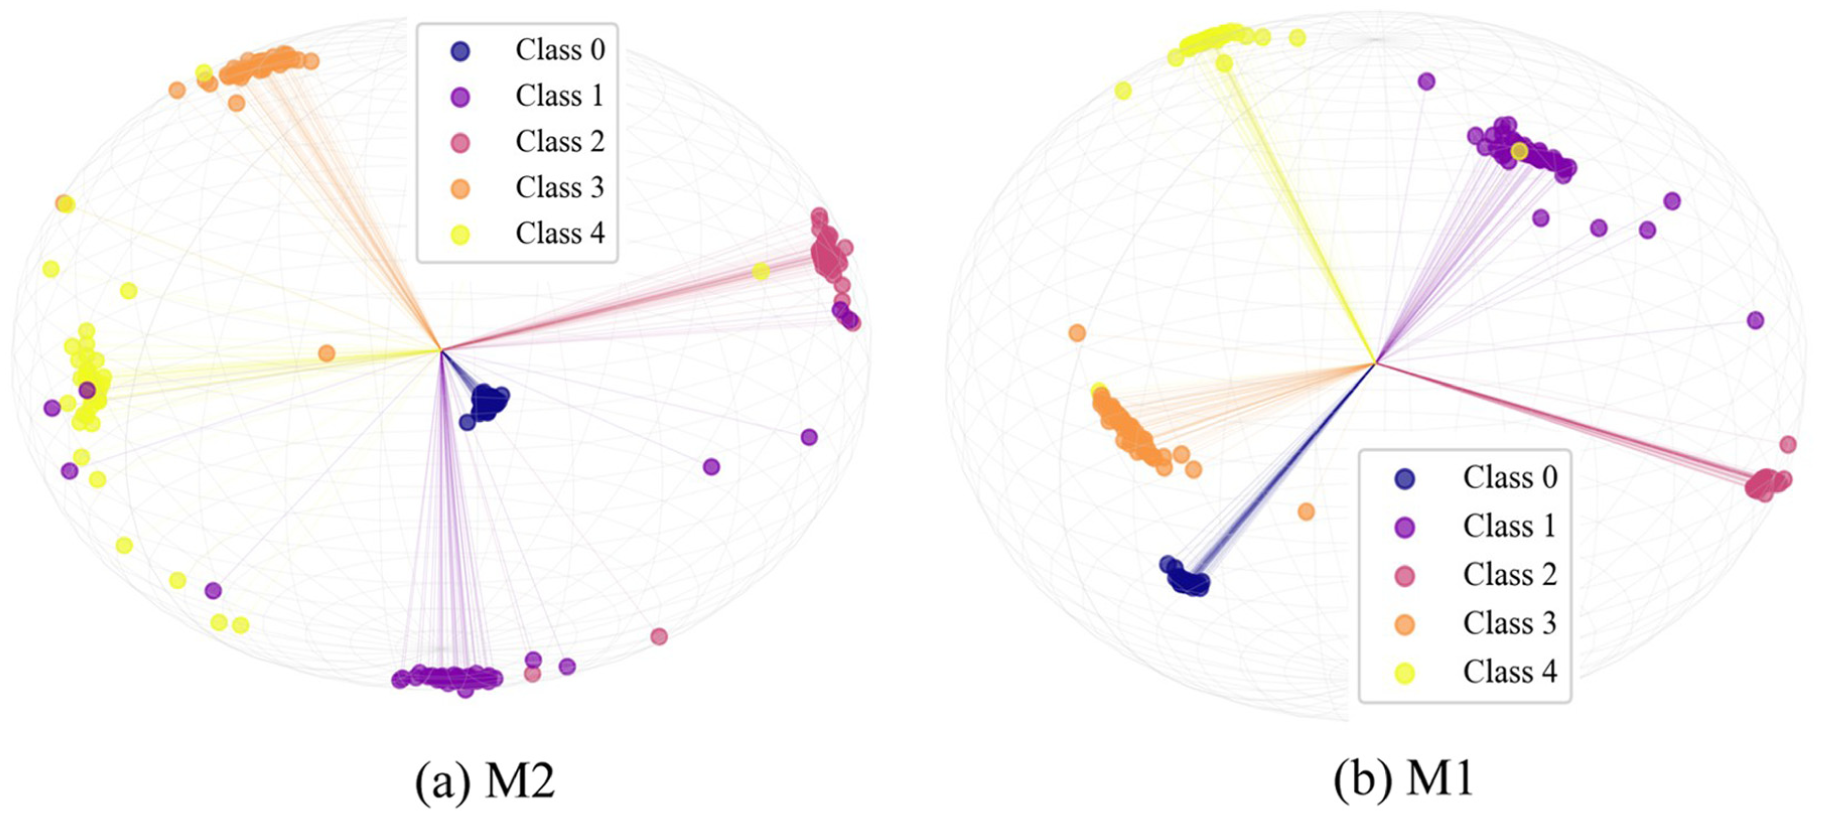
Feature space visualization of the ablation models for the TB3 task (SNR = −2 dB): (a) M2: without HNM-Softmax and (b) M1: proposed model. SNR: signal-to-noise ratio; HNM-Softmax: Hard Negative Margin Softmax.
In contrast, for the BJTU task (TC2) characterized by distinct feature differences, the model maintains comparable high performance. However, for the CWRU task (TA6), which exhibits a certain degree of feature similarity, removing HNM-Softmax results in a slight performance decline. This indicates that while standard Softmax suffices for tasks with highly clear feature separations (like BJTU), HNM-Softmax still provides necessary refinements when moderate feature confusion exists (like CWRU), and becomes critical for highly complex tasks (like CSU). Crucially, this validates that HNM-Softmax effectively targets hard samples to optimize decision boundaries without degrading performance on easier samples.
Furthermore, removing the EW-DJDA alignment module (M3) resulted in the model’s inability to overcome feature distribution shifts caused by speed variations, leading to an average accuracy decline of approximately 16.77%. EW-DJDA addresses feature domain invariance by dynamically aligning source and target domain distributions, while HNM-Softmax further resolves the discriminability of confusing categories. The two modules operate synergistically through feature alignment and boundary constraints, ensuring the model’s robustness under strong noise and complex variable conditions.
Sensitivity analysis
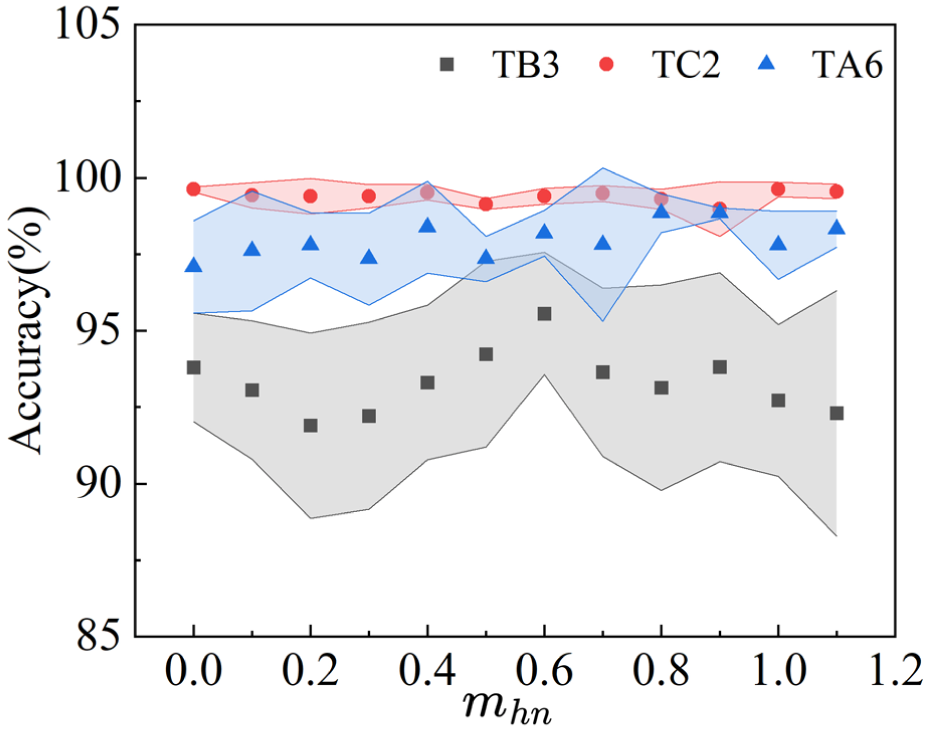
The parameter
Parameter sensitivity analysis.
From the figure, it can be observed that the value of
Regarding the other tasks, the model exhibits strong overall robustness, though with nuanced differences reflecting their inherent complexity. For the TC2 task (red circle curve), where fault feature differences are highly distinct, the accuracy remains remarkably stable at nearly 100% across the entire variation range of
In summary, when
Conclusion
This article proposes a novel UDA network, designed to address the challenges of significant feature distribution shifts and hard-negative misclassification in rolling bearing fault diagnosis under cross-working conditions. By integrating time–frequency analysis, uncertainty-aware alignment, and margin-based classification, the proposed framework establishes an end-to-end solution. The main findings and contributions of this study are summarized as follows:
By leveraging CWT and DSConv, the model effectively captures multiscale time–frequency characteristics from nonstationary vibration signals while reducing computational complexity.
The novel EW-DJDA mechanism effectively mitigates negative transfer by dynamically balancing the weights of marginal and conditional distribution alignments based on prediction uncertainty in the target domain.
The proposed HNM-Softmax loss function explicitly enforces a safety margin between target classes and competitive hard negatives. This targeted suppression strategy ensures high discriminability for fine-grained and similar fault modes.
Extensive experiments on the CSU, CWRU, and BJTU datasets demonstrate that DW-JDA achieves average accuracies of 99.55, 99.92, and 99.91%, respectively. Notably, it maintains a high accuracy of 97.71% under extreme noise conditions (SNR = −2), showing competitive or best average performance among the compared methods.
Visual analysis suggests that, even under large-span rotational-speed differences, the model can achieve clearer feature separation and reduced cross-domain distribution offsets, indicating good generalization ability.
Although the proposed method demonstrates competitive and stable performance on the experimental datasets, it is acknowledged that real industrial environments involve more complex multisource coupled faults and interference. Therefore, future research will focus on transitioning the DW-JDA framework from laboratory rigs to actual high-speed train operating conditions to validate its generalization. This includes exploring open-domain adaptation to address emerging and unknown fault types under drastically variable field conditions. Furthermore, it will focus on exploring cross-machine transfer diagnostics to overcome structural differences between different experimental platforms and actual train bogies, and integrating few-shot learning strategies to maintain high diagnostic accuracy even with extremely scarce target domain field samples.
Supplemental Material
sj-docx-1-shm-10.1177_14759217261452585 – Supplemental material for DW-JDA: An unsupervised cross-domain dynamic weighted joint distribution adaptation network for high-speed train bearing fault diagnosis
Supplemental material, sj-docx-1-shm-10.1177_14759217261452585 for DW-JDA: An unsupervised cross-domain dynamic weighted joint distribution adaptation network for high-speed train bearing fault diagnosis by Penghui Xie, Suchao Xie and Xin Guo in Structural Health Monitoring
Footnotes
Funding
The authors disclosed receipt of the following financial support for the research, authorship, and/or publication of this article: This research was undertaken at Key Laboratory of Traffic Safety on Track (Central South University), Ministry of Education, China. The authors gratefully acknowledge the support from the National Key R&D Program of China (grant no. 2024YFB4303000). This paper was also supported by the science and technology innovation Program of Hunan Province (grant no. 2024RC1019), the Key Project of Scientific Research Project of Hunan Provincial Department of Education (grant no. 23A0017) and the Natural Science Foundation of Hunan Province (grant no. 2023JJ31015).
Declaration of conflicting interests
The authors declared no potential conflicts of interest with respect to the research, authorship, and/or publication of this article.
Supplemental material
Supplemental material for this article is available online.
References
Supplementary Material
Please find the following supplemental material available below.
For Open Access articles published under a Creative Commons License, all supplemental material carries the same license as the article it is associated with.
For non-Open Access articles published, all supplemental material carries a non-exclusive license, and permission requests for re-use of supplemental material or any part of supplemental material shall be sent directly to the copyright owner as specified in the copyright notice associated with the article.