
Abstract
Reliable structural health monitoring (SHM) of fiber-reinforced polymer (FRP)-strengthened bridges is crucial for enabling timely maintenance interventions and extending the service life. Although existing studies primarily focus on SHM techniques using vibration sensing, a significant gap remains in correlating and integrating measurements from multiple sensing methods. Therefore, a comprehensive multi-sensor framework is necessary to enhance data reliability and structural health assessment. For the first time, a novel multi-sensor framework has been introduced for assessing FRP-strengthened half-century-old reinforced concrete bridge located in Alibaug, Raigad, India. The study involves instrumenting a span of the bridge with the lead zirconate titanate sensor for electromechanical impedance (EMI) sensing along with other conventional sensors such as accelerometer, Linear Variable Differential Transformer (LVDT), strain gauges, crack gauges, and tilt meters, targeting critical structural elements. Impedance signatures have been acquired along with other global structural responses using nearby sensors for various loading conditions. The obtained signatures are further processed using different statistical and wavelet-based variational indicators, for quantification of load severity. Subsequently, it is observed that the application of incremental loading on the structure is manifested as the variation in conductance peaks, along with an increase in the signal amplitude of the conventional sensors. Furthermore, a correlation analysis is performed between EMI-based variational indices and the conventional sensor magnitude. This correlation selection is constrained by appropriate assumptions regarding monotonicity and the improvement in accuracy of nonlinear over linear correlation. Results shows that the load induced variations for different sensing techniques is majorly following linear correlation with each other. The proposed multi-sensor fusion framework aims at setting up a mathematical correlation between different sensor measurement variation under incremental loading. The outcomes of this study highlight the capability of a multi-sensor framework to form a reliable assessment protocol for monitoring FRP-retrofitted bridges, enabling effective predictive maintenance.
Keywords
Introduction
Bridge structures are the backbone of transportation networks, enabling national and regional economic growth. Over time, the combined effect of aging and heavy vehicular traffic loads progressively affects the structural durability and serviceability, compromising public safety. Fiber-reinforced polymer (FRP) is an attractive solution for strengthening and retrofitting such bridges.1–5 Despite the multiple advantages of FRP, long-term evaluations of its performance under different heavy vehicle loads are needed for predictive maintenance.6,7 Traditional inspections of such FRP-strengthened bridges focus on visual inspection, which provides limited information regarding the realistic progression of structural degradations and is insensitive to the incipient level of damage.8–11 Structural health monitoring (SHM) is practical approach to assess the continuous evaluation of bridge components and provide insights on predictive maintenance strategies.12–16 Several published studies have dealt with strain gauges, displacement transducers, accelerometers, and inclinometers to measure the deformations at critical locations.17–19 Although these conventional SHM methods are valuable for assessing the overall condition of a structure, their limited sensitivity to early-stage changes in system response prevents them from fully capturing the progression of loading conditions in realistic scenarios.
In recent years, smart sensors, such as lead zirconate titanate (PZT) transducers based on electromechanical impedance (EMI) techniques, have attracted considerable interest in detecting the progression of damage due to stiffness degradation at an early stage.20–27 In this technique, a PZT patch bonded to the structure is excited using a sinusoidal voltage over a frequency sweep to measure the electrical response, which is suitable for sensitive detection of micro-level changes.28–31 Liang et al. first proposed PZT wafer based on EMI techniques to measure electrical impedance associated with mechanical impedance of coupled structure. 32 Later, several studies provide a comprehensive overview of the proposed technique and its applications in various structures.33–36 The EMI-based techniques have been used in various domains to detect damages in critical structural components.37–40 Numerous studies have reported the applications of EMI approach in detecting the crack in reinforced concrete (RC) beam elements through variations of frequency shifts. 41 The quantification of damages can be calculated using various statistical indices to understand the damage severity in RC beams. 42 Different studies have also evaluated and characterized the damages through EMI wavelet-based damage indices. EMI studies have also been conducted to monitor fatigue loading in RC beams through piezo equivalent stiffness and damping parameters. 43 Recent studies have shown that the EMI technique, combined with Digital Image Correlation (DIC), is capable of identifying crack initiation and growth in FRP-strengthened RC structures by monitoring changes in impedance. 44 The performance of Carbon Fiber Reinforced Polymer (CFRP) strengthened components has been evaluated by integrating EMI with statistical and clustering methods to enhance the accuracy of monitoring retrofitted RC beam column joints. 45 Debonding of the FRP-strengthened RC beam is identified using variations of EMI spectra and the Particle swarm optimization (PSO) adaptive spectral model. 46 Literature has also demonstrated the effectiveness of the EMI approach in capturing bonding failures in retrofitted RC elements under various loading conditions, as indicated by changes in amplitude and root mean square deviation (RMSD) indices. 47
Recently, the wireless admittance monitoring system (WiAMS) has been used for real-time monitoring of damage in fiber-reinforced concrete (FRC) prisms under repeated loading. The findings demonstrate that optimized sensor placement and statistical damage indices with threshold-based filtering significantly improve the sensitivity of monitoring FRC, underscoring the importance of advanced wireless SHM systems. 48 The WiAMS-based monitoring system has also been used to detect and localize early-stage damage in seismically vulnerable RC frames subjected to cyclic loading. It has been found that proposed distributed piezoelectric sensing enables reliable identification of different failure modes and is used for early warning and performance assessment in existing structural systems. 49 Additionally, extensive research has been conducted using WiAMS, distributed with embedded and epoxy-bonded PZT transducers, to monitor the damage evolution in RC elements under monotonic and cyclic loading conditions at different load levels. The results demonstrate that variations in voltage signatures and an increase in RMSD indices provide a reliable assessment of damage at different load levels. 50 However, these methods are limited in their field application due to a limited frequency range and constraints on the data sampling rate. They also require a skilled data acquisition process including periodic calibration and an external power source.
In an earlier investigations by Rousakis et al.,51,52 different sensors have been utilized for assessment of different retrofitting in RC structures. Their investigations are limited to quantification of structural changes using variation in vibration response and EMI-based indices. These studies focused on the individual sensor signal variation rather than formulating an integrated correlation framework incorporating multiple sensing modalities for in-service conditions. There is a requirement of an unified framework that correlates heterogeneous sensor data to provide a more comprehensive evaluation of structural condition following retrofitting interventions
Multi-sensor data fusion has become central to SHM as it enables improved reliability and sensitivity by combining heterogeneous sensing information. Wu and Jahanshahi 53 systematically reviewed signal, feature, and decision-level fusion strategies, noting that most existing approaches rely on feature concatenation, weighted averaging, and data-driven learning models. These methods improve prediction accuracy; however, they often treat sensor outputs as interchangeable features, with limited consideration of the underlying physical mechanisms governing each sensing modality. Recent advances have largely focused on learning-based fusion to address nonlinear and noisy monitoring environments. Xu et al. 54 demonstrated that multimodal deep learning architectures can significantly enhance damage classification accuracy by jointly learning spatial and temporal features from multiple sensors. Similarly, Gao et al. 55 integrated vision-based and acceleration measurements obtained from a shake table test of scaled down three-story frame shear wall structure. This investigation improved robustness in displacement estimation through state-space filtering using a hybrid fusion framework. However, these approaches primarily emphasize predictive performance and noise robustness, with limited emphasis on preserving physical interpretability or enforcing mechanically admissible relationships between different sensor modalities. Subsequently, statistical fusion techniques have also been proposed to improve sensitivity to subtle damage. Wang et al. 56 investigated damage detection in a simply supported and continuous bridge structure using multi-sensor layout and deep convolutional autoencoders. This study improves damage detection accuracy under varying vehicle speed and noise conditions. Lu and Wu 57 employed Vine-Copula models to capture multivariate dependencies among sensor residuals, enabling improved detection of localized damage in large-scale structures. Nevertheless, such frameworks focus on joint anomaly detection rather than explicitly establishing physically consistent sensor-to-sensor correlations.
Existing multi-sensor fusion methodologies lack correlation-based integration strategies that explicitly preserve the physical meaning of heterogeneous sensor outputs. Conventional fusion approaches rarely enforce monotonicity during sensor integration, which may lead to spurious correlations and reduced physical interpretability. This critical gap motivates the development of multi-sensing frameworks that integrate EMI-based damage indices, with conventional structural responses like strain, displacement, and tilt sensors through physically constrained and mechanically meaningful correlations.
Monitoring actual FRP-strengthened/retrofitted bridge structure subjected to realistic loading conditions provides a unique practical challenges. Although there are well-established strain and displacement sensors monitoring studies available for global assessment, 58 they alone cannot capture local level damages in various FRP-retrofitted bridge components. Furthermore, to ensure more reliable data, validation through multiple sensor types is necessary, as this cross-checking helps mitigate the impact of individual sensor faults. Extensive laboratory studies have been conducted using EMI techniques to detect the debonding of FRP laminates and concrete beams. Nevertheless, very scarce literature is available to monitor the loading effect in FRP strengthened bridges implementing multi-sensor approach fusing conventional SHM and EMI data. The present study first attempts to develop multimodal sensing in realistic loading conditions of an FRP-retrofitted bridge. At first, global measurements have been measured for different loading conditions along with EMI responses. Furthermore, statistical and wavelet-based variational parameters have been extracted from EMI spectra to characterize the variation in different load levels. Ultimately, a correlation between EMI-based features and global measurement response has been adapted to characterize incremental loading cases. The novel contributions and major objectives of the present study are as follows:
Post-strengthening assessment of half-century-old RC bridge under various loading conditions.
Development of a novel multi-sensor correlation framework involving EMI indices and amplitude of nearby sensor response for holistic assessment of FRP-retrofitted bridge.
Characterization of EMI spectra based on statistical and wavelet-based features for variational assessment of incremental loading scenarios.
Deployment of holistic monitoring solution for predictive maintenance and safety of FRP-retrofitted bridges.
Research significance
Worldwide many bridges continue to age while experiencing rising traffic volumes, increased vehicular loads, and continuous material deterioration. Therefore, the need for robust, cost-effective, and real-time SHM systems has become increasingly important. The combined use of EMI and conventional sensors provide a more comprehensive understanding by capturing the structural changes that occur due to static loading before visible signs of structural distress appear. The EMI technique is instrumental because it can detect early-stage damage in the existing bridge element that traditional visual inspection methods or conventional sensors frequently miss. This research also helps to provide a standardized monitoring protocol for FRP-strengthened bridges, promoting the long-term sustainability of transportation infrastructure by extending service life and reducing replacement costs. The results of this study helps to improve the scientific understanding of how FRP-retrofitted RC girder bridge functions in real-world conditions, promoting safer, more efficient, and cost-effective bridge maintenance.
Background of the bridge asset under consideration
This section describes the background of the selected bridge that has been in service for five decades carrying both pedestrian and vehicular loads. Comprehensive evaluations were conducted to assess its conditions and sign of distress in critical load carrying components. For the present investigations, an RC girder bridge with a three-girder configuration having six spans of 20.9 m each is selected, which is located across the Amba River at 16,400 m chainage, near the Alibaug MIDC in Raigad district, Maharashtra (India). A visual survey by the Public Works Department (PWD) revealed significant structural deterioration, including concrete cover spalling and reinforcement corrosion as shown in Figure 1. To systematically assess the material quality and extent of damage, a series of non-destructive and minimally destructive tests were performed by the team of engineers from Vijna Consulting Engineers as illustrated in Figure 2. These investigations included rebound hammer measurements, ultrasonic pulse velocity (UPV), carbonation depth determination, core sampling, half-cell potential mapping, and GalvaPulse corrosion rate evaluation.
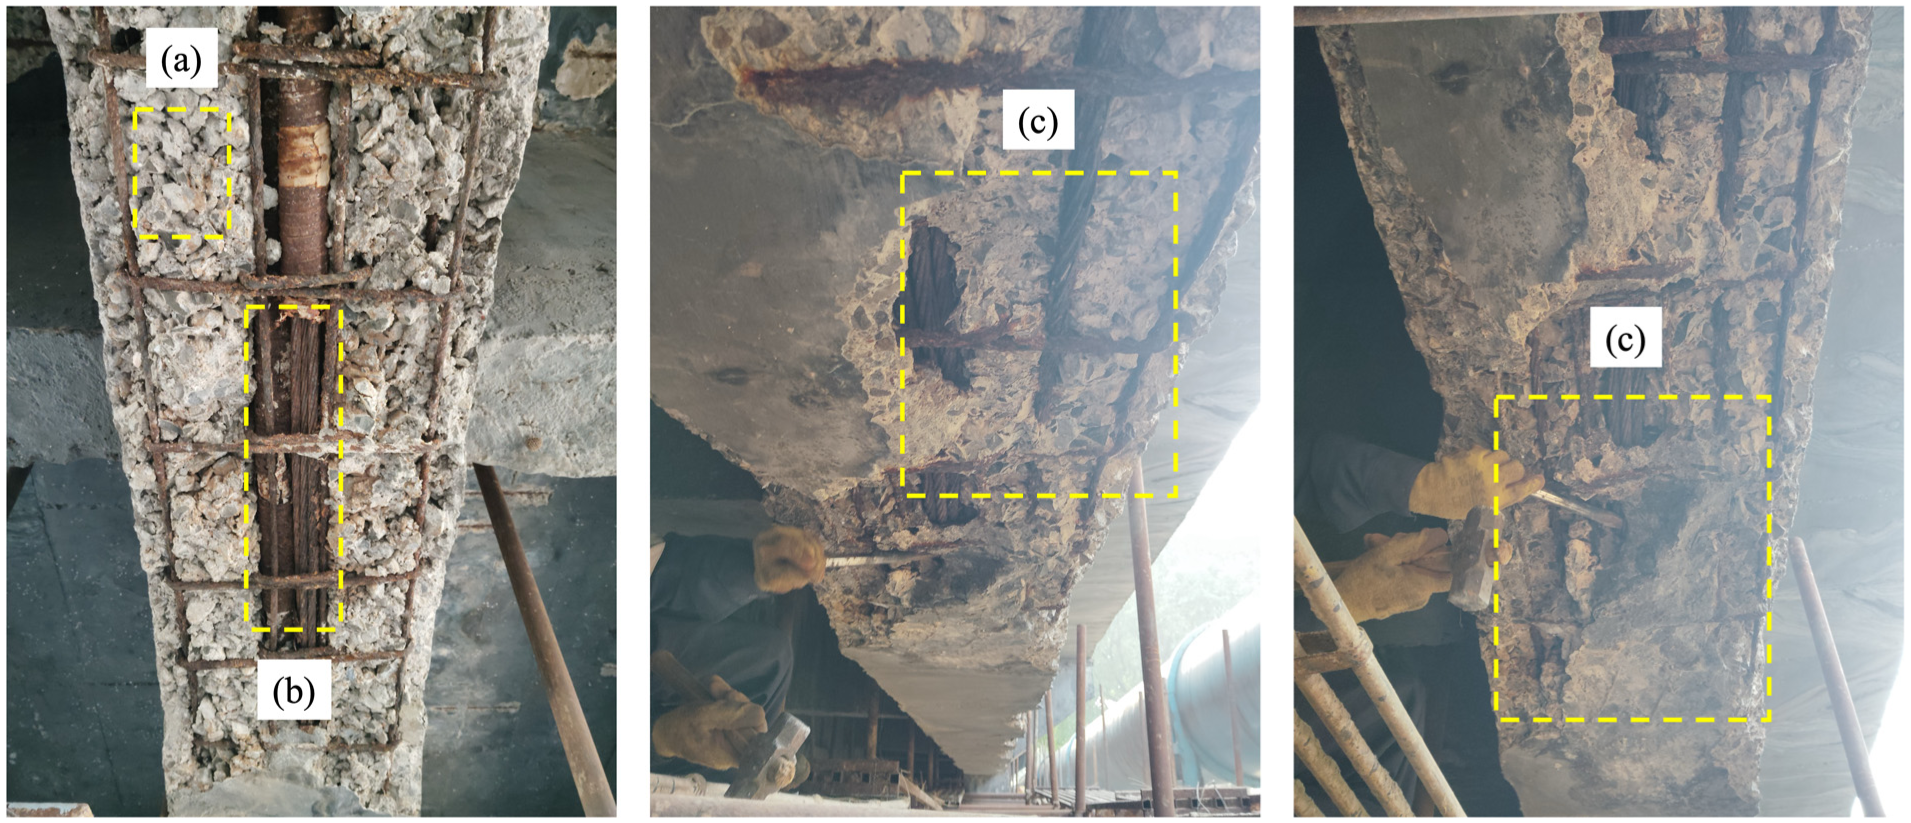
Various problems of the bridge asset as revealed by visual inspection (a) concrete spalling, (b) prestressing strands corrosion, and (c) exposed corroded confining reinforcement.
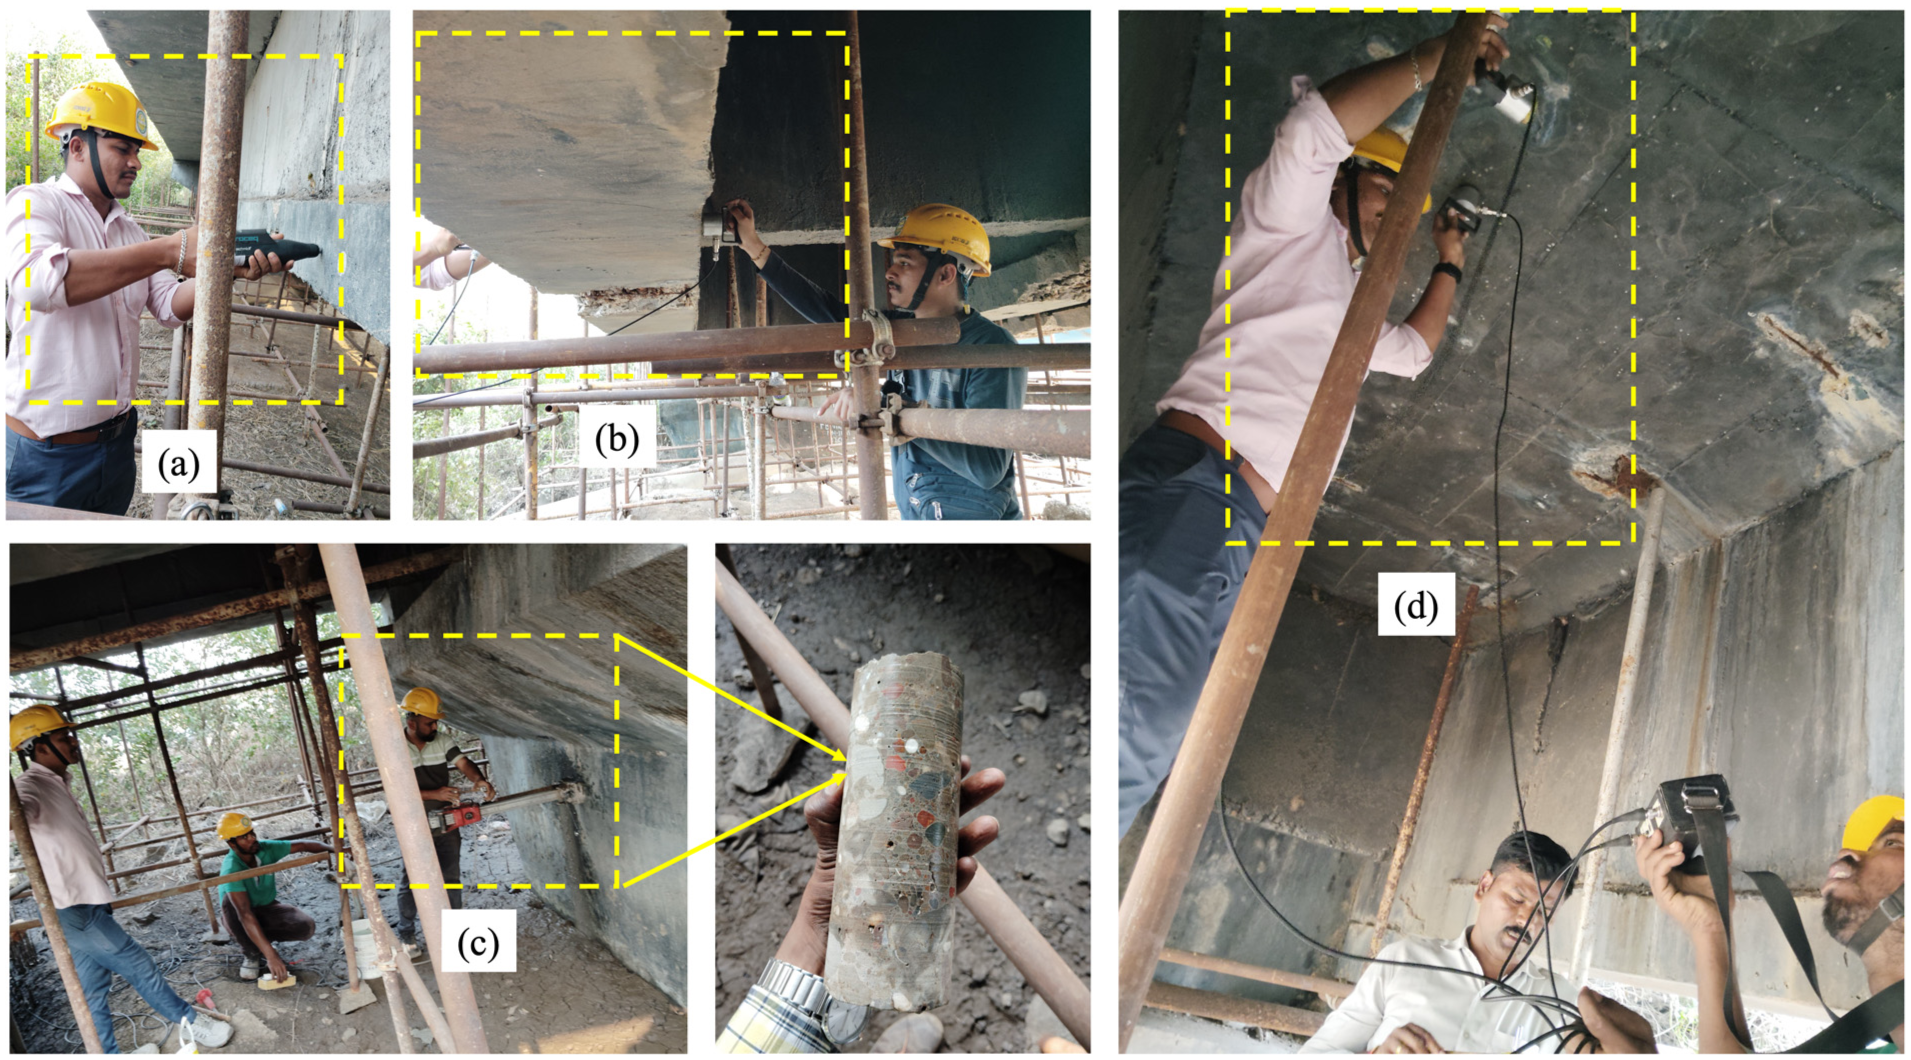
Various non-destructive testing (NDT) techniques implemented (a) rebound hammer-horizontal position, (b) direct UPV for beam after locating rebars with rebar locator, (c) core collection from pier, and (d) indirect UPV for beam after locating rebars. UPV: ultrasonic pulse velocity.
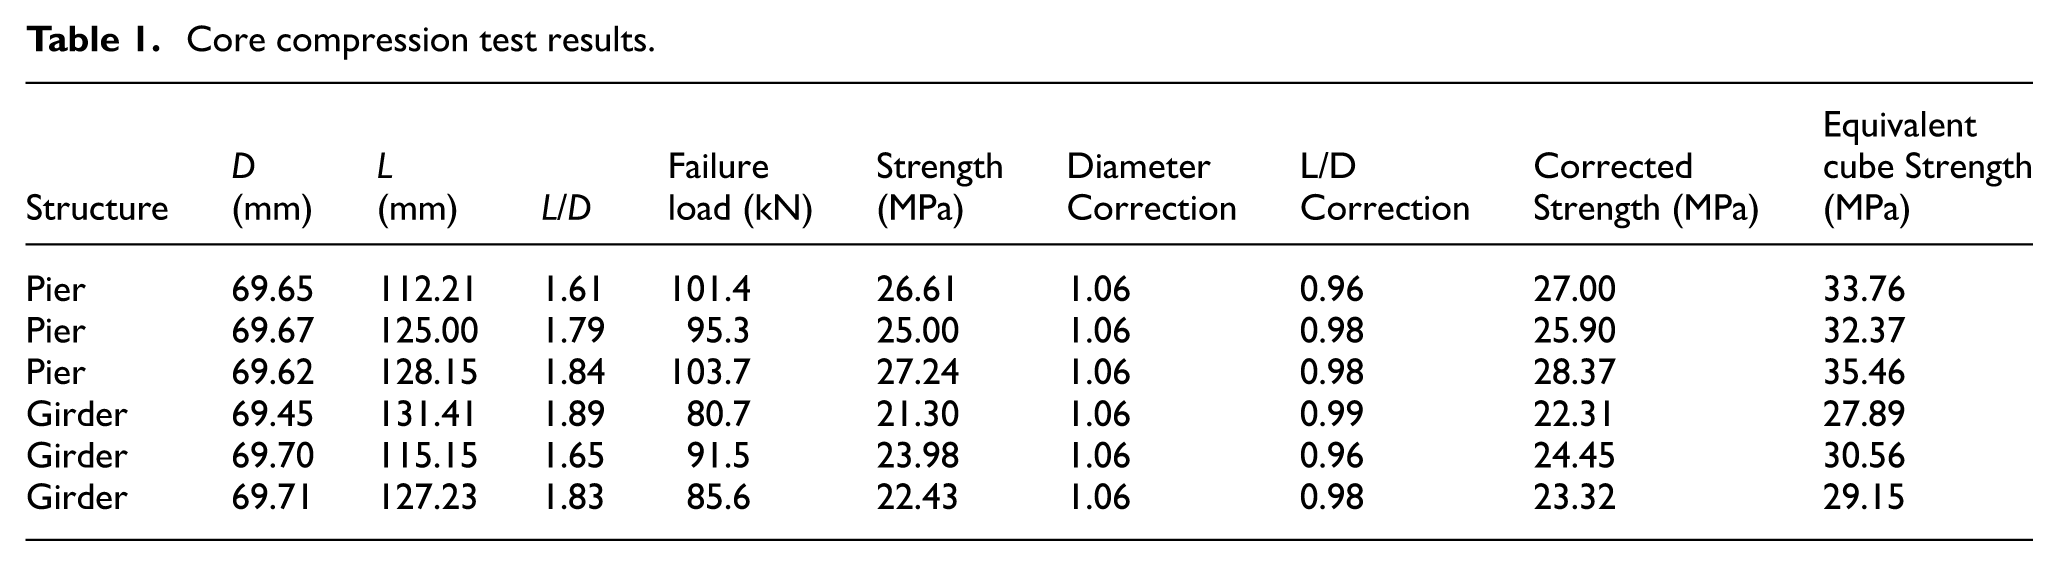
Results indicated that several members exhibited rebound strengths of approximately 28 MPa with corresponding UPV values below 3.75 km/s, consistent with a “doubtful” concrete quality classification. Half-cell potential measurements yielded an average value of −316 mV, corresponding to a 50% probability of active corrosion. In addition, GalvaPulse testing frequently recorded corrosion rates exceeding 0.25 mm/year—well above the 0.175 mm/year threshold for severe deterioration. Core testing further corroborated these findings, with many members exhibiting equivalent cube strengths below 30 MPa (Table 1).
Core compression test results.
In accordance with the design requirements and structural analysis carried out by Sanrachana Structural Strengthening Pvt Ltd, rehabilitation of the bridge prioritized the girders and slabs. The adopted scheme combined corrosion control measures, including application of corrosion inhibitors, cathodic protection, and patch casting. Furthermore, strengthening was carried out with FRP in line with ACI 440R guidelines. 59 For the substructure, which becomes submerged during the monsoon season, fabric-reinforced cementitious matrix (FRCM) strengthening was selected for the piers and abutments to enhance durability and ensure moisture permeability, as recommended in ACI 549. 60 The overall strengthening strategy is illustrated in Figure 3.
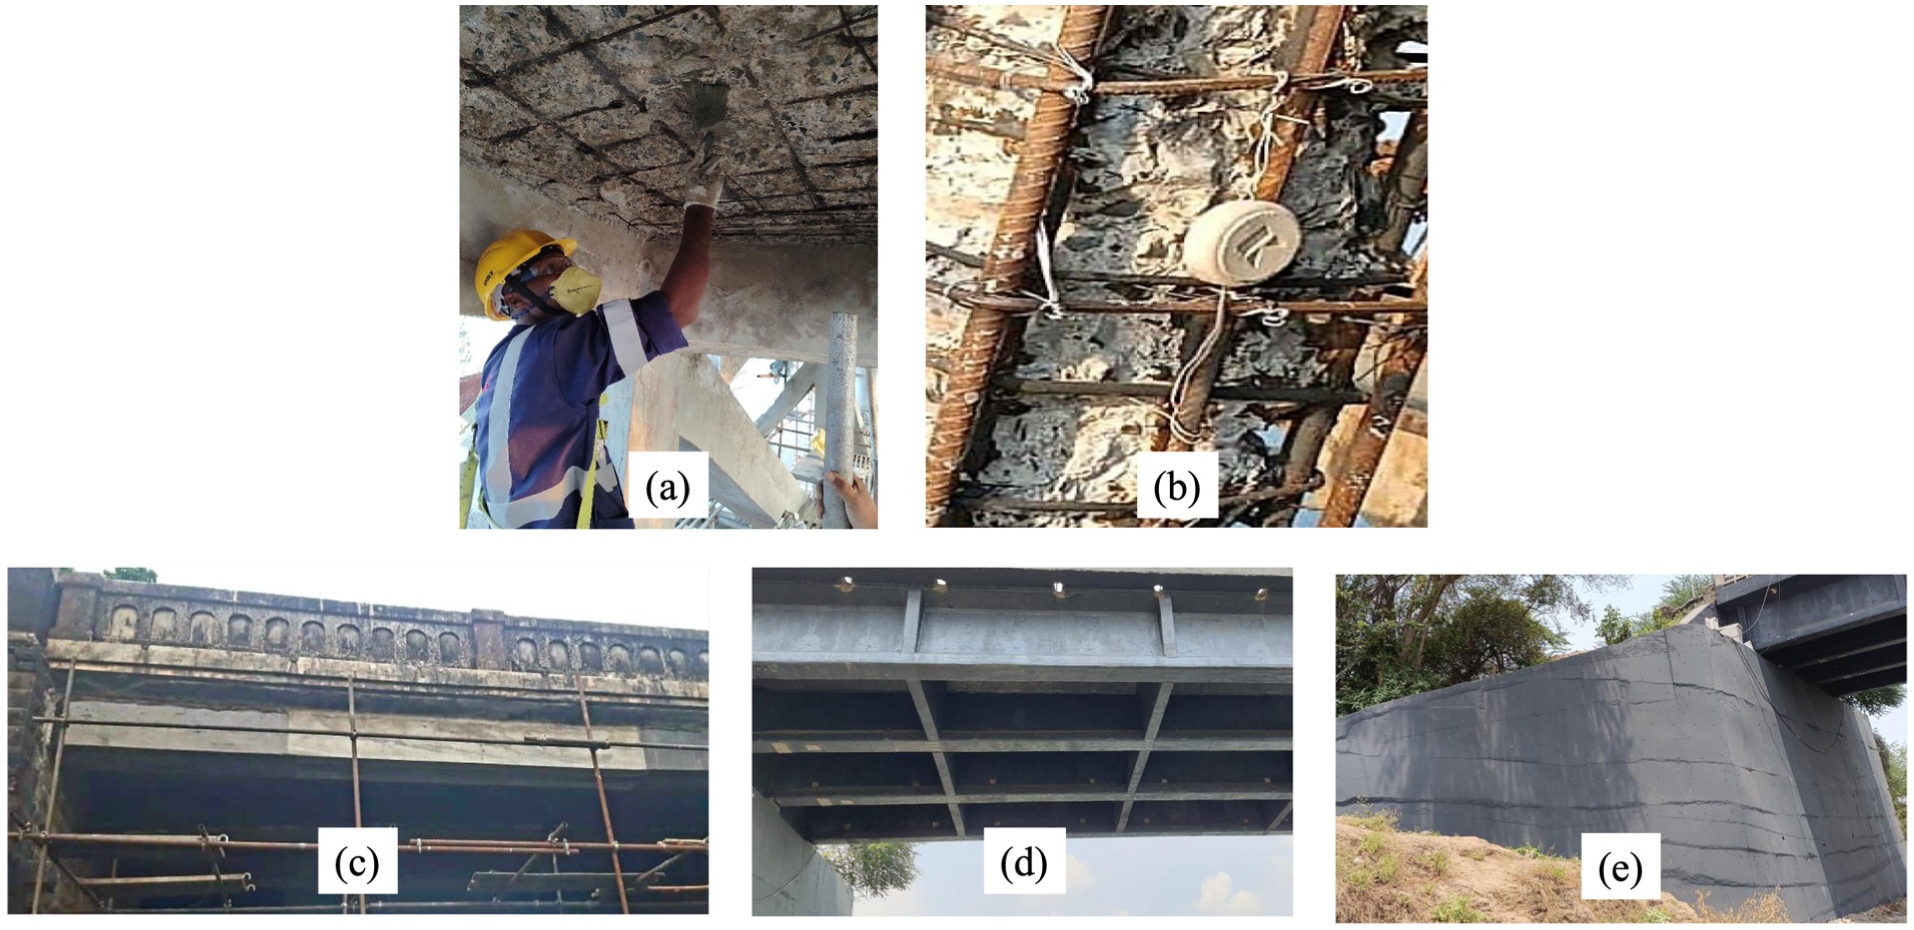
Strengthening methodology adopted: (a) cleaning and application of corrosion inhibitors, (b) cathodic protection, (c) application of primer and FRP strengthening, (d) protective Polyurethane (PU) coating, and (e) FRCM strengthening of substructure. FRP: fiber-reinforced polymer; FRCM: fabric-reinforced cementitious matrix.
Experimental setup and methodology
Conventional instrumentation
The strengthened bridge structure was evaluated through a systematic load testing program, wherein both the superstructure and substructure were instrumented with a suite of SHM sensors, as illustrated in Figure 4. Linear displacements were recorded using TML displacement transducers (model CDP-100, range 100 mm, resolution 0.01 mm) positioned to capture the central deflections of all three girders as denoted by LV01 to LV03 in Figure 5. Flexural stresses in the bottom FRP laminates at midspan were monitored using TML foil strain gauges (model FCA-5-11, gage length 5 mm, resistance 120
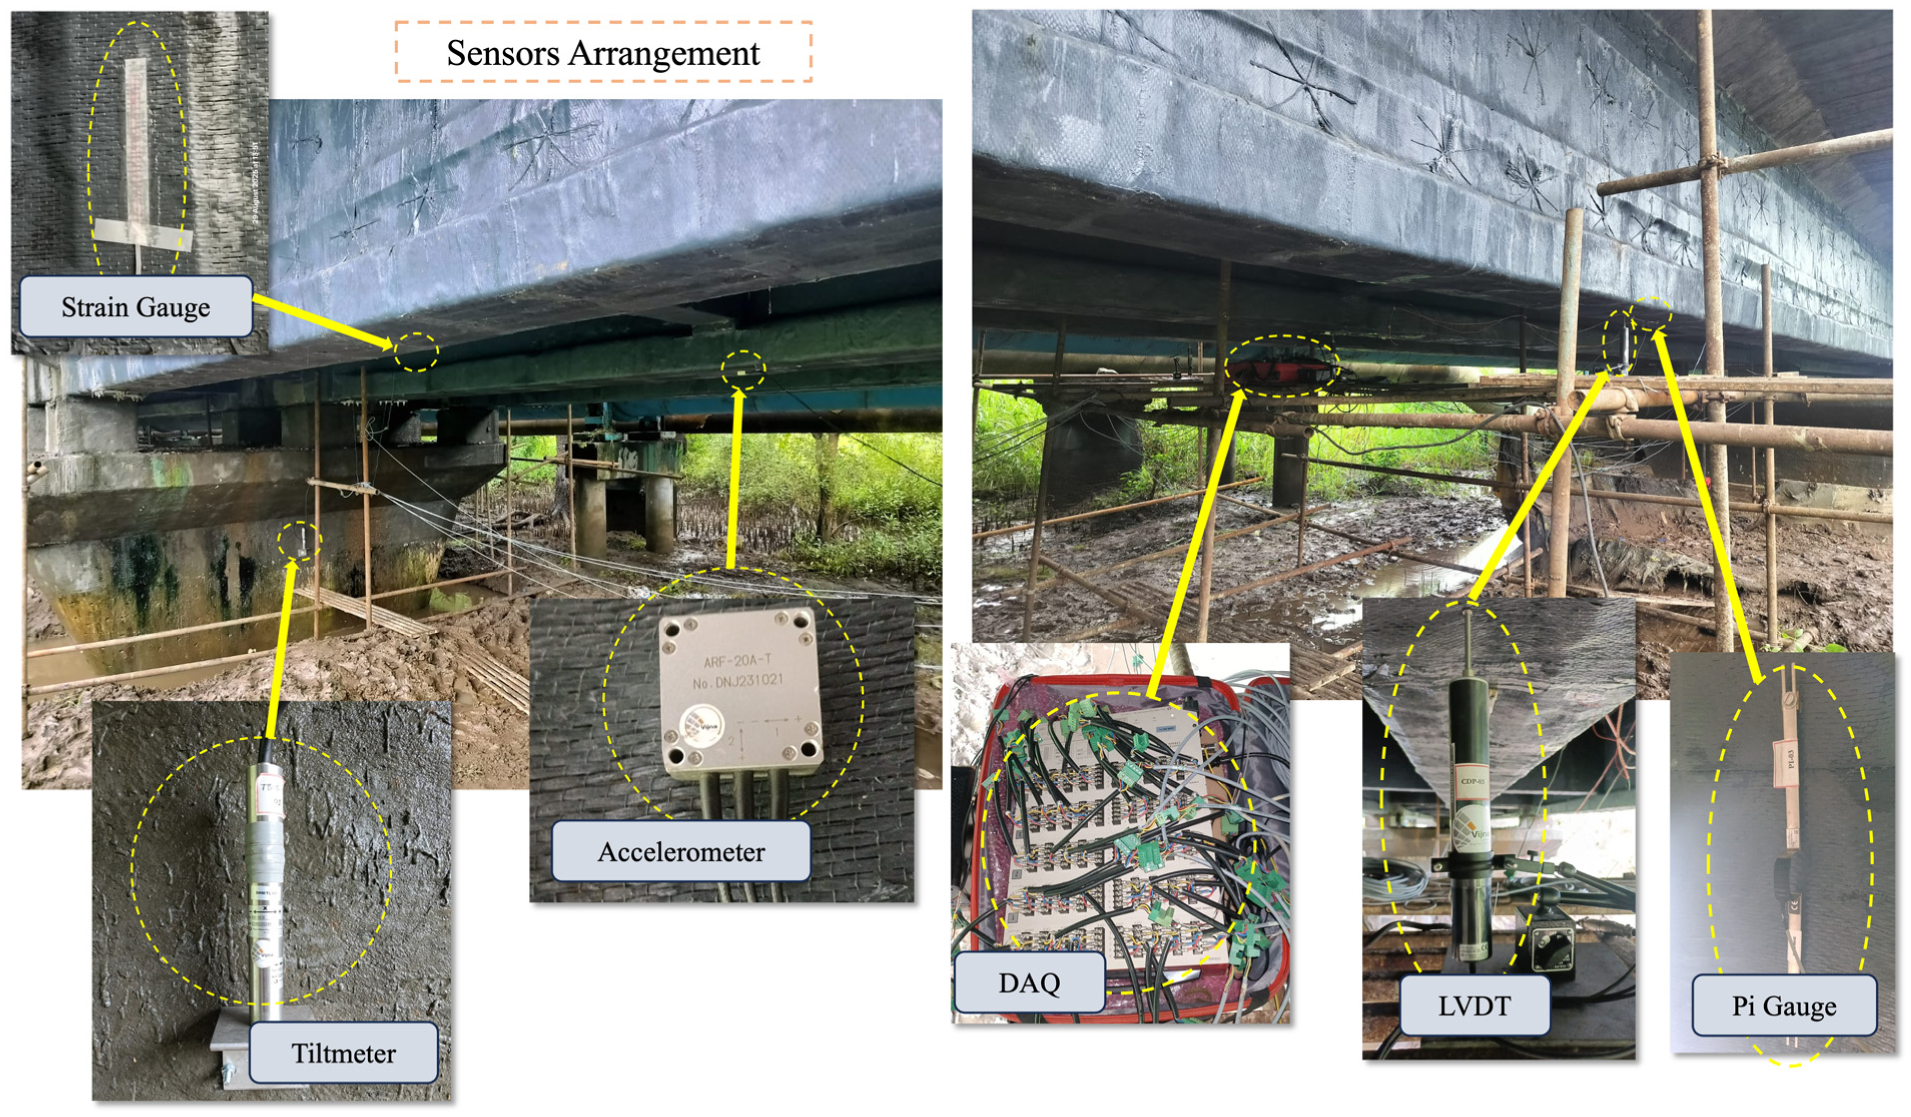
Conventional SHM sensor arrangement for FRP-retrofitted bridge. SHM: structural health monitoring; FRP: fiber-reinforced polymer.
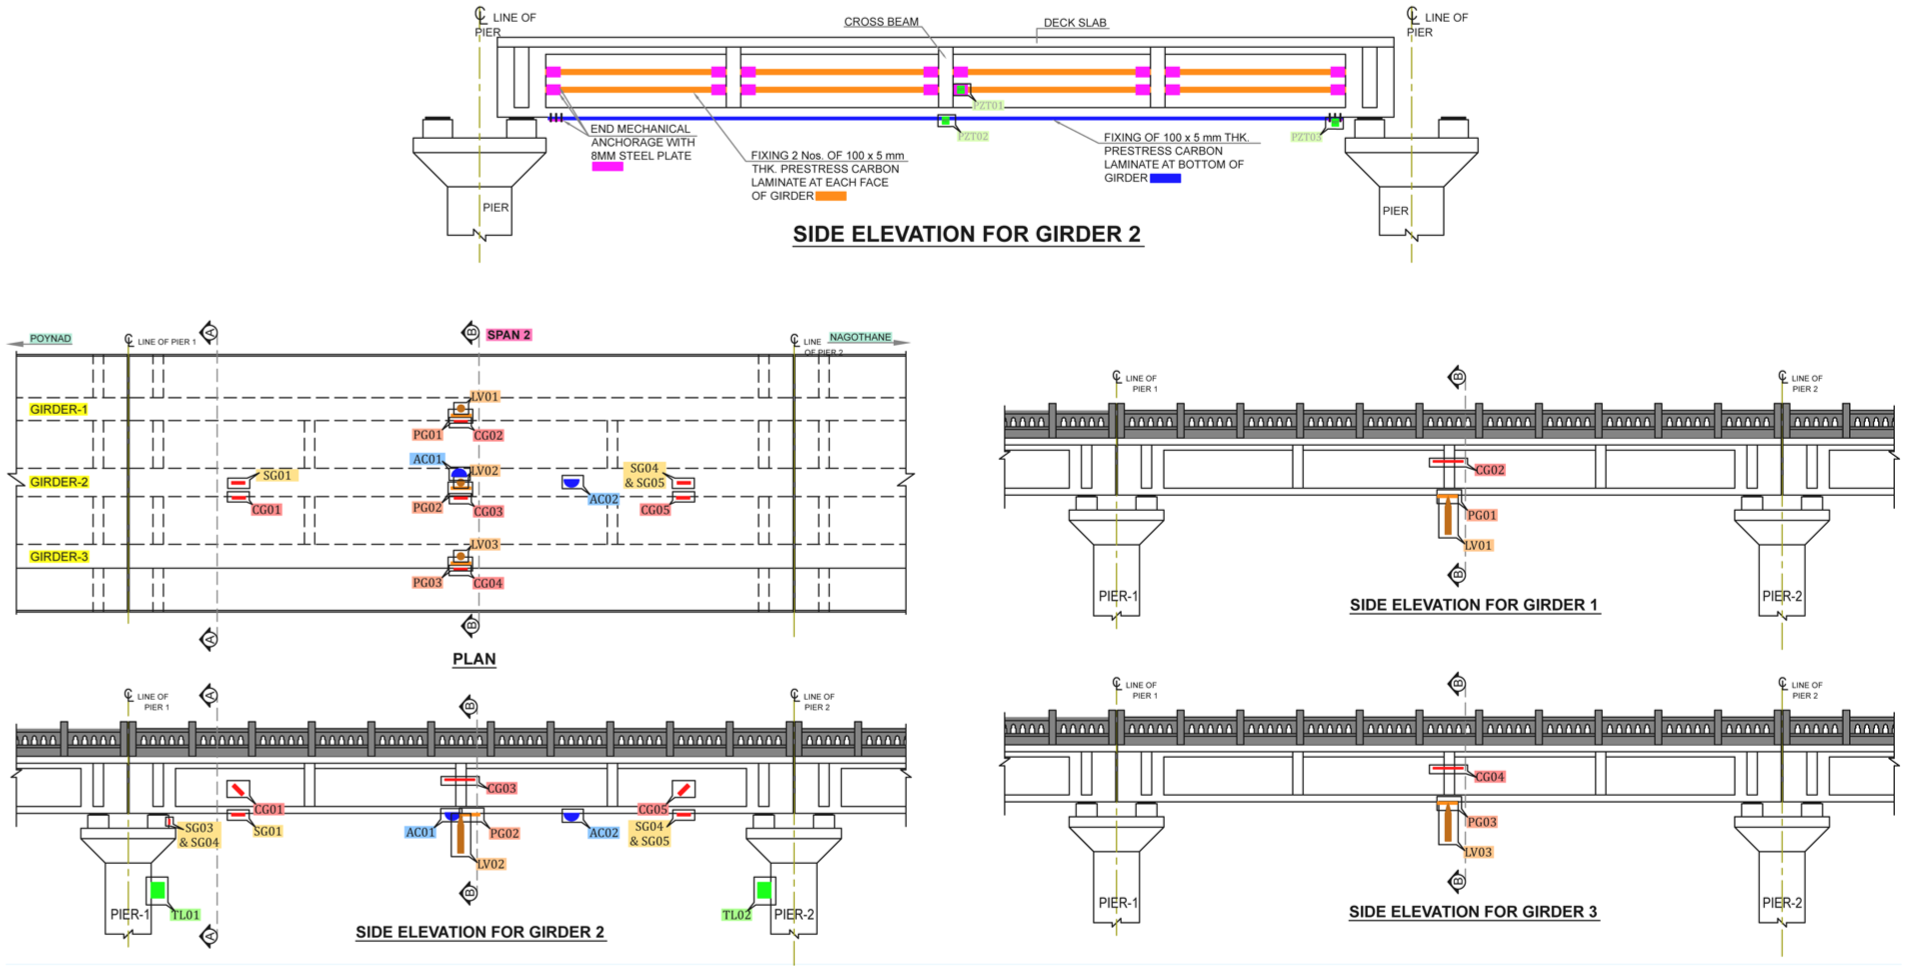
Sensor layout plan.
The present study relies on three different PZT transducers procured from Sparkler Piezoceramics (Pune, Maharashtra, India) (Material SP-5H, part number: P06L10W10T0.3W RLWS) at different critical structural locations along with other global vibration sensors like strain, accelerometers, and tilt meter for formulation of a comprehensive data-driven correlation model. These models enable virtual reconstruction of missing sensor response due to future sensor malfunction and can be used for damage assessment through deviation-based analysis.
EMI-based monitoring
In this study, commercially available PZT patches (designated as PZT1, PZT2, and PZT3) were employed as multifunctional transducers and bonded to different strengthening components (Figure 5), (i) PZT1 is placed at the FRP side laminate near the mechanical anchorage, (ii) PZT2 is placed at the bottom FRP laminate of the central girder, and (iii) PZT3 placed at the end anchorage of the bottom FRP laminate.
In the previous experimental investigation, 61 the critical location or failure modes are observed as the end debonding and mid span debonding. These locations are found to be most susceptible to bond degradation, interfacial slip, and anchorage distress under service loading. Therefore, the critical locations for the load testing of FRP-retrofitted bridge are chosen as mid-span FRP laminates, mid-span mechanical anchorage, and end anchorage. Hence, the authors placed the PZT patches at those critical locations along with nearby conventional sensors for heterogeneous data fusion. To ensure the complete bonding condition between the patches and the FRP-retrofitted surface, the authors have avoided the uneven locations. The study aims to use multiple vibration sensor modalities at critical and damage susceptible locations to formulate a correlation model for a robust post-strengthening assessment of FRP-retrofitted structures.
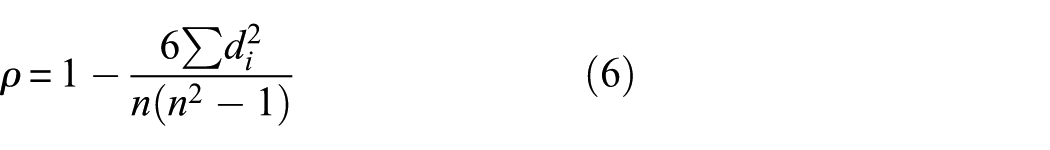
The EMI technique operates in a high-frequency regime that is inherently sensitive to local stiffness variations at the FRP–concrete interface.46,62,63 Even minor changes in bonding conditions manifest as shifts in conductance peaks and variations in statistical and wavelet-based impedance indices. By correlating these EMI-derived indices with strain measurements from FRP laminates and steel anchorages, as well as with global displacement responses, the framework enables detection of localized debonding or interfacial degradation. Any future onset of debonding or interfacial degradation is expected to disrupt the established monotonic correlations between EMI indices and conventional sensor responses. Such deviations from the reference correlation state provide an indirect yet reliable indicator of localized damage, thereby enabling early detection of interface deterioration before it becomes apparent in global structural response parameters. The impedance data in terms of conductance and susceptance has been acquired using commercially available Keysight LCR meter E4980AL. The sensor layout is illustrated in Figure 6. Prior to bonding, the host surface at each location was mechanically abraded and chemically cleaned with Acetone to ensure proper contact and effective strain transfer. A thin epoxy resin adhesive layer (Araldite AW106, Pidilite Industries Ltd., India) has been used to permanently adhere the PZT patches, ensuring both mechanical robustness and adequate electrical insulation. The bonded PZT patches serve a dual purpose: actuation and sensing. For actuation, the patches were excited using an LCR meter (Keysight E4980AL with frequency sweep mode), Keysight Technologies, USA), which applied a harmonic 1V signal over a specified frequency band, thereby inducing stress waves in the host FRP–concrete composite through the converse piezoelectric effect. The mechanical response of the structure, in turn, induces a mechanical response in the same PZT element, which was transduced into an electrical signal through the direct piezoelectric effect. This coupled electromechanical interaction between the structure and the PZT sensor has been quantified in terms of the electrical admittance, measured as a function of frequency. The following equation represents the relationship between electrical admittance (inverse of electrical impedance)
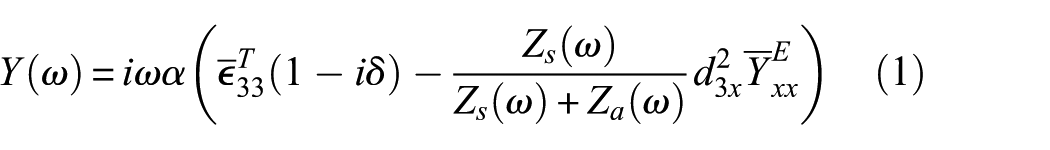
where
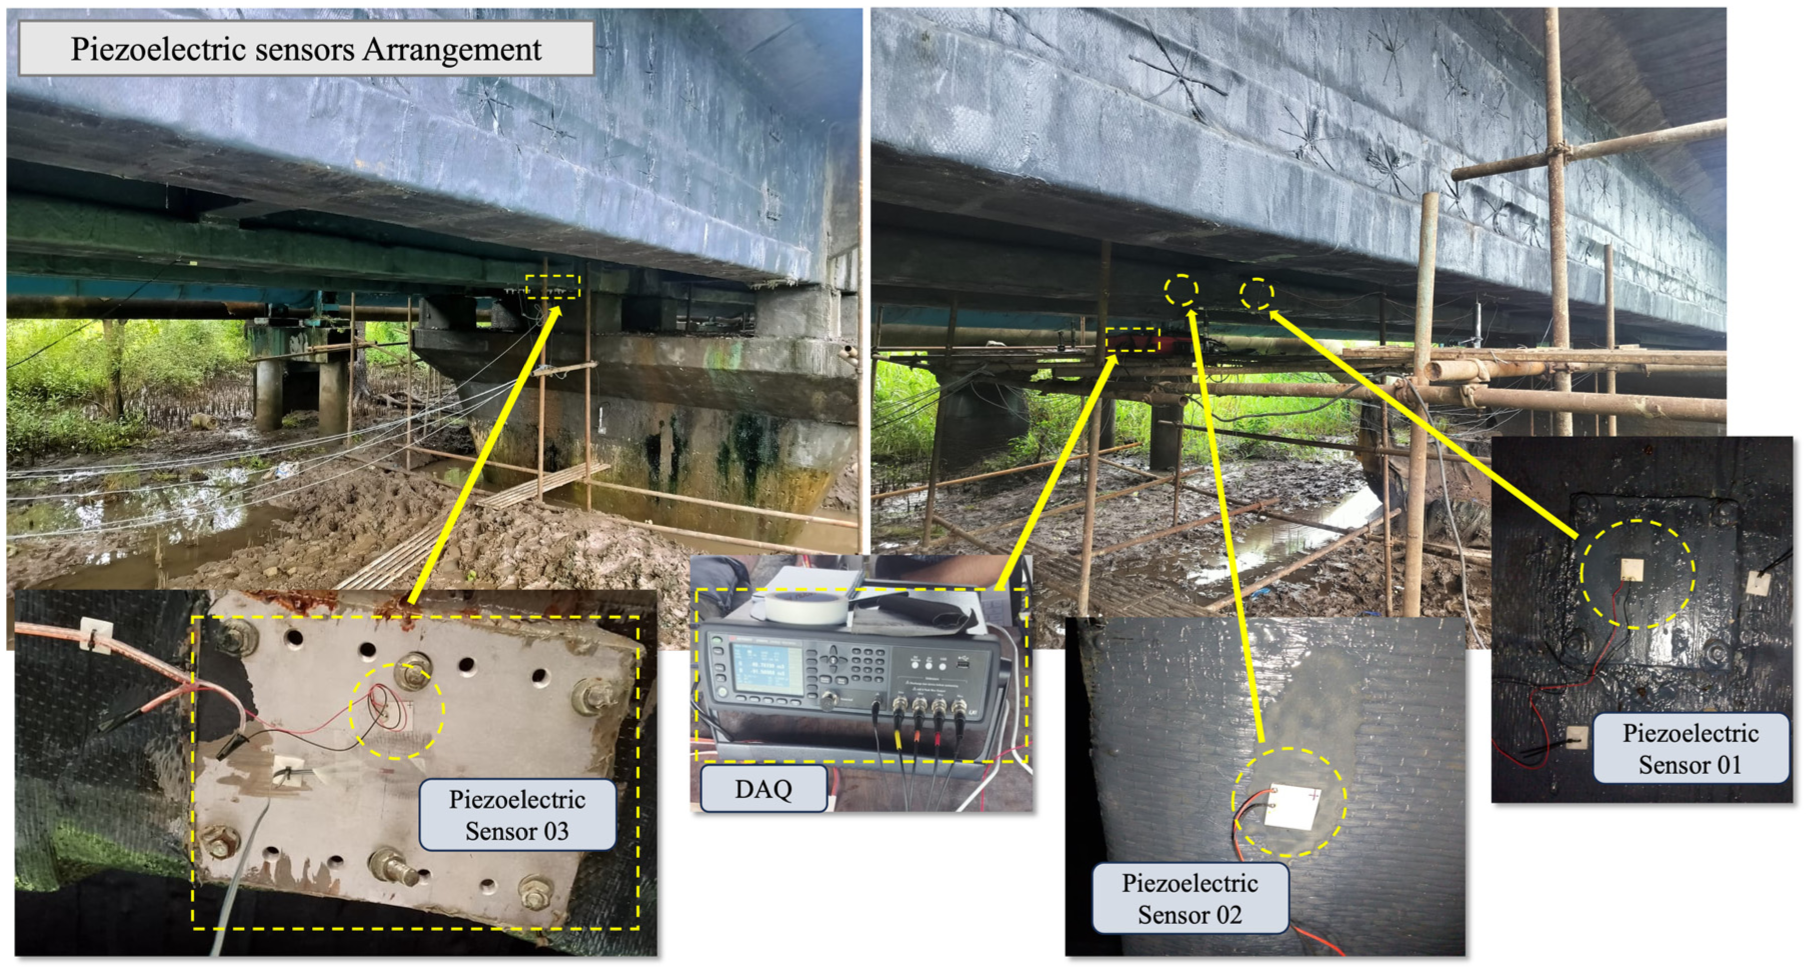
EMI SHM sensor arrangement for FRP-retrofitted bridge. EMI: electromechanical impedance; SHM: structural health monitoring; FRP: fiber-reinforced polymer.
For each static loading condition, impedance signatures were collected and subsequently compared with baseline or reference signatures. The mechanical variation in the structure due to change in the structural state is depicted in terms of the variation in the frequency domain characteristics of the EMI signal. This variation in the EMI signal under different loading conditions can be quantified using different statistical and wavelet-based indicators. The different statistical and wavelet variation indicators used in this investigation are as follows:
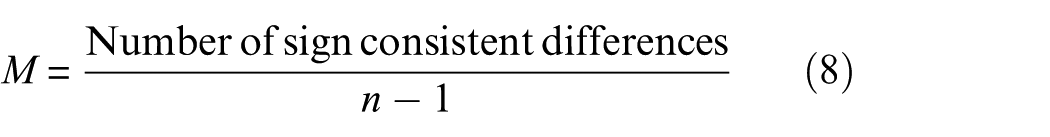
RMSD: This statistical indicator describes the variation in the signal by quantifying the deviation of the impedance signal from its reference state.
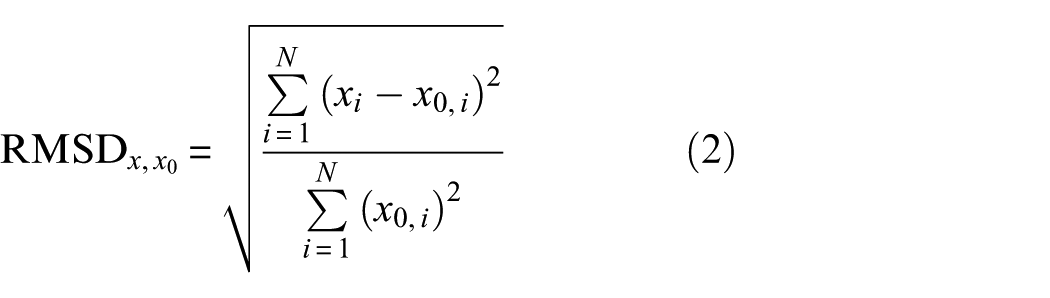
where
Wavelet mean: It describes the variation of the mean of the discrete wavelet coefficient due to the deviation of the impedance signal from the reference state. It is given by
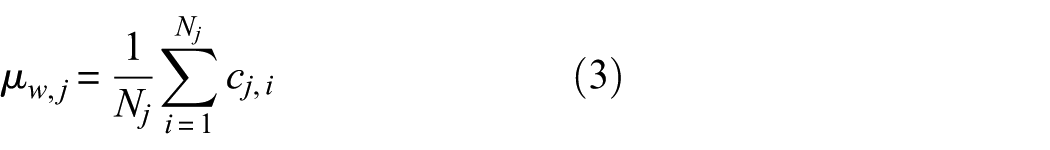
where
Wavelet entropy: It is the statistical indicator of the degree of disorder in the impedance signal as compared to that of the reference state. It is given by
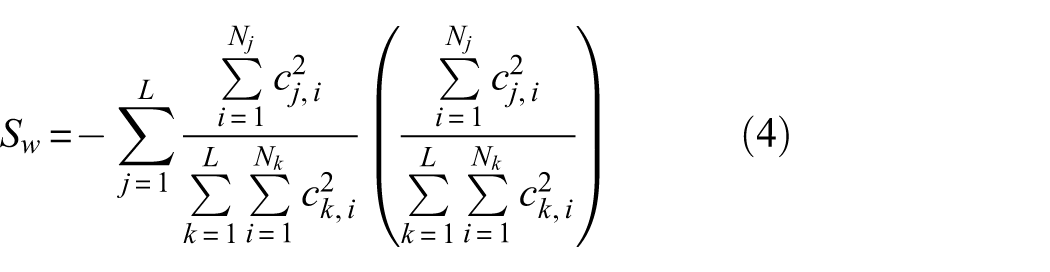
where
In this analysis, statistical variation parameter like RMSD was used to quantify the shift in impedance spectra under different loading conditions. Additionally, the discrete wavelet transform-based damage indicators such as wavelet mean and entropy were also calculated. A comprehensive comparison between different wavelet families has been carried out in the study by Kumar et al., 66 where it has been observed that the damage detection capability of the wavelet is dependent upon the number of vanishing moments. However, the crack detectability is reduced for wavelets with a very high number of vanishing moments. Similar investigation for damage detection and localization using EMI methods has been carried out in the study by Kamal et al., 29 where sym4 wavelets produced better results than bio2.4. Sym4 offers sufficient vanishing moments to represent smooth components effectively while maintaining numerical stability and efficiency, making it well-suited for the characteristics of the analyzed signal or data. The Sym4 wavelet-based indicators has been selected to extract damage-sensitive parameters, specifically the wavelet mean and entropy. These parameters have been found to be useful for detecting localized, transient, non-stationary features in a signal, which traditional indicators such as RMSD may fail to detect.
Static loading protocol
For the evaluation of the strengthened bridge system, controlled static load testing was carried out using three identical trucks, each having a gross vehicle weight of approximately 400 kN. The trucks were systematically positioned on the test span in an incremental manner to generate distinct loading scenarios. A total of six static loading scenarios were evaluated, as shown in Figure 7. These load cases includes:
Static 1—First truck positioned halfway on the girder
Static 2—First truck fully on the girder
Static 3—First truck fully on the girder with the second truck halfway on it
Static 4—First and second truck fully on the girder
Static 5—First and second truck fully on the girder, while third truck halfway on it
Static 6—All three trucks fully on the girder
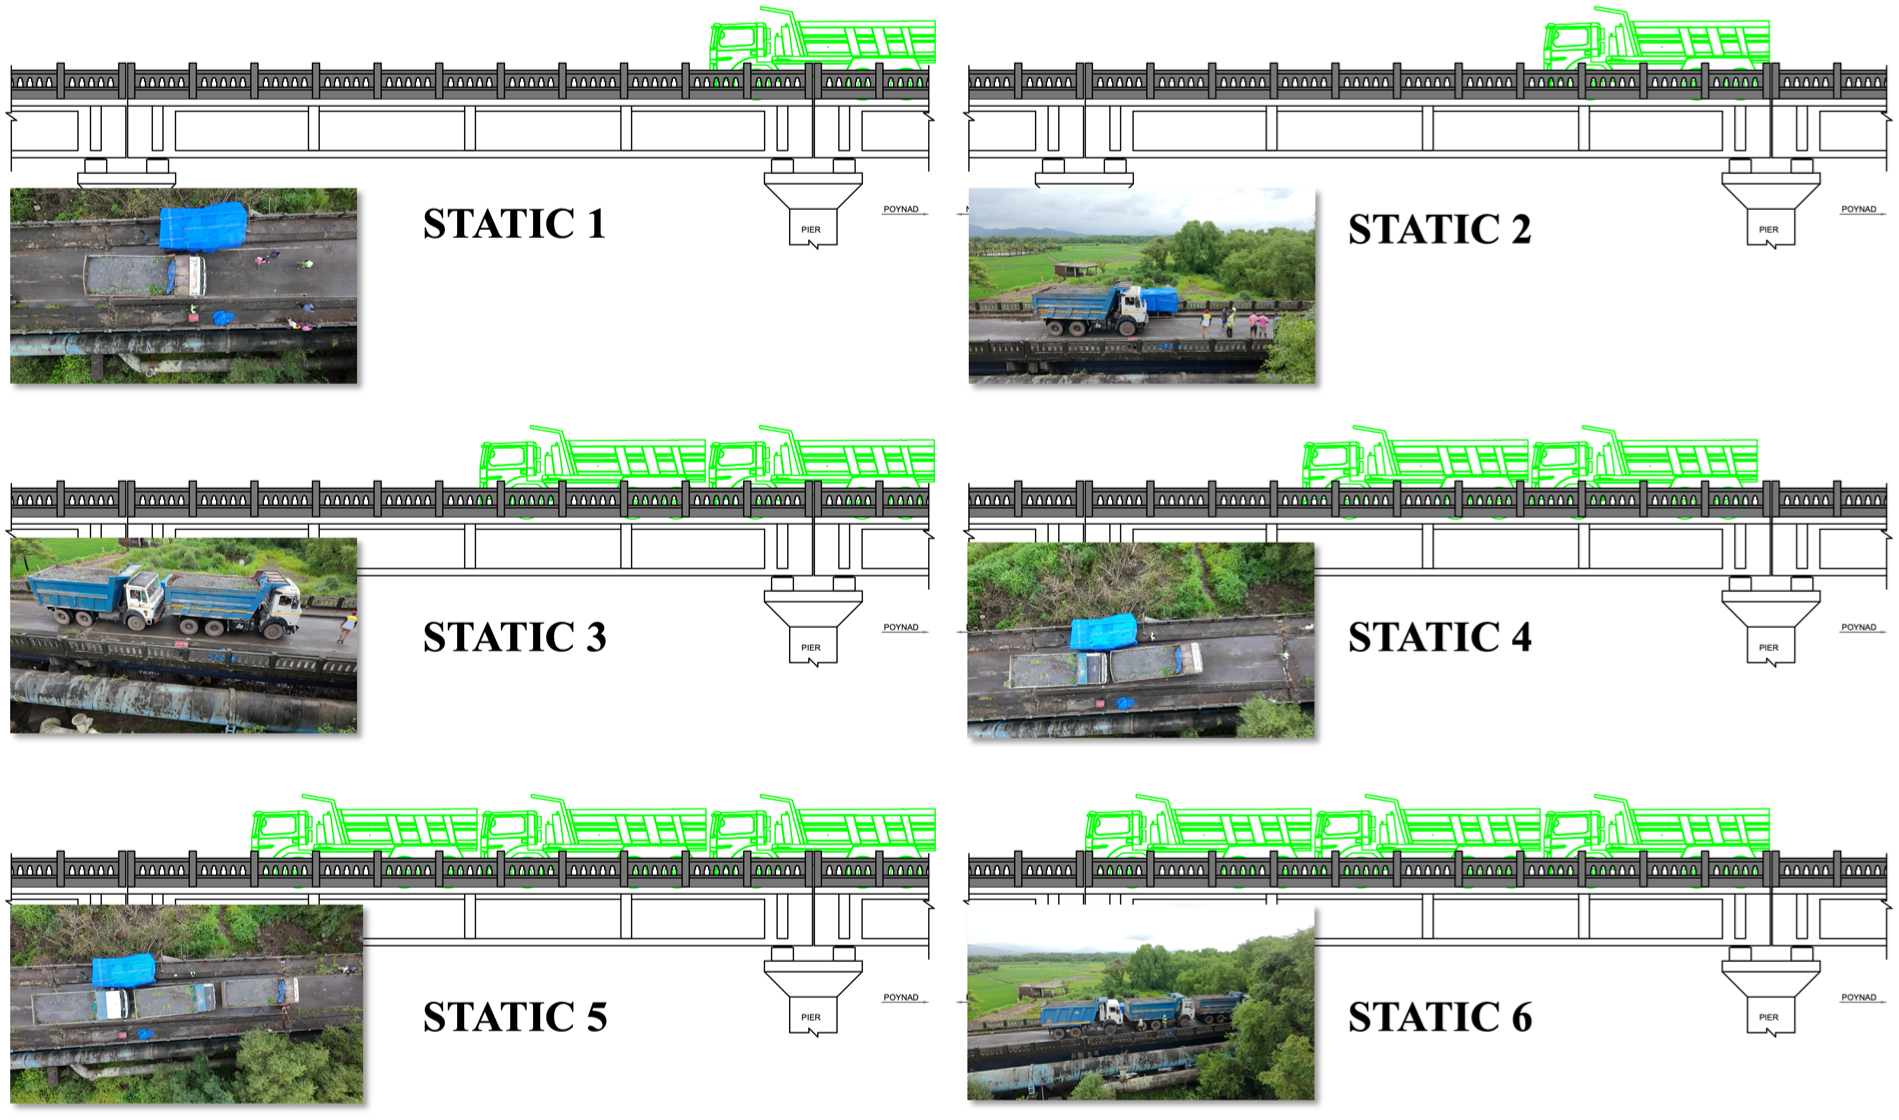
Schematic representation of different loading schemes over the bridge superstructure.
During each loading case, the vehicles were carefully maneuvered into the designated positions and allowed to stabilize for 15 min to eliminate the influence of transient dynamic effects such as braking, tire settlement, or suspension oscillations. Only after the vehicles had reached, a quasi-static equilibrium state was data acquisition initiated. This ensured that the recorded sensor responses reflected purely static structural behavior, free from vibration-induced noise. The ambient temperature was measured prior to every data collection and was observed to be between 23 and 24°C. At every loading stage, data were simultaneously collected from all instrumented sensors, including displacement transducers (LV01, LV02, and LV03 for girder deflections), strain gauges and pi-gauges (PG02, CG03, and for stress assessments), tiltmeters (for pier rotations), accelerometers (for modal characterization under free-vibration excitations), and EMI-based PZT sensors. The stabilized loading sequence allowed a reliable comparison of the bridge response across the six cases, capturing variations in global deflection profiles, local stress distribution in FRP laminates, anchorage performance, and substructure rotations. Each static case lasted for 15 min, which includes signal stabilization, and collection of data from PZT sensors. The data collection was repeated two times to eliminate any accidental noise.
Results and discussions
This section presents and interprets the results obtained from the various analysis conducted in this study. The primary sensing elements comprise three PZT sensors strategically positioned to capture different aspects of the strengthened girder’s behavior: PZT1 is installed at mid-span on the side face over the FRP laminate to monitor stresses within the laminate; PZT2 is located at midspan on the underside of the FRP to assess the flexural response; and PZT3 is placed near the support at the mechanically anchored end of the FRP to evaluate anchorage activation and its effectiveness. Therefore, each PZT sensor provides information on a distinct component of the strengthening mechanism. To enable a comprehensive multi-sensor assessment, strain data from additional gauges (CG01, CG03, CG05, PG01, PG02, PG03, and SG05), along with displacement measurements from the nearby LVDT (LV02), were also analyzed. These datasets were integrated with the PZT responses to obtain a more holistic understanding of the structural behavior and performance of the strengthening scheme.
Load test results
The structural response under six incremental static loading cases was evaluated using deflection, strain, and tilt responses obtained from multiple sensors placed on the girder, targeting different strengthened elements. The results, summarized in Figure 8, demonstrate a consistent monotonic increase in the magnitude of the response for all the sensors as the applied loading becomes progressively more severe from a single truck partially positioned on the girder (static 1) to three trucks fully placed on the span (static 6). Since the trucks were placed symmetrically along the bridge, there was no variation in tilt in the Y-direction (across the width) due to loading. The mid-span deflection recorded by sensor LV02 reached a maximum of only 0.23 mm under the static loading case 6. This is significantly lower than the permissible limit of
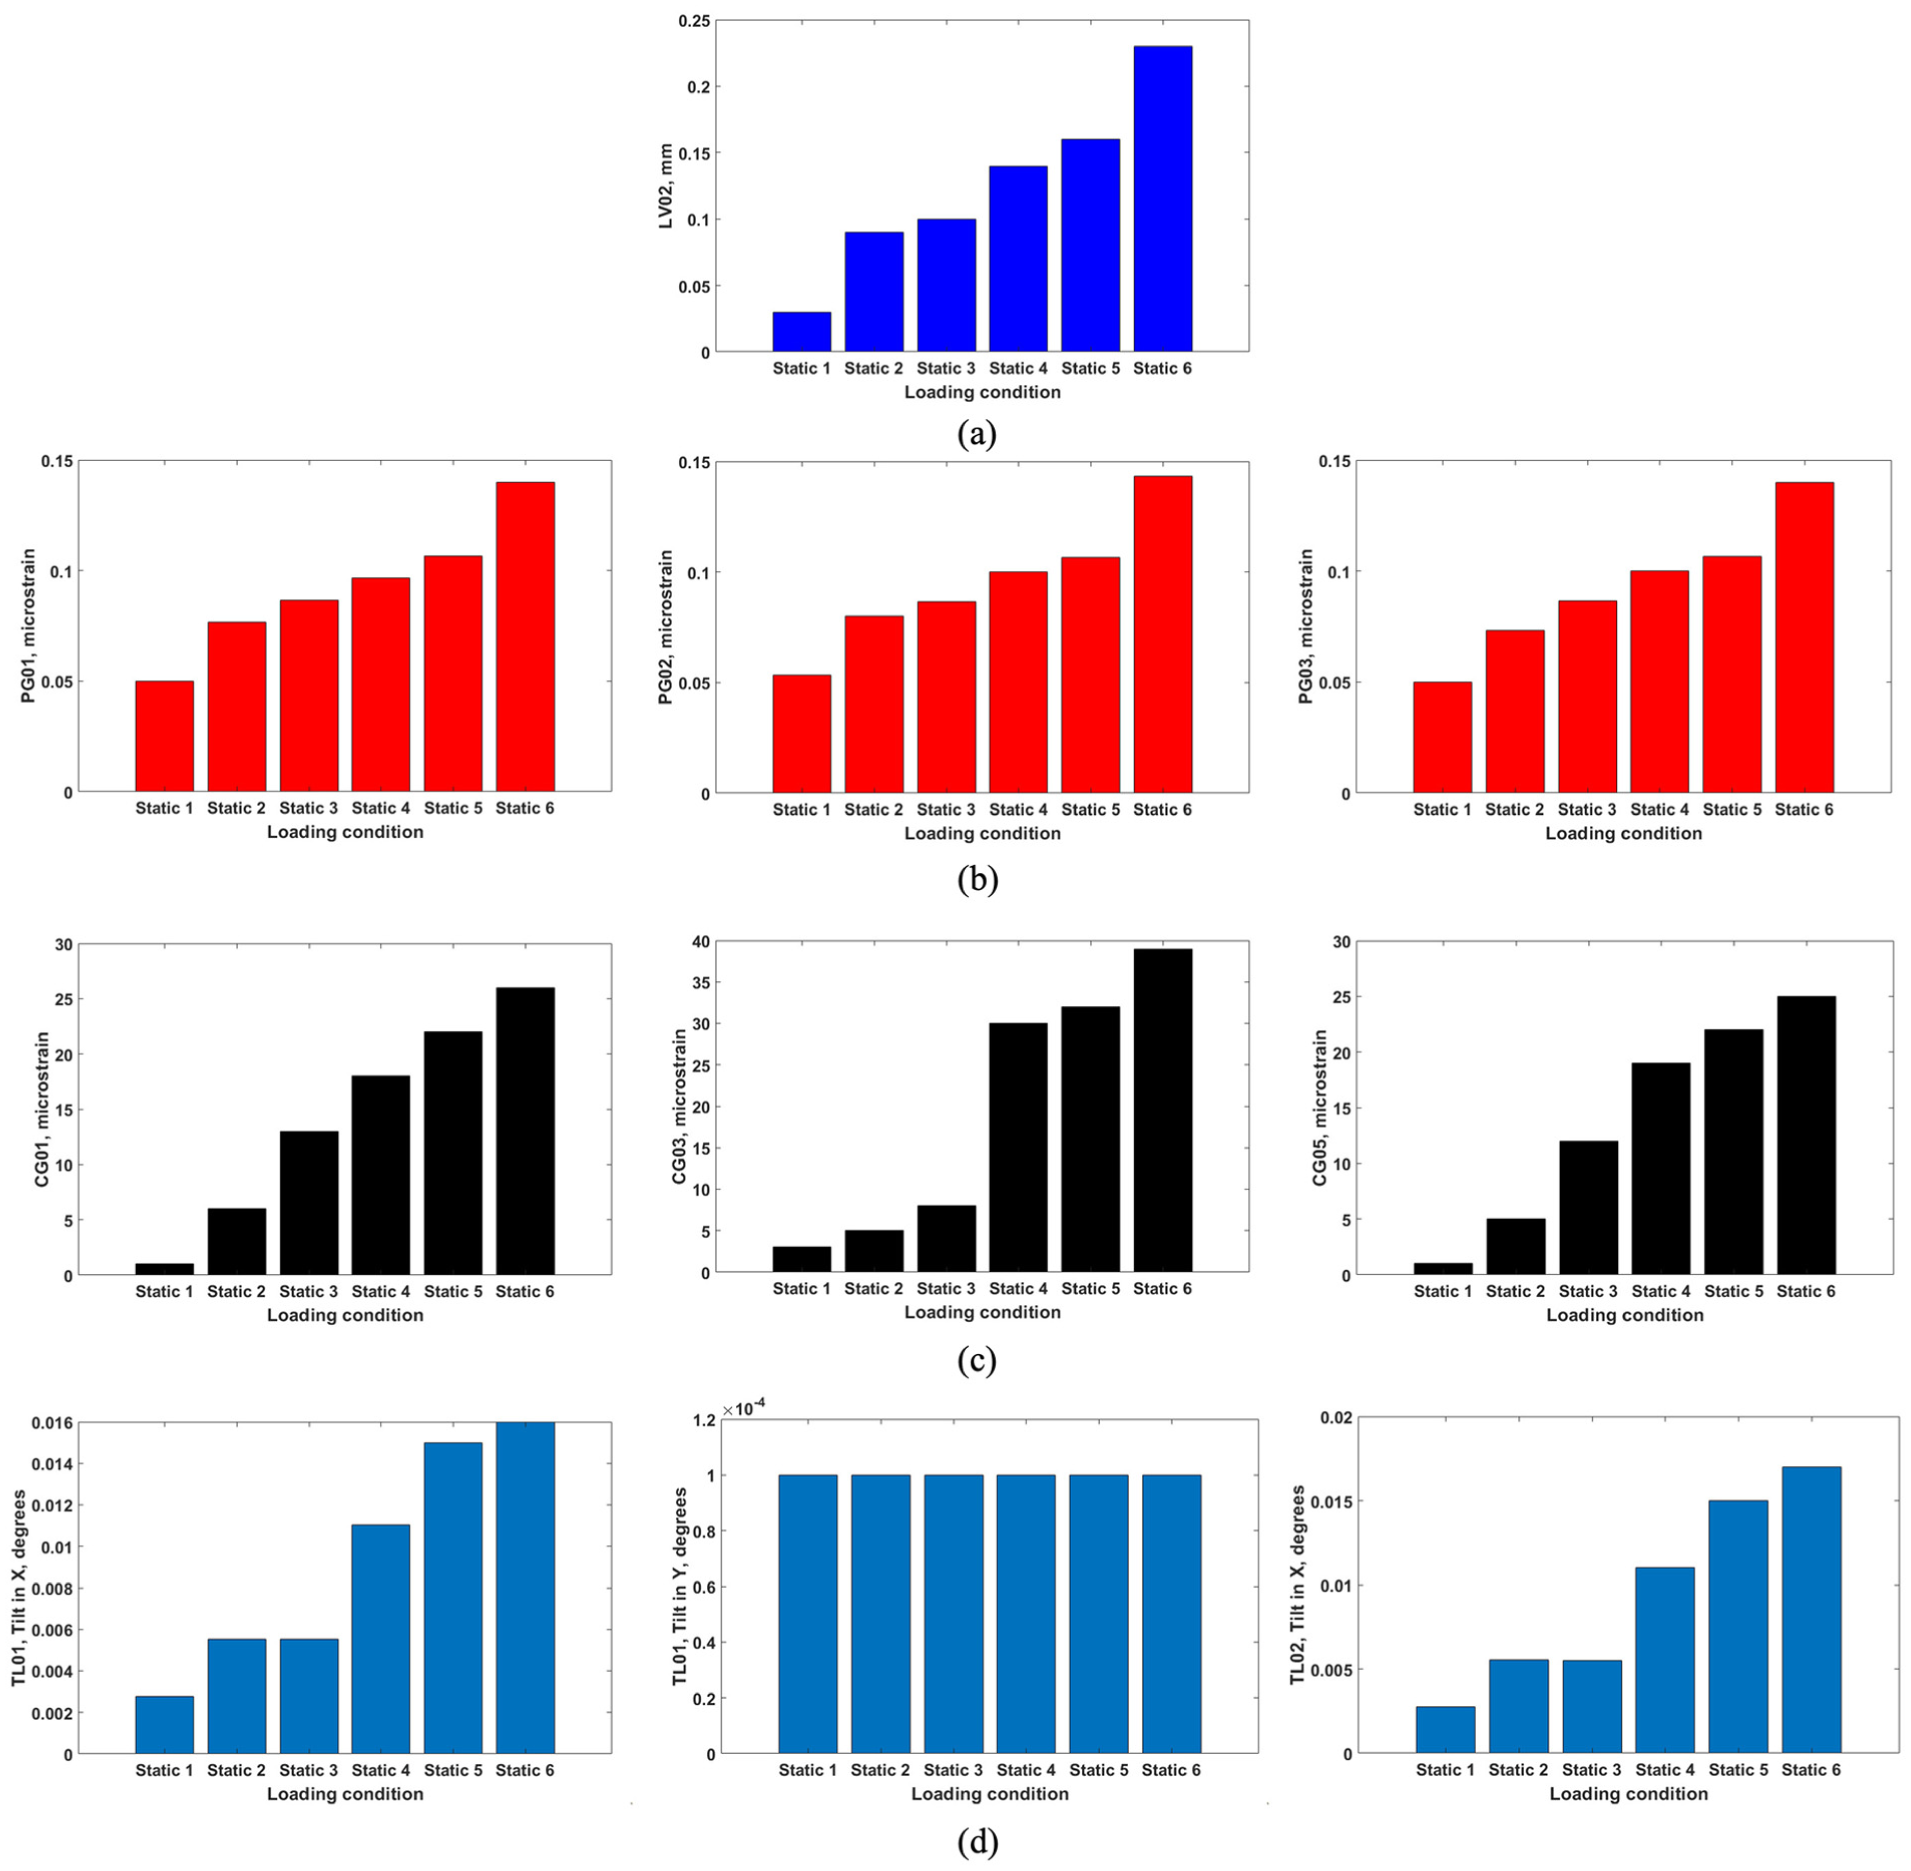
Load test results for (a) LVDT, (b) pi-gauges, (c) strain gauges, and (d) tilt meters.
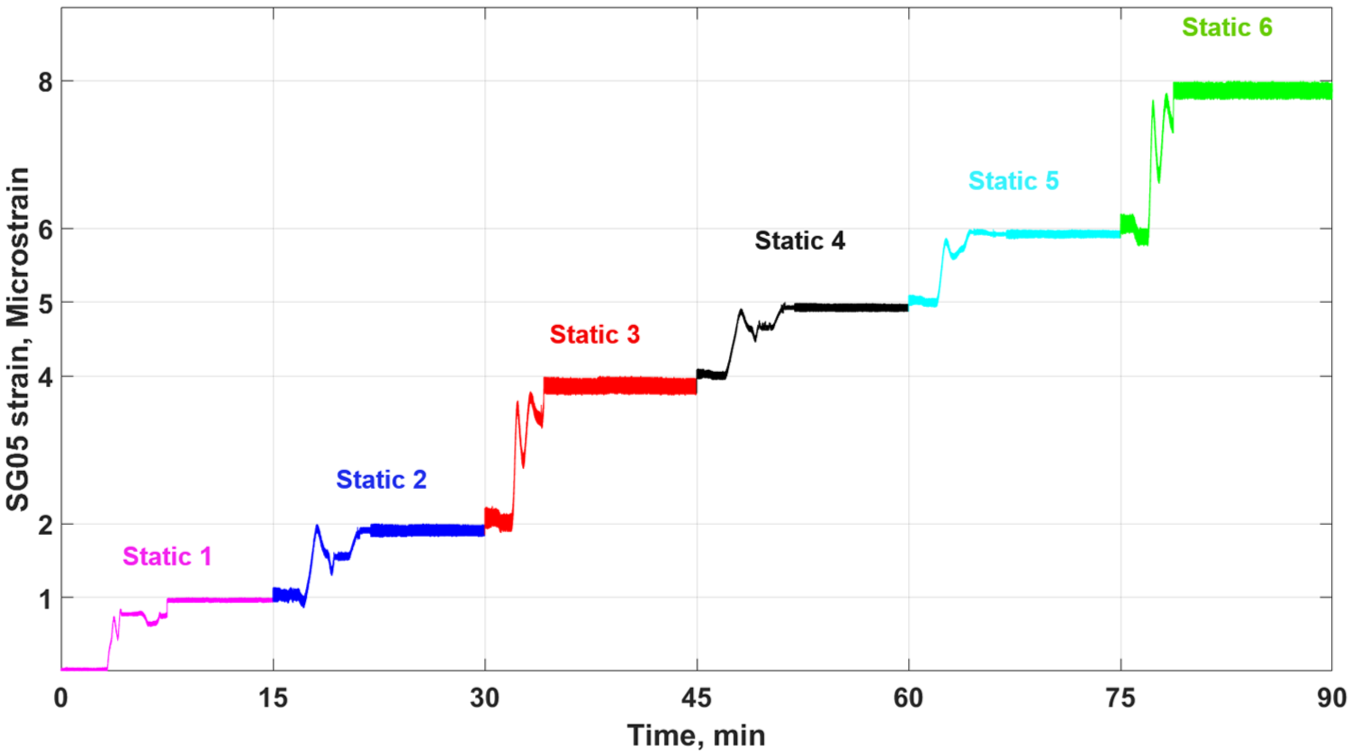
The variation of strain data for each static load case.
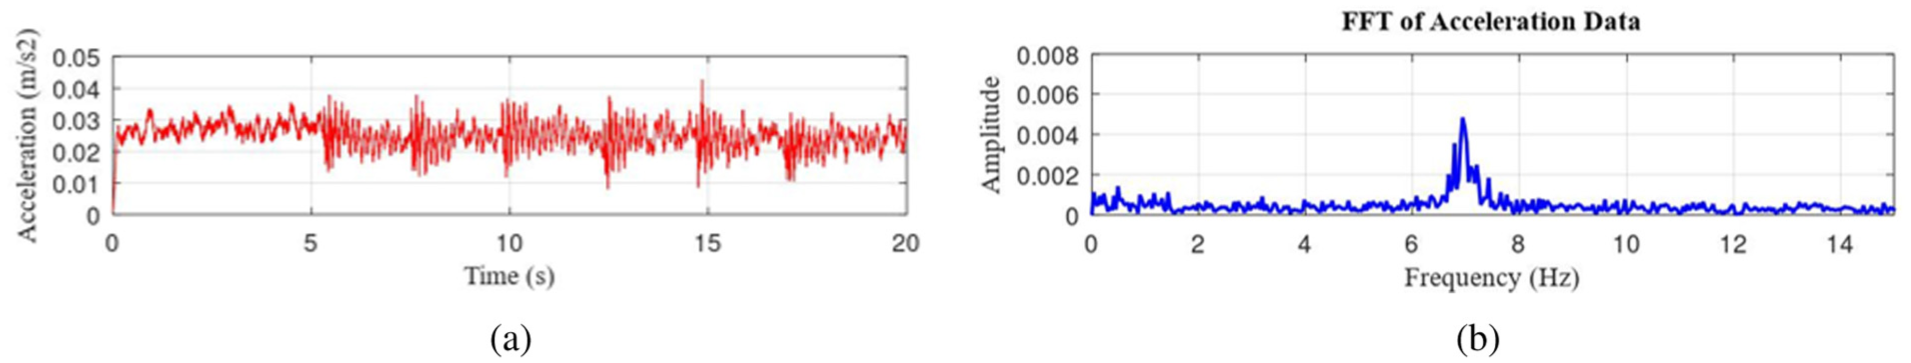
Acceleration obtained from ACC01, (a) variation of acceleration in time domain and (b) fast Fourier transform of acceleration data.
EMI spectra analysis
The conductance signatures of the FRP-retrofitted bridge were acquired for all three sensors, such as PZT1, PZT2, and PZT3, in their baseline signatures and compared with various static loading cases. The variation in conductance spectra for the PZT1, PZT2, and PZT3 is plotted in Figures 11, 12, and 13, respectively. The reference or baseline state conductance spectra are presented in a solid blue line. Similarly, the conductance signature obtained after each loading conditions were presented in different colors as described in the legends. The enlarged image depicting the relative variation of the conductance signal in different loading states is included in all the conductance spectra figures. The range 304–306 kHz in Figure 11 is marked for highlighting the prominent local resonant peak in the conductance signature obtained from PZT1. Subsequently, due to the application of different static loading conditions on the bridge deck, the conductance is observed to peak in the same frequency range. However, it is observed that the peak amplitude of the conductance spectrum varies for each loading conditions, which can be used for qualitative analysis and the formulation of quantitative statistical variation indicators like RMSD and wavelet-based indicators. A similar peak conductance amplitude variation due to loading conditions are observed for PZT2 and PZT3, and the concerned frequency range is highlighted in Figures 12 and 13. However, due to placement of PZT sensors at different structural elements, the frequency related to local conductance peaks are varying. The zoomed version of the conductance peaks in the range of 304–306 kHz, 230–233 kHz, and 336–338 kHz is shown in Figures 11, 12, and 13, respectively.
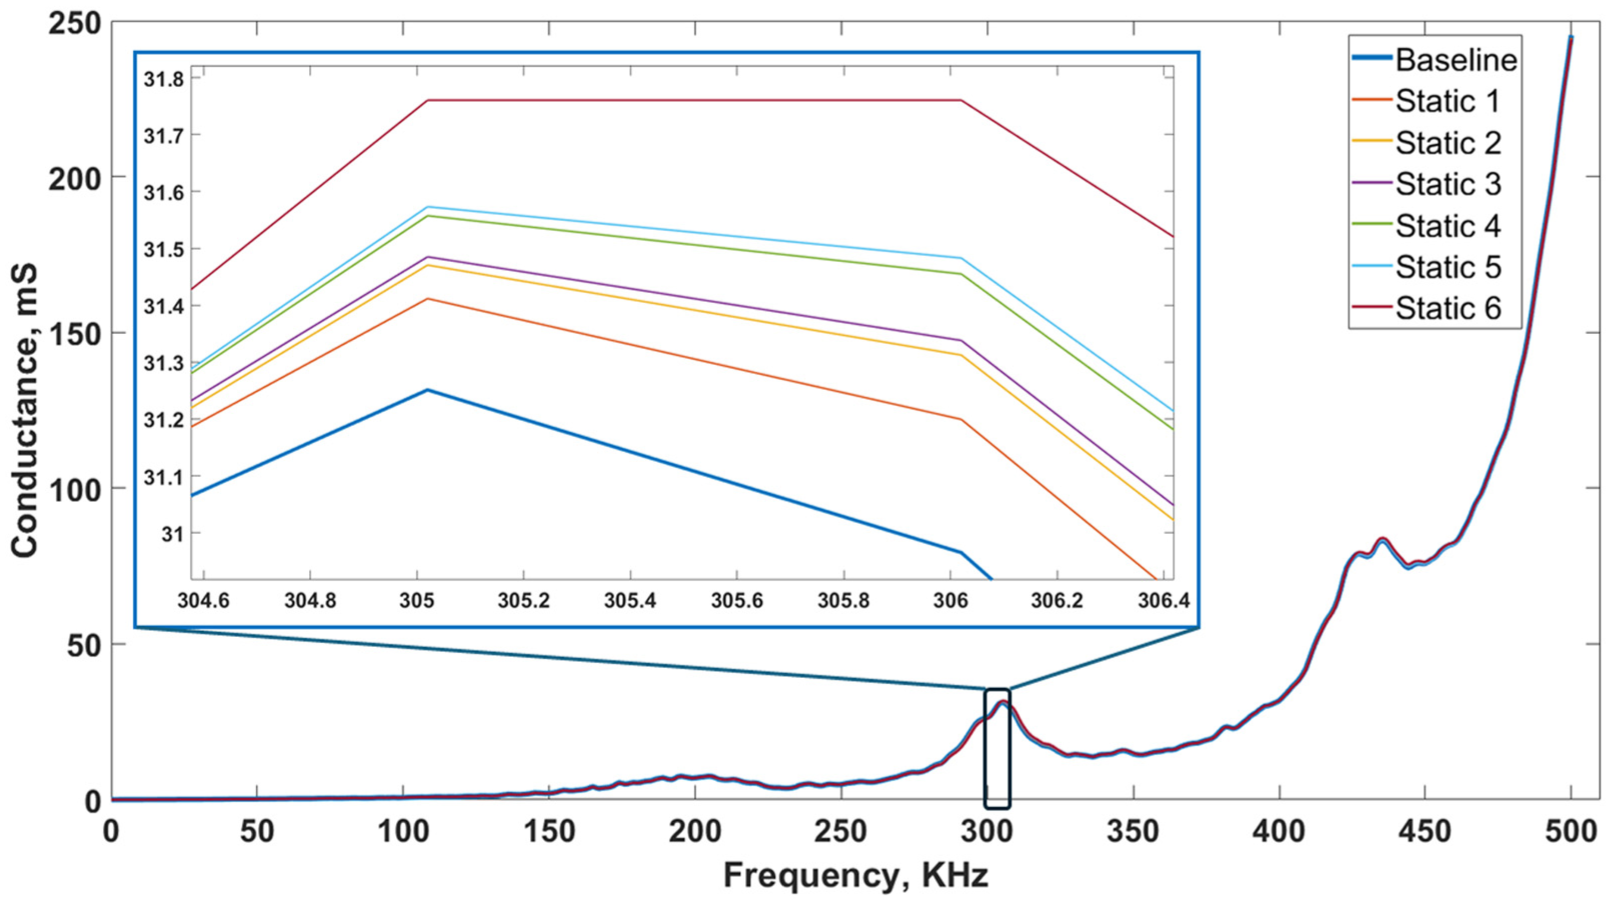
EMI spectrum for PZT1. PZT: lead zirconate titanate; EMI: electromechanical impedance.
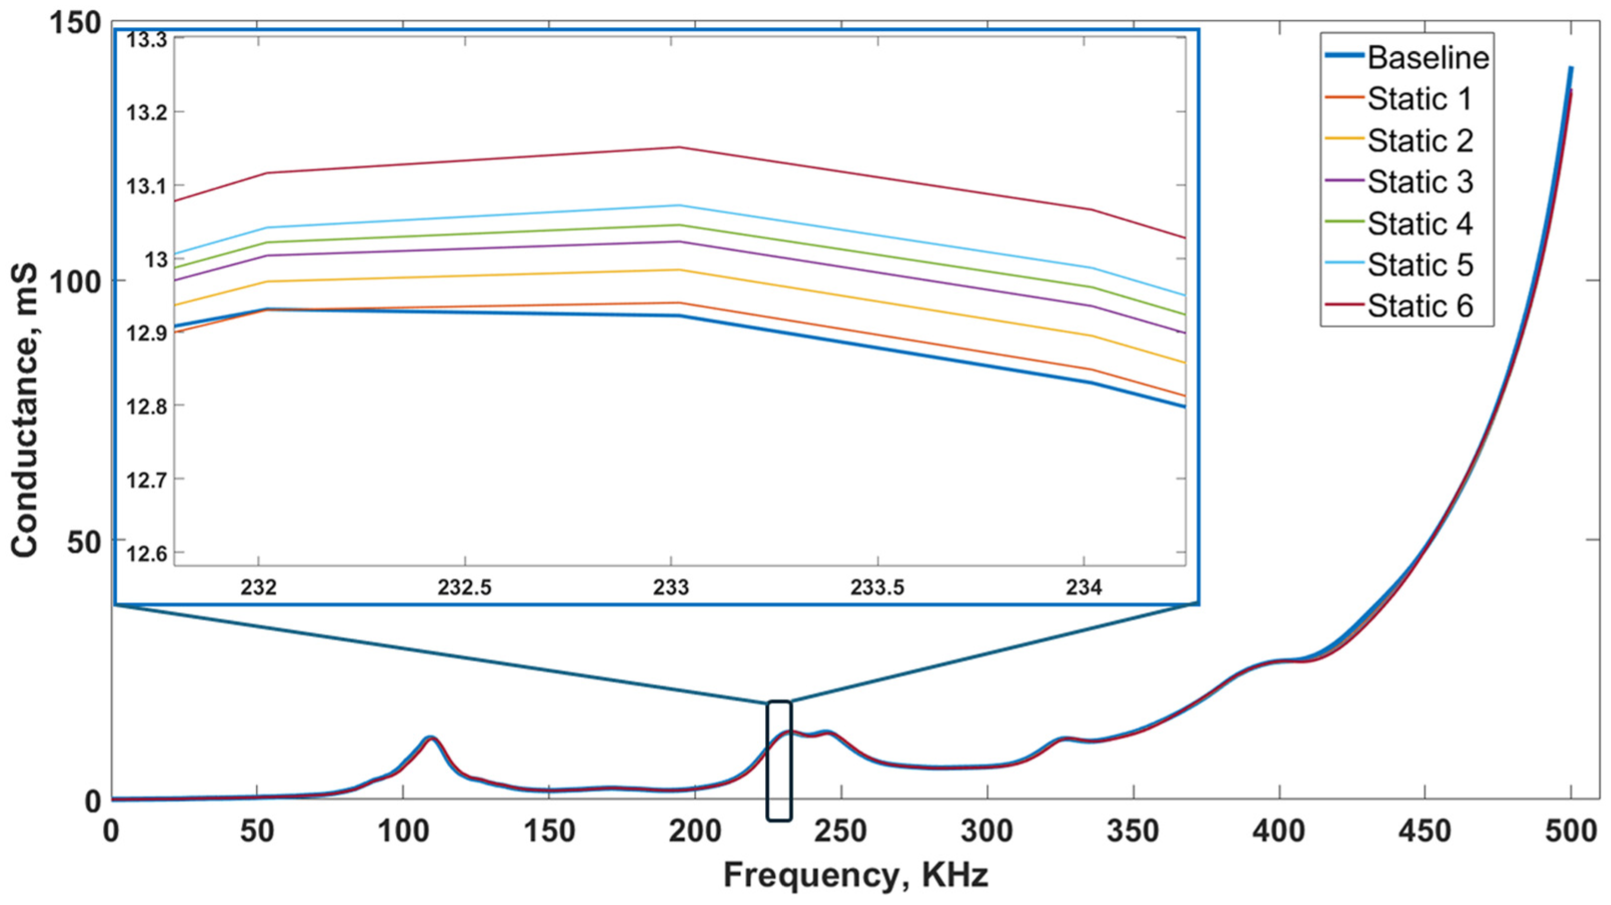
EMI spectrum for PZT2. PZT: lead zirconate titanate; EMI: electromechanical impedance.
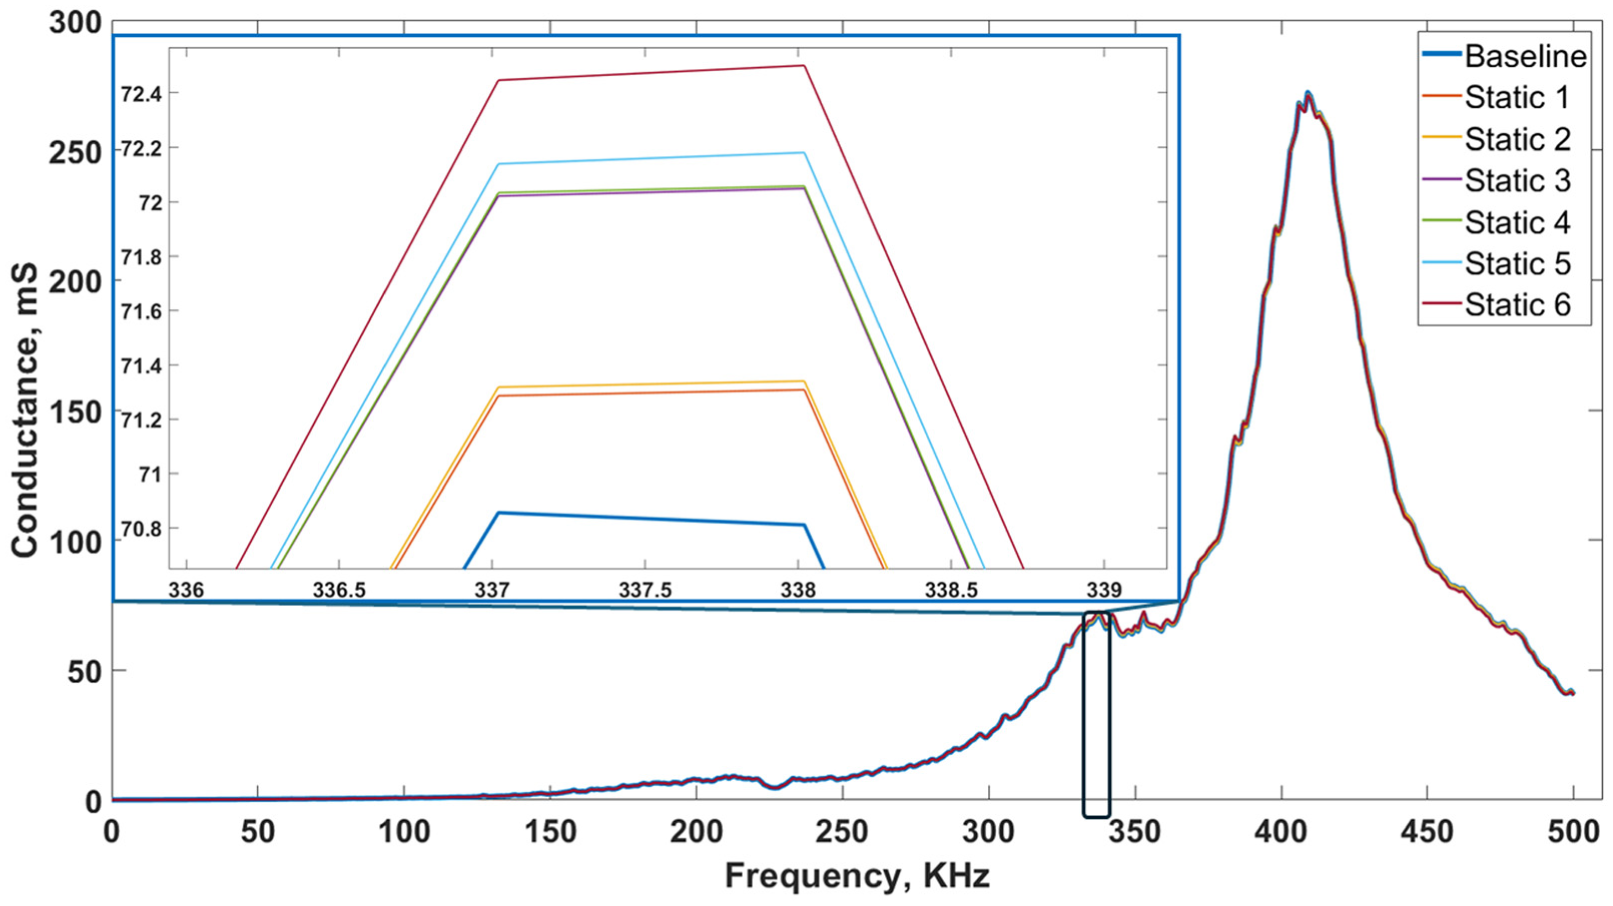
EMI spectrum for PZT3. PZT: lead zirconate titanate; EMI: electromechanical impedance.
The RMSD variation for the EMI spectrum obtained from PZT sensors is presented in Figure 14. It has been observed that, as the static load value increases, the RMSD values show a clear monotonically increasing trend from 0.0096 to 0.0324, 0.0192 to 0.031, and 0.0038 to 0.0128 for PZT1, PZT2, and PZT3, respectively. The increase in RMSD is due to the effect of incremental static loading conditions, which causes progressive deformations as visible in LVDT results. Similarly, for wavelet mean and entropy, a normalized bar chart is presented in Figure 15. Figure 15(a) illustrates the wavelet-based mean variations of three different PZTs with varying loading conditions. The mean parameters follow an increasing trend with the progression of different loadings. Similarly, Figure 15(b) depicts the variations of entropy parameters for different loading conditions. The wavelet entropy is observed to follow an increasing trend and is able to characterize different load levels. The significant changes in entropy provide a better response than the mean, with a steady growth of values. These variation parameters found to have a monotonically increasing behavior as the load on the structure.
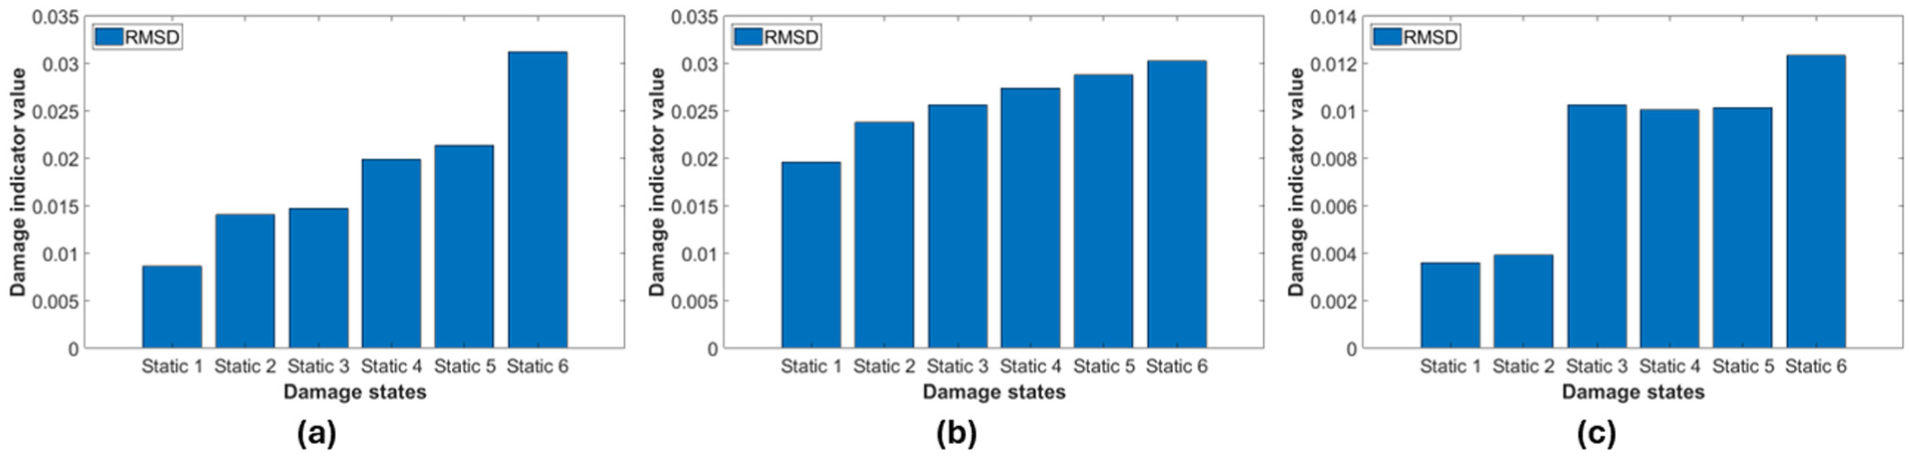
RMSD variation for (a) PZT1, (b) PZT2, and (c) PZT3. RMSD: root mean square deviation; PZT: lead zirconate titanate.
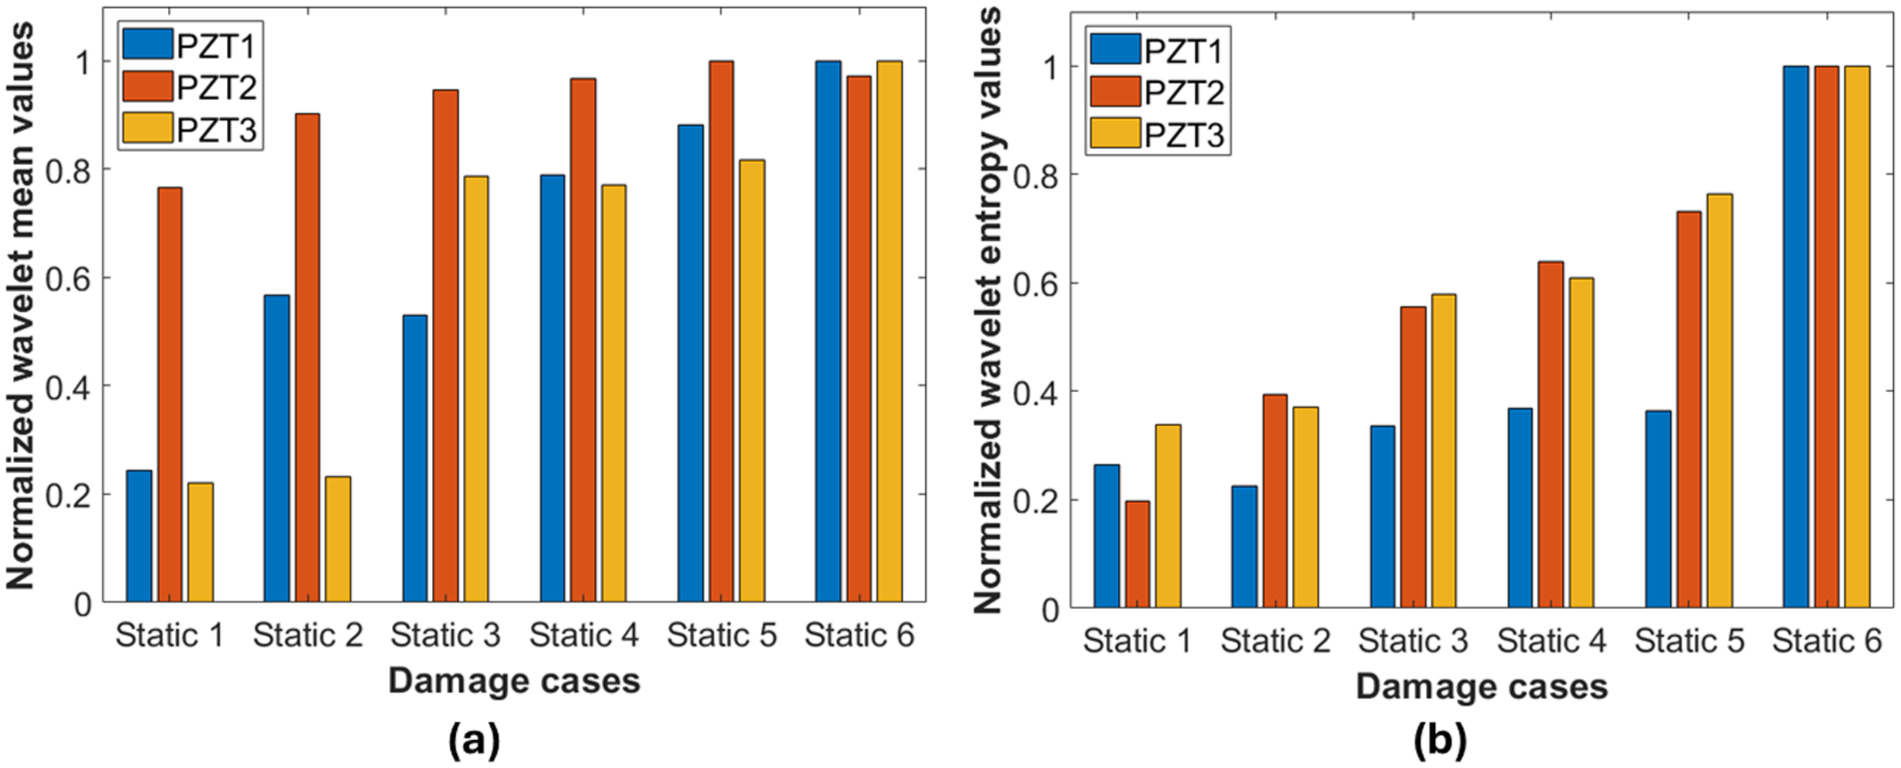
Wavelet-based damage index variation for (a) wavelet mean and (b) wavelet entropy for PZT1, PZT2, and PZT3. PZT: lead zirconate titanate.
Multi-sensor fusion framework
Previous data fusion investigation on monitoring damages using PZT-EMI methods by integrating different conventional damage indices.67,68 However, the present approaches rarely enforce correlation and monotonicity between local and global variation indicators. Moreover, in FRP-retrofitted structures, the damage starts from FRP debonding and anchorage failure at the local level. However, these local-level damages may not get detected in global-level sensing. Hence, in this study, a correlation investigation is conducted between local monitoring techniques, such as EMI, and other relevant global monitoring methods.
In the previous investigations, it has been observed that the variational indices obtained from the sensors follow an increasing trend with increasing loading severity. When different sensors are placed near each other, they will exhibit similar variation and can be correlated with each other for comprehensive health monitoring. In the event of a malfunction in one sensor, the readings from another working sensor can be used to predict missing data, which is crucial for continuous monitoring of the bridge’s health. In this analysis, various sensors, including PZT, strain gauge, LVDT, and crack gauge, are utilized. For developing a comprehensive and robust baseline database, sensor fusion of the nearby placed sensors is essential. However, the sensor data of different sensors is dependent on various physical phenomena and interactions with the structure, and may not always follow a linear variation. In this analysis, the information from adjacent sensor readings is employed to create a correlation model, which can be used to fill in missing information and also to predict different sensor information if only one type of sensor is functional. For the selection of linear or nonlinear (quadratic) variation, different metrics like Pearson’s
where
where

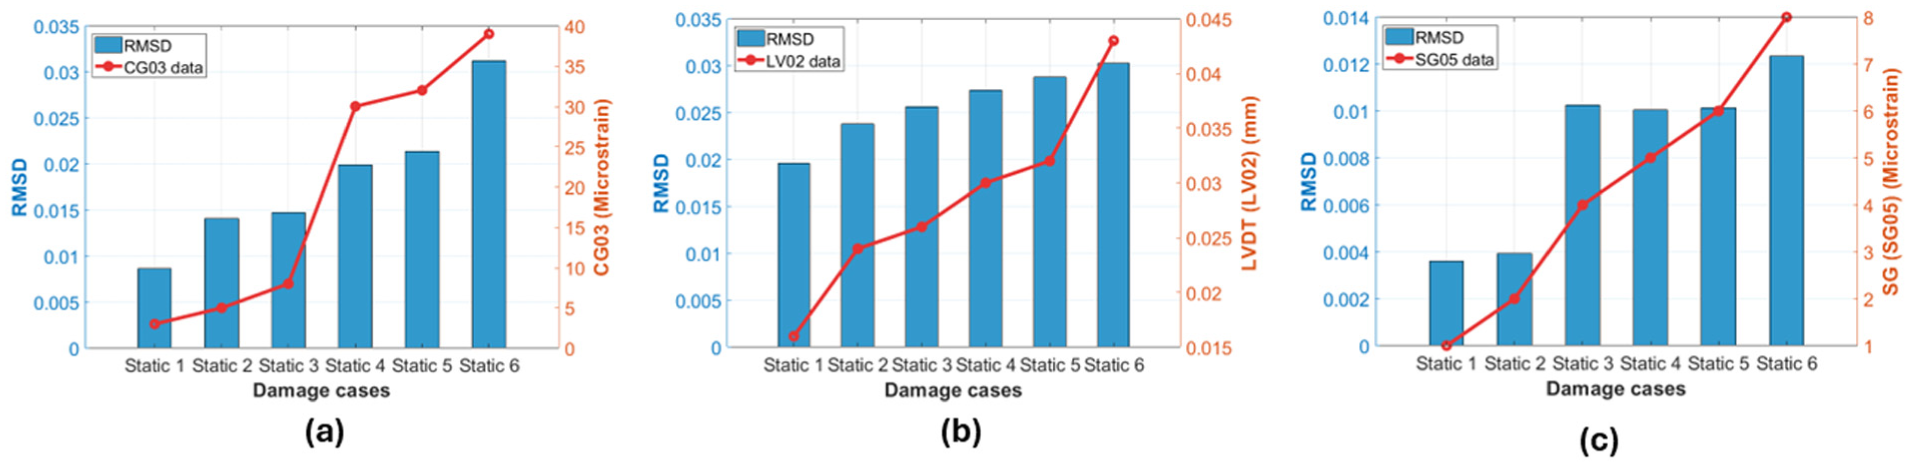
This can be done for the entire dataset, and the number of sign consistencies can be counted, and a monotonicity index can be defined as:
where if
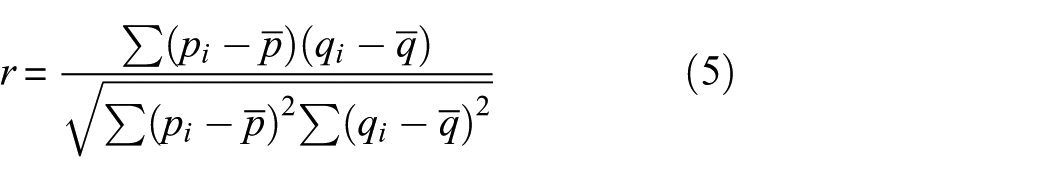
Variation of impedance-based indices, RMSD with amplitude of adjacent sensor reading, for (a) PZT1 with CG03, (b) PZT2 with LV02, and (c) PZT3 with SG05. RMSD: root mean square deviation; PZT: lead zirconate titanate.
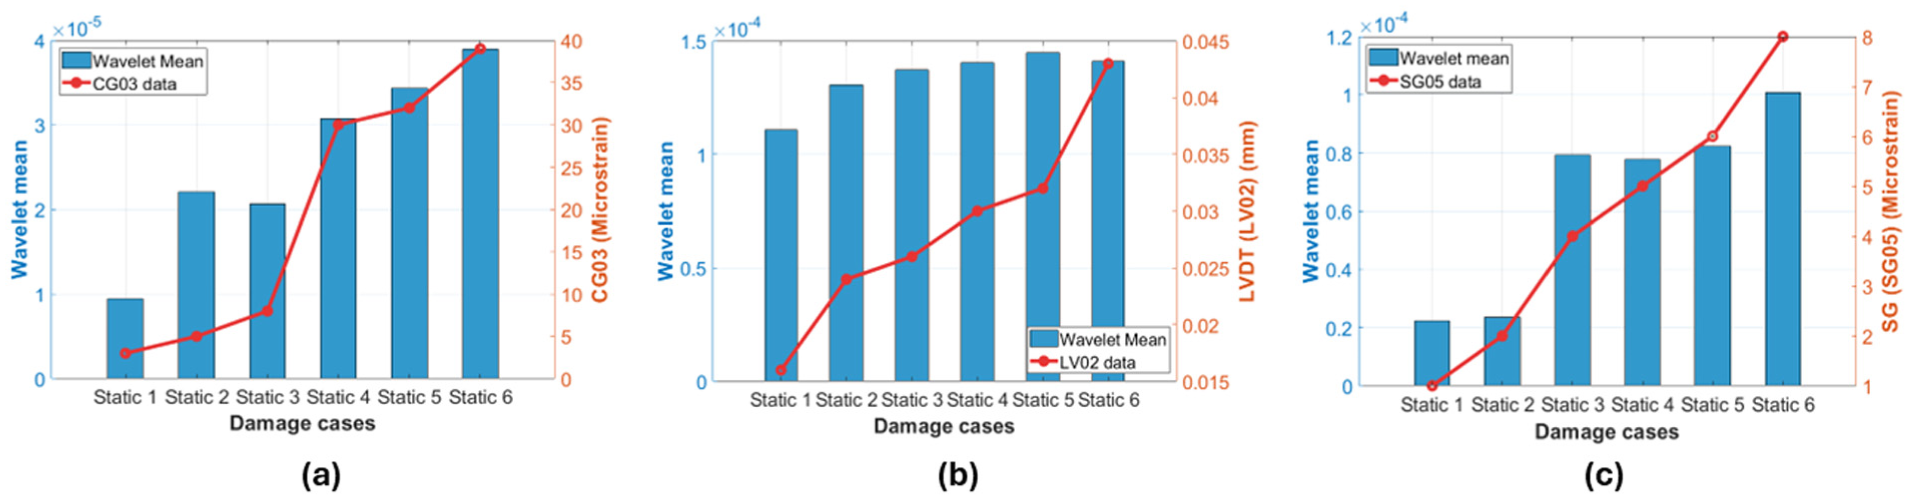
Variation of impedance-based indices, wavelet mean with amplitude of adjacent sensor reading, for (a) PZT1 with CG03, (b) PZT2 with LV02, and (c) PZT3 with SG05. PZT: lead zirconate titanate,
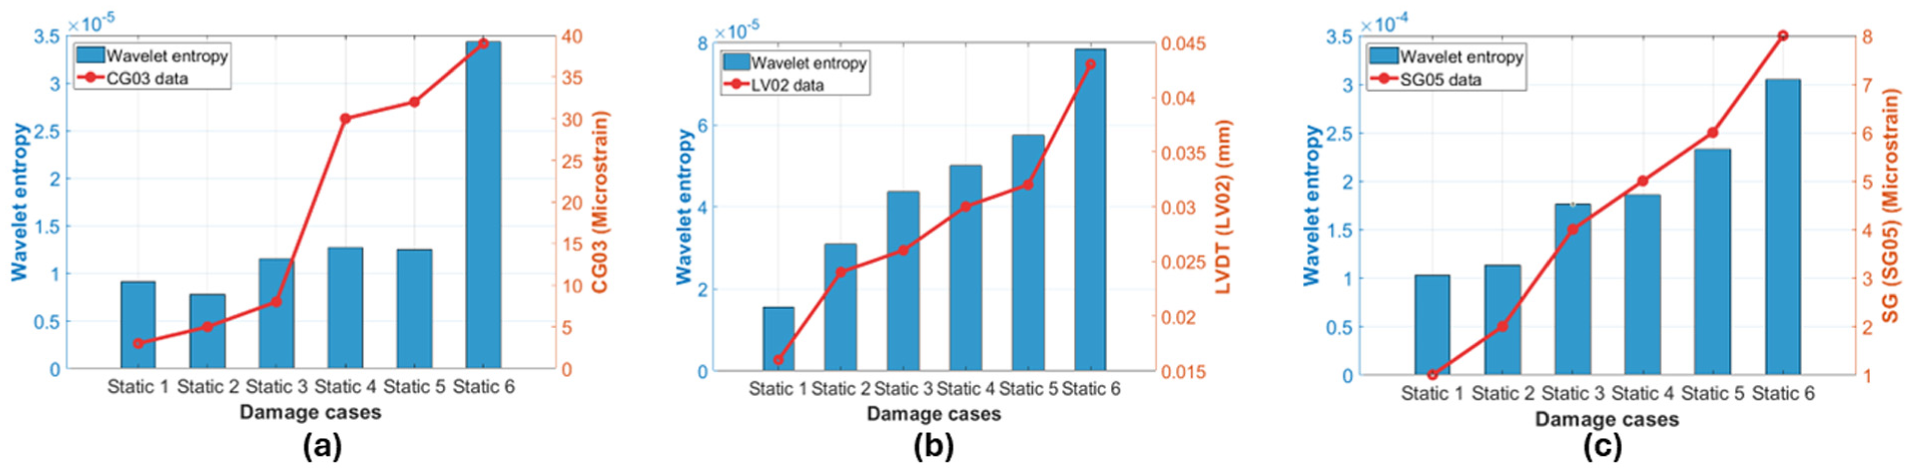
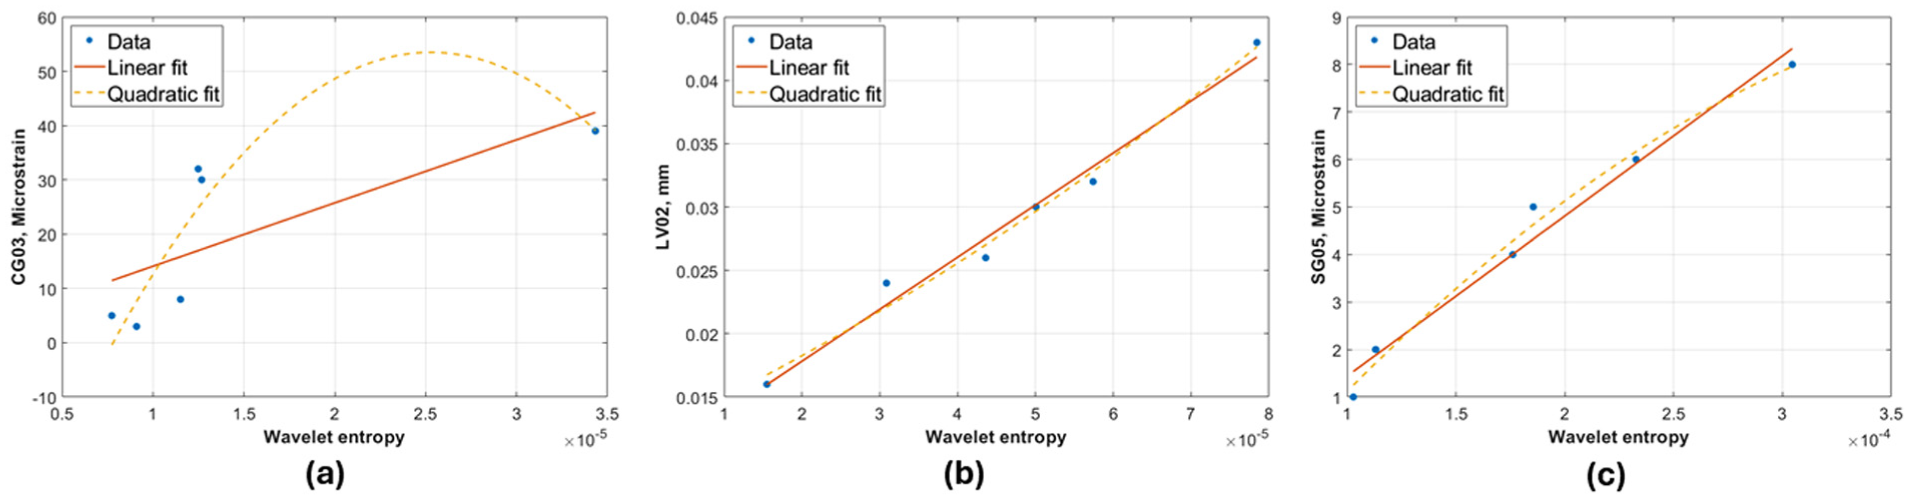
Variation of impedance-based indices, wavelet entropy with amplitude of adjacent sensor reading, for (a) PZT1 with CG03, (b) PZT2 with LV02, and (c) PZT3 with SG05. PZT: lead zirconate titanate.
At first, a curve fitting analysis is carried out using RMSD of different sensors with the adjacently placed sensor pair, like, PZT1–CG03, PZT2–LVDT, and PZT3–SG05. The curve fitting between the damage indices obtained from impedance data and nearby sensor is carried out to find appropriate correlation between them. In a sensor pair, the parameter used to formulate correlation is represented by
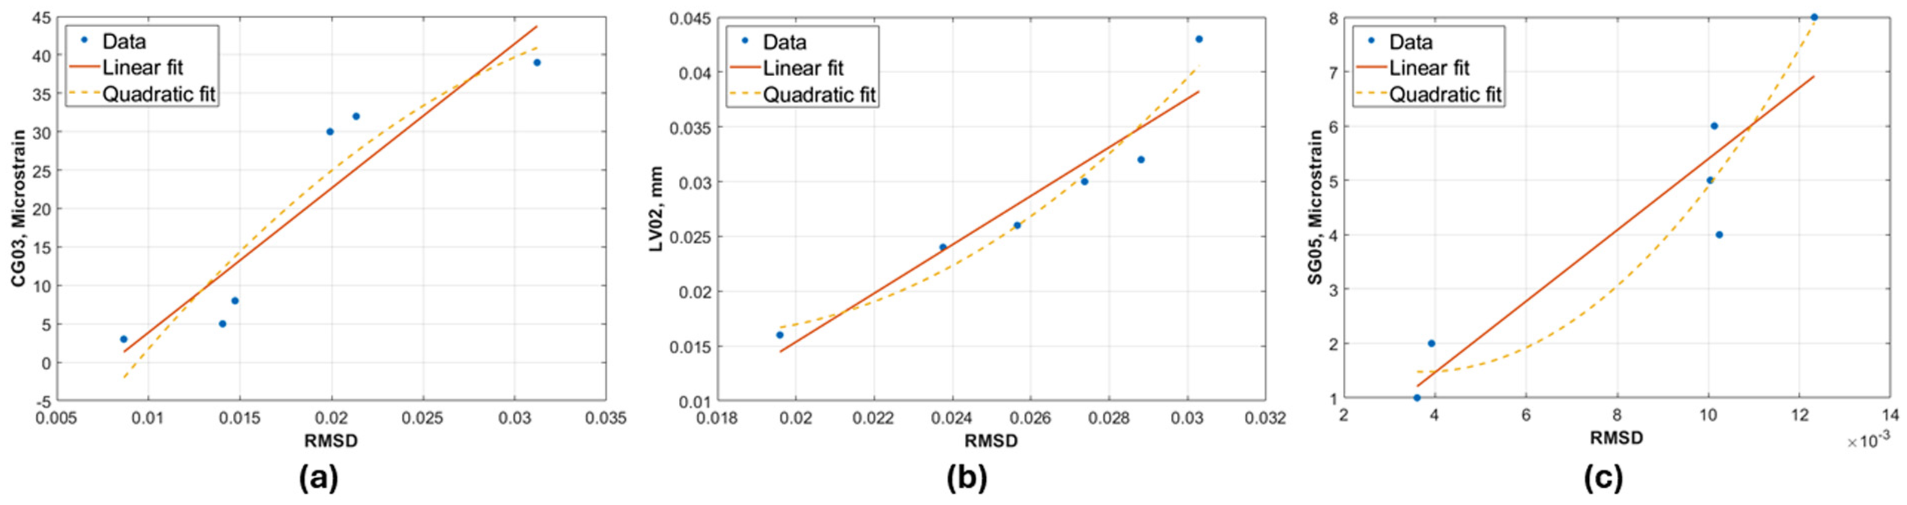
Curve fitting result for RMSD for (a) PZT1, (b) PZT2, and (c) PZT3. RMSD: root mean square deviation; PZT: lead zirconate titanate.
Curve fitting using RMSD for different sensors using RMSE and monotonicity for model selection.
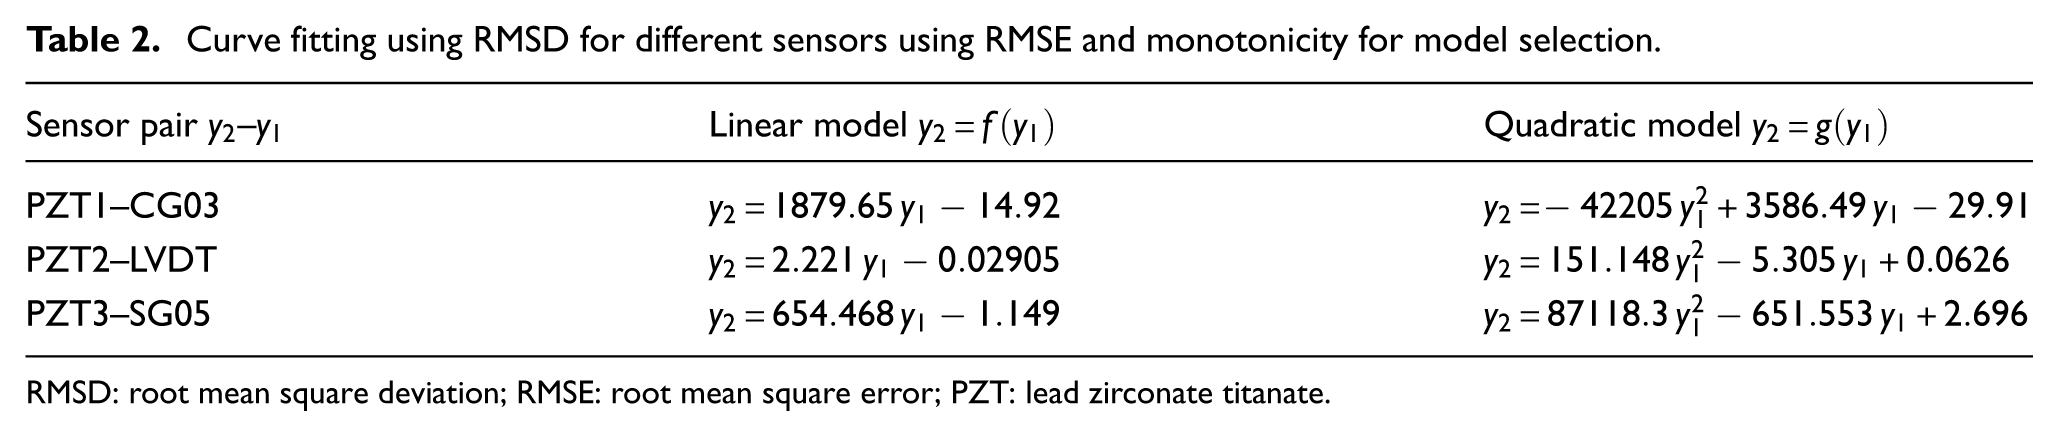
RMSD: root mean square deviation; RMSE: root mean square error; PZT: lead zirconate titanate.
Correlation and mapping summary for RMSD using RMSE and monotonicity for model selection
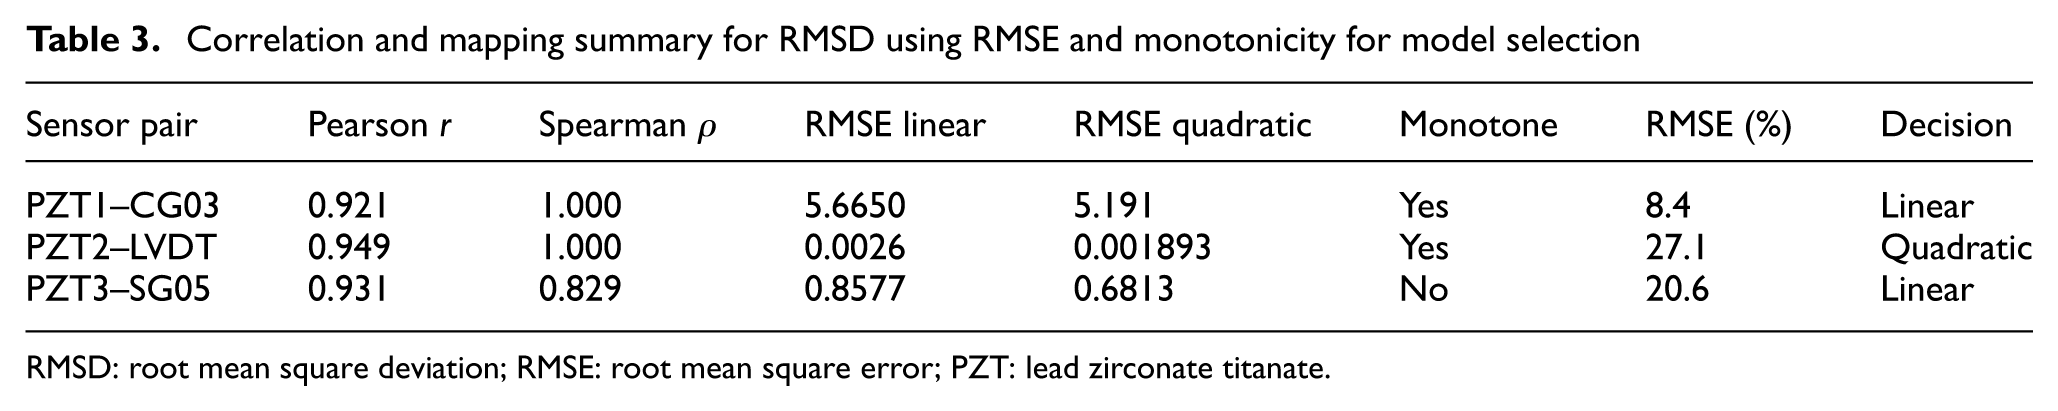
RMSD: root mean square deviation; RMSE: root mean square error; PZT: lead zirconate titanate.
Similarly, a curve fitting analysis is performed using the wavelet mean obtained from the wavelet analysis of impedance spectra from PZT1, PZT2, and PZT3, with peak amplitudes of CG03, LV02, and SG05, respectively (Figure 20). For the sensor pair, PZT1–CG03, it is observed that the RMSE improvement of nonlinear quadratic mapping over linear mapping is substantial, and the nonlinear mapping follows the monotonic relation (Tables 4 and 5). However, for the sensor pair PZT2–LVDT, the RMSE improvement is not substantial, and the nonlinear mapping does not follow a monotonically increasing pattern as the loading increases; hence, linear mapping is selected. Furthermore, for the sensor pair PZT3–SG05, the nonlinear mapping fails to satisfy the monotonicity criteria; thus, despite a large nonlinear RMSE improvement over the linear mapping, the linear mapping is selected.
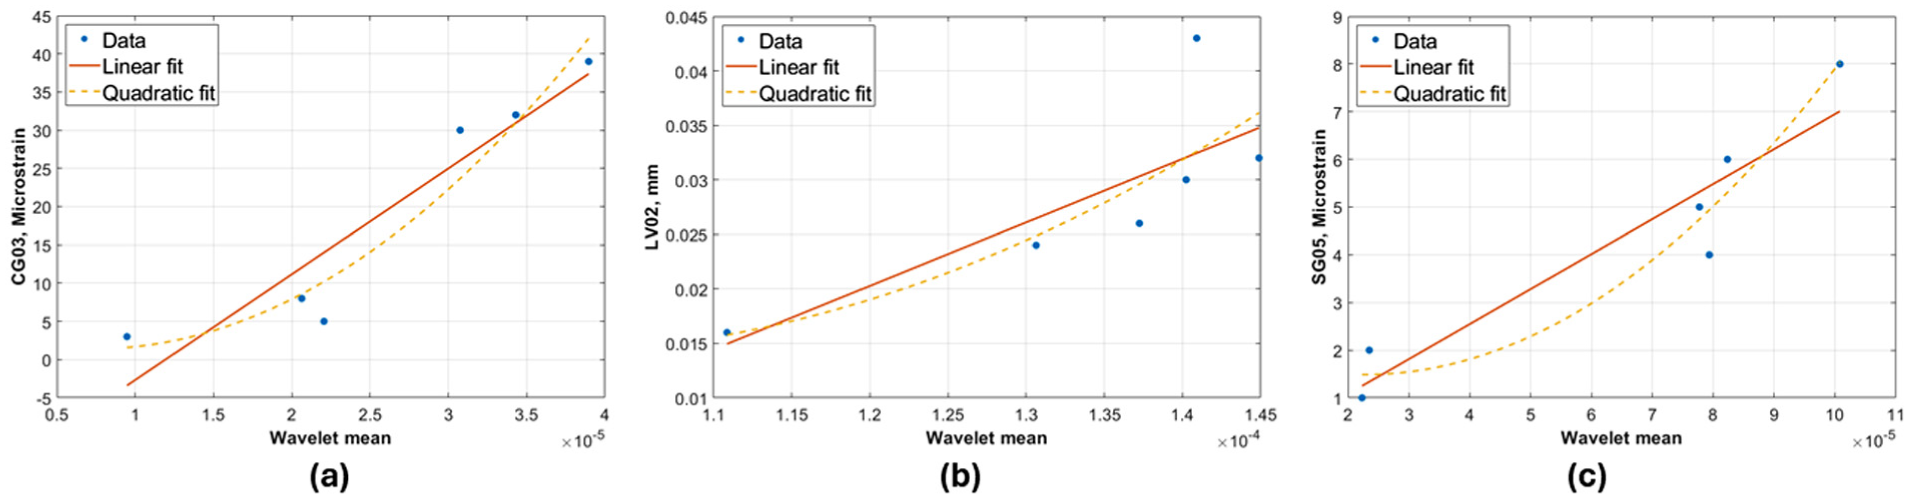
Curve fitting result for wavelet mean for (a) PZT1, (b) PZT2, and (c) PZT3.
Curve fitting using wavelet mean for different sensors using RMSE and monotonicity for model selection.
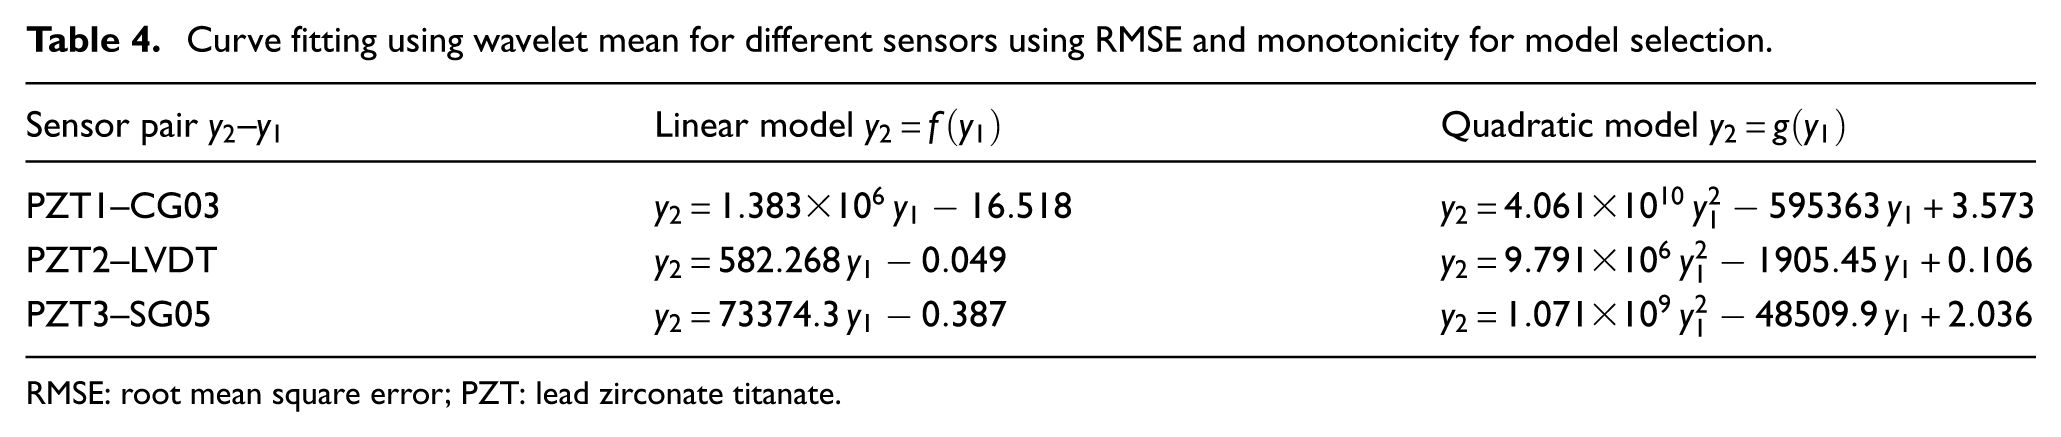
RMSE: root mean square error; PZT: lead zirconate titanate.
Correlation and mapping summary for wavelet mean using RMSE and monotonicity for model selection.
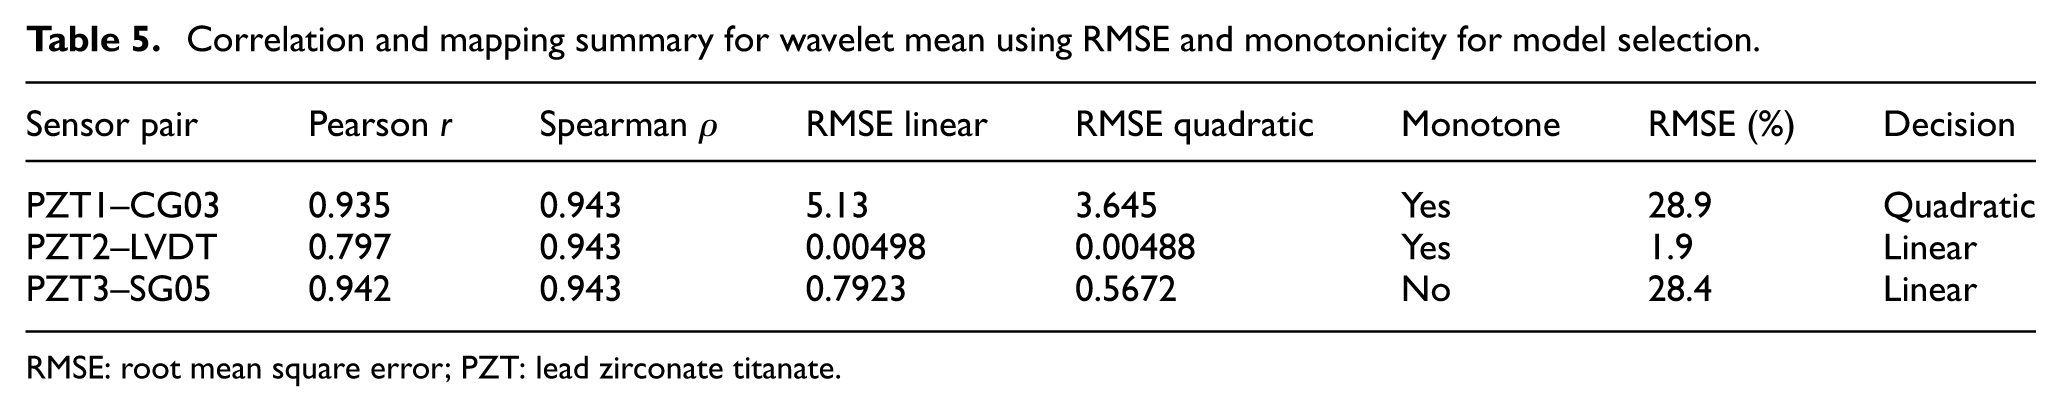
RMSE: root mean square error; PZT: lead zirconate titanate.
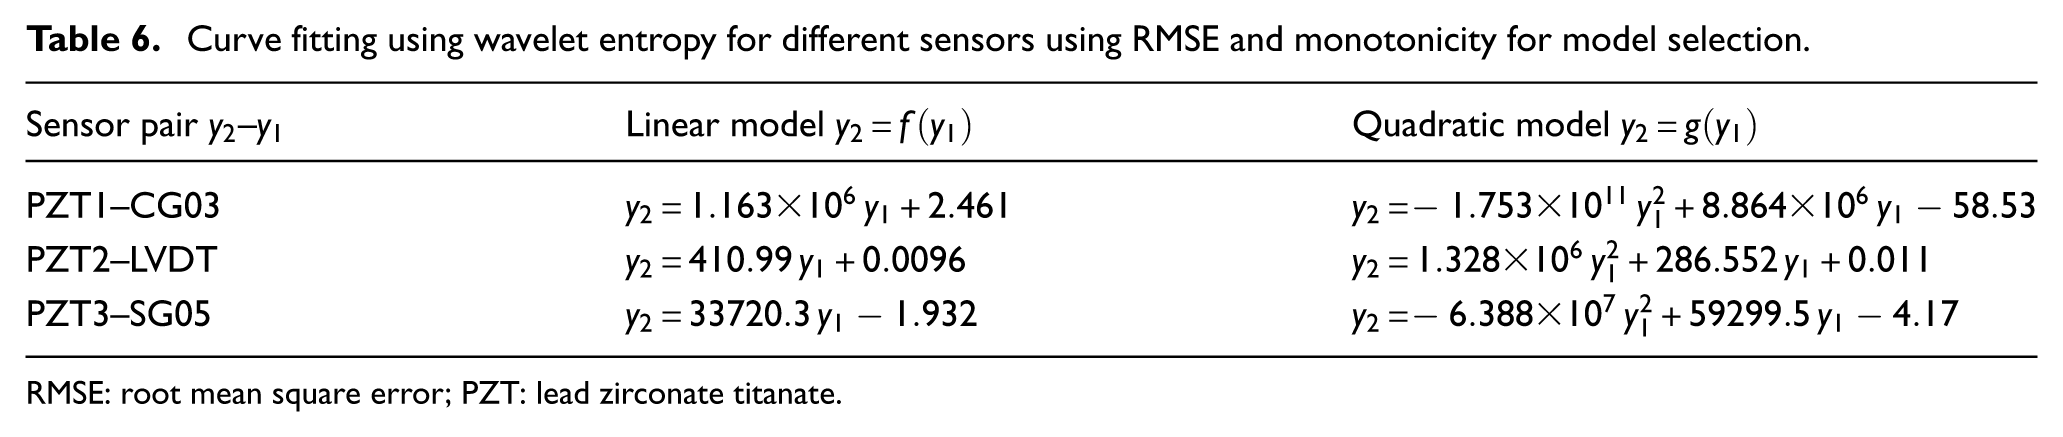
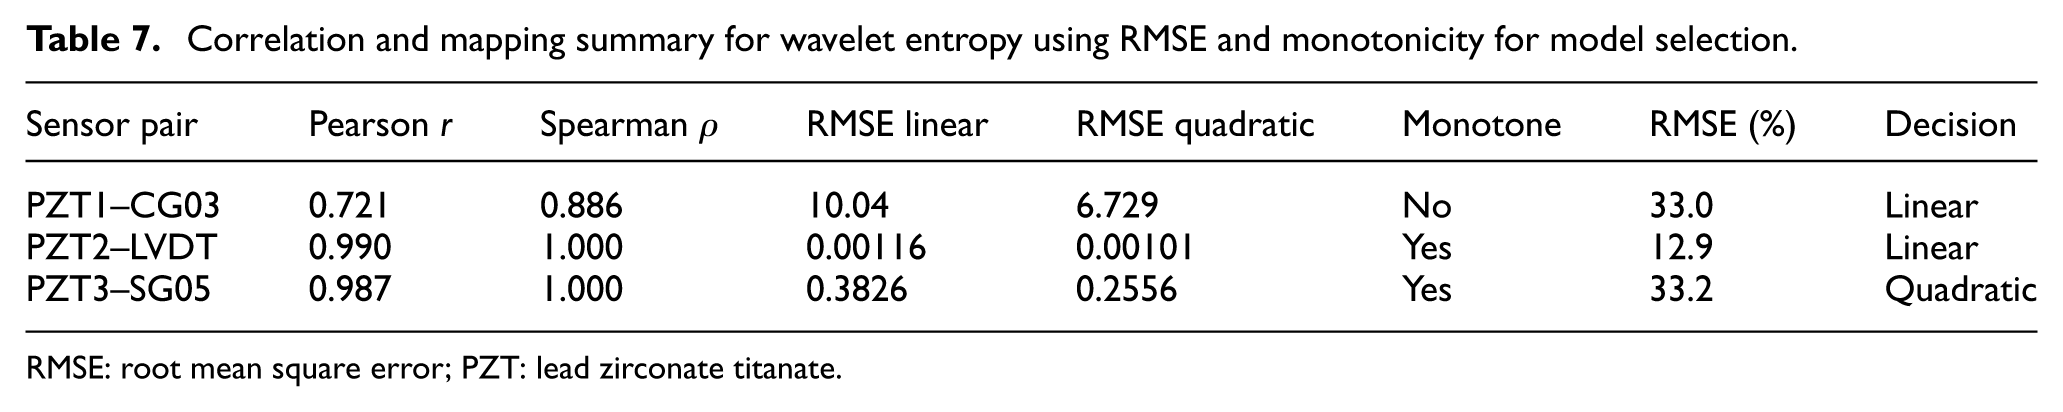
In this analysis, curve fitting is done using impedance spectra based on wavelet entropy and the peak amplitude of different sensors (Figure 21). For the sensor pair, PZT1–CG03, the nonlinear mapping exhibits substantial RMSE improvement over linear mapping; however, it fails to satisfy the monotonicity check. Hence, linear mapping is selected for this sensor pair. In contrast, the sensor pair PZT2–LVDT and PZT3–SG05 data satisfy the monotonicity check, and the selection of mapping is done based on the RMSE improvement of the nonlinear mapping over the linear (Tables 6 and 7). For the PZT2–LVDT sensor pair, the RMSE improvement of nonlinear mapping is not substantial; hence, linear mapping is selected. However, for PZT3–SG05, the nonlinear mapping exhibits substantial RMSE improvement over linear mapping; hence, nonlinear or quadratic mapping is selected.
Curve fitting result for wavelet entropy for (a) PZT1, (b) PZT2, and (c) PZT3. PZT: lead zirconate titanate.
Curve fitting using wavelet entropy for different sensors using RMSE and monotonicity for model selection.
RMSE: root mean square error; PZT: lead zirconate titanate.
Correlation and mapping summary for wavelet entropy using RMSE and monotonicity for model selection.
RMSE: root mean square error; PZT: lead zirconate titanate.
This correlation exercise for sensor-to-sensor mapping is crucial for maintaining data continuity and ensuring the reliable collection of SHM data. These mappings are essential for estimating the response of the sensor pair in cases where one of the sensor’s pieces of information is missing or lost due to a fault in data acquisition or communication failure. Additionally, these mappings between these sensors can also be used for predicting minor levels of damage. In this data acquisition stage, the reference state data has been systematically recorded. This dataset can serve as a baseline for comparison with future sensor information. In the case of small-scale damage to the structure, these mappings can be used to predict sensor information based on the presence of any one sensor from the above-given sensor pair. However, this predicted sensor value will be for the reference state. To assess the presence of damage, this prediction can then be compared by placing a similar sensor, as specified in the sensor pair information. A close resemblance between the predicted and the recorded sensor information indicates that the structure has maintained its reference state. However, in the case of a substantial deviation between predicted and actual sensor readings, it can be inferred that the structure has undergone some change from its reference state. This deviation can be used as a prediction of damage in the structure. Hence, this mapping-based comparison provides an effective tool for identifying anomalies in sensor data and serving as an indirect indicator of structural damage.
Conclusions
The present research demonstrates the feasibility of the EMI approach and multi-sensor fusion framework for assessing the structural state of an FRP-retrofitted bridge under static loading conditions. The experimental results reveal that the proposed hybrid framework provides a detailed understanding of the global and local responses of the structure under incremental static loading conditions. From the strain response, the overall deformation behavior has been effectively captured. Moreover, the EMI-based conductance signatures are able to identify a progressive loading case through variations in frequency shift and conductance amplitude. The corresponding change in RMSD values provided reliable quantitative indicators of load-induced impedance variation. The results also highlight the significance of both the techniques in capturing the local and global level changes in FRP strengthened bridge systems. Subsequently, a correlation was established between conventional test results and variations in EMI-based indices, providing a basis for future early damage quantification. The major conclusions of this research are:
The impedance-based variational index and the peak amplitude of different sensors followed an increasing pattern as the load on the bridge girder increased. These sensors are placed on different FRP reinforcing elements, indicating transfer of loading from the bridge structure to the FRP reinforcements.
The increasing trend of RMSD values from 0.0096 to 0.0324, 0.019 to 0.031, and 0.0038 to 0.0128 for PZT1, PZT2, and PZT3 respectively, depicts the changes in different conductance signatures obtained from various static loading conditions.
Furthermore, the wavelet-based mean and entropy index are used to capture the overall static loading conditions of the FRP-retrofitted bridge. The variations of mean and entropy for all the PZT sensors show good agreement in detecting progressive load scenarios.
From the results of the conventional sensors, it is evident that the overall load test results show only minor increases in deflection, strain, and tilt, demonstrating the high stiffness provided by the holistic strengthening system. The maximum mid-span deflection of 0.23 mm under static load case 6 remains significantly below the permissible limit of L/800. Furthermore, the gradual rise in strain in the steel mechanical anchorages indicates their active contribution to load transfer.
It is also observed that the correlation between sensing methods is majorly linear, which can be used for sensor data prediction and comparative analysis for future health assessment of the FRP-retrofitted bridge structures.
The study provides the potential of this multifusion framework for short-term and long-term health assessment of FRP-retrofitted bridge structures. In the future, the research may be extended through wireless sensor networks and data-driven-based decision frameworks to enhance reliability and predictive accuracy for autonomous large-scale infrastructure monitoring. A network of multiple PZTs for future field application can be employed along with proposed data-fusion methodology to formulate a more comprehensive SHM framework.
Footnotes
Acknowledgements
The authors thank the Sanrachana Structural Strengthening Group of Companies for providing manpower and equipment support. The authors also thank the SHM and Retrofitting Lab, IITB, for providing the equipment support for mechanical testing.
Author contributions
Nikhil Holsamudrkar: Conceptualization, Experimentation, Analysis, Writing—original draft, Editing. Lukesh Parida: Conceptualization, Experimentation, Analysis, Writing—original draft, Editing. Mayank Kamal: Experimentation, Analysis, Writing—original draft, Editing. Mangesh Joshi: Conceptualization, Supervision, funding, review, editing. Sauvik Banerjee: Supervision, review and editing.
Funding
The authors received no financial support for the research, authorship, and/or publication of this article.
Declaration of conflicting interests
The authors declared no potential conflicts of interest with respect to the research, authorship, and/or publication of this article.