
Abstract
Structural health monitoring (SHM) assessment reports are crucial for bridge maintenance and management, but their generation still relies on manual analysis, with full automation not yet achieved. This study introduces an AI-agent-enabled, automated, and intelligent framework for SHM analysis and report generation. A Python-based system was developed to process heterogeneous monitoring data with minimal human intervention, while a domain-specific multimodal large language model (MLLM), fine-tuned through low-rank adaptation, serves as the reasoning component of the AI agent to address the challenge of interpreting unstructured information. Following necessary data standardization and configuration, the framework enables automated analysis, graphical interpretation, and multilevel textual summary generation, thereby bridging the gap between raw monitoring data and engineering decision support. A representative case study on the Mingzhou Bridge was used to verify the engineering feasibility and reporting capability of the proposed framework, while further applications to 10 in-service bridges (5466 GB in total) were conducted to demonstrate its computational efficiency, scalability, and adaptability across heterogeneous SHM systems. Across these applications, the fine-tuned MLLM processed approximately 2500 figures in a total of 308 min and generated approximately 837,000 words on typical personal computer (PC) resources, demonstrating its potential as a scalable and adaptable framework for automated SHM analysis, interpretation, and report generation.
Keywords
Introduction
As transportation infrastructure continues to expand and the service life of bridges is prolonged, the combined effects of traffic loads, environmental actions, and material aging have become increasingly pronounced. These factors inevitably accelerate structural performance degradation and elevate the risk of damage. 1 To address these challenges, an increasing number of bridges are being instrumented with structural health monitoring (SHM) systems, which employ distributed sensor networks to enable continuous and quantitative assessment of critical structural components. 2 Data acquired through SHM systems provide the foundation for a wide range of applications, including damage detection,3–5 system parameter identification,6,7 remaining service life estimation, 8 load identification, 9 and vibration control. 10 Such information is essential for ensuring the safety, reliability, and effective lifecycle management of bridge structures. 11
When conducting structural assessment and maintenance decision-making based on SHM data, a comprehensive and systematic data analysis workflow is typically required. This process generally includes data quality evaluation,12,13 performance indicator calculation, 14 degradation trend identification, 15 and structural condition determination. 16 The outcomes of these analyses are compiled by engineers into SHM assessment reports. As the primary output of SHM systems, such reports serve as quantitative references for bridge maintenance authorities and offer technical support for formulating maintenance strategies and resource allocation.
Despite the proliferation of SHM systems, a critical gap persists between vast data acquisition and actionable structural assessment. Current systems typically lack sophisticated analytical capabilities, forcing practitioners into a manual, expert-driven workflow of data interpretation and report generation.17,18 This translation from quantitative data or graphics to qualitative insight represents the primary bottleneck in achieving full automation. The root cause lies in the limitations of conventional algorithms, including traditional deep learning. While these methods excel at perceptual tasks (e.g., feature extraction, image recognition),19–22 they fundamentally lack the abstract reasoning capabilities required to understand semantic relationships within data or synthesize cross-modal information. This cognitive gap makes the manual process not only time-consuming and difficult to standardize but also the main obstacle in leveraging SHM data at scale.
The emergence of multimodal large language models (MLLMs) offers a transformative solution. MLLMs possess inherent cross-modal understanding and logical reasoning capabilities, enabling them to interpret the semantic content of unstructured data such as charts and graphs, and, with appropriate guidance, generate professional, context-aware summaries that align with engineering logic. 23 To harness this potential, this study proposes an automated framework that addresses the aforementioned cognitive bottleneck. It integrates two core components: a generalizable data analysis pipeline compliant with industry codes, 24 and the intelligent interpretation capabilities of a domain-adapted MLLM. The framework is engineered to provide a highly automated analysis and reporting solution following the necessary initialization. Its modular and scalable architecture guarantees adaptability across diverse bridge types and SHM configurations, delivering an efficient, standardized, and practical tool for intelligent, network-level infrastructure management.
Research scope
In response to the current state of practice, this study aims to address the following critical questions:
Can the entire report generation workflow, from monitoring data analysis and metric computation to the generation of assessment reports, be automated to minimize human intervention and improve efficiency in bridge management?
Can unstructured outputs, such as charts and figures, be intelligently interpreted and summarized through advanced information technologies to support the intelligent transformation of bridge condition assessment and life-cycle maintenance?
The root cause of these issues lies in the traditional evaluation process, which faces several limitations. On the one hand, SHM assessment report generation involves extensive data processing and highly repetitive workflows. Although analytical algorithms are available, the diversity of SHM systems and bridge structures still requires substantial human intervention. On the other hand, structural condition assessments often rely on expert judgment to interpret unstructured information like charts, while the large volume and diversity of monitoring data further increase the variety and abundance of such unstructured information, leading to inefficiencies and a significant consumption of human resources.
Based on these challenges, the objectives of this study are as follows:
To develop a generalizable automated framework for generating SHM assessment reports. The framework is designed to achieve an automated workflow, covering the entire process from raw data processing to final report generation, thereby enhancing the efficiency, reliability, and consistency of routine infrastructure evaluations.
To implement intelligent interpretation of unstructured analysis results, such as charts and textual data, within SHM. This capability is expected to advance the analytical capacity of SHM systems and strengthen their role in providing effective decision support for bridge maintenance and life-cycle management.
Literature review
To comprehensively understand the current state of research and identify opportunities for innovation, this study reviews relevant literature from two key perspectives: the data analysis methods used in SHM, and the emerging applications of large language models (LLMs) in civil engineering.
Data analysis methods in SHM
Data analysis methods in SHM can generally be categorized into two main types: traditional analytical methods and deep learning methods.
Traditional methods are grounded in classical statistical theory, signal processing techniques, and system identification algorithms. They can be broadly grouped into five categories: statistical analysis, time-domain analysis, frequency-domain analysis, time–frequency analysis, and system identification. Statistical analysis methods extract features such as root mean square (RMS), 25 standard deviation, 26 skewness, and kurtosis 27 for anomaly detection, offering high computational efficiency and suitability for large-scale sensor networks. Time-domain methods employ modeling techniques such as regression , autoregressive models, 28 and Kalman filtering 29 to capture the evolution of structural responses. Frequency-domain approaches leverage techniques like Fourier transform, 30 power spectral density, and frequency response functions 31 to extract modal characteristics, making them ideal for analyzing steady-state and periodic responses. For nonstationary signals, time–frequency methods, including short-time Fourier transform (STFT), 32 wavelet transform, 33 Hilbert–Huang Transform, 34 and S-transform, 35 enable joint time–frequency representation. System identification methods, based on state-space modeling, are employed to extract key physical parameters such as natural frequencies, damping ratios, and mode shapes. Representative techniques include frequency domain decomposition 36 and stochastic subspace identification (SSI). 37 While these traditional analytical methods offer strong interpretability and engineering applicability, they are limited in modeling capacity when dealing with high-dimensional, multisource, or nonlinear data, and often rely heavily on manual feature engineering.
With the rapid increase in the volume and complexity of monitoring data, deep learning methods have seen growing adoption in SHM due to their powerful nonlinear modeling capabilities and ability to automatically extract features. Depending on the modeling objective, deep learning approaches can be classified into discriminative and generative models. 1 Discriminative models focus on learning the mapping between inputs and outputs, and are commonly used in classification, regression, and forecasting tasks. Typical architectures include convolutional neural networks (CNNs), recurrent neural networks (RNNs), long short-term memory (LSTM), networks, gated recurrent units (GRUs), and transformers. These models can efficiently capture spatial and temporal features in monitoring data and have been widely applied to status recognition, 38 trend prediction, 39 and anomaly detection. 12 In contrast, generative models aim to learn the underlying data distribution and are used for tasks such as data augmentation, 40 missing data imputation, 41 and unsupervised anomaly detection. 42 Common generative approaches include autoencoders (AEs), variational autoencoders (VAEs), and generative adversarial networks (GANs), which are particularly useful in scenarios with limited labeled data or rare anomaly samples.
Despite these advancements, most existing research treats these methods in isolation, focusing primarily on data analysis itself, with limited attention to unified integration and standardized processing workflows across different monitoring modalities. This gap underscores a pressing need for generalized and automated integrated frameworks.
Large language models
In recent years, LLMs have achieved breakthrough progress in the fields of natural language processing and artificial intelligence. Representative models such as generative pre-trained transformer 4 (GPT-4), 43 DeepSeek, 44 and Llama 45 demonstrate outstanding capabilities in language understanding and generation. Built upon the Transformer architecture 46 and its core self-attention mechanism, these models can learn complex syntactic structures, semantic relationships, and contextual logic from massive corpora, exhibiting excellent performance in tasks such as text generation, sentiment analysis, question answering, and machine translation. 47 With the rapid rise of multimodal learning, MLLMs like Gemini, 48 Qwen2.5-VL, 49 and GPT-4V 50 have emerged. These models can process text, images, and even audio simultaneously, showing strong performance in cross-modal retrieval, image captioning, and reasoning tasks. 51 MLLMs have been widely used in specialized fields such as healthcare, law, and finance. Their adaptability and stability in specific task scenarios have been further enhanced through parameter-efficient fine-tuning (PEFT) strategies. 52
In the civil engineering domain, researchers have gradually recognized the potential of LLMs and their multimodal capabilities for processing natural language and unstructured data, actively exploring their applications in structural and management tasks. In engineering management, Uhm et al. 53 systematically evaluated the effectiveness of retrieval-augmented generation GPT (RAG-GPT) models in generating detailed and specific construction safety information. Furthermore, Lee et al. 54 compared the performance of RAG and fine-tuned LLMs for building safety knowledge retrieval; Rabbi and Jeelani 55 reviewed AI applications in construction safety management, highlighting LLMs’ significant potential in accident text processing, semantic analysis, and knowledge graph construction. In structural design, Qin et al. 56 proposed an LLM-based system for shear wall structure generation and optimization, achieving intelligent structural configuration and rapid computation with significant improvements in efficiency and quality compared to traditional design methods. Regarding structural maintenance, Wang et al. 57 employed multimodal LLMs for intelligent classification of fatigue crack images and evaluated model performance differences in crack detection tasks. Zhang et al. 58 developed a system combining rule extraction and language models for automatic disease information extraction from bridge inspection reports and construction of a structural damage database.
These studies demonstrate the broad application potential of LLMs in civil engineering. However, their application to bridge health assessment and SHM assessment report generation remains largely unexplored, with a lack of systematic research and practical engineering implementation.
Contribution
The literature review reveals a critical, threefold research gap in SHM: (1) most data analysis methods are siloed and lack integration into unified, automated frameworks; (2) the automated generation of comprehensive assessment reports remains a largely unaddressed challenge; and (3) the potential of MLLMs to bridge the gap between unstructured analytical outputs and structured reports is virtually unexplored in this domain.
To address these gaps, this study introduces a highly automated framework for SHM analysis and reporting. As shown in Figure 1, by integrating a versatile data analysis pipeline with a domain-adapted MLLM for interpreting results, this work makes the following primary contributions:
An automated analysis framework for multisource monitoring data: A generalized automation framework was developed by integrating commonly used monitoring data analysis algorithms in compliance with prevailing national codes. To further enhance its generalizability, a series of robustness strategies and automated analytical algorithms were proposed.
A hierarchical reasoning strategy with MLLM for structural assessment: A fine-tuned MLLM was integrated into the report generation process to simulate the expert analysis workflow. A hierarchical reasoning-based structure evaluation approach was proposed, enabling the fine-tuned model to interpret result-related images, charts, and textual content, thereby enhancing the level of intelligence in structural assessment.
An automated report generation approach for bridge maintenance: Considering the practical needs of SHM, a report generation workflow is proposed that is applicable to a wide range of bridge structures and monitoring systems. This workflow enables a highly automated transition from data analysis to narrative report creation, supporting standardized and consistent bridge condition evaluation workflows.
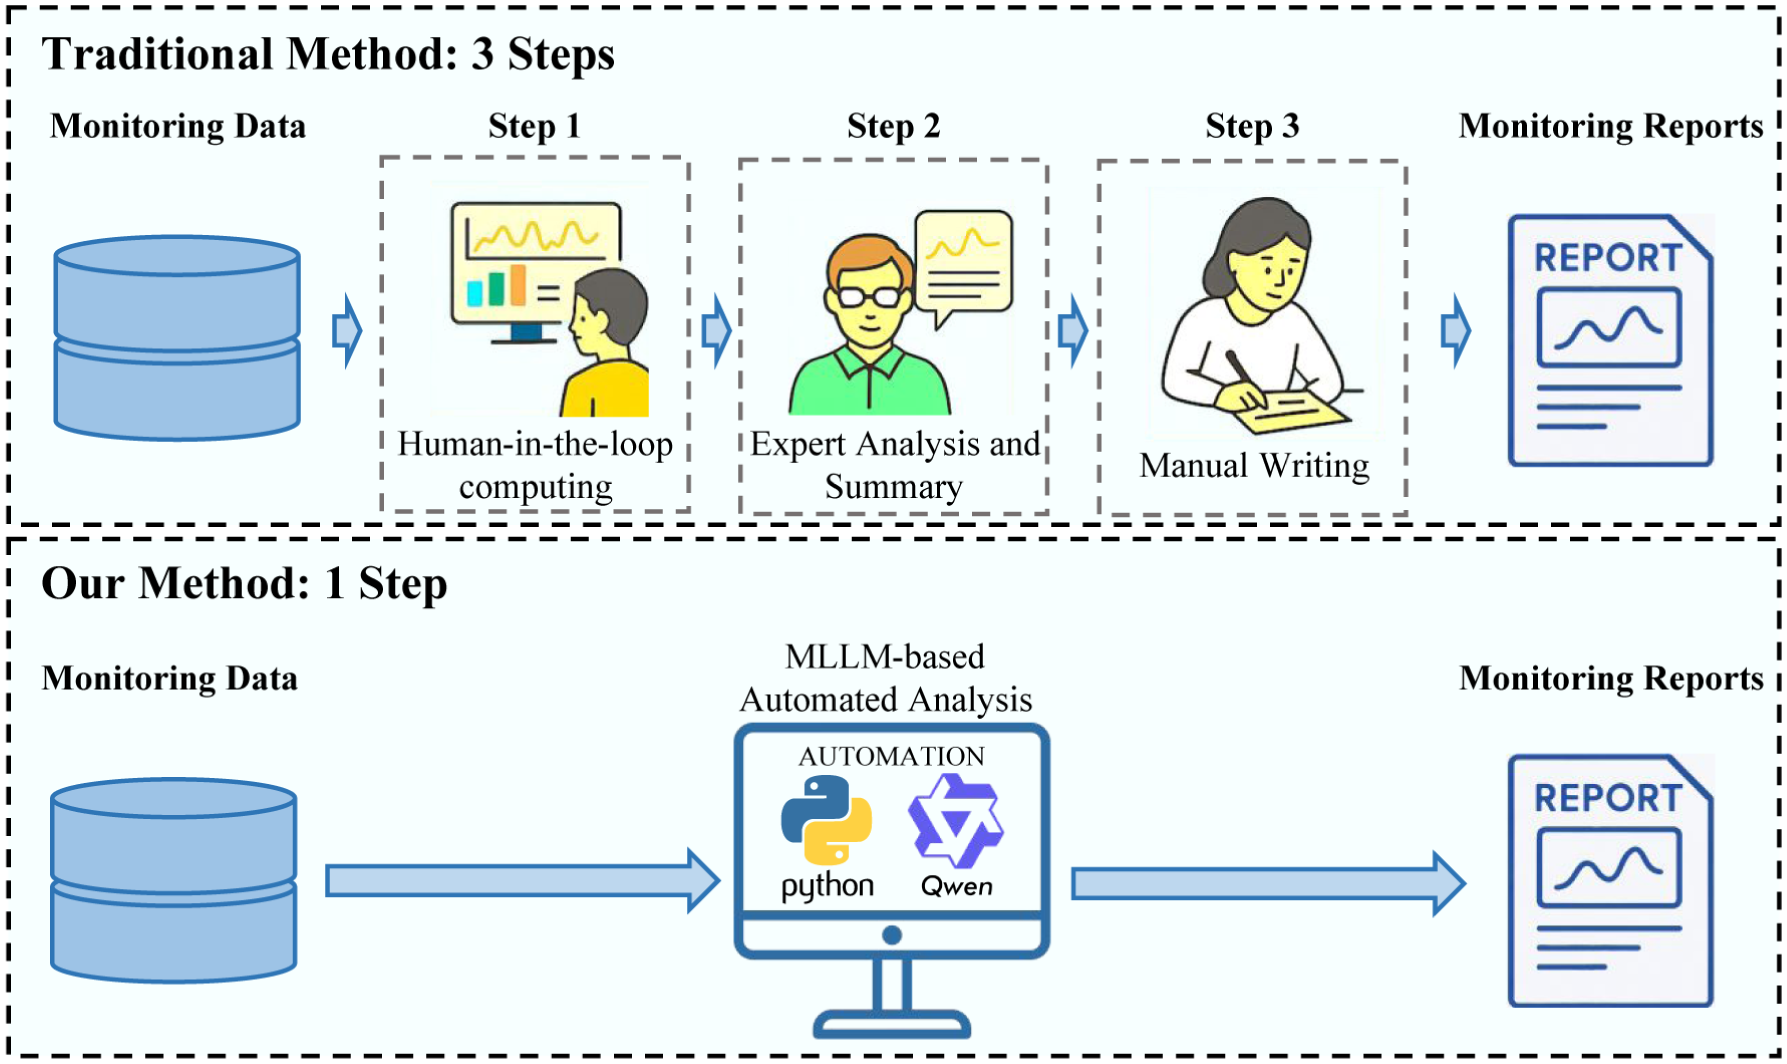
Comparison between traditional SHM assessment report generation method and MLLM-based generation method adopted in this study. SHM: structural health monitoring; MLLM: multimodal large language model.
The proposed automatic SHM assessment report generation method references the technical requirements outlined in the Chinese code JT/T 1037–2022 24 and commonly accepted industry practice. Its core innovation lies in leveraging an MLLM to establish a reasoning pipeline that emulates expert thinking for interpreting unstructured data. Designed for broad applicability, the modular and configurable architecture accommodates diverse bridge types and monitoring systems, enabling the automated, standardized, and intelligent generation of SHM assessment reports.
The remainder of this article is organized as follows: The second section presents the overall framework. The third and fourth sections detail its two main components: the automated data analysis module and the MLLM-based evaluation strategies, respectively. The fifth section validates the framework through real-world case studies, and the sixth section concludes the article.
Automated intelligent SHM analysis and reporting framework
As shown in Figure 2, the proposed framework enables a highly automated SHM analysis and reporting process, transforming raw multisource monitoring data into structured assessment reports. From an AI agent perspective, the framework coordinates automated data analysis, multimodal reasoning, and report generation within an integrated workflow. It is built on the principles of automation, standardization, and intelligence and comprises three core modules:
(1) Automated monitoring data analysis module
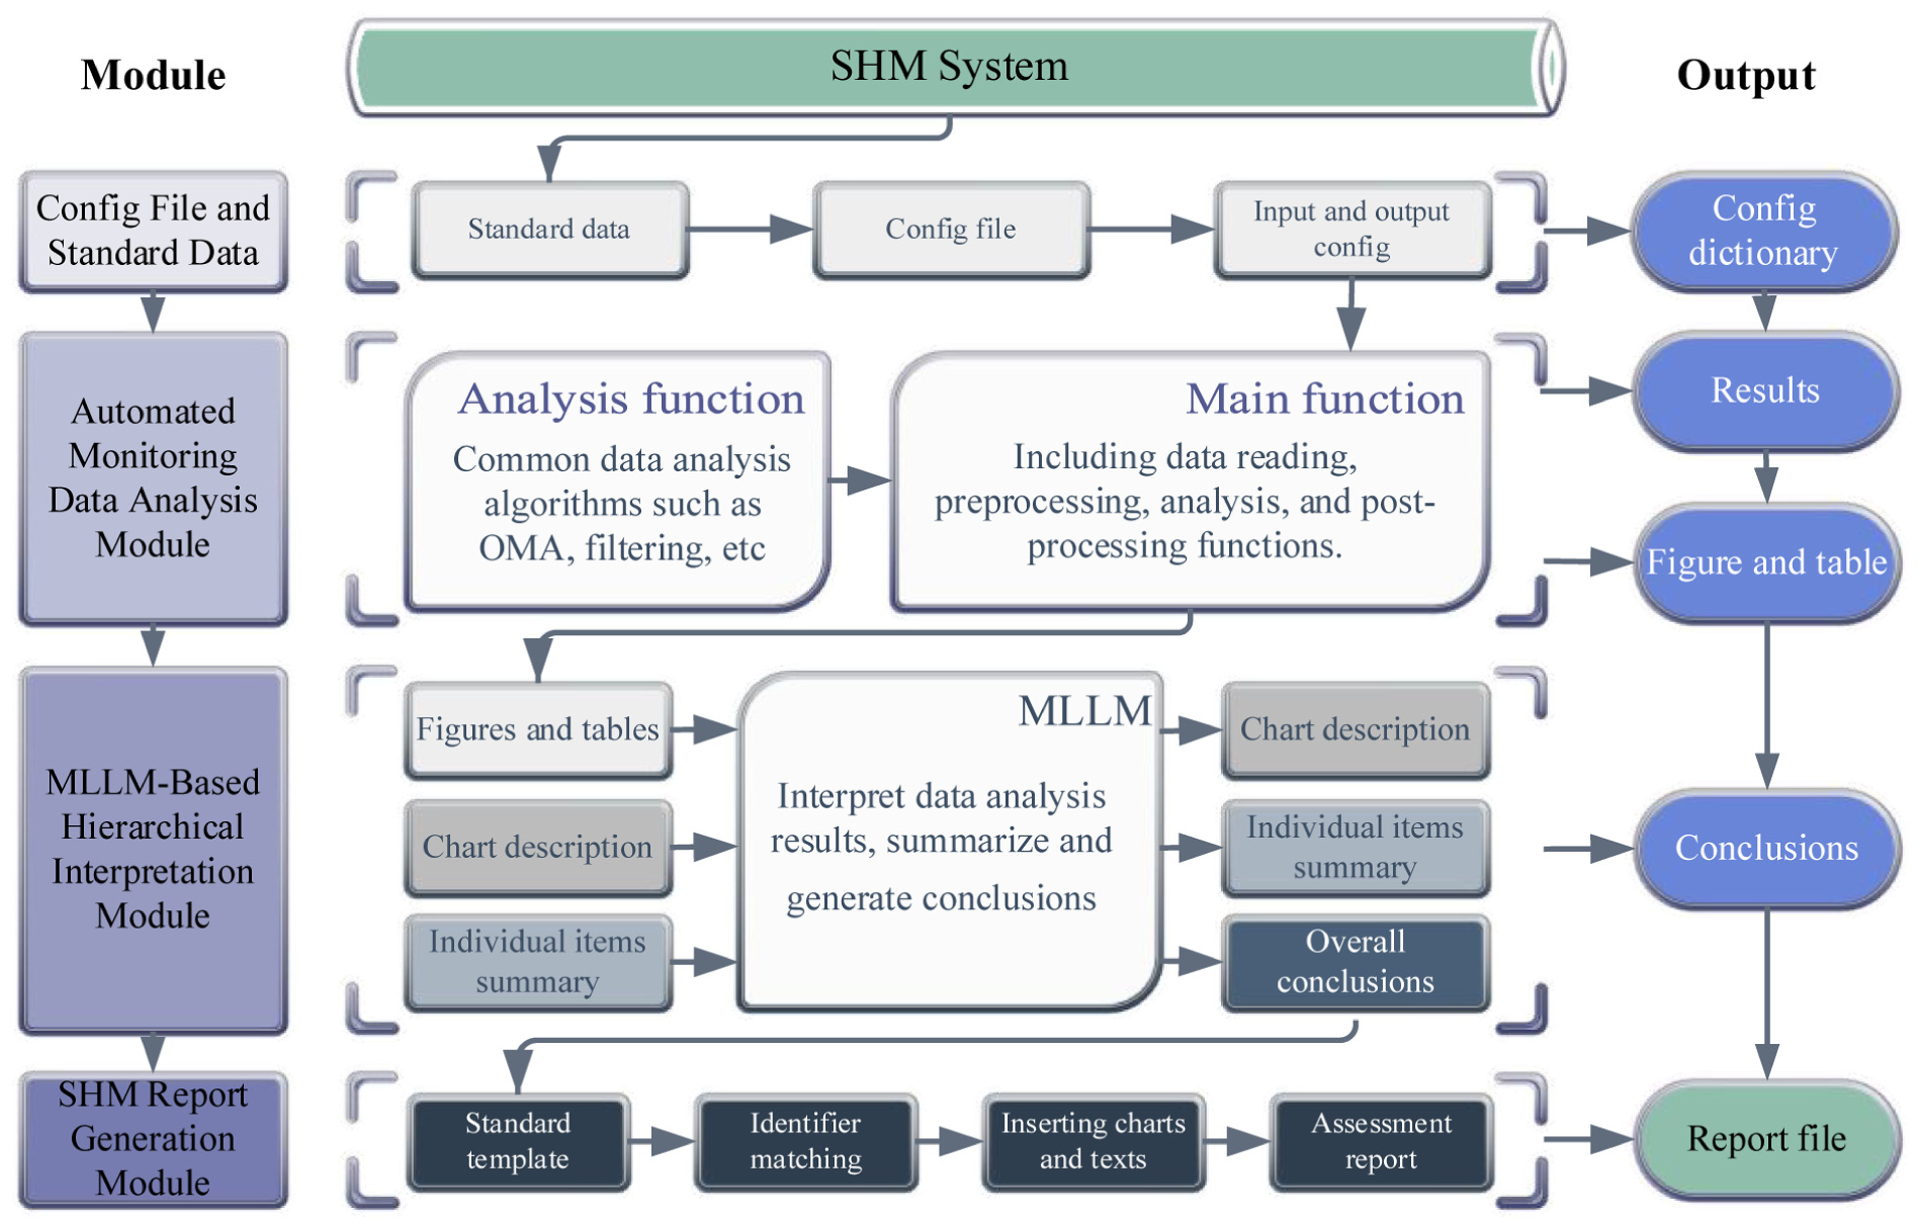
Intelligent SHM analysis and reporting generation framework. SHM: structural health monitoring.
The automated monitoring data analysis module was developed using Python. By specifying a set of essential configuration parameters, such as analysis duration, file path, data type, and analysis tasks, the system enables automated processing of monitoring data and the generation of result visualizations. In the process of achieving automation, the module primarily faces three key challenges: (1) generalizability, (2) robustness, and (3) the integration of diverse analysis algorithms. The module is designed to accommodate SHM systems from different bridges, which may vary in terms of sensor quantity, sampling frequency, and other configuration parameters. In addition, monitoring data often contain issues such as missing or corrupted files. Therefore, the automated analysis module must be capable of handling such anomalies gracefully without causing execution errors.
(2) MLLM-based hierarchical interpretation module
This study employs an MLLM as an assessment-oriented interpretation system to interpret the graphical outputs of data analysis, thereby enhancing the interpretability of results and assisting nonexpert users in understanding structural conditions. The module is confronted with two main challenges: (1) multimodal data, such as images and charts; and (2) the domain knowledge required for SHM tasks. In practical implementation, Qwen MLLM 49 was selected as the baseline model. It was then fine-tuned using datasets from real-world bridge structures to adapt it to SHM-specific tasks.
(3) Automated SHM report generation module
The first two modules produce analytical visualizations and corresponding structural assessment conclusions. These outputs are then integrated by the automated SHM report generation module into a standardized report format, facilitating consistent and efficient documentation.
Through the integration of three modules, this study achieves a highly automated bridge SHM assessment process, with a particular emphasis on the intelligent analysis and interpretation of unstructured data, such as charts, from health monitoring data. By configuring only basic data attributes with minimal human intervention, automated monitoring data analysis and intelligent structural assessment are achieved. This provides a solution for generating monitoring assessment reports that are adaptable across systems and bridge structures.
Automated monitoring data analysis
This section introduces the proposed automated monitoring data analysis module. First, a general data analysis architecture was developed to accommodate data processing across various monitoring systems. Next, several robustness strategies were implemented to gracefully handle errors and anomalies in different types of monitoring data. Finally, a set of automated algorithms for common analysis tasks, such as operational modal analysis (OMA), correlation analysis, and regression analysis, was developed and integrated into the proposed framework.
Generalized analysis architecture
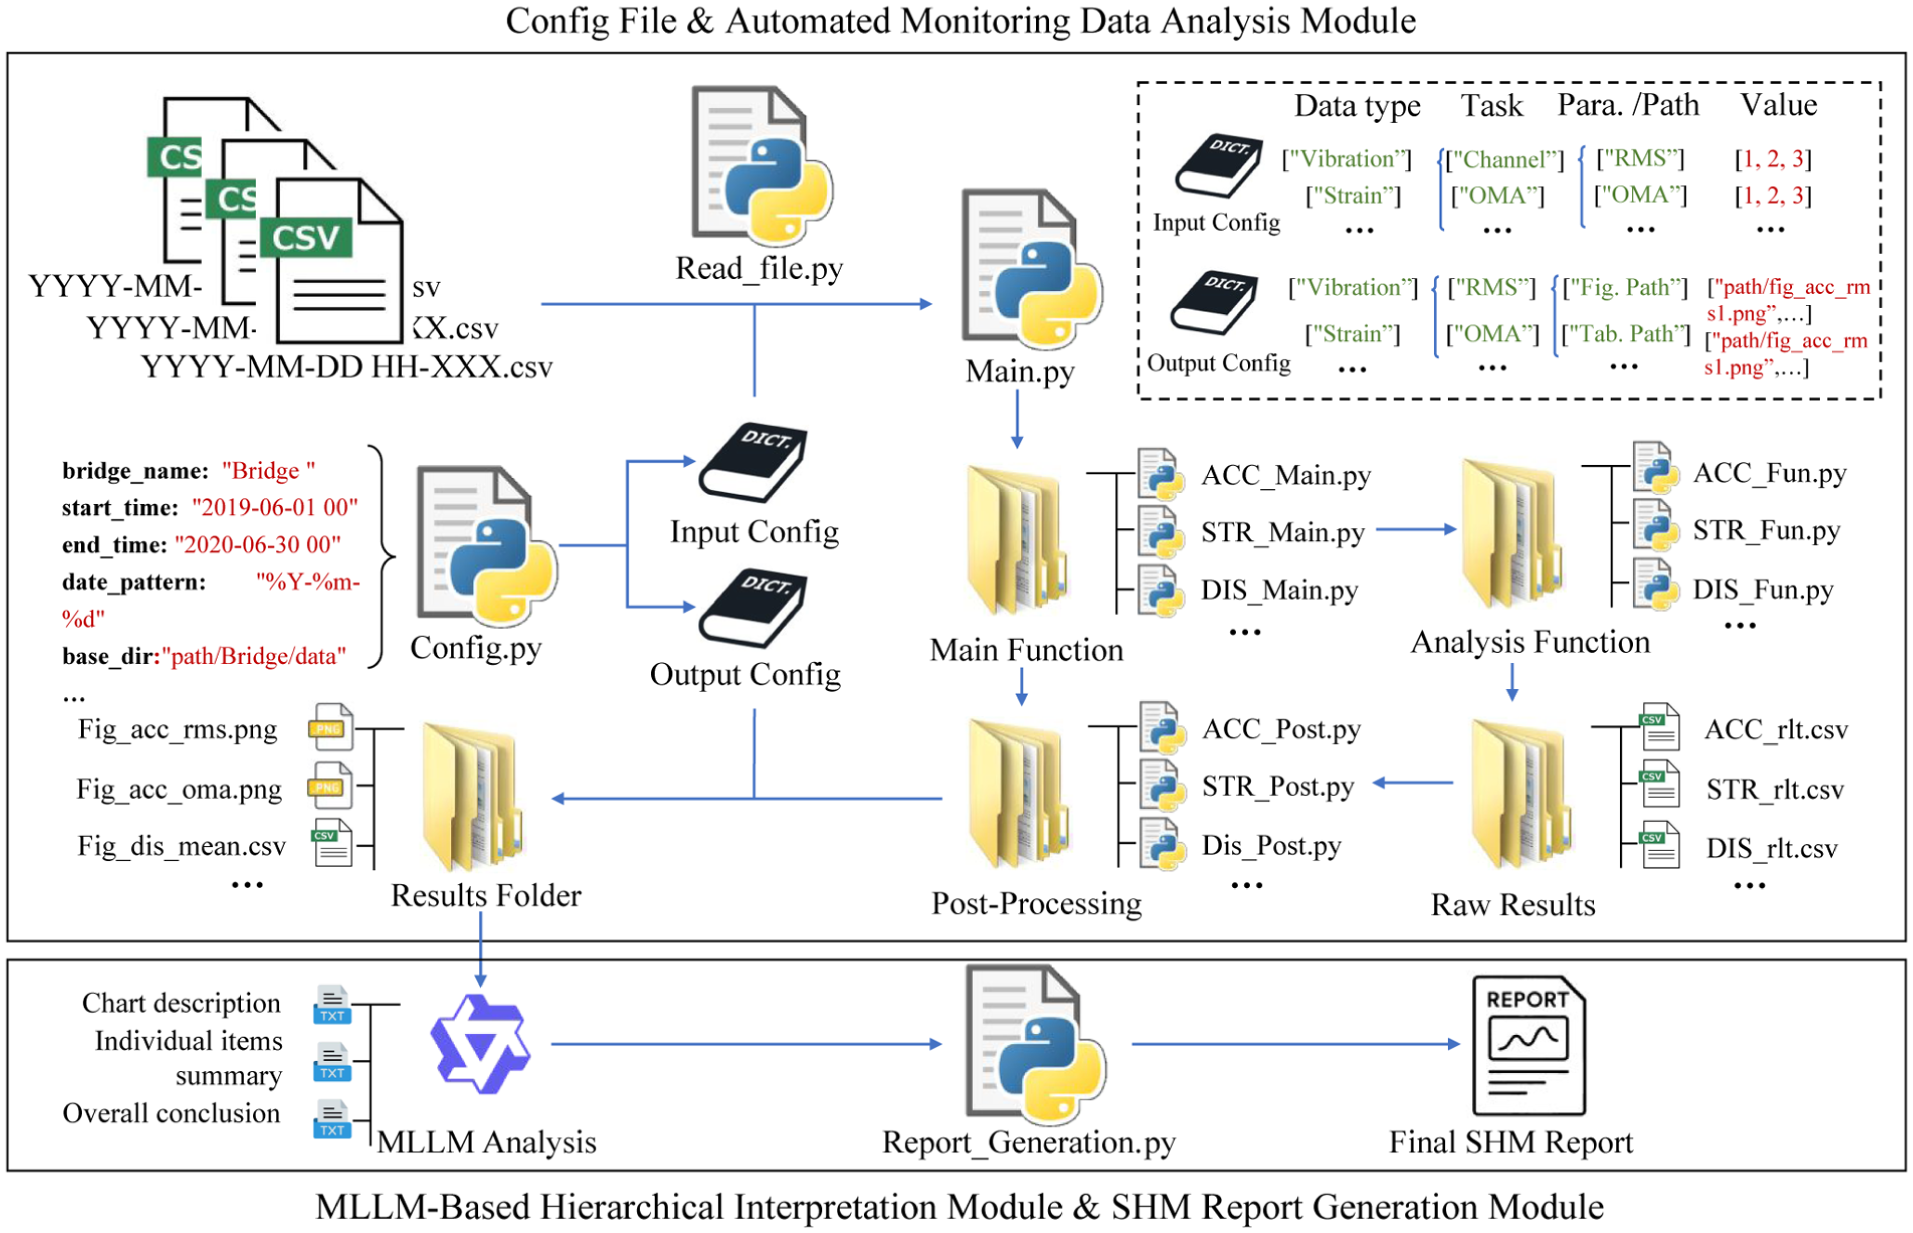
The proposed generalized analysis architecture is illustrated in Figure 3. First, the basic parameters for data analysis, such as data path, analysis duration, and task type, need to be defined in a configuration file. Then, Config.py automatically generates input and output configuration dictionaries based on these parameters. Guided by the input configuration dictionary, the main function dynamically calls the required analytical routines from the analysis function libraries. It then invokes the postprocessing module to generate graphical and tabular outputs based on the output configuration dictionary. This workflow produces chart analysis results, each indexed and named by the output configuration and assigned a unique dynamic identifier, thereby enabling unambiguous access and integration by the downstream MLLM-based hierarchical interpretation and SHM report generation steps.
Automated data analysis workflow.
This configuration-driven workflow is designed for maximal flexibility and generalizability. Manual intervention is deliberately confined to a one-time setup: data standardization and the definition of configuration parameters. This initial step is essential to harmonize the inherent variability across different SHM systems, such as diverse data formats, sensor types, and analysis requirements. Once configured, the framework flexibly invokes the appropriate analytical tasks automatically, enabling robust and unified processing without further manual input.
(1) Data standardization
To enable automated processing, a standardized data storage structure, guided by industry codes, 24 is enforced (Figure 4). All monitoring data are segmented into 1-h comma-separated values (CSV) files, a duration chosen to balance the needs of OMA with the resolution for diurnal trend analysis. Data are organized in a date-based folder and hourly file hierarchy, with a standardized timestamp column. This consistent format facilitates robust, automated batch processing across diverse data sources and SHM systems.
(2) Task-oriented modular analysis
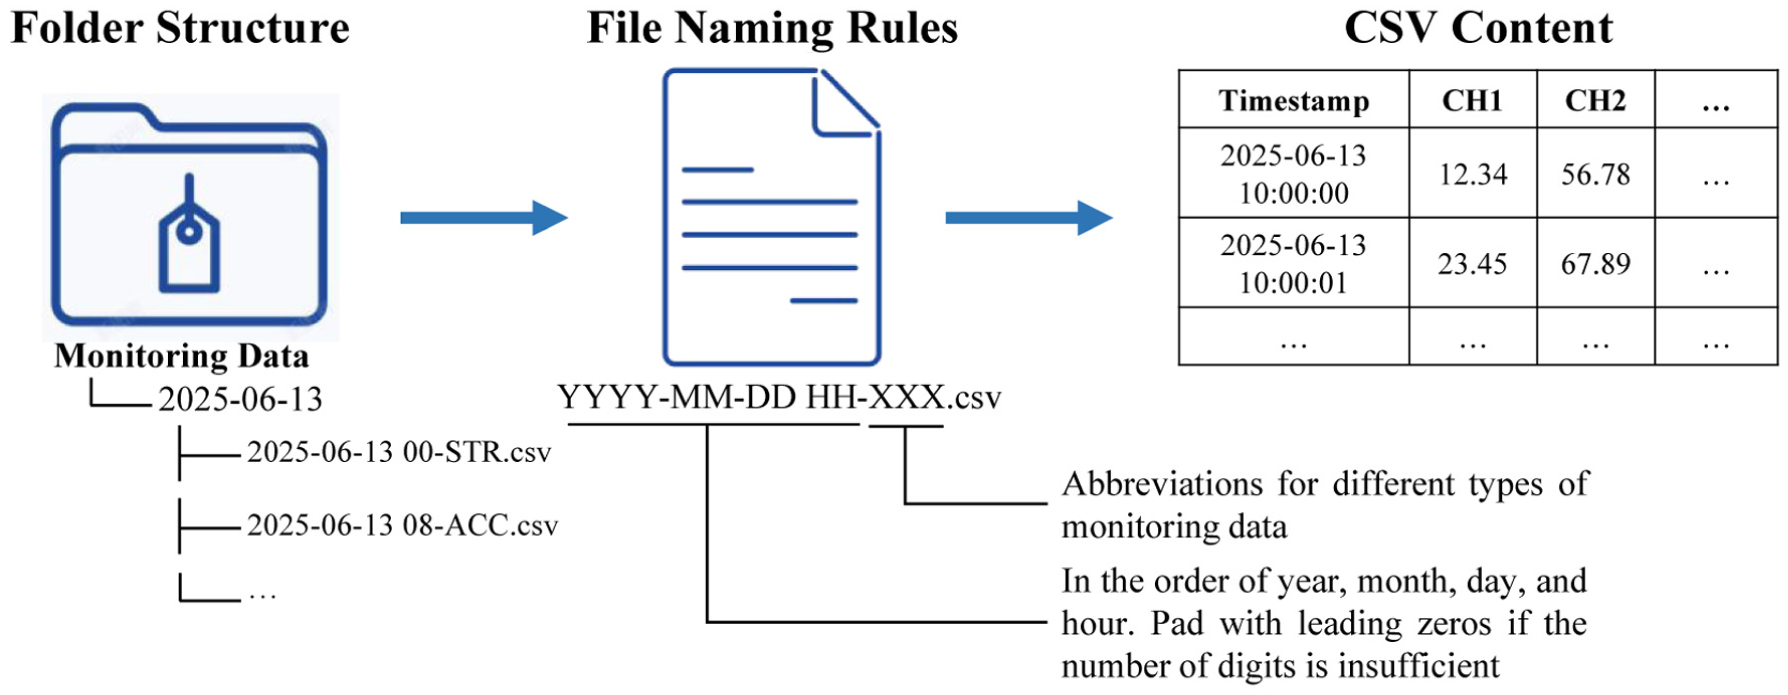
Monitoring data storage structure.
All monitoring data analyses are abstracted into individual tasks. Depending on the nature of the data required, tasks are classified into two categories: single-type data analysis (processing one data type) and multisource data analysis (integrating two or more data types). “Single-type” refers to a task that processes only one data type, while “multisource” refers to a task that uses multiple data types or channels in combination to model the relationships between them, specifically including correlation and regression analyses. These tasks are handled by the analysis function module and the postprocessing module, respectively. Before data analysis, each channel undergoes anomaly detection to ensure that the analysis is based on quality-controlled data. By mapping the task definitions specified in the input configuration dictionary to their corresponding processing functions, the framework enables automated and modular execution of analysis tasks. Additionally, the analysis process utilizes parallel computing mechanisms to improve data processing efficiency and scalability for large datasets.
The entire process is orchestrated by a configuration dictionary, which serves as the system’s core driving component (Figure 5). Users define high-level parameters in a configuration file, including analysis tasks, channels, and task-specific settings. From this, the system automatically generates detailed input/output dictionaries that precisely control algorithm execution, result formatting, and storage. This ensures that every output (e.g., a chart) is assigned a unique identifier, guaranteeing traceability and seamless integration into the final report.
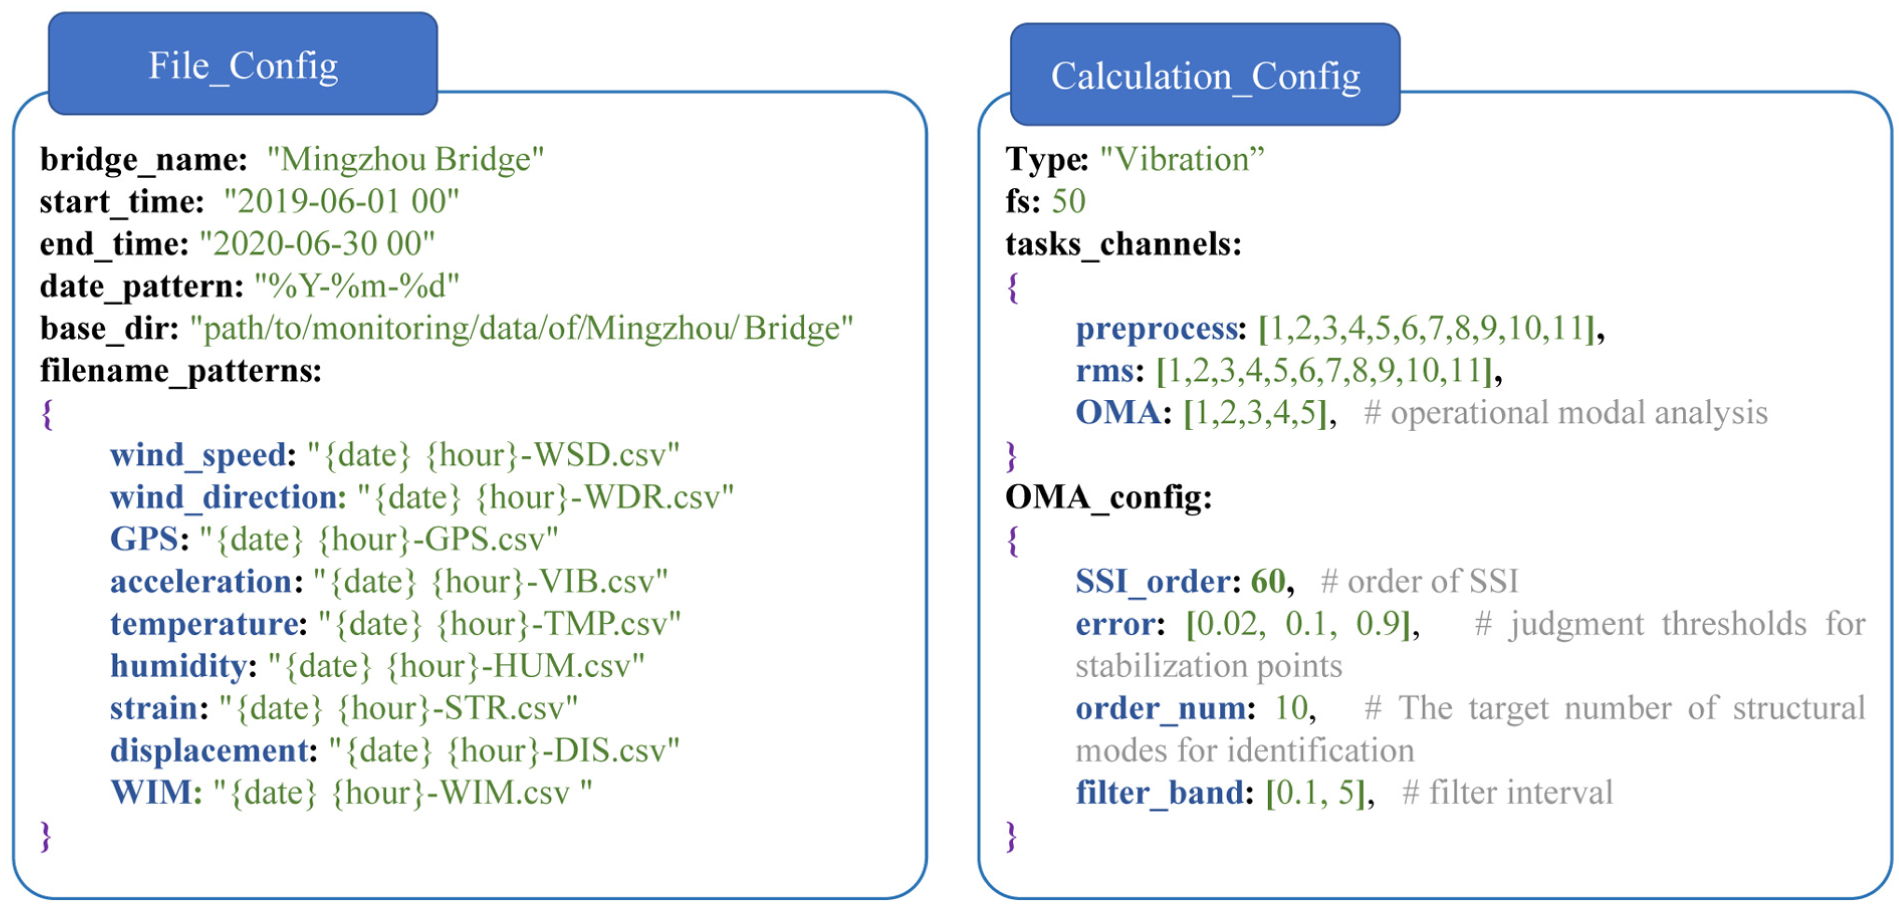
Structure of the configurations.
Although this module does not achieve complete automation and still requires data standardization and configuration file setup, this design reflects a deliberate trade-off to ensure generalizability. Given the variability across bridge monitoring systems, the framework adopts a hybrid parameterization scheme to balance cross-bridge consistency and bridge-specific adaptability. Specifically, parameters are structured into two categories: (a) globally fixed defaults, such as the generalized extreme studentized deviate (GESD) significance level, hierarchical density-based spatial clustering of applications with noise (HDBSCAN) minimum cluster size, correlation split, and regression training size; and (b) a concise set of manually specified, bridge-specific settings, such as the lightweight anomaly threshold, SSI order, target mode number, band-pass range, and acceptance thresholds for damping, frequency, and modal assurance criterion (MAC), among others. These parameters mainly involve modal and vibration-related quantities, including frequency, damping ratio, mode-shape consistency, and statistical thresholds for anomaly detection and filtering. In this way, the framework remains standardized and reproducible while retaining sufficient flexibility for bridge-specific SHM requirements. Once the initial configuration is completed, all subsequent analyses are executed automatically without further human intervention.
Robustness strategies
In SHM systems, data anomalies frequently occur due to various real-world factors, such as sensor malfunction, transmission errors, or environmental interference. A key challenge in building a generalized automated data analysis system is dealing with anomalies in monitoring data, including file-level issues and irregular data values. Such anomalies can significantly compromise the robustness of the module, often resulting in analysis errors and forced interruptions during execution. To enhance the robustness of the module, this study incorporates systematic handling strategies throughout the entire analysis workflow, from data reading to result post-processing, to handle imperfections from file-level errors to value-level anomalies, as shown in Figure 6.
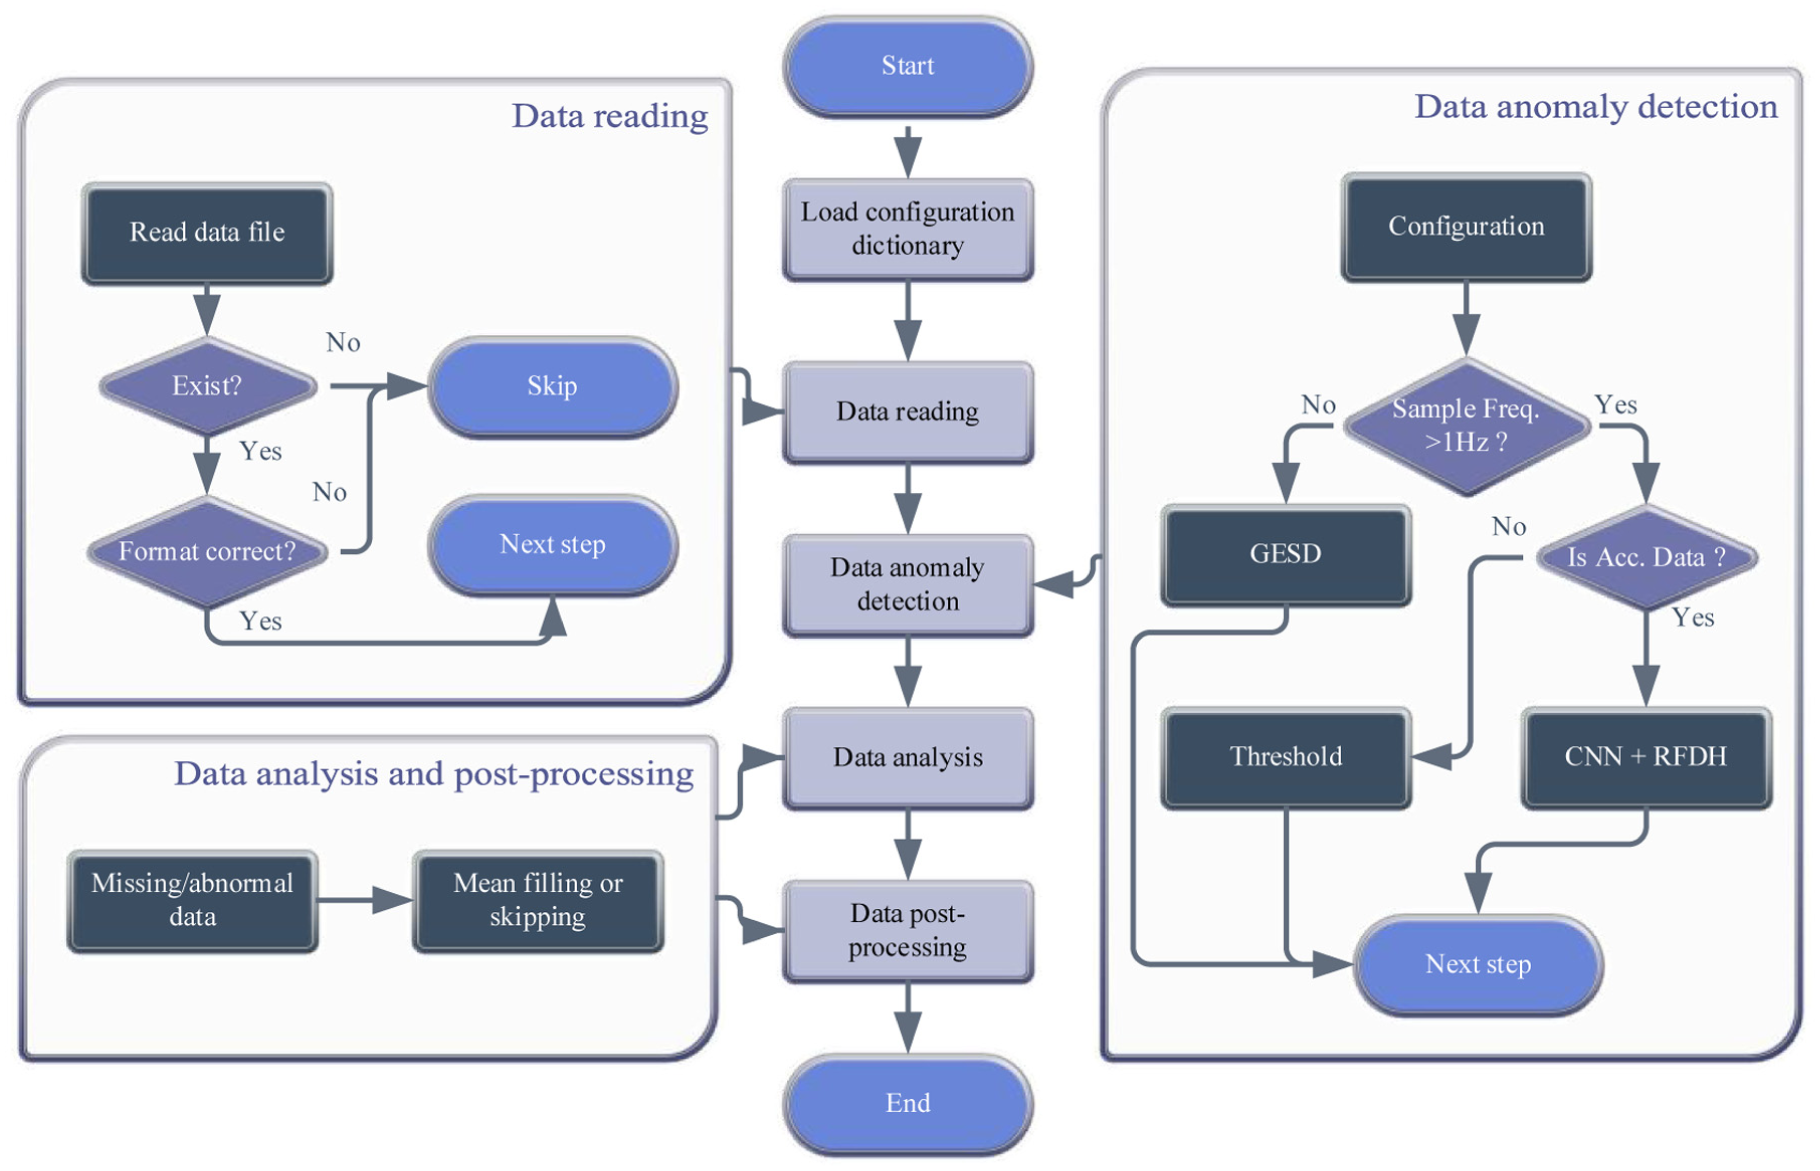
Data anomaly detection process.
First, to prevent workflow interruptions, the module gracefully handles file-level exceptions such as missing, corrupted, or incorrectly formatted files. Instead of halting, the system bypasses problematic files and records a null result, ensuring the continuity of the overall analysis pipeline.
Second, for value-level anomaly detection, the framework moves beyond traditional methods that often lack generalizability. It introduces a pragmatic and scalable dual-strategy approach, routing data based on sensor characteristics, as illustrated in Figure 6.
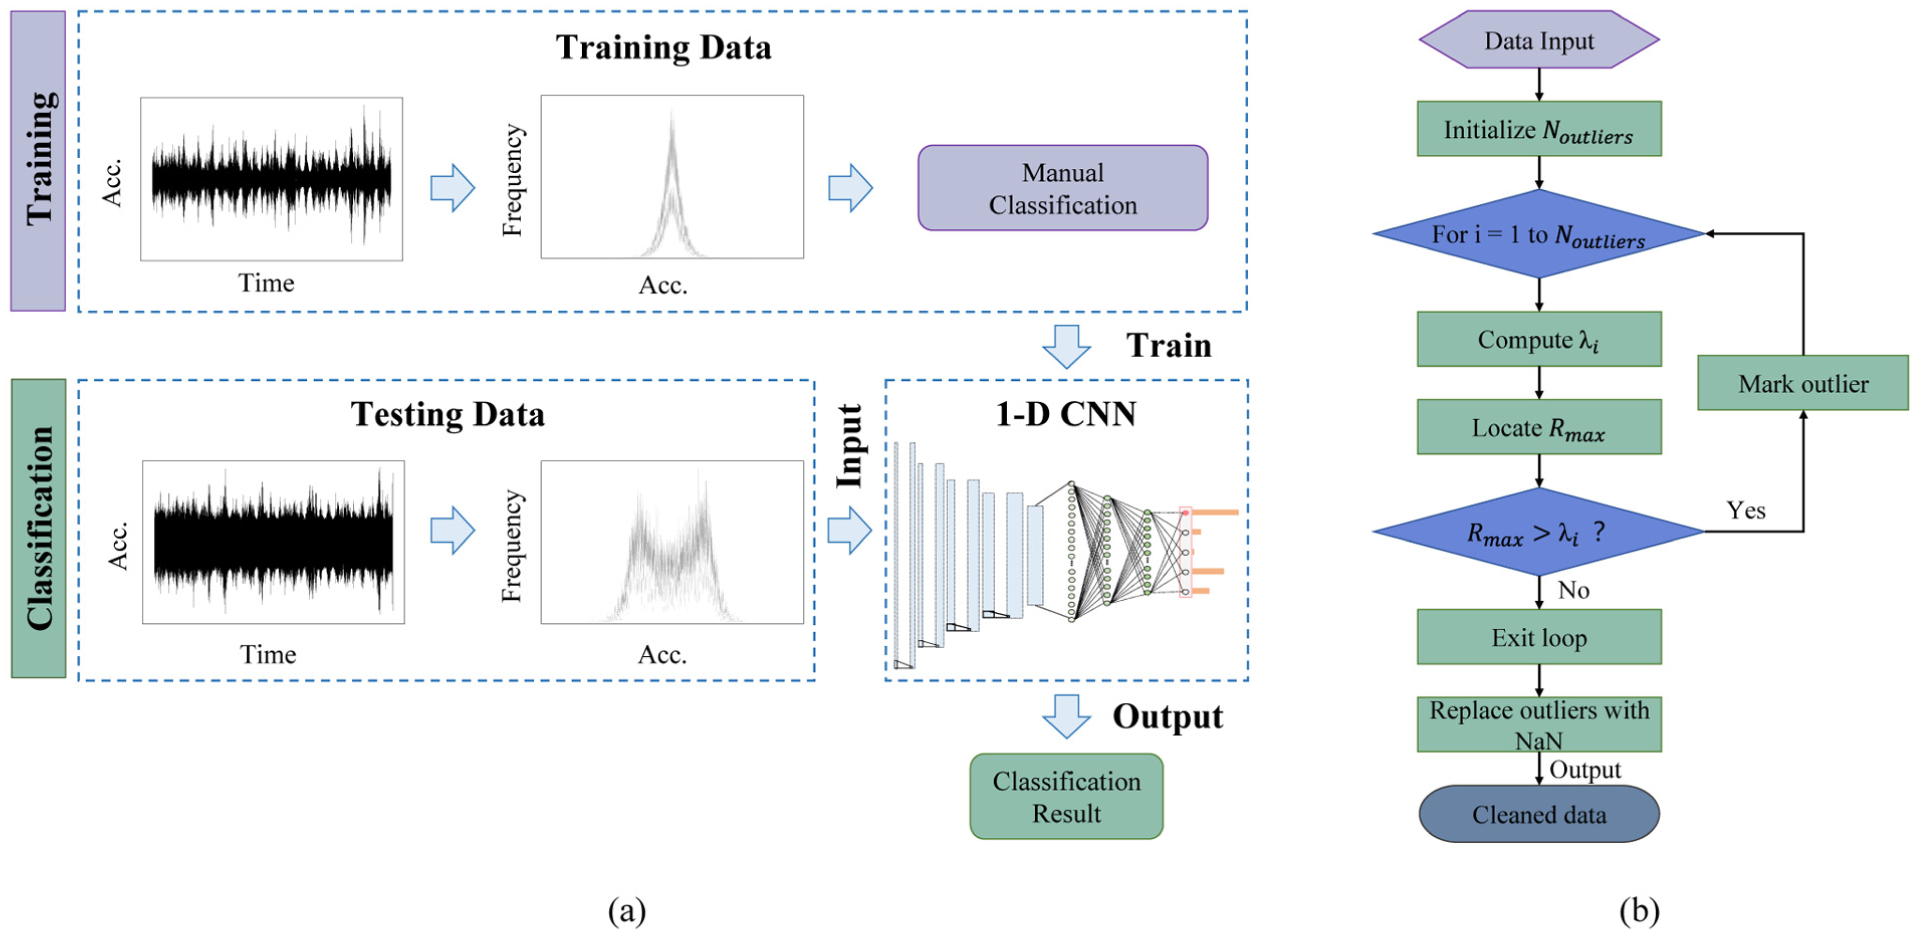
For acceleration data, a relative frequency distribution histograms (RFDH)-based pretrained one-dimensional CNN classifier adopted from a previous study 59 was used to enhance cross-bridge generalizability. Raw acceleration signals are first transformed into RFDH, and the inverted RFDH envelopes are then used as inputs to the CNN for fault classification (Figure 7(a)). Five categories including normal, minor, biased, outlier-corrupted, and noise-corrupted were considered, while missing data were identified separately by point counting. By mapping raw signals into a normalized distribution-based representation, this method effectively reduces structural differences across bridges and improves transferability without retraining. In the present study, this previously validated classifier was directly used for acceleration-data quality control.
Data anomaly detection strategies for different types of data: (a) acceleration data anomaly detection and (b) nonacceleration data anomaly detection
For all nonacceleration data (e.g., temperature, strain), a further frequency-based strategy is implemented to handle their distinct statistical properties:
Low-frequency static data (<1 Hz): The GESD method
60
is employed, leveraging its statistical robustness for sparse series. To prevent over-pruning, its significance level is set to

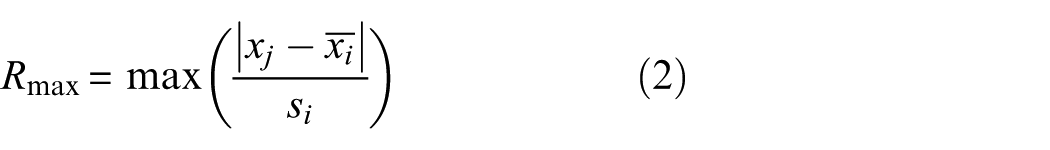
where
High-frequency dynamic data (≥1 Hz): In this regime, GESD can misclassify valid, sharp peaks from events like traffic loading as outliers. Therefore, a more pragmatic lightweight empirical threshold, defined by a percentile band
A frequency-based switch at 1 Hz is used to route channels between these two branches; this threshold reflects both statistical behavior and practical experience and can be overridden in the configuration file if required.
Finally, detected anomalies are managed based on their severity. Minor gaps are filled with mean values, while segments with extensive corruption are excluded from subsequent analysis. This simple strategy is deliberately chosen over complex reconstruction algorithms, which are often computationally intensive, nongeneralizable, and risk biasing assessment results by relying solely on historical data.
Collectively, these strategies ensure the framework reliably computes outputs from imperfect real-world monitoring data, providing a dependable foundation for all subsequent structural health assessments.
Automated analysis functions and algorithms
The design of the automated analysis functions and algorithms is guided by two objectives: minimizing computation parameter settings and maintaining generalizability across heterogeneous structures. Drawing on both Chinese code provisions 24 and commonly accepted industry practice, automated workflows encompassing OMA, correlation, and regression analysis have been implemented. For clarity, Table 1 summarizes the alignment between data types, analysis tasks, and the corresponding methods. In addition, this section describes the reporting pipeline, in which a standard template is transformed into a graphics-rich document.
(1) Automated OMA
Source, task, method mapping for the monitoring data analysis module.
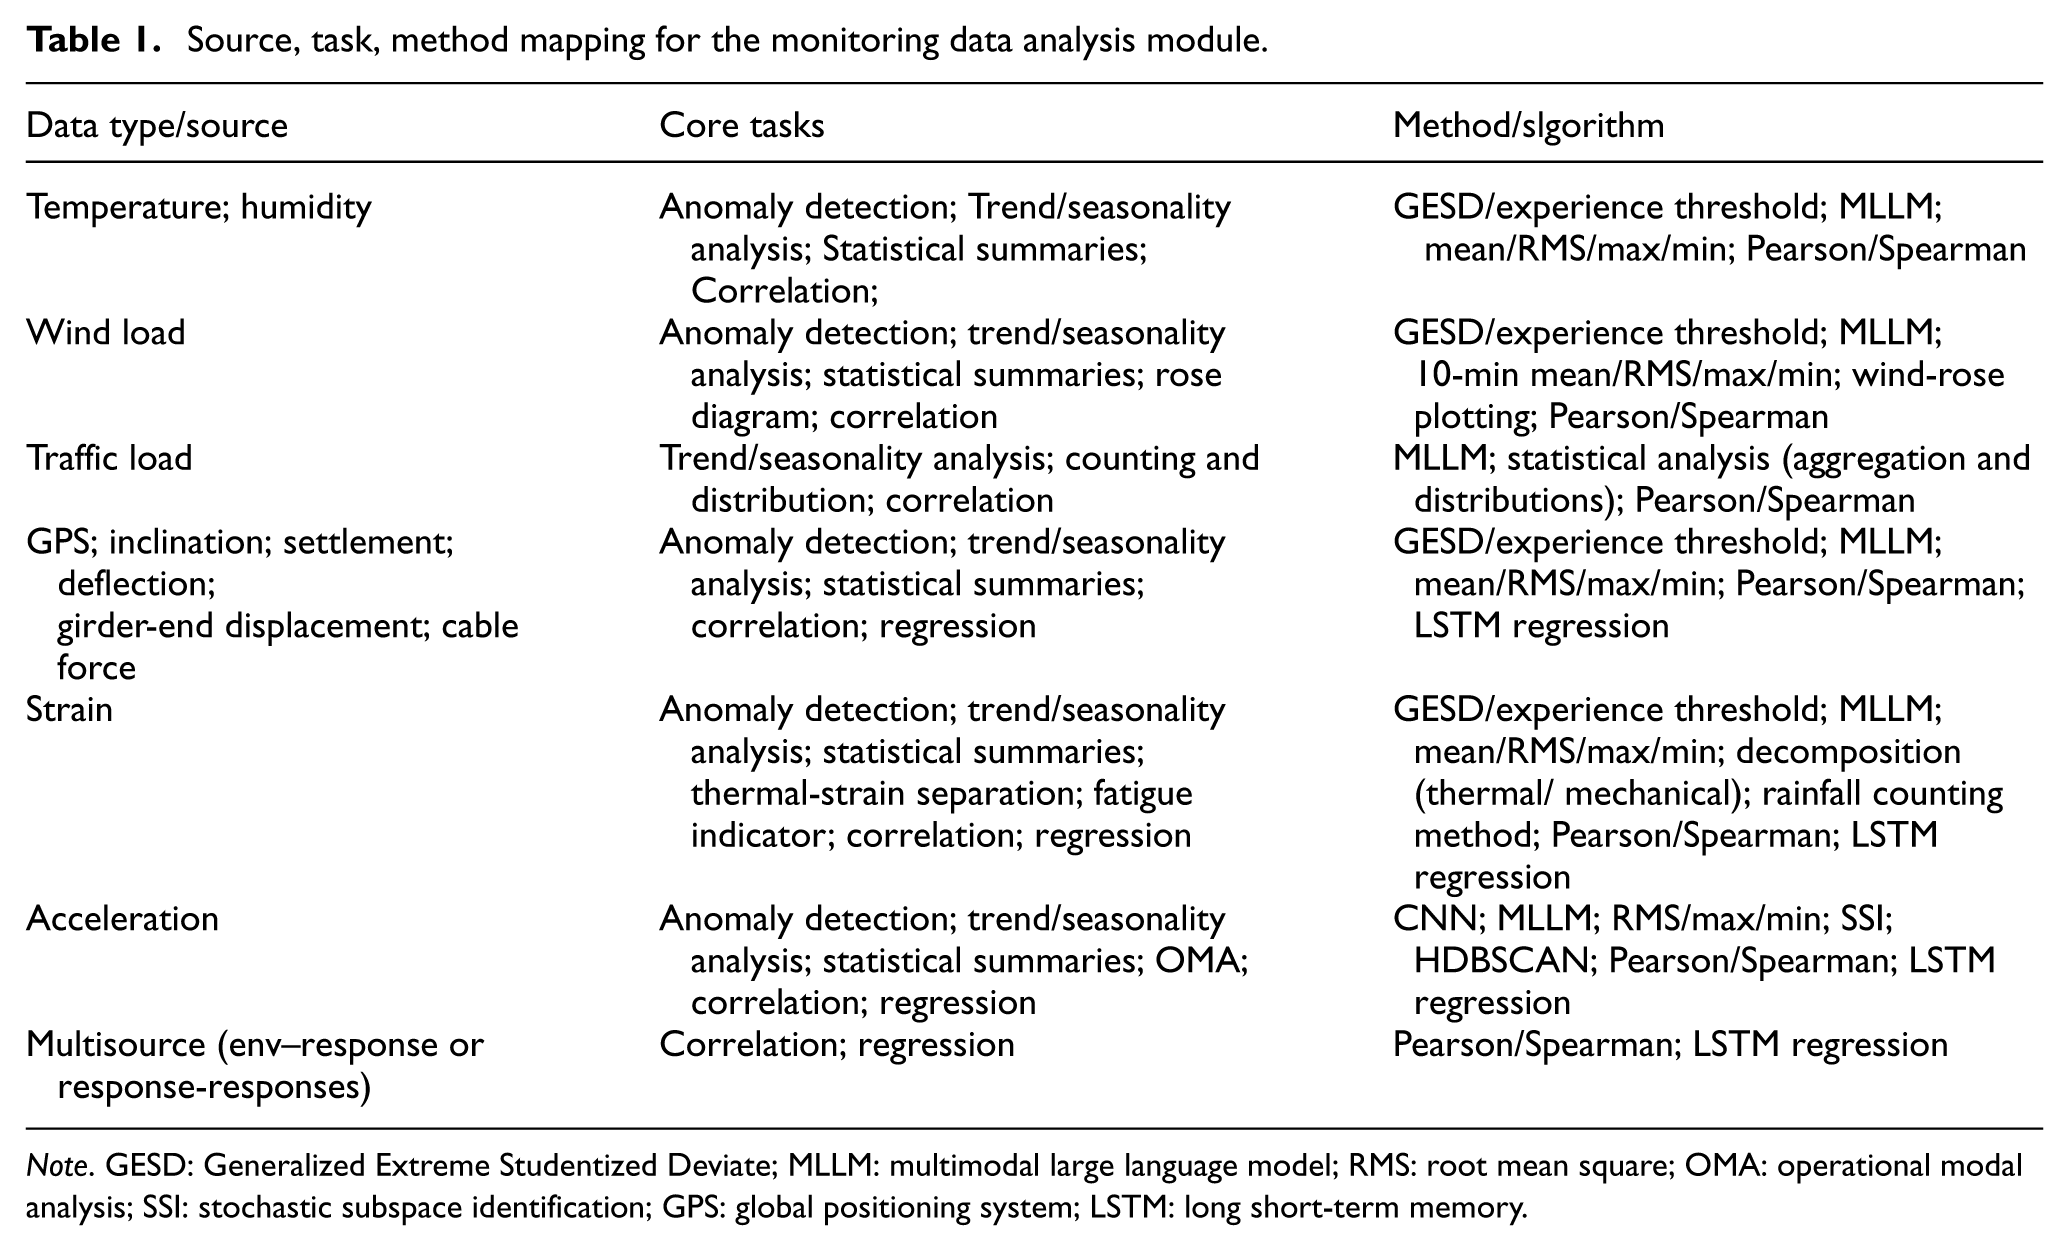
Note. GESD: Generalized Extreme Studentized Deviate; MLLM: multimodal large language model; RMS: root mean square; OMA: operational modal analysis; SSI: stochastic subspace identification; GPS: global positioning system; LSTM: long short-term memory.
Automated identification of modal parameters is conducted using the SSI method.
61
Prior to identification, a bridge-specific band-pass is applied to focus the analysis on the frequency region of interest, and the SSI model order (
A key challenge for full automation lies in distinguishing true modes from spurious ones in the stabilization diagram. To address this, HDBSCAN clustering algorithm
62
is integrated to remove spurious poles and to organize candidates into mode-consistent groups. The feature vector supplied to clustering comprises natural frequency and damping ratio. For robustness without manual tuning, the minimum cluster size is set to
(2) Automated correlation analysis
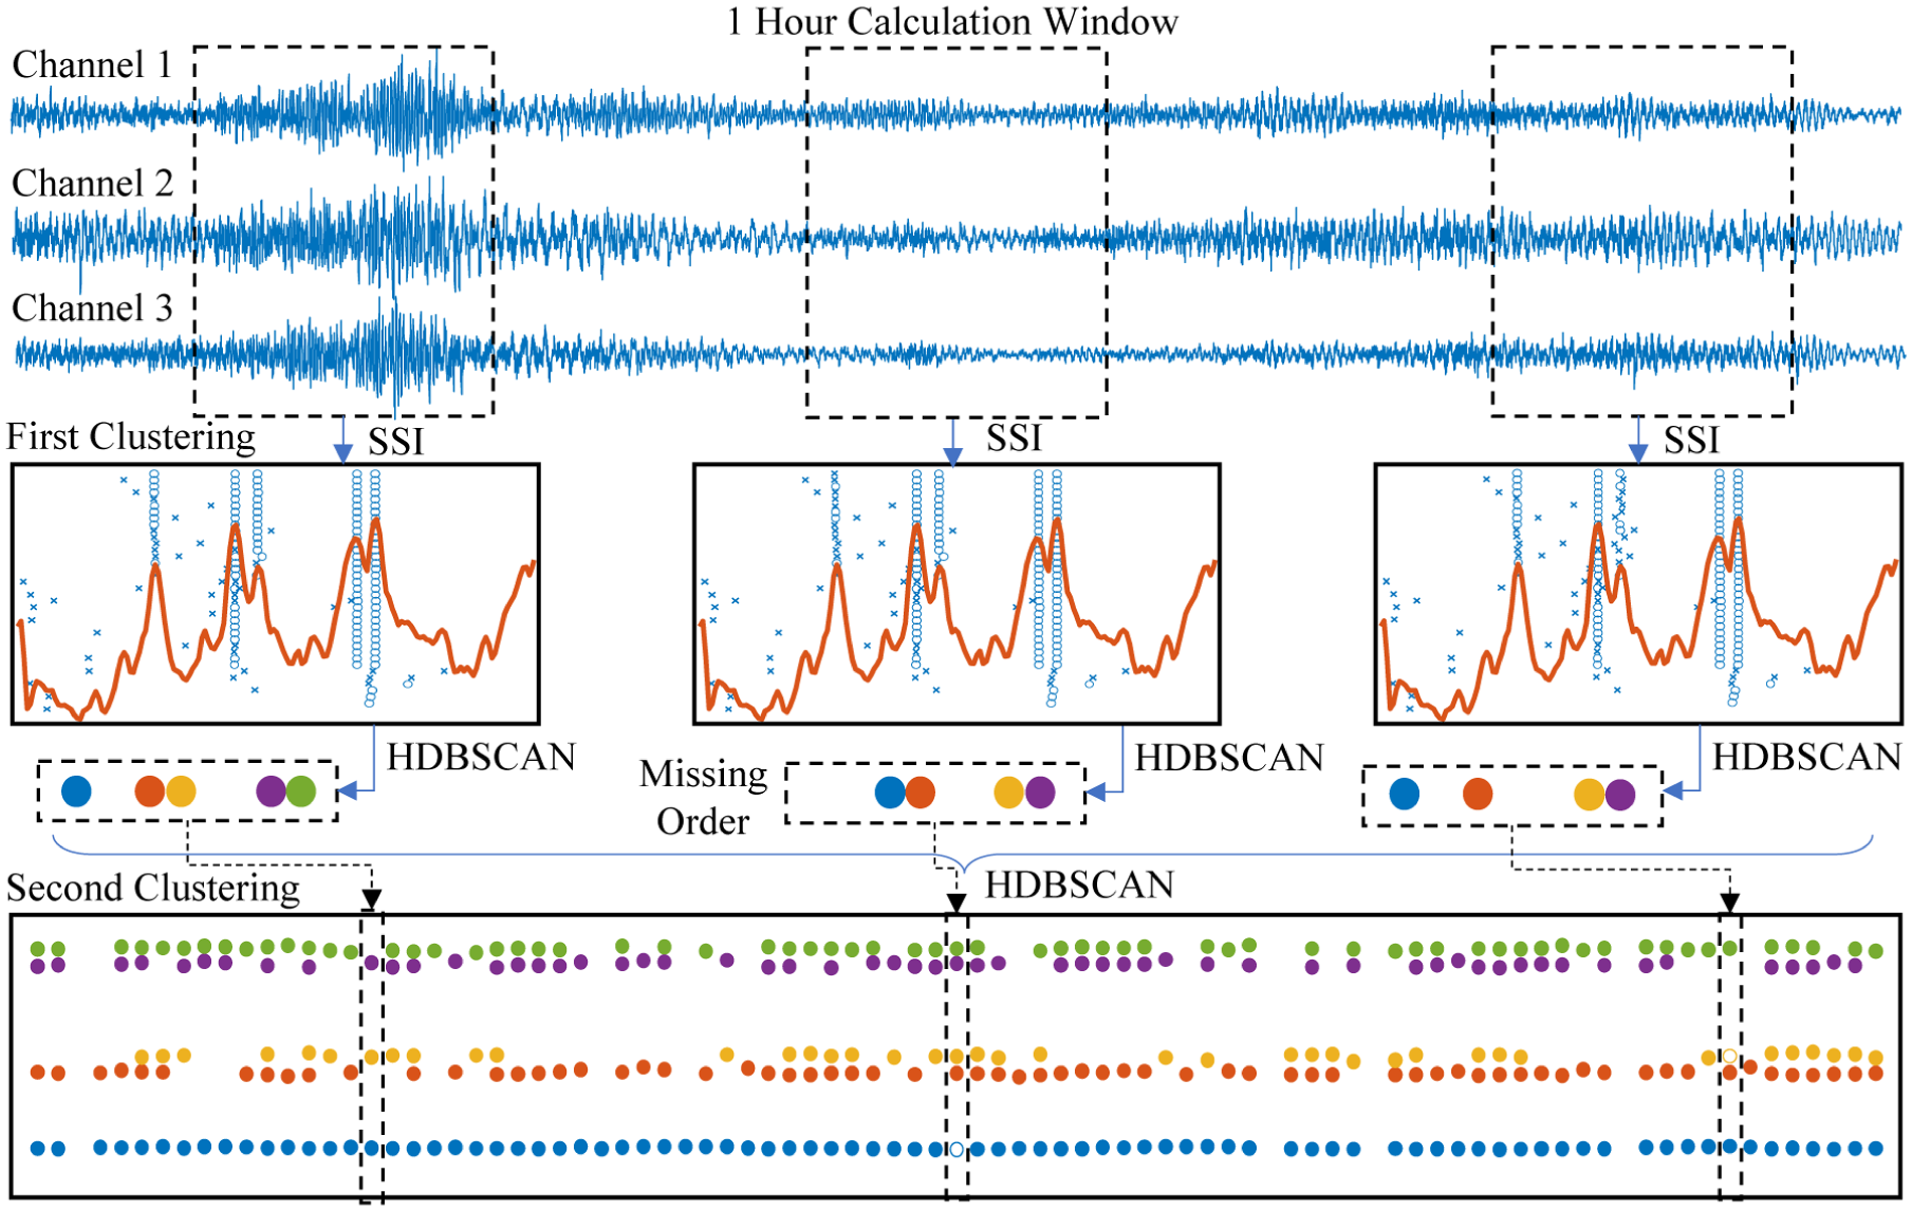
Workflow for automated OMA. OMA: operational modal analysis.
As correlation analysis typically involves multiple data types, it is conducted in the postprocessing module based on statistical features such as hourly averages and RMS values. This common SHM approach also mitigates issues arising from inconsistent sampling rates across different data types. Automated correlation analysis is achieved by referencing analysis types and channels defined in the configuration dictionary. The system divides the statistical feature time series into two sequential stages, corresponding to the first and second halves of the selected analysis window, performs linear regression for each stage, and computes correlation coefficients to identify variations in the structure. Figure 9(a) shows a matrix-based correlation comparison, in which the correlation coefficients of the first and second halves of the selected analysis window are displayed explicitly to facilitate cross-channel comparison, thereby allowing direct assessment of temporal changes in inter-variable relationships. In Figure 9(b), the fitted slopes of the linear relationships in the two stages are compared to reveal slow drifts or regime changes in the intervariable relationship, which may reflect significant changes in the structural state. The 50–50% split is adopted here as a simple standardized default for long-term SHM assessment, rather than for minimum-latency online anomaly detection. This approach preserves sensitivity to fundamental physical mechanisms while maintaining a high degree of automation and adaptability to datasets with varying sampling frequencies. A representative example of the correlation analysis is illustrated in Figure 9.
(3) Automated regression analysis
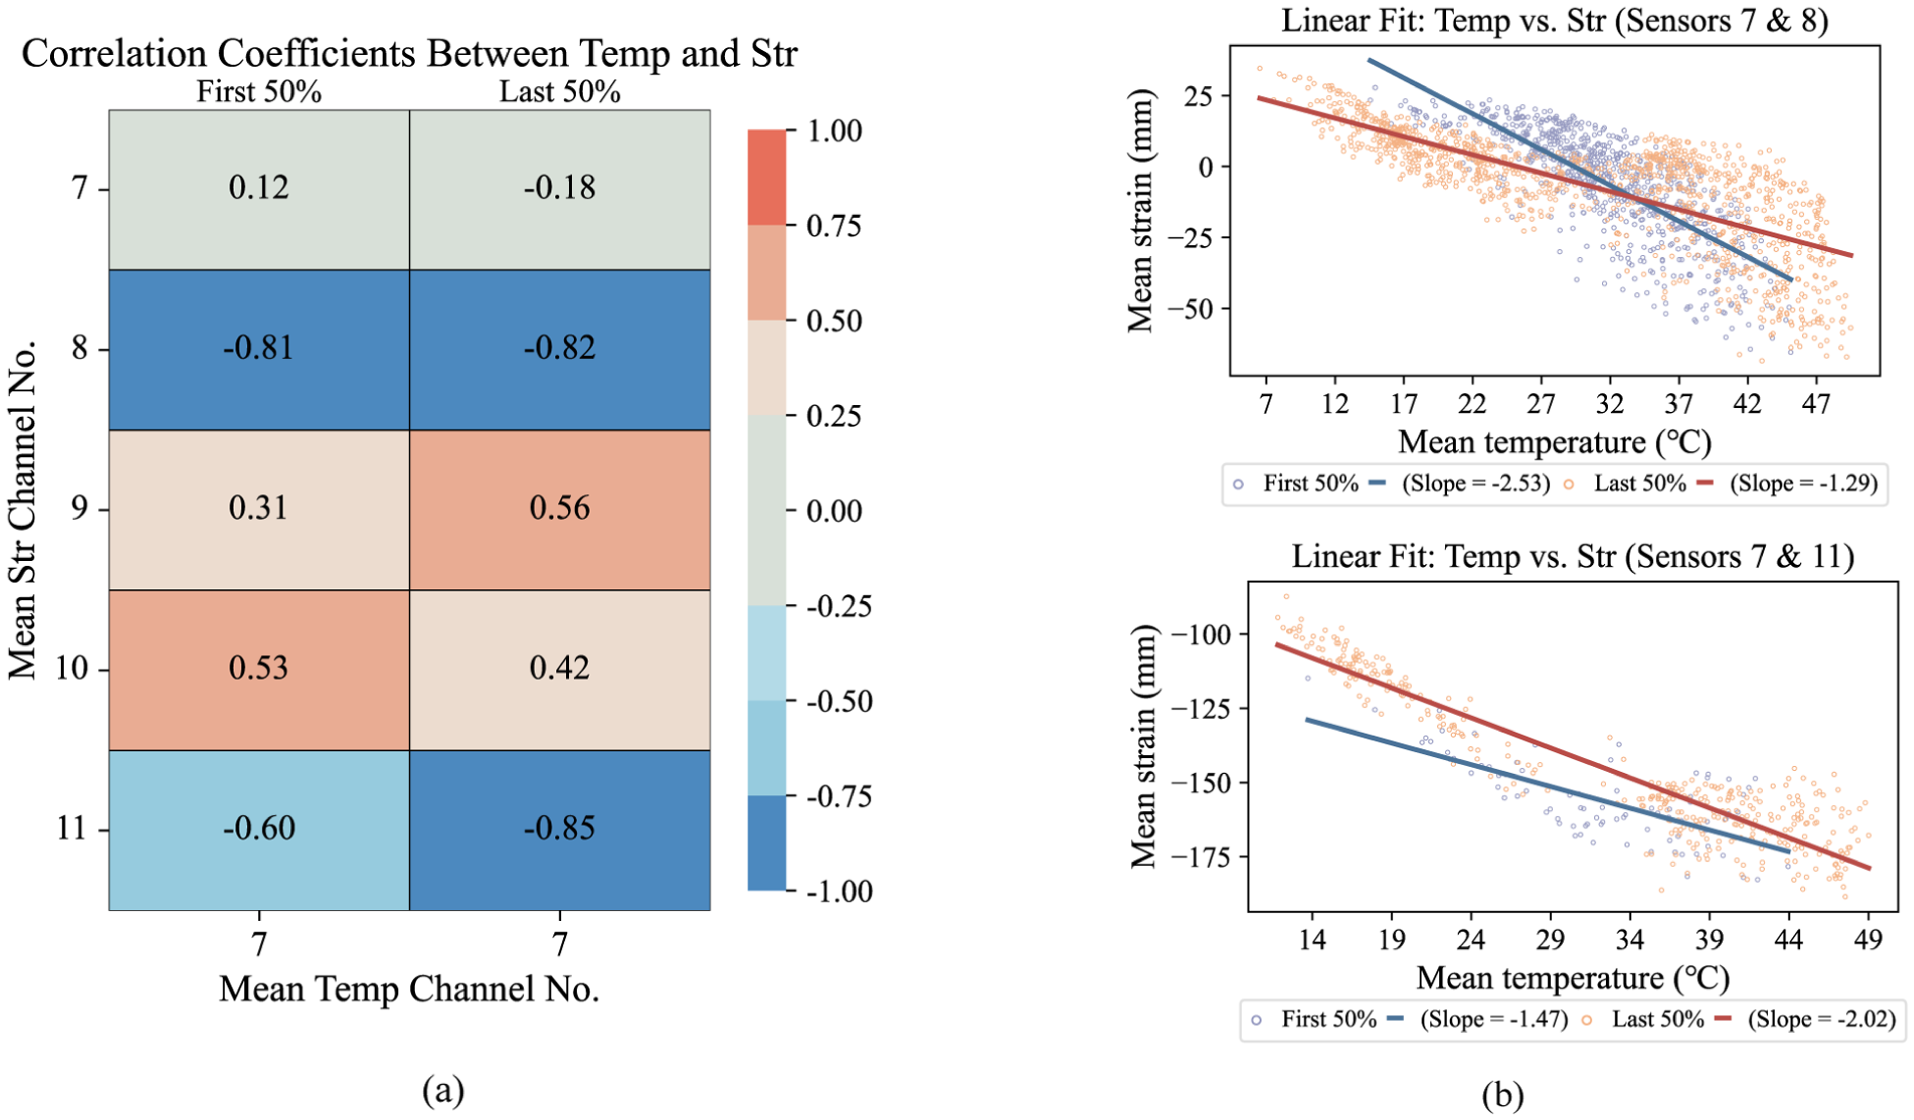
Example of the correlation analysis: (a) correlation coefficient matrix and (b) linear fit diagram.
Regression analysis is employed to establish a predictive baseline of the structure’s normal response using LSTM models, thereby identifying potential deterioration by analyzing residuals between predicted and observed values.
63
Adhering to principles of generalizability and computational efficiency, the analysis operates on statistical metrics (e.g., hourly means) rather than raw data. The process is fully automated: first, input variables are selected based on the configuration file. The system then trains an LSTM model on an initial portion of the data, defined as
(4) Automated document generation function
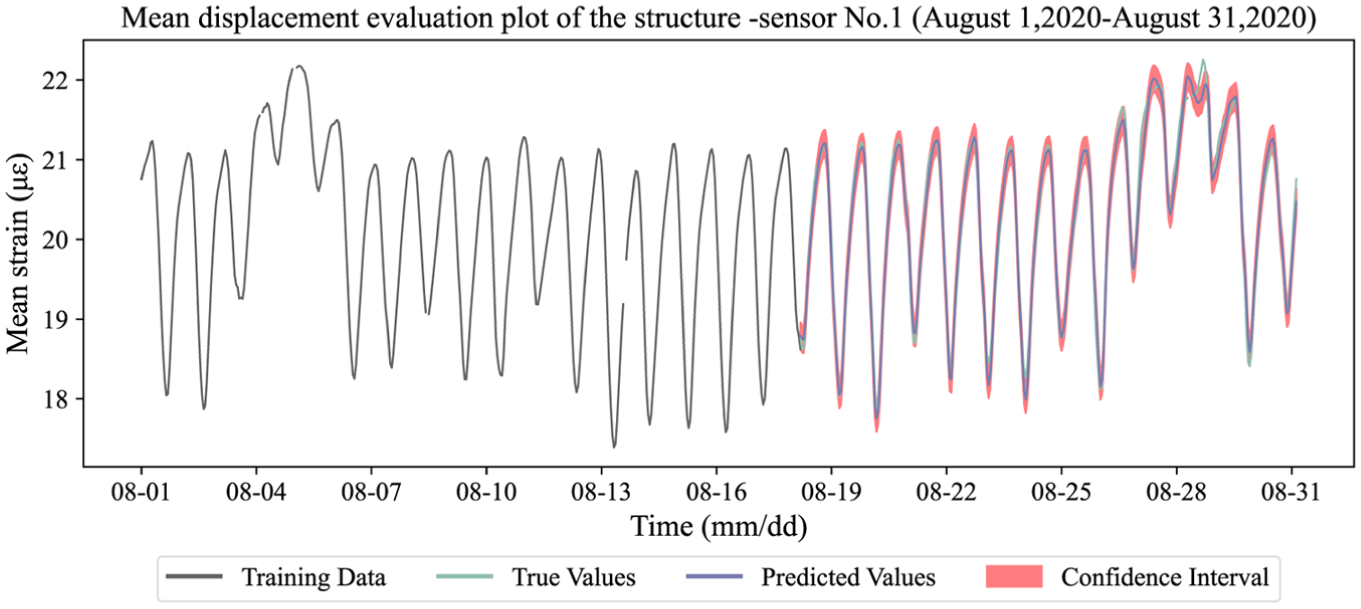
Evaluation diagram of girder-end displacement.
The report generation process consists of four steps: template → basic outline → detailed outline → final report. Taking acceleration data analysis as an example, the process is illustrated in Figure 11.
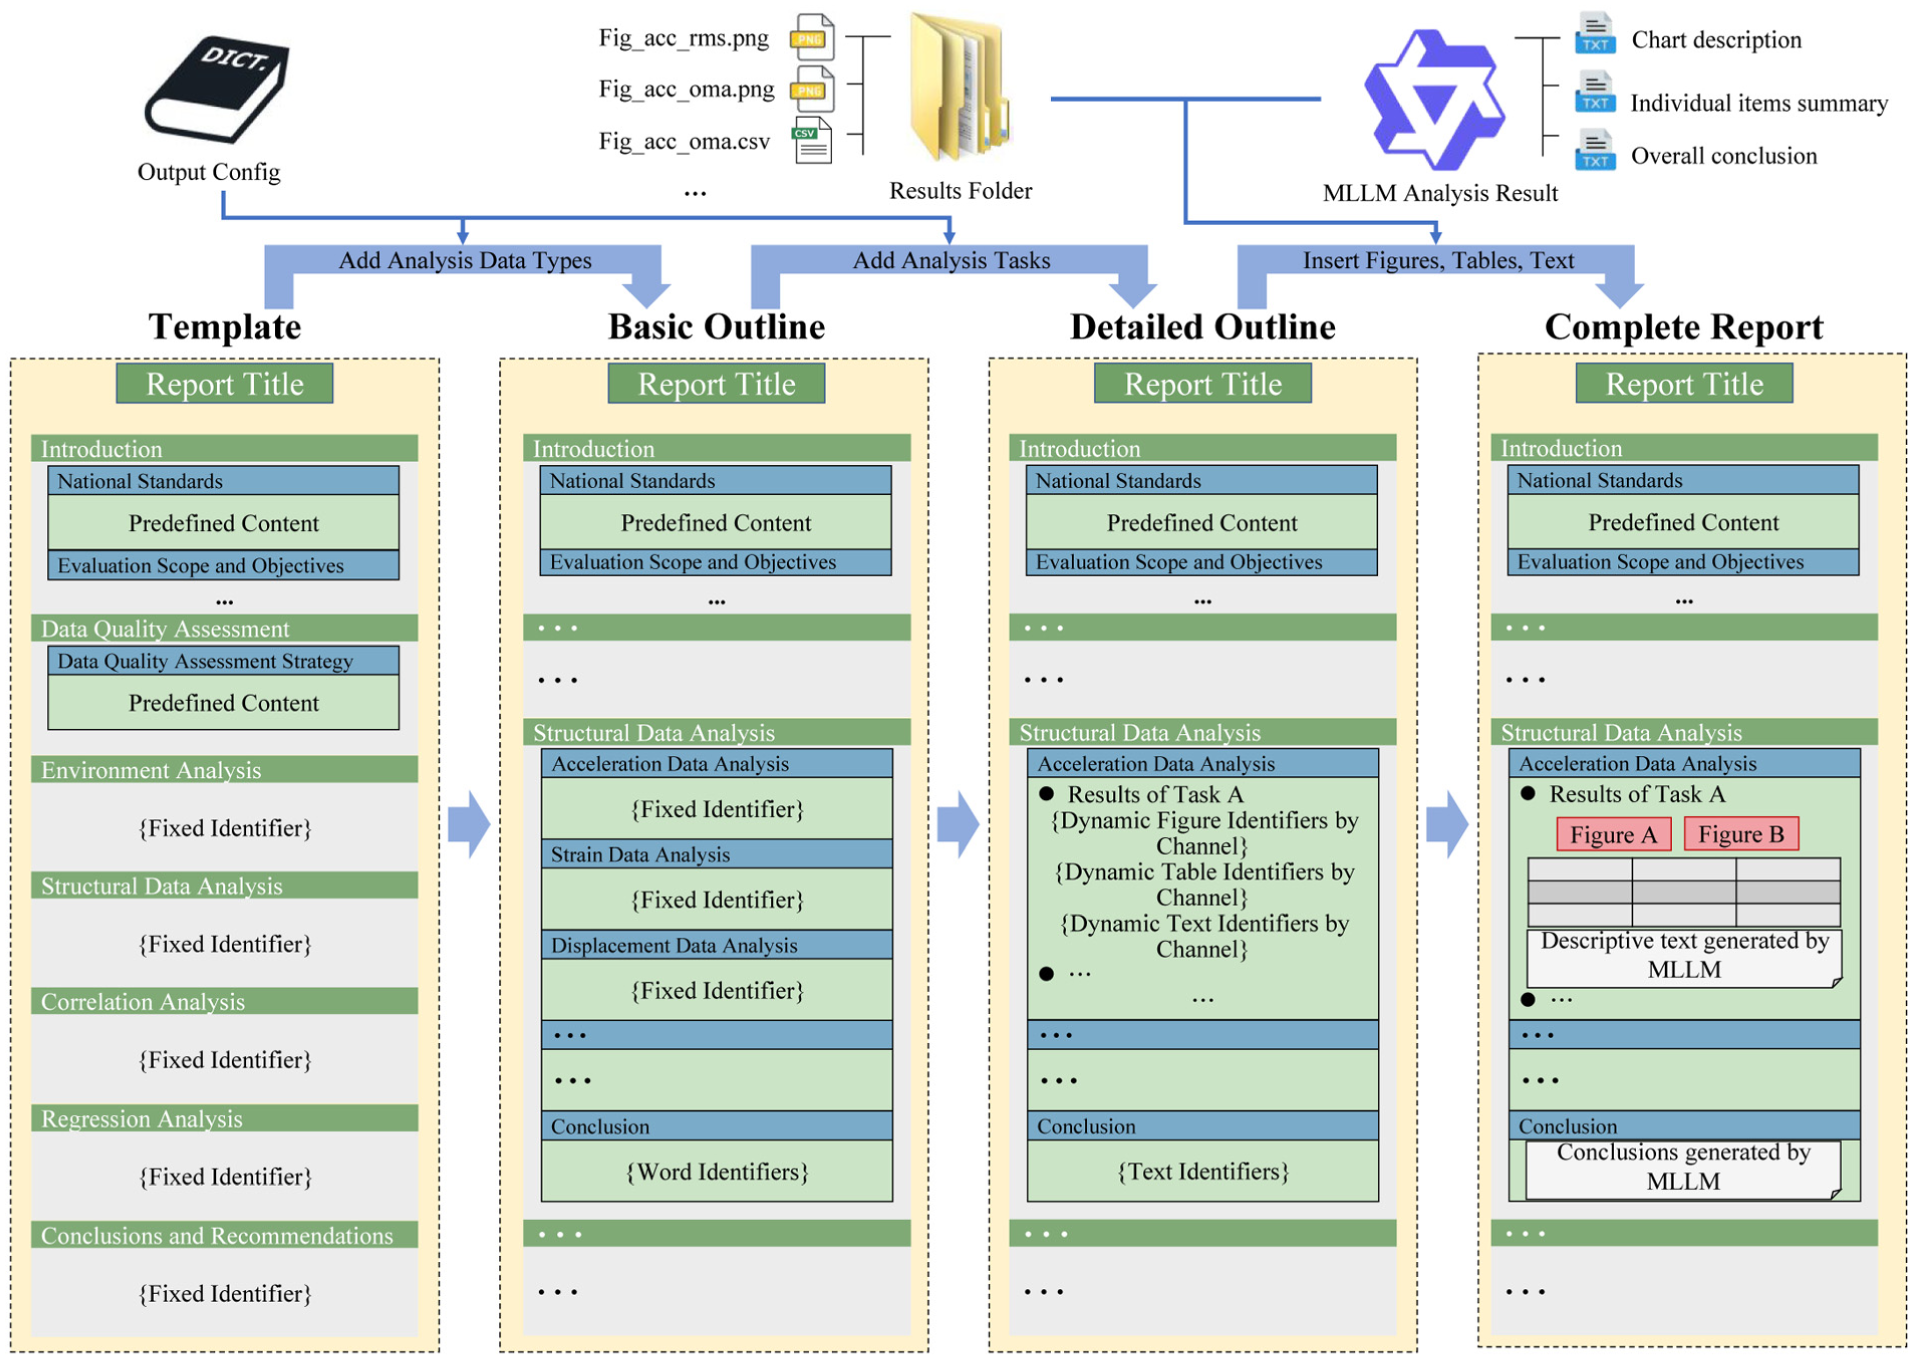
Steps for report generation.
To enable fully automated and standardized report generation, an SHM assessment report template was designed with reference to relevant codes. 24 The template contains preset content common to all projects and fillable sections for inserting bridge-specific analysis outputs. These fillable sections are marked in the template by a set of fixed identifiers, which define the insertion locations and serve as the anchors for automated placement. During report construction, the system first uses the fixed identifiers in the template to retrieve and assemble text modules dynamically, according to the data types and analysis tasks, thereby forming a basic outline. The outline is then refined into a detailed outline based on the specific analysis tasks present in each data type. At this stage, unlike the fixed identifiers used in the basic outline, the detailed outline employs dynamic identifiers (e.g., dynamic figure identifiers by channel) generated from the output configuration dictionaries. These dynamic identifiers label the figures, tables, and narrative elements to be inserted and are in strict one-to-one correspondence with the chart outputs produced by the automated monitoring data analysis module and the textual outputs produced by the MLLM-based hierarchical interpretation module. Finally, guided by the dynamic identifiers, the system inserts the automatically generated figures and tables and the MLLM-generated narrative text, thereby completing the SHM assessment report. This workflow ensures consistency while retaining flexibility, enabling scalable and generalizable reporting across diverse monitoring scenarios.
MLLM-based hierarchical interpretation
The preceding automated analysis module generates a high volume of figures and tables, but these raw outputs require expert interpretation to become actionable assessment results. This translation from quantitative graphics to qualitative insight represents the primary bottleneck in fully automated SHM workflows. Accordingly, this section introduces a novel framework that leverages a domain-adapted MLLM to replace this manual, expert-driven interpretation process. The objective is to automate the core cognitive workflow, from visual data interpretation to the generation of intelligent and efficient SHM assessment reports.
Hierarchical reasoning-based monitoring assessment
In expert-written reports, the summarization process typically follows a layered structure: first, the analysis results across different channels within a data type (e.g., RMS values of acceleration channels) are synthesized; then, results from various analytical tasks are aggregated to characterize the behavior of that data type; finally, summaries of different data types are integrated, along with correlation and regression analyses, to produce an overall evaluation of the structural condition. This process reflects a stepwise abstraction from local observations to global conclusions.
To emulate domain-specific reasoning and enhance the professional interpretability of MLLM, this study proposes a hierarchical reasoning framework for structural evaluation, comprising Visual Information Extraction, Analytical Synthesis, and Global Structural Evaluation (GSE). The process begins with visual information extraction, where key features are automatically extracted from figures and transformed into interpretable textual descriptions. This is followed by analytical synthesis, in which results from multiple channels and analytical tasks are structurally organized and semantically summarized to form intermediate, engineering-relevant knowledge. Finally, the GSE phase integrates various types of monitoring data along with their interrelationships to produce a comprehensive assessment of the structural operational state. Reasoning is implemented by aligning features/anomalies/trends from upstream analytical summaries with changes in inter-indicator correlations over matched channels and time windows, and by using evidence-oriented prompts that require conclusions to be grounded in the provided materials, thereby minimizing hallucinations and producing conclusions supported by explicit chains of evidence. The complete analytical workflow is illustrated in Figure 12.
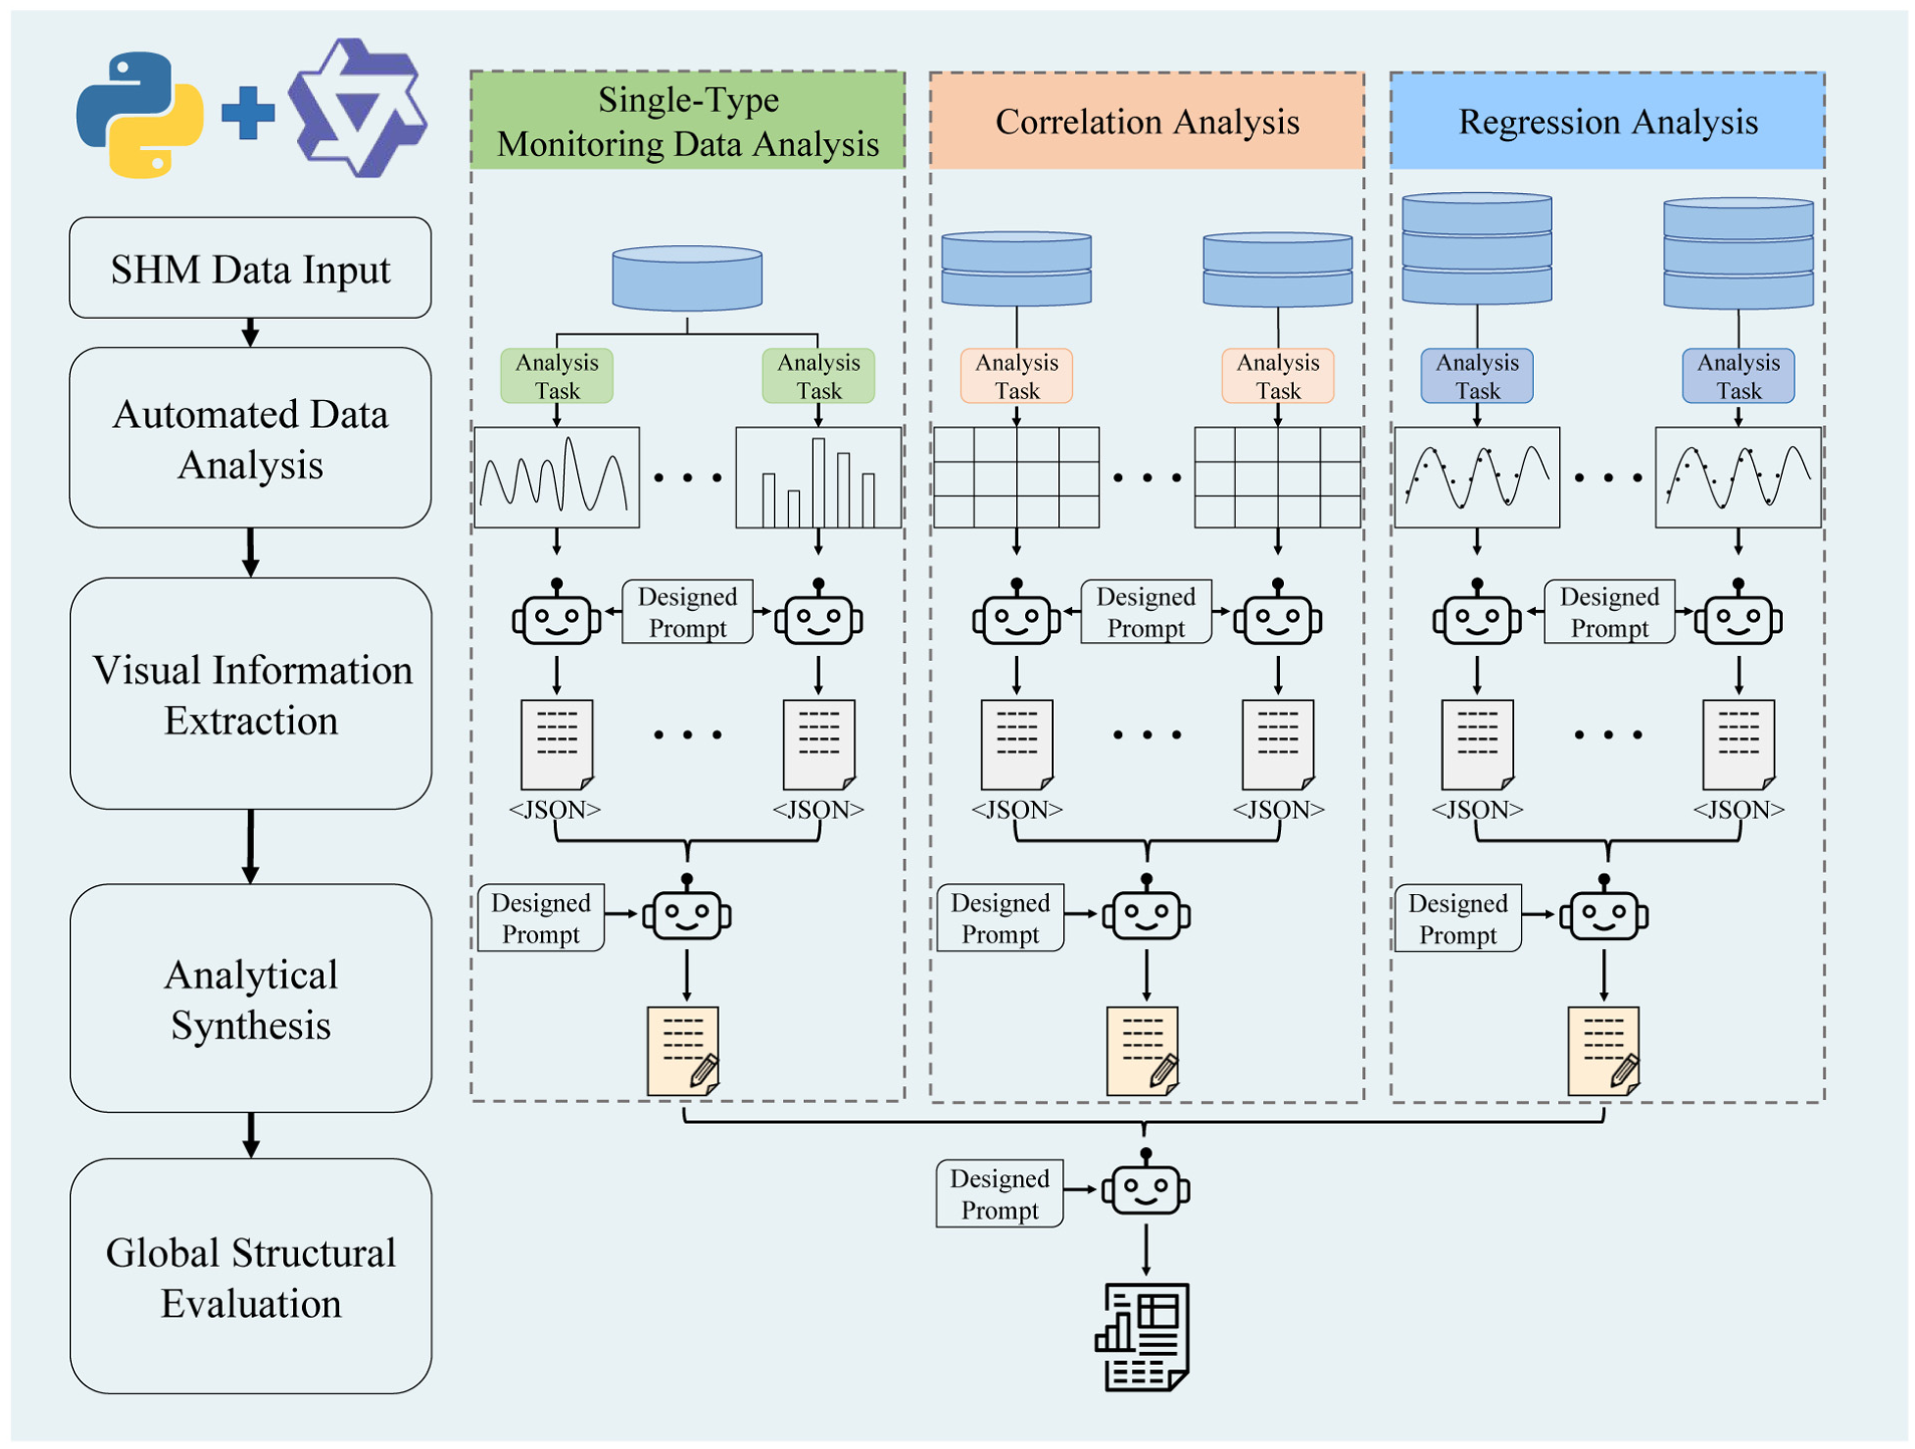
Hierarchical reasoning workflow.
Dataset construction
While pretrained LLMs exhibit impressive general-purpose language capabilities, they fall short in specialized domains like structural safety evaluation. Their training on massive, generic corpora leads to two critical limitations for SHM applications: (1) a lack of deep domain knowledge and an inability to interpret specialized semantics, which compromises the accuracy and reliability of their outputs64; and (2) their immense size and computational cost make them impractical for direct deployment in typical SHM systems. To overcome these barriers, this study adopts the strategy of domain-specific fine-tuning. By adapting a smaller and more efficient model to a high-quality, task-oriented dataset, improvements in domain relevance, accuracy, and practical effectiveness can be achieved, thereby enabling a cost-effective and deployable solution.
A key prerequisite for fine-tuning is the construction of a high-quality, task-oriented dataset. Given the complexity of the tasks in this study, which spans visual information extraction, textual summarization, trend identification, and structural state evaluation, and the absence of publicly available multimodal datasets tailored to this scenario, a custom dataset was developed.
The custom dataset was constructed through a three-step pipeline. First, a diverse pool of raw analytical materials was generated. Long-term monitoring data from four distinct bridges (Table 2, Figure 13) were processed using the proposed automated analysis framework, yielding a large set of outputs, including time-series plots, statistical summaries, and correlation/regression results, segmented across various time windows (e.g., monthly, annually).
Information on the four bridges used for dataset construction.
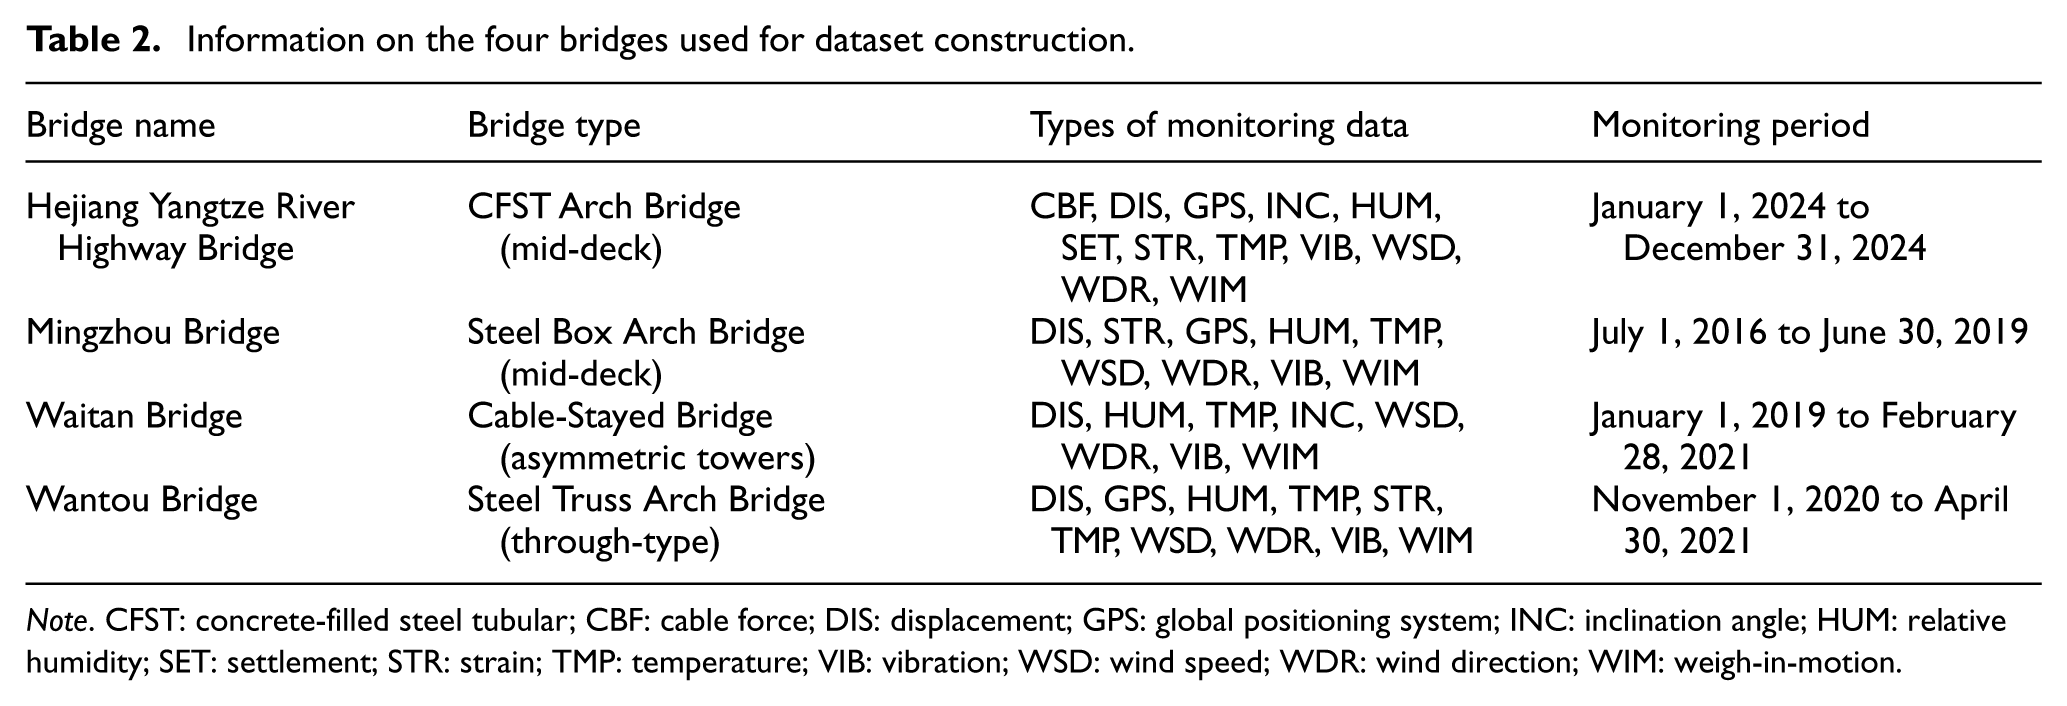
Note. CFST: concrete-filled steel tubular; CBF: cable force; DIS: displacement; GPS: global positioning system; INC: inclination angle; HUM: relative humidity; SET: settlement; STR: strain; TMP: temperature; VIB: vibration; WSD: wind speed; WDR: wind direction; WIM: weigh-in-motion.
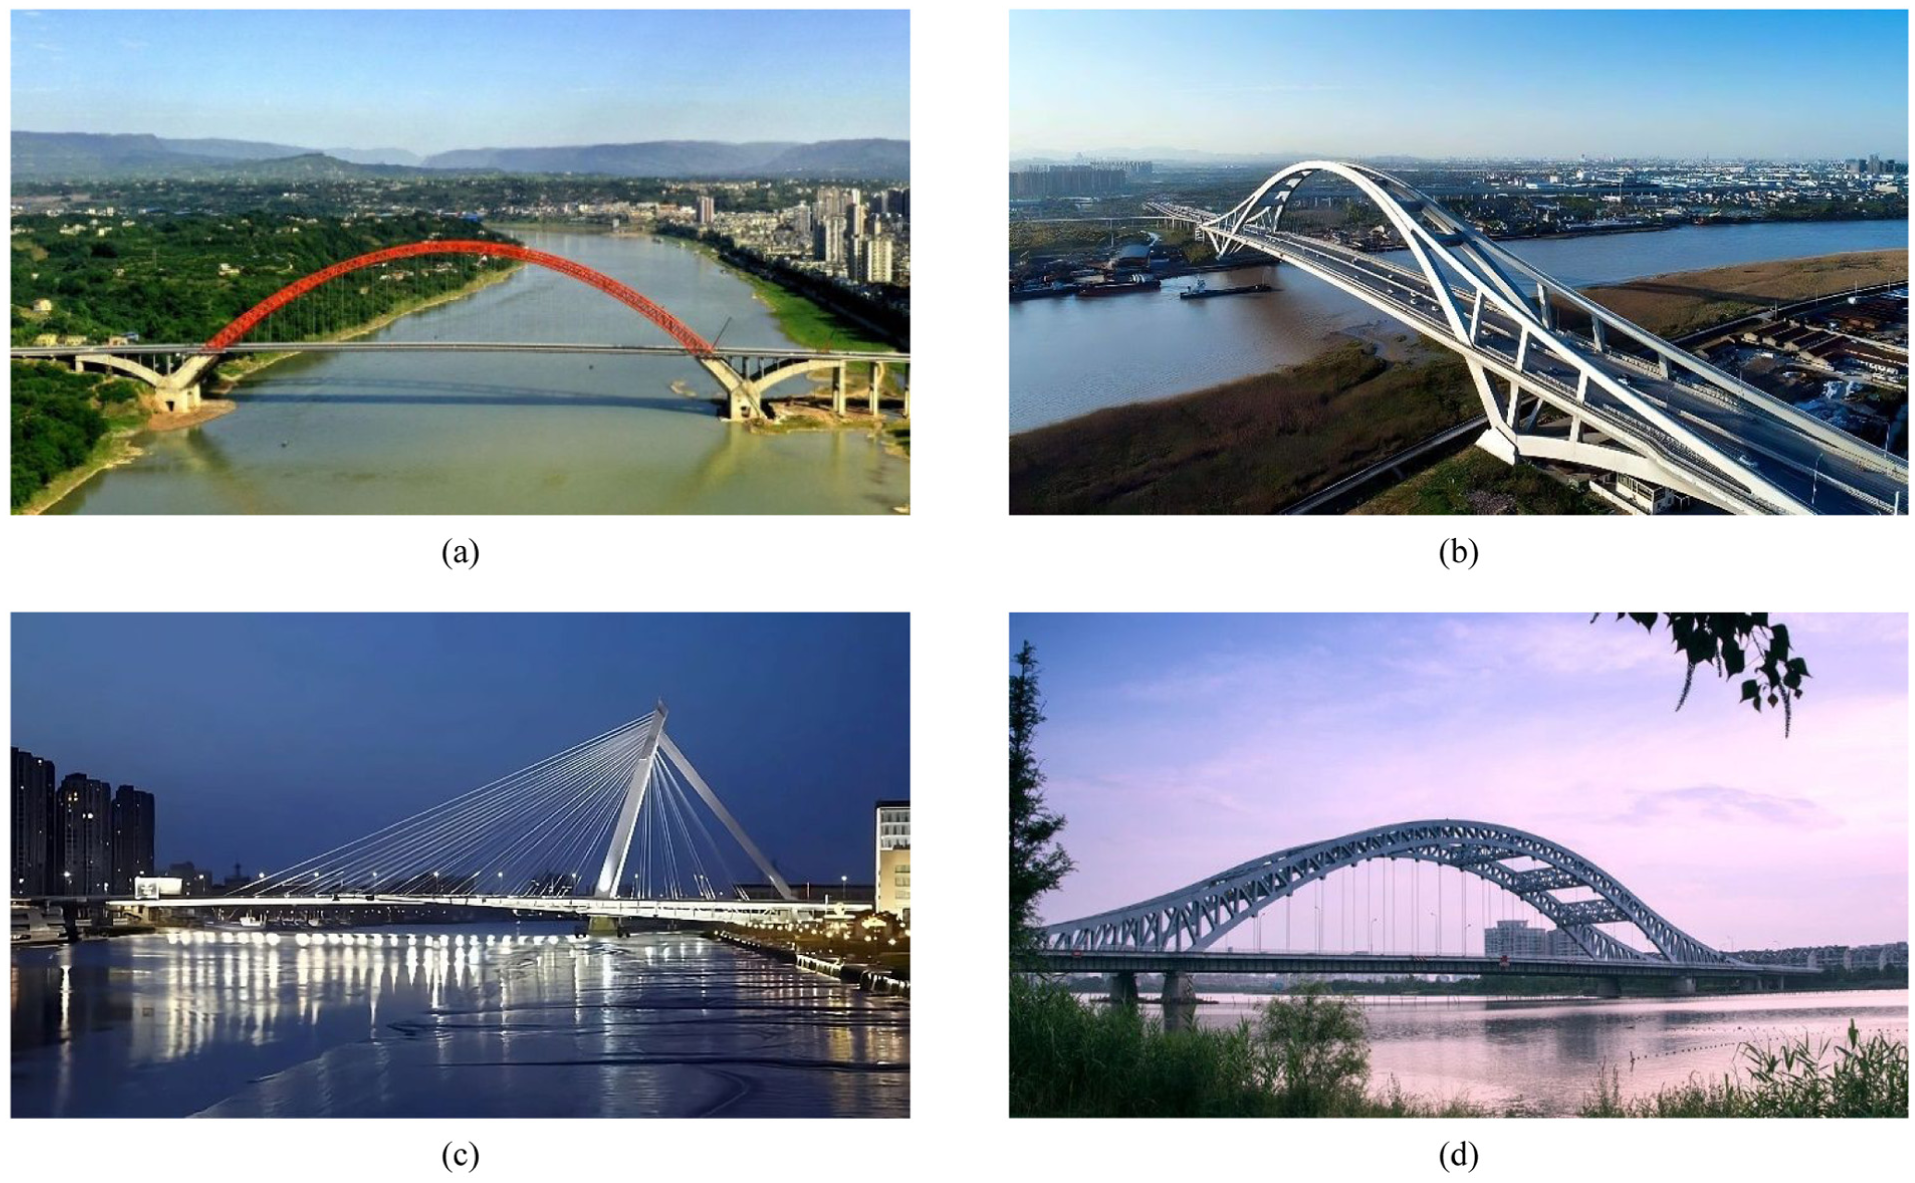
Photos of the bridges used for dataset construction: (a) Hejiang Yangtze River Highway Bridge, (b) Mingzhou Bridge, (c) Waitan Bridge, and (d) Wantou Bridge.
Second, high-quality labels for these outputs were generated and refined. The Gemini 2.5 MLLM, a powerful proprietary model, 65 was employed to create initial textual interpretations based on the proposed hierarchical reasoning framework. These machine-generated drafts were then meticulously reviewed and refined by human experts to ensure professional accuracy and data quality, forming the basis of the fine-tuning samples. Gemini 2.5 was used only to assist in generating high-quality initial draft labels during dataset construction. This selection was motivated by its strong multimodal understanding and generation capability, which is beneficial for producing higher-quality draft annotations for complex SHM outputs and reducing the workload of subsequent expert review and revision. To further enhance the quality and mitigate model hallucinations, advanced prompt engineering strategies 66 were integrated into this process. Techniques such as chain of thought (CoT) 67 and self-consistency 68 were used to structure the prompts, guiding the model to emulate expert reasoning by breaking down complex tasks into logical, transparent steps. This ensured the final labels were not only accurate but also logically coherent and robust, making them ideal for training a domain-specific model.
At the first level, visual information extraction, standardized JSON objects are employed as the output format. This design offers three main advantages. First, it provides a structured and precise representation, translating visual information into unambiguous atomic facts via key-value pairs, thereby facilitating subsequent computational processing and aggregation. Second, it ensures reproducibility, since the predefined JSON schema functions as a standardized data extraction protocol, guaranteeing transparency and repeatability. Finally, it promotes extensibility, with JSON serving as a universal interface that decouples analytical modules, thus supporting a flexible and scalable research framework. For the second and third levels, the more advanced CoT processes of induction and summarization are guided by predefined text-report templates. This structure enforces an expert-driven logic of “first analyze components, second synthesize globally, and third provide recommendations,” ensuring the professionalism and consistency of the final output. The prompts are organized in a dialogue-style form according to the proposed hierarchical reasoning framework: Figure 14(a) and (b) uses image-and-text inputs for lower-level visual interpretation, whereas Figure 14(c) and (d) use text-only inputs for higher-level synthesis and evaluation. Each prompt is mainly structured by three components, namely role, task, and output format. In this context, the generated recommendations are restricted to maintenance-support suggestions supported by the provided monitoring evidence, rather than unrestricted engineering prescriptions. The detailed prompt design is presented in Figure 14.
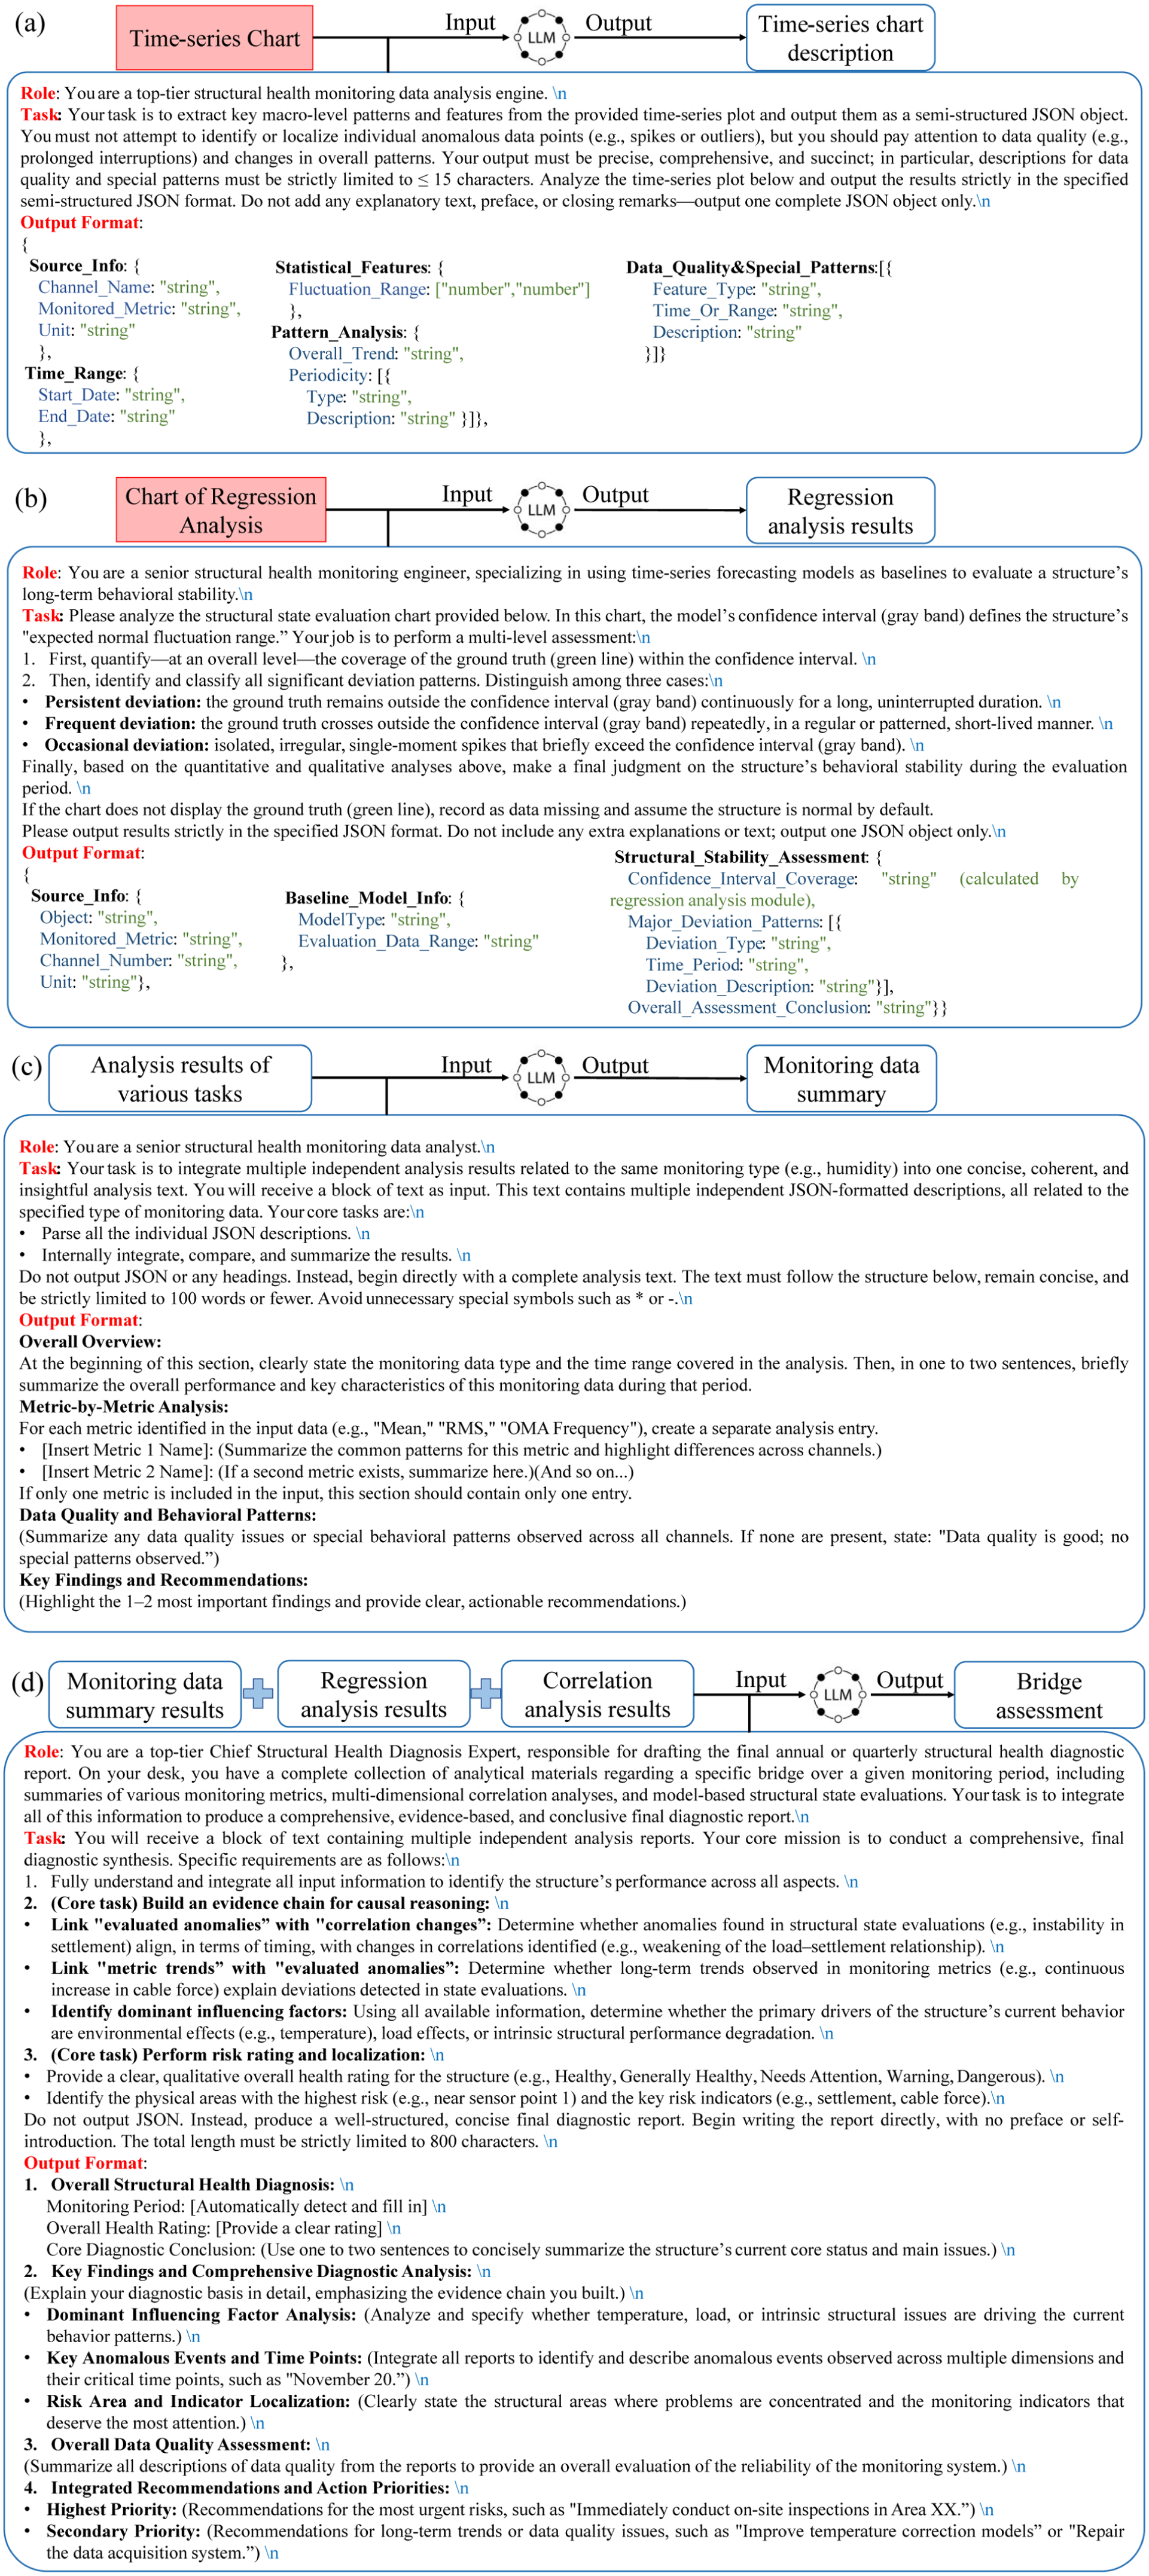
Prompts for the hierarchical reasoning framework: (a) and (b) visual information extraction prompt, (c) analytical synthesis prompt, and (d) GSE prompt. GSE: global structural evaluation.
Recognizing that real-world monitoring datasets are often characterized by a significant positive sample skew due to the predominantly healthy state of engineering structures, data augmentation was applied to construct a more balanced and robust training set. A large number of negative samples were generated by artificially introducing simulated anomalies, such as trend components, step drifts, and noise disturbances, into the original positive samples, so that the resulting samples departed from normal fluctuation patterns. This process substantially enhanced dataset diversity and improved model generalization, while serving primarily as a data-balancing strategy rather than a strict simulation of specific physical damage mechanisms.
More specifically, the numbers of augmented abnormal samples were 14,407 for the Visual Information Extraction level, 1704 for the Analytical Task Integration level, and 78 for the GSE level. After augmentation and hierarchical dataset construction, the final instruction fine-tuning dataset comprised 31,930 samples in total, including 28,346 samples for the Visual Information Extraction level, 3427 for the Analytical Task Integration level, and 157 for the GSE level.
Here, the generated labels are not simple class annotations, but task-oriented textual targets corresponding to different levels of the proposed hierarchical reasoning framework. Figure 15 illustrates the structure of a sample from the training dataset for the visual information extraction task. Due to the large token lengths of individual samples in the analytical synthesis and GSE tasks, only key parts of a specific example from GSE tasks are shown in the Figure 16 (with different colors indicating the causal reasoning and chain of evidence mechanisms). The full version of this example can be found in the corresponding GitHub repository in the data and code availability statement in the seventh section.
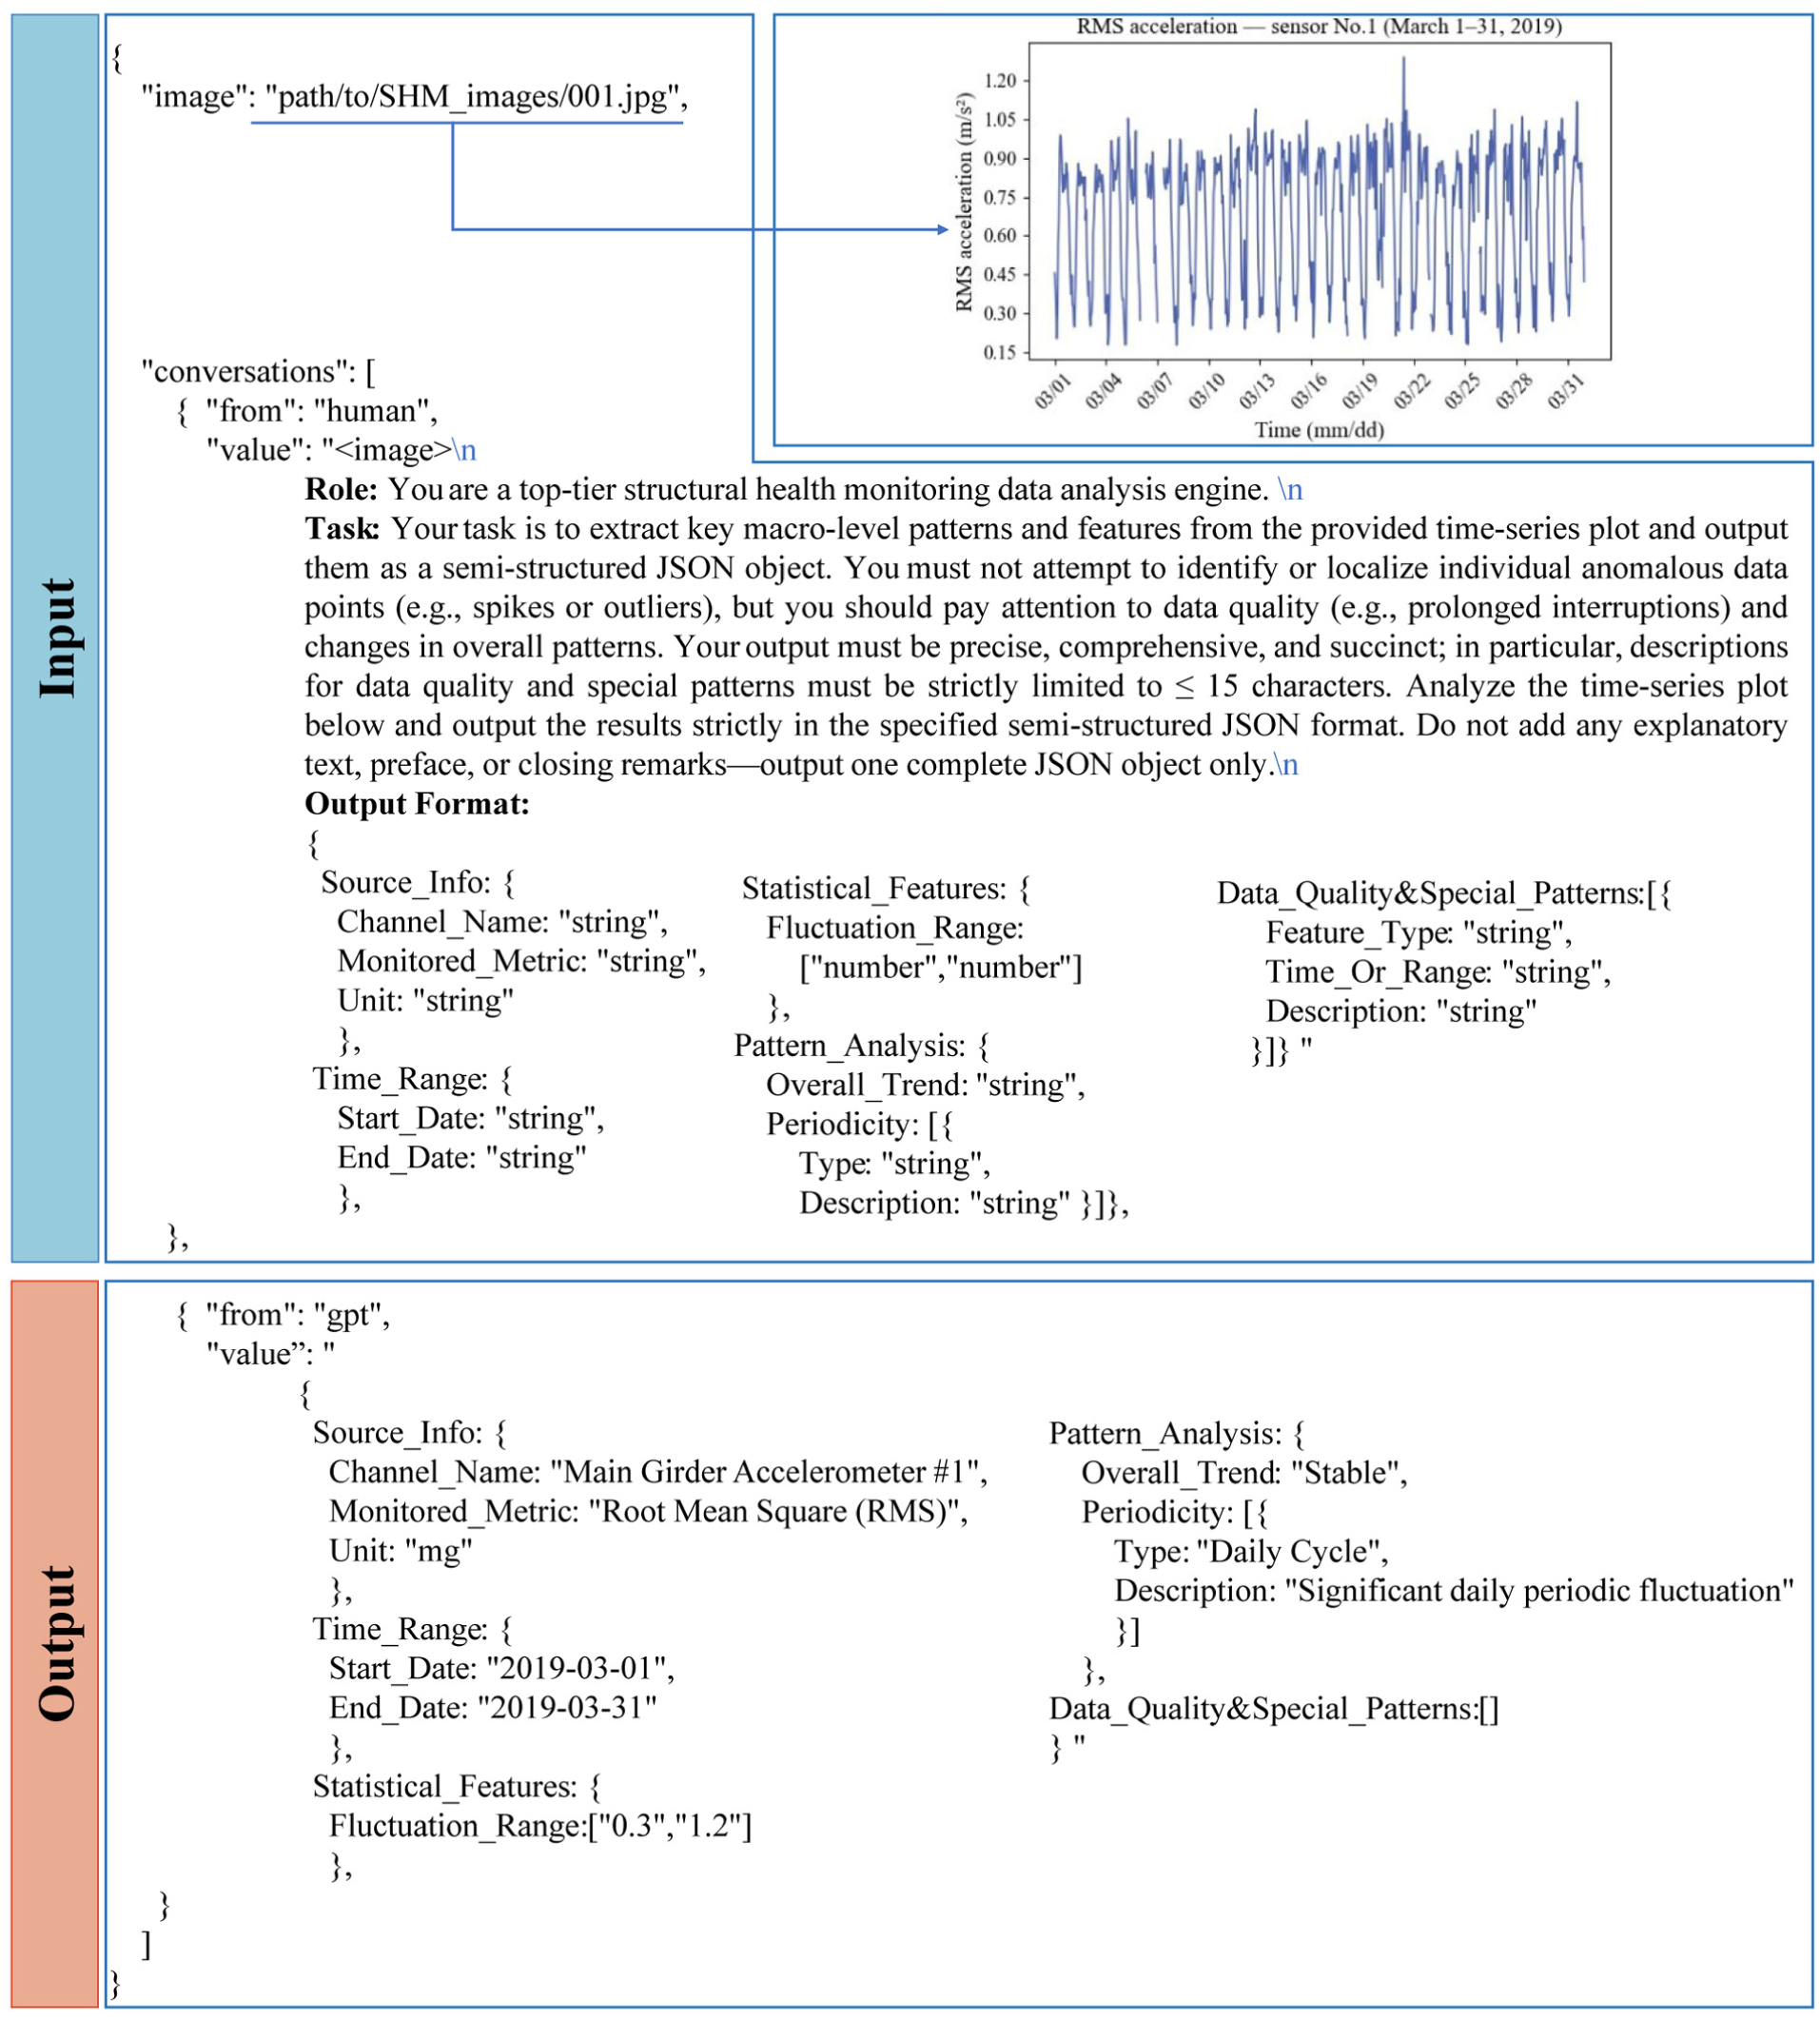
Representative fine-tuning sample structure for the visual information extraction task.
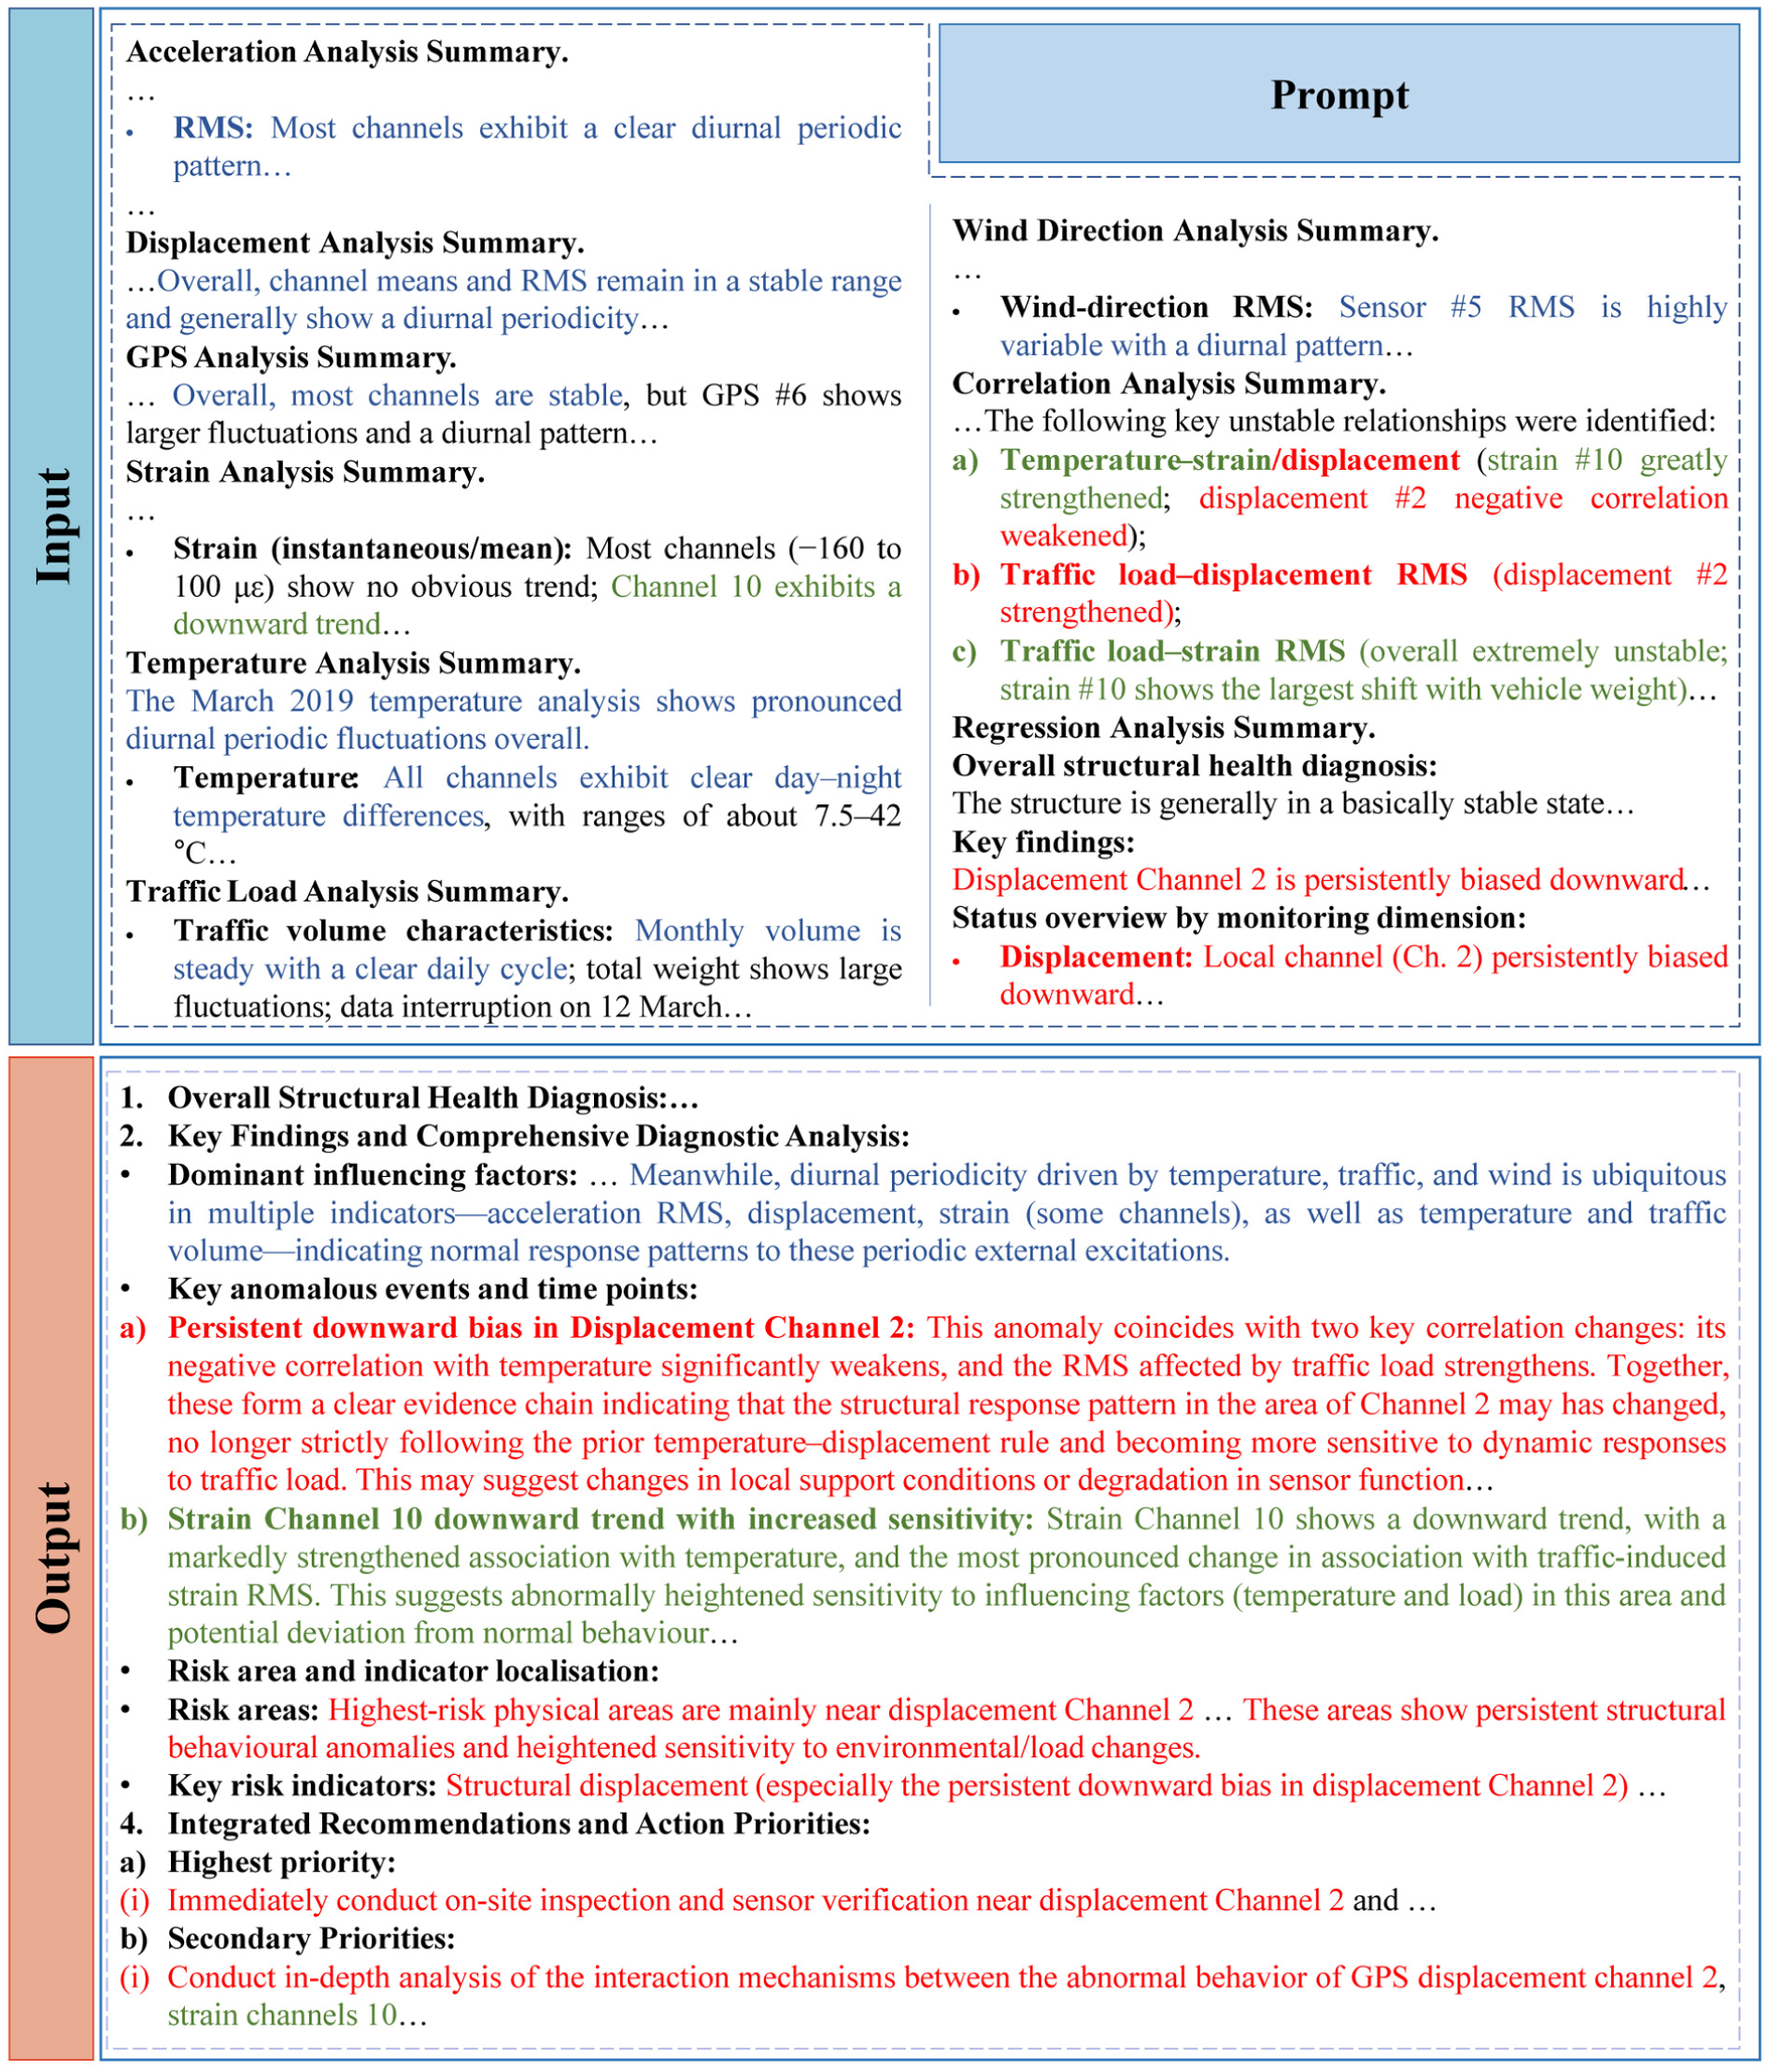
Key parts of a representative fine-tuning sample for the GSE task. GSE: global structural evaluation.
MLLM fine-tuning process
Following the construction of a high-quality questionanswer (QA) dataset tailored to the task, the base MLLM was further fine-tuned to enhance its domain-specific performance in bridge SHM and assessment. The selected foundation model was Qwen-2.5-VL-3B, an MLLM developed by Alibaba, which has demonstrated strong performance across multiple mainstream benchmarks for multimodal tasks. 49 Qwen-2.5-VL-3B was chosen for fine-tuning and downstream inference because the Qwen series is open-source and provides compact multimodal variants, making domain adaptation more practical under moderate hardware resource constraints.
During fine-tuning, the PEFT method known as low-rank adaptation (LoRA) was adopted. LoRA enables efficient model adaptation by freezing most parameters and introducing trainable low-rank matrices to approximate updates, significantly reducing computational cost while preserving model performance. 69 This method is especially well-suited for targeted optimization of LLMs in complex, multimodal tasks such as those addressed in this study.
Finally, 80% of the dataset constructed in “Dataset construction” section was randomly selected for training, 10% for validation, and 10% for testing. The LoRA fine-tuning was conducted using the following settings: batch size=1, gradient accumulation steps = 8, max steps = 5350, LoRA rank=8, cutoff length=4950, precision = bf16 (bfloat16), and learning rate = 1e-5.
Due to memory limitations, the batch size was set to 1. To compensate, gradient accumulation was applied over eight steps. In addition, bf16 precision was employed to reduce memory consumption and accelerate training. A low learning rate was used to mitigate overfitting and promote stable learning, and the total training steps were set to 5350, ensuring 50 full passes over the dataset.
In total, 0.4923% of the model parameters were updated during fine-tuning—namely, 18,576,384 trainable parameters out of 3,773,199,360 in Qwen-2.5-VL-3B. The fine-tuning process lasted about 65 h, achieving notable improvements in the model’s domain-specific adaptability under constrained training resources, and was conducted on 8 NVIDIA RTX 3090 GPUs.
The training and validation loss curves are shown in Figure 17. The sharp decrease in the loss curves suggests that the model is effectively acquiring domain-specific knowledge from the dataset.
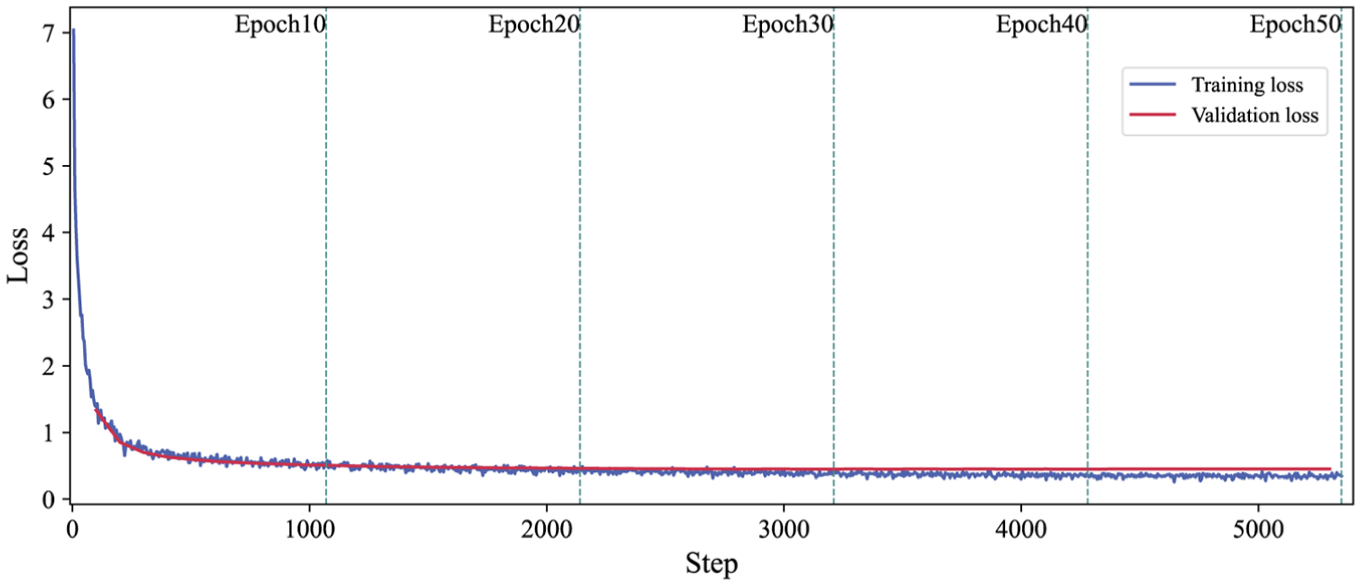
Training and validation loss curves during fine-tuning process.
MLLM evaluation
After model training, a comprehensive performance evaluation was conducted on the test set. Recognizing that automated metrics alone are insufficient to capture engineering-specific correctness, the evaluation combined two complementary approaches: standard automated metrics and rigorous expert human evaluation.
The first approach involved four widely accepted automated metrics: BLEU-4, ROUGE-1, ROUGE-2, and ROUGE-L. These metrics provide a quantitative measure of textual fluency and word-level consistency with reference texts by assessing n-gram or sequence overlap.70,71 Second, to address the limitations of automated metrics, a blind human evaluation was conducted. Given the labor-intensive nature of expert evaluation, a representative subset of the test set was randomly selected for this task, comprising 50 samples for the visual information extraction tasks, 30 for the analytical task integration task, and 10 for the GSE task, reflecting the increasing complexity and evaluation depth required at each successive layer. On this subset, two senior SHM experts rated the outputs of all models across the three hierarchical reasoning layers on a five-point scale, focusing on critical dimensions such as factual accuracy, logical coherence, and engineering correctness. In addition, to further evaluate the reliability of high-level diagnostic outputs, an evidence-grounding evaluation was conducted for the GSE task. This evaluation was aligned with the predefined GSE output format and examined eight key diagnostic elements, including overall health rating, core diagnostic conclusion, dominant influencing factor analysis, key anomalous events and time points, risk area, key risk indicator, highest-priority action, and secondary-priority action. Each item was judged as supported, partially supported, or unsupported based on its evidential support, corresponding to scores of 5, 3, and 0, respectively. The final evidence grounding score (EGS) was calculated as the average across these eight categories. This additional evaluation was applied only to GSE, because reliability concerns are most critical at the final diagnostic stage, where the model is required to produce integrated conclusions, risk localization, and action recommendations.
To comprehensively evaluate the fine-tuned model, its performance was benchmarked against its base version and three widely used commercial MLLMs: Qwen-Omni-Turbo, Qwen-VL-Max, and GLM-4V-Plus. These commercial models were selected as they represent the state-of-the-art (SOTA) in their respective multimodal domains.49,72 The complete results of this comparative analysis are summarized in Table 3 and visualized in Figure 18.
Performance comparison of models across metrics.
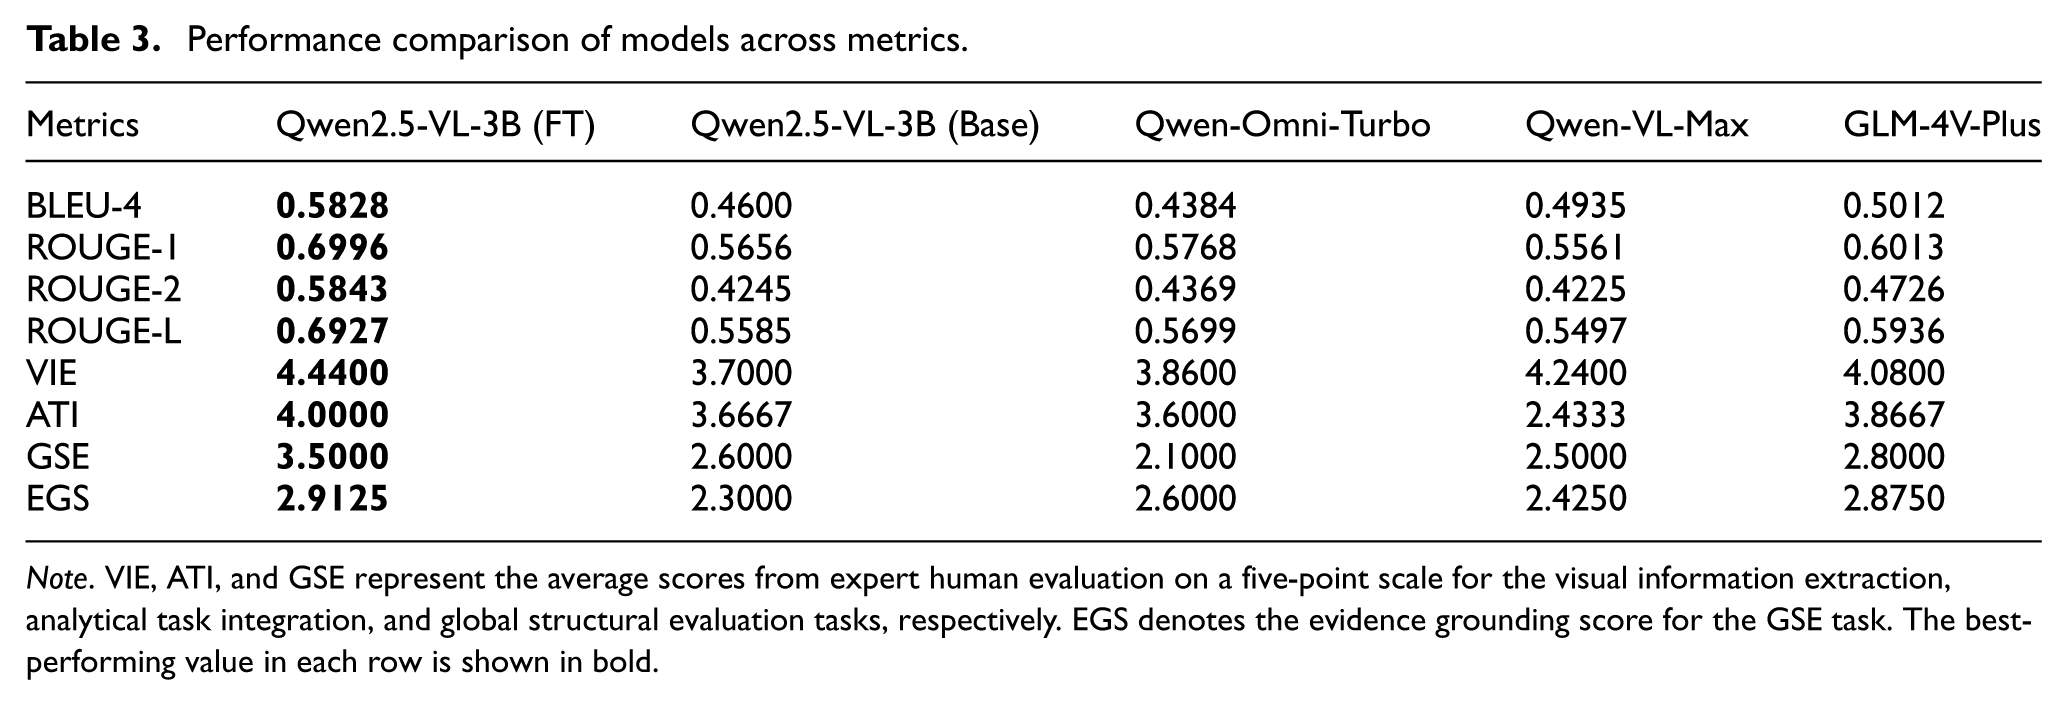
Note. VIE, ATI, and GSE represent the average scores from expert human evaluation on a five-point scale for the visual information extraction, analytical task integration, and global structural evaluation tasks, respectively. EGS denotes the evidence grounding score for the GSE task. The best-performing value in each row is shown in bold.
Bar chart of model performance across metrics.
The results unequivocally demonstrate the value of domain-adaptive fine-tuning. First, fine-tuning yields substantial improvements across both automated and human-evaluated metrics. As shown in Table 3, the fine-tuned MLLM achieved a BLEU-4 score of 0.5828 and a ROUGE-2 score of 0.5843, representing performance gains of 26.7 and 37.6% over its base model, respectively. This indicates a marked improvement in generating text that is structurally and stylistically aligned with expert-authored references.
Second, the fine-tuned model consistently outperforms the commercial benchmark models in this specialized domain. Compared to GLM-4V-Plus, the best-performing of the benchmarks, the fine-tuned model demonstrates a clear advantage in automated metrics. It scores higher by 0.0816 in BLEU-4 and 0.1117 in ROUGE-2. A similar advantage is observed in the human evaluation scores. For the most critical GSE task, the fine-tuned model achieved an average score of 3.50, surpassing the best commercial competitor by a margin of 0.7 points (a 25% relative improvement). Moreover, in the EGS, the fine-tuned model also achieved the highest score (2.9125), slightly exceeding GLM-4V-Plus (2.8750), indicating that its final high-level diagnostic conclusions were better supported by the provided evidence. These findings provide quantitative evidence that the fine-tuned model generates text with greater precision in domain-specific terminology, higher semantic consistency, and stronger evidence grounding. This indicates that the fine-tuned model is better tailored for the field of bridge SHM, whereas the outputs from the general-purpose commercial models tend to be more generic and less well grounded in the input evidence.
Case studies
This section evaluates the proposed framework from two complementary perspectives. First, a representative case study on the Mingzhou Bridge is presented to demonstrate the engineering feasibility and reporting capability of the framework. Second, additional applications to 10 in-service bridges with varying structural forms and monitoring configurations are presented to examine its computational efficiency, scalability, and adaptability across heterogeneous SHM systems. All case studies were executed on a single PC configured with an Intel Core i7-14700KF CPU, 32 GB RAM, and an NVIDIA GeForce RTX 4070 Ti SUPER GPU.
Representative case study on the Mingzhou Bridge
Bridge description
The case study focuses on the Mingzhou Bridge in Ningbo, China, a long-span steel box tied-arch bridge with a main span of 450 m (total arrangement: 100 + 450 + 100 m), as shown in Figure 19(a). The bridge is instrumented with a comprehensive SHM system designed to capture a wide array of data, making it an ideal testbed for the proposed framework. The system integrates various sensors, including a weigh-in-motion (WIM) system, an automatic weather station, global positioning system (GPS) sensors, accelerometers, displacement meters, and strain gauges. These sensors are strategically deployed to monitor key structural responses (e.g., global deflections, local vibrations, and strains), traffic loads, and environmental conditions. The detailed sensor layout is presented in Figure 19(b).
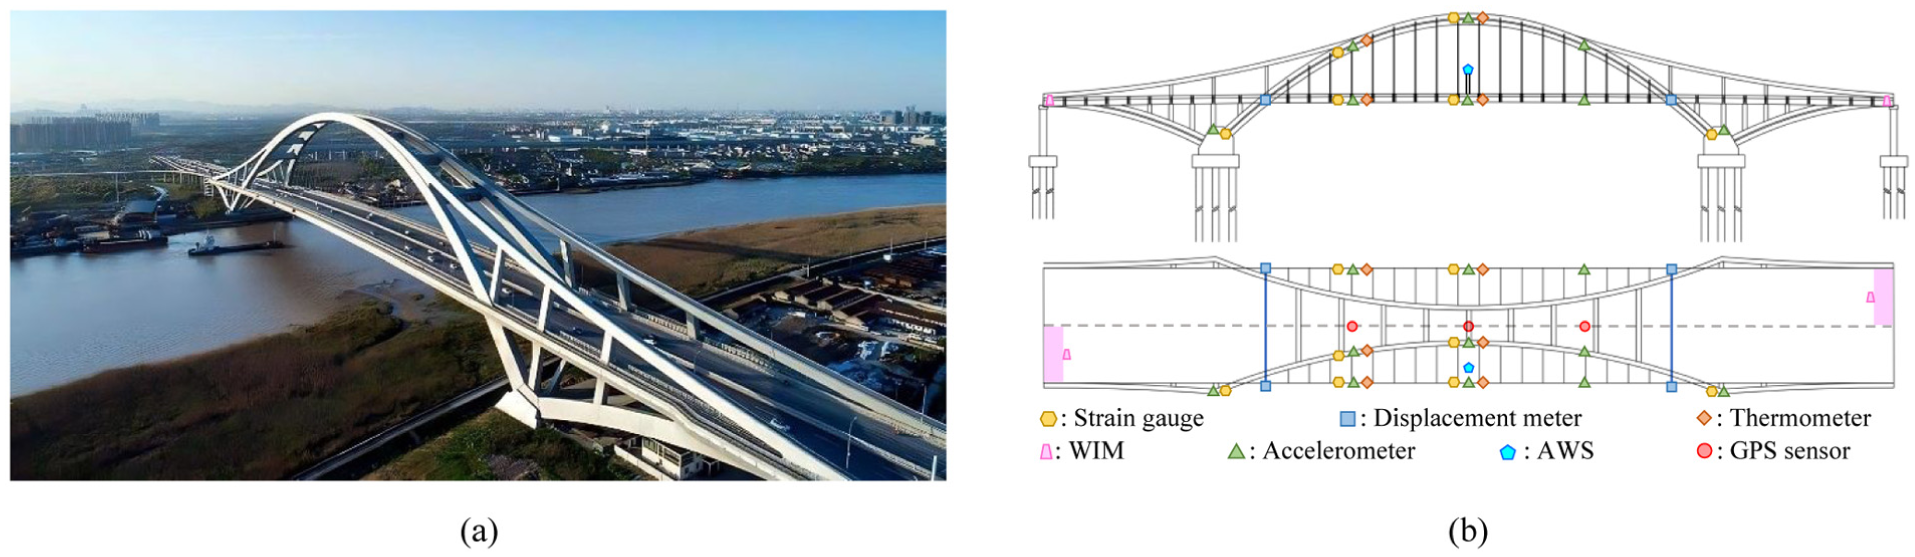
Overview of Mingzhou Bridge: (a) southwest side view and (b) sensor layout.
The selection of the Mingzhou Bridge as a representative case study is based on three key advantages. First, structural representativeness, as a prototypical example of long-span steel arch bridges. Second, comprehensiveness of the SHM system, as it is equipped with an integrated SHM system that covers multiple types of monitoring data. Third, uniqueness of events, as during the monitoring period the bridge underwent a major maintenance operation in which the main girder deck was entirely replaced, providing typical data reflecting changes in structural state. Therefore, the Mingzhou Bridge serves as an ideal experimental platform to verify the generalizability and robustness of the proposed method.
Definition of analysis configuration
For the SHM system of the Mingzhou Bridge, corresponding analysis configuration settings were developed and partial examples are illustrated in Figure 20. The analysis period spans from June 1, 2019, to June 1, 2020, and covers multiple data types, including wind speed and direction, GPS, acceleration, temperature, humidity, strain, displacement, and WIM. The specific analytical content for each data type is summarized in Table 1.
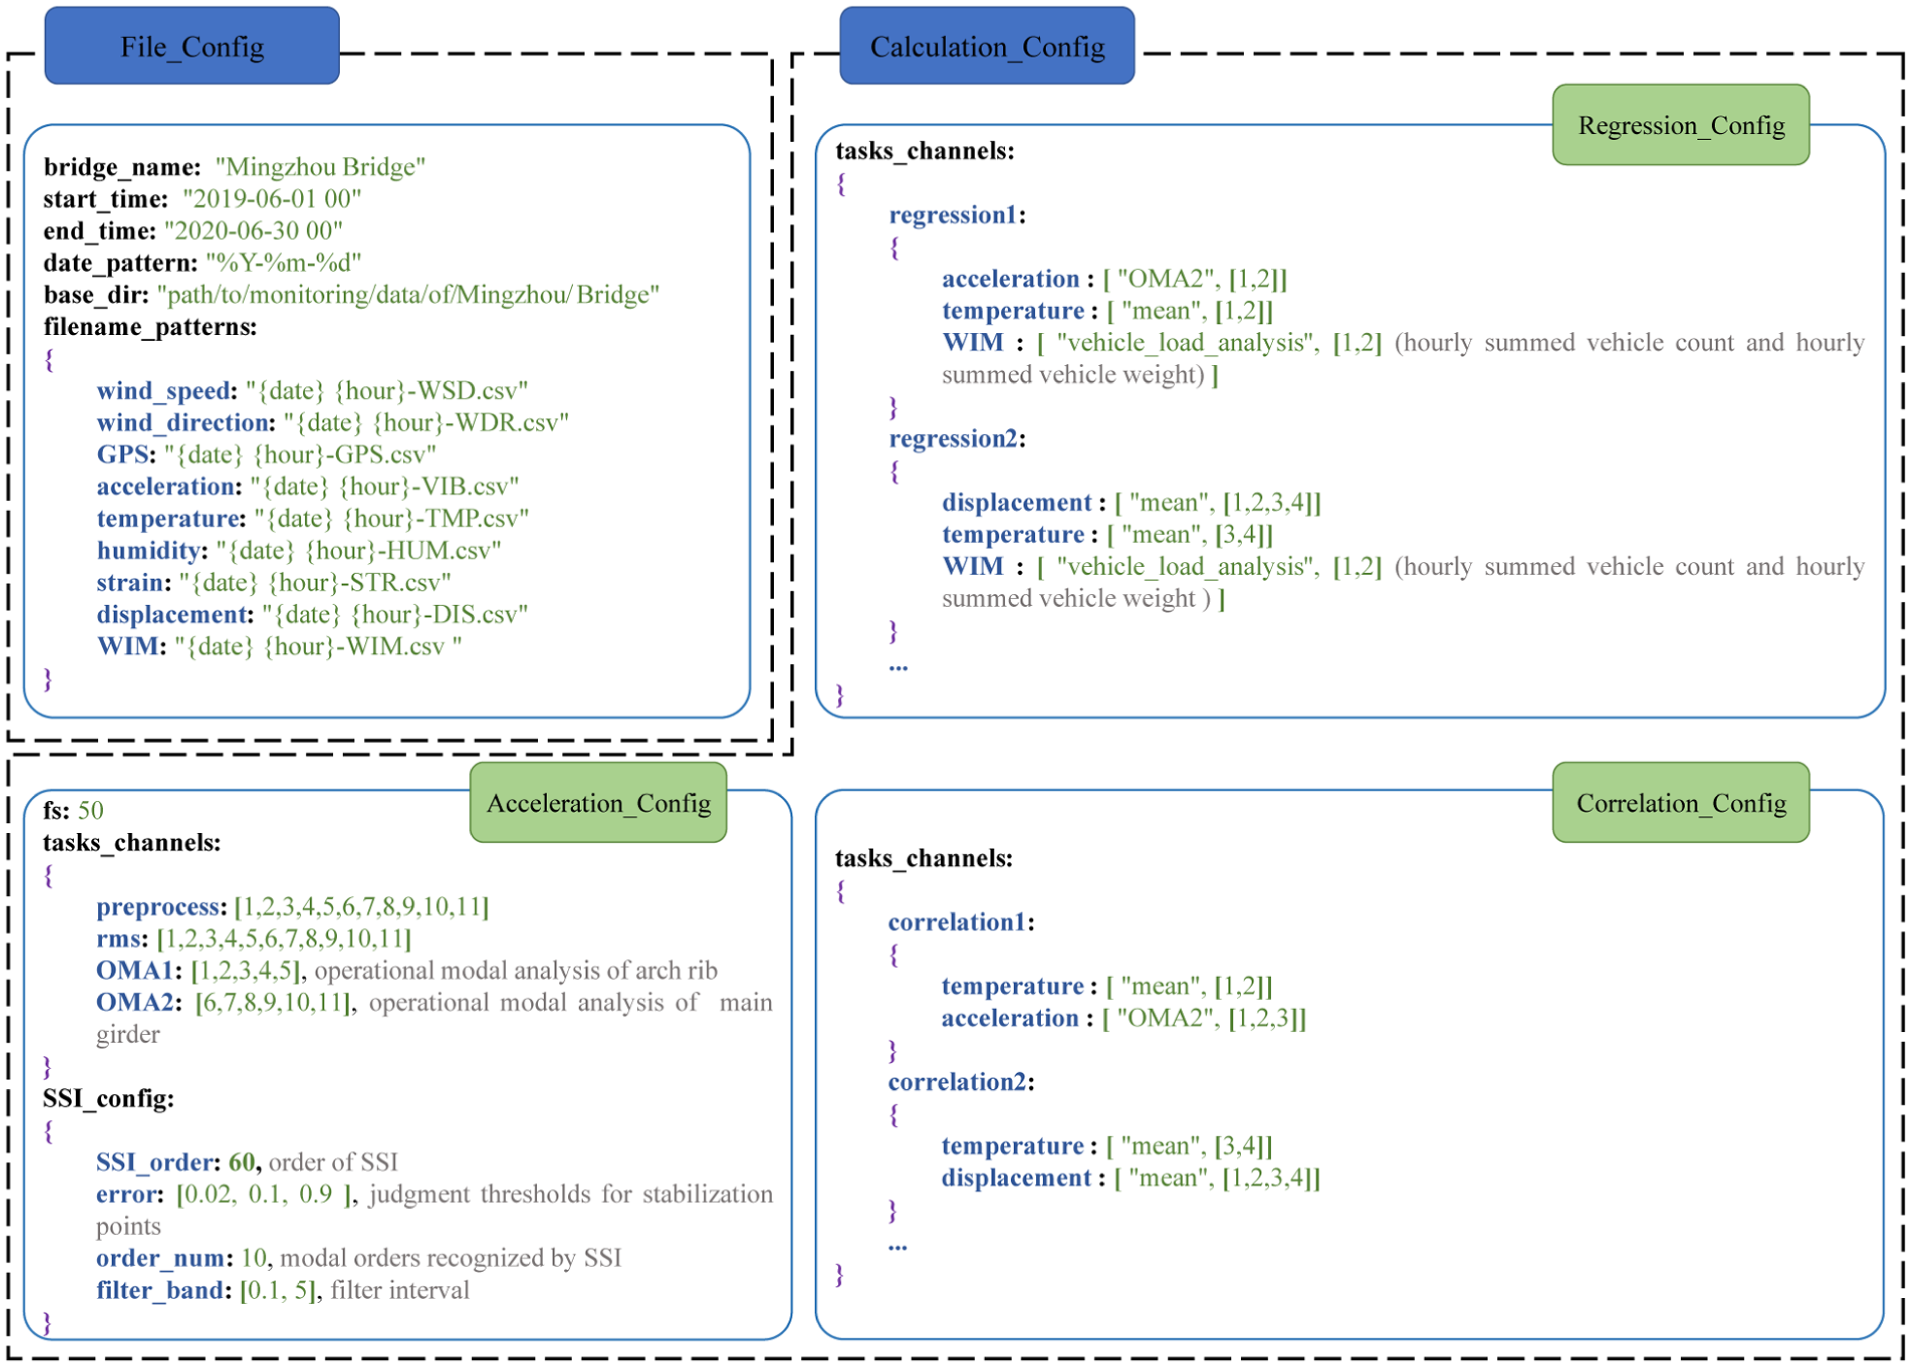
Analyzing configuration definition for Mingzhou bridge.
In terms of correlation analysis, one primary objective is to verify the physical consistency of the monitoring data. Numerous studies73,74 have demonstrated significant correlations between structural response parameters (such as natural frequencies, girder-end displacements, and strain) and environmental temperature. Therefore, this case study focuses on analyzing the correlation between the natural frequencies of the main girder and both temperature and traffic loads, as well as the correlation between girder-end displacement and temperature.
Regression analysis aims to establish predictive models under the structure’s “normal” operational state. By examining the residuals between future observed data and model predictions, potential structural degradation can be detected. For Mingzhou Bridge, the first two modal frequencies of the main girder were jointly regressed using WIM data and temperature data, enabling the prediction of the structure’s dynamic characteristics. Similarly, the mean strain values were modeled using the same variables to assess the stability of deformation behavior and identify potential evolutionary trends.
Analysis results
After completing the analysis configuration, the proposed automated analysis algorithm, in combination with the LoRA-fine-tuned MLLM, was employed to process and evaluate the SHM data of the Mingzhou Bridge. The total volume of raw data processed during analysis was approximately 400 GB. The entire automated analysis process took approximately 3 h, with the inference speed of the MLLM averaging around 70 tokens per second. These results indicate that, compared with model training, the deployment of the fine-tuned model on a local machine requires only conventional hardware resources to support practical applications. Due to space limitations, only selected representative results from the automated analysis and the model’s summarization and evaluation capabilities are presented in this article.
Figure 21 presents selected statistical results of traffic loading on the Mingzhou Bridge together with the interpretations and assessments produced by the fine-tuned MLLM. The traffic-loading evaluation covers traffic volume, vehicle categories, weight distribution, and lane usage. Based on a synthesis of all analytical outputs by the fine-tuned MLLM, global characteristics such as overall traffic volume, trends, and the probability density of vehicle weights were summarized accurately. That said, some features were omitted, including the daily vehicle count, locations of missing data. The primary cause is that certain information was omitted or simplified during the hierarchical summarization process. Overall, the MLLM’s summary is broadly consistent with the actual data characteristics.
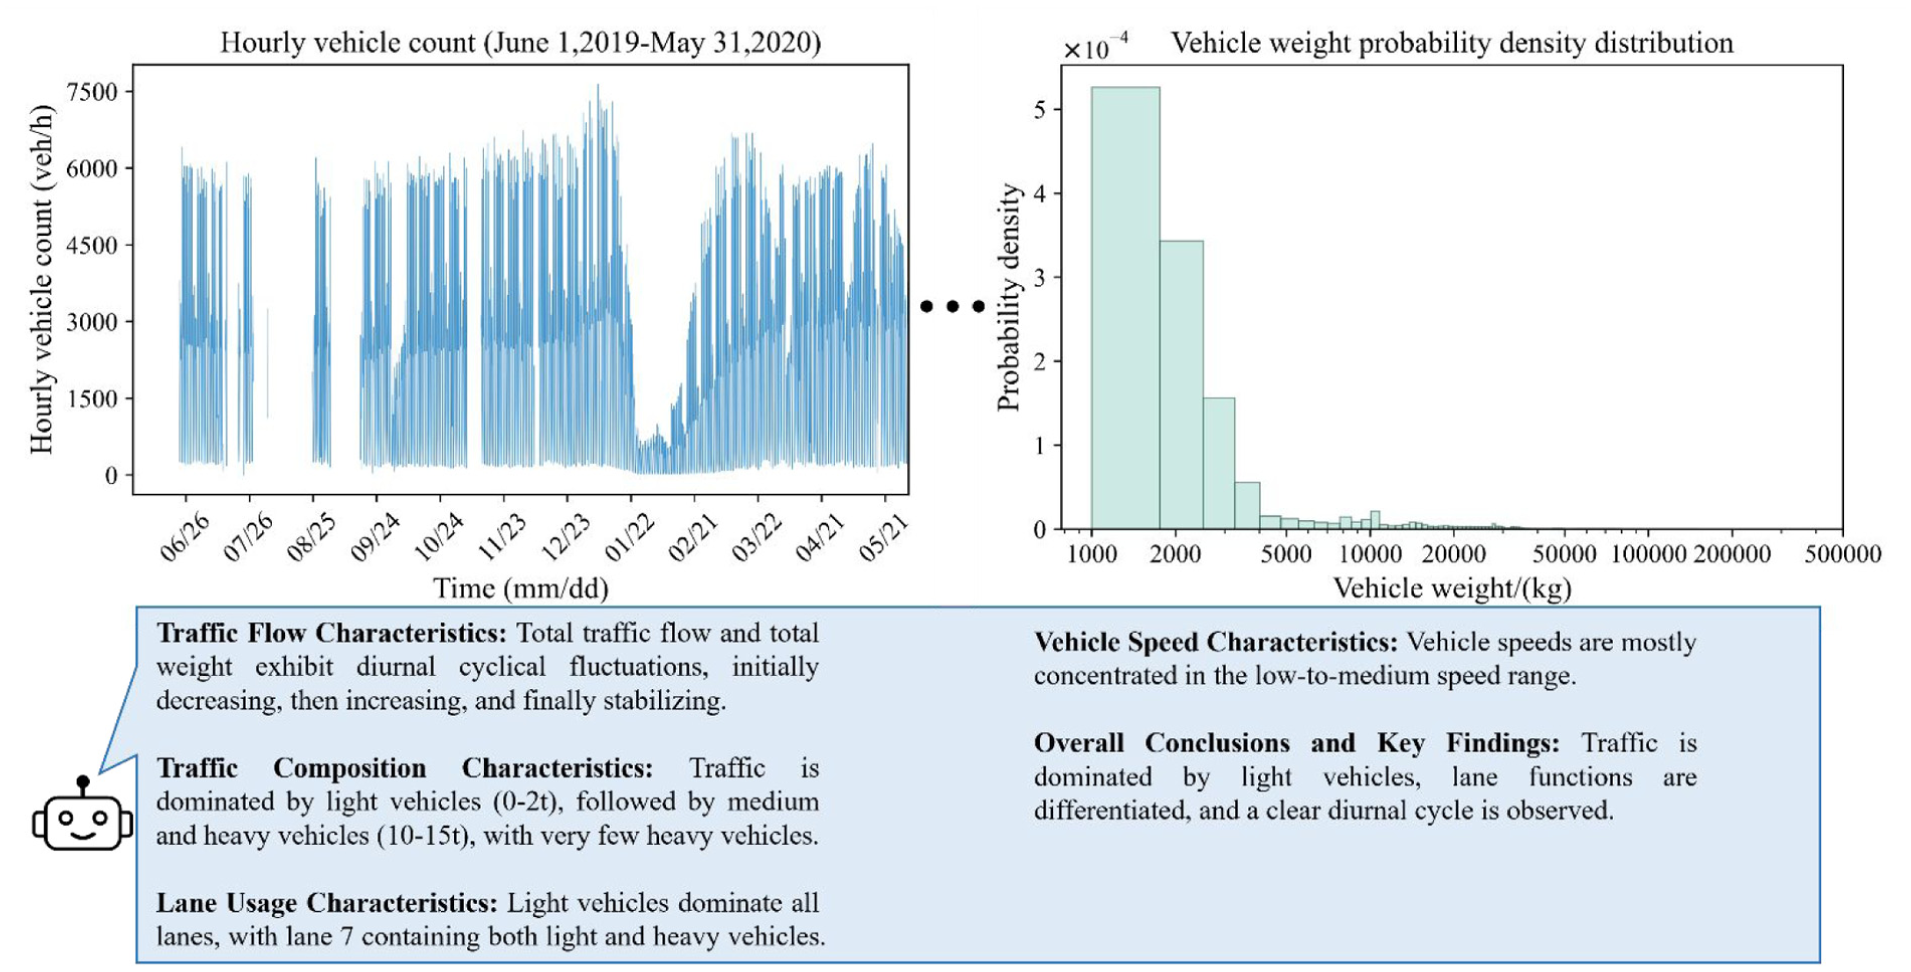
Traffic load data analysis results and the corresponding interpretation by MLLM. MLLM: multimodal large language model.
Figure 22 summarizes all feature-evaluation results for the acceleration data. In addition to statistical features such as RMS, modal characteristics were analyzed via OMA, yielding frequency and damping plots. The automated modal analysis clearly identified each mode; noise is relatively low for lower-order modal frequencies and higher for higher-order modes.
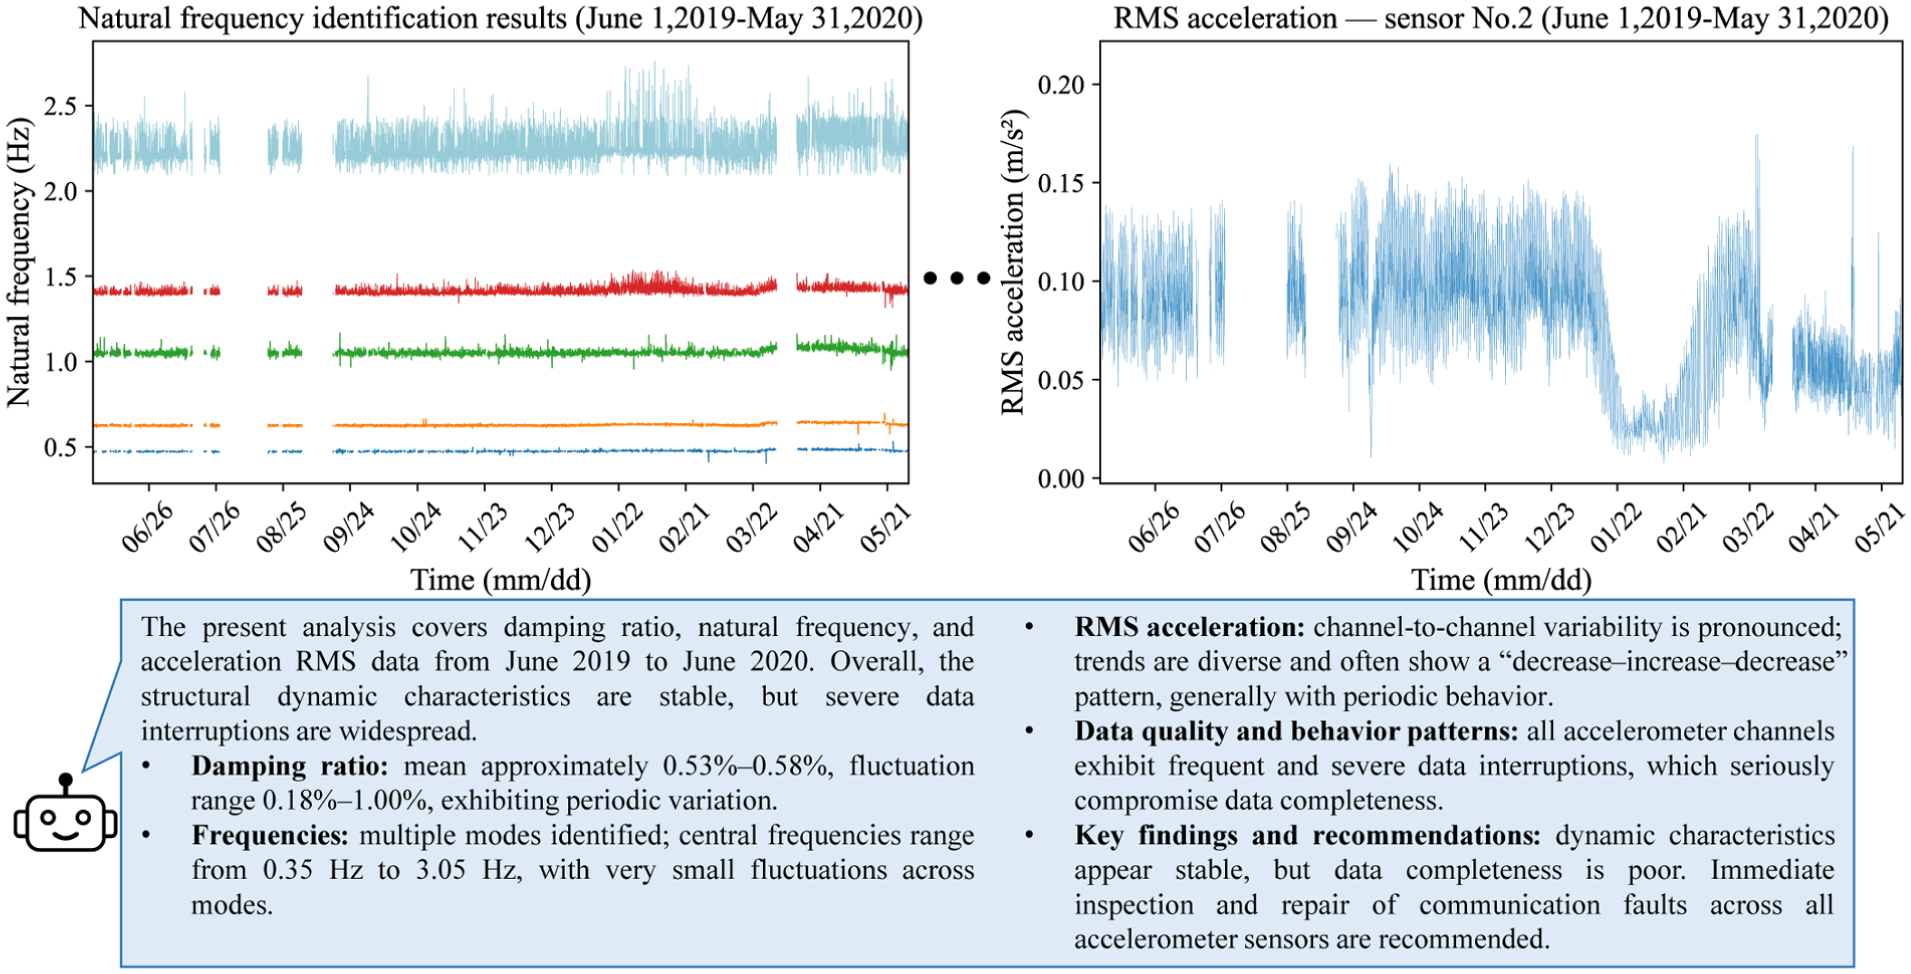
Acceleration data analysis results and the corresponding interpretation by MLLM. MLLM: multimodal large language model.
It should be noted that the structural response analysis section does not evaluate structural condition; it only describes data features. The main reason is that anomalies or deviations observed in a single monitoring dataset are often insufficient to support conclusions about structural abnormality and must be judged in conjunction with multiple sources of information such as loads. The MLLM produced generally reasonable results for acceleration evaluation. For damping ratio and frequency, it provided an overall summary of modal variations, thereby supplying evidence for subsequent condition assessment and conclusions.
Figure 23 demonstrates the MLLM’s advanced capability in interpreting nuanced correlation analysis results. The model successfully analyzed both the linear fit plots and the correlation coefficient matrix for temperature and strain. Crucially, its interpretation went beyond simple data extraction. For the linear fit, it correctly identified not only the overall trend but also the time-varying nature of the correlation by comparing the regression slopes of the first and second halves of the dataset. Similarly, for the coefficient matrix, it assessed the temporal evolution of correlations across multiple channels through the explicit comparison of the two temporal stages. These results highlight the MLLM’s robust ability to capture dynamic, time-varying characteristics and stability patterns in structural responses, a key task in long-term SHM.
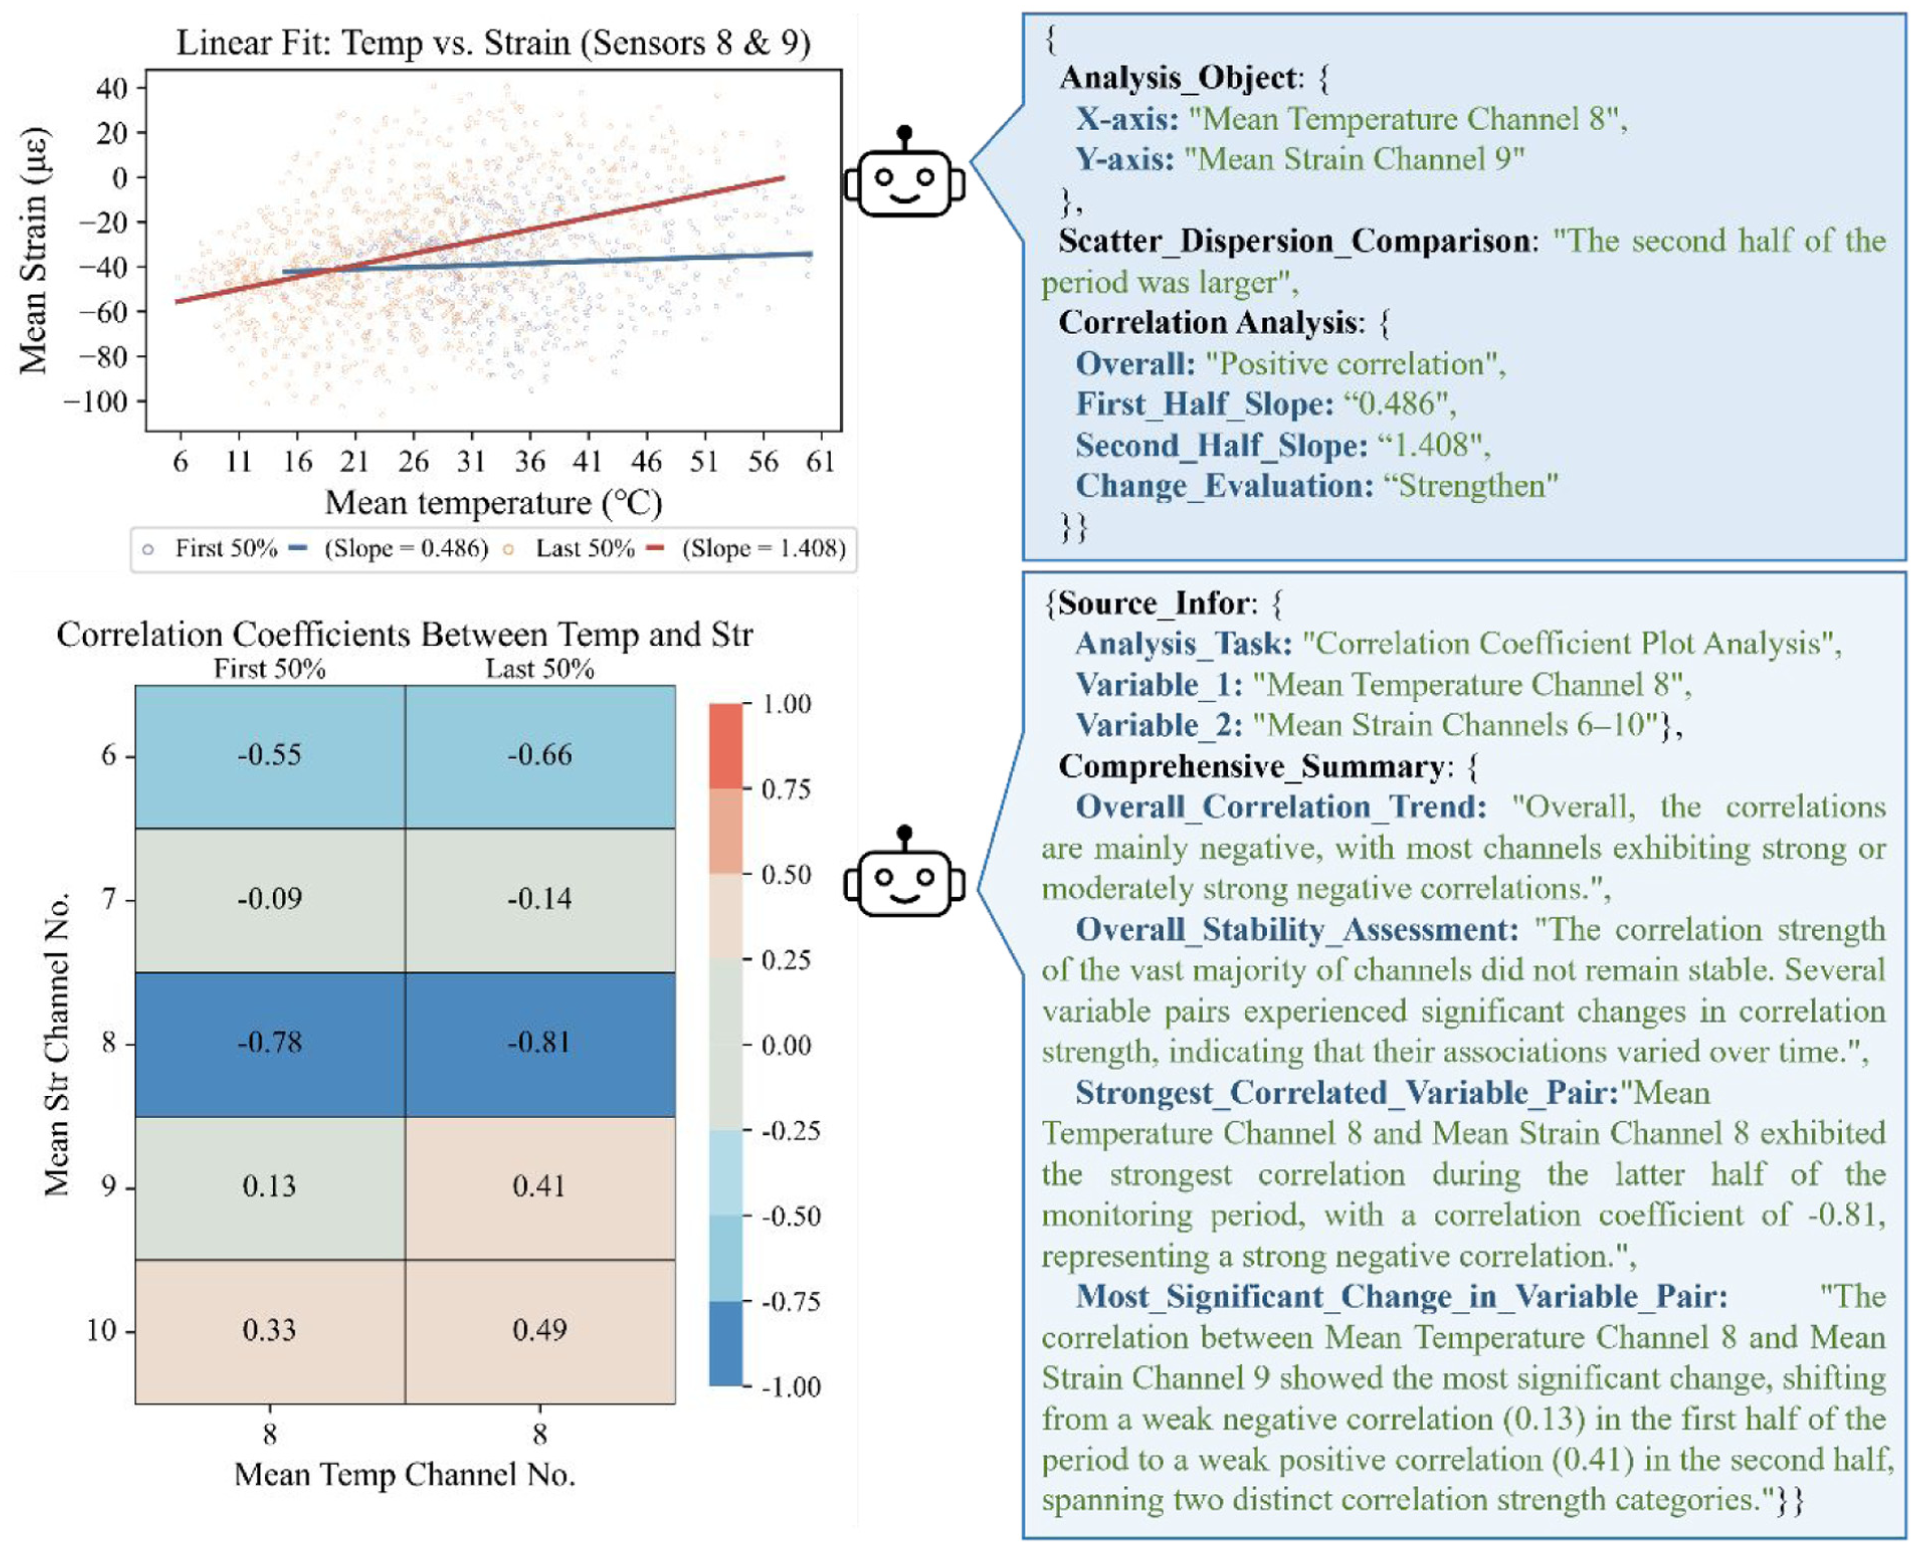
Correlation analysis plot and corresponding analysis by MLLM. MLLM: multimodal large language model.
The regression analysis focused on modeling structural dynamic characteristics and responses to detect anomalies. As shown in Figure 24, the frequencies identified using the automated OMA method mentioned in “Automated analysis functions and algorithms” section exhibit clear physical patterns: a daily fluctuation due to temperature and two distinct upward shifts in early 2020. These shifts are attributed to a traffic load reduction (Chinese New Year) and a subsequent deck pavement removal (dead load reduction), respectively. An LSTM model, with traffic load and temperature as inputs, was trained on the first half of the data to establish a “normal” behavior baseline. The remaining data were used for validation, with the 99th percentile of prediction error serving as the anomaly threshold. The regression analysis results for the first-order natural frequency are shown in Figure 25, and the relatively simple LSTM model successfully captured the overall trends and flagged the anomalies. For anomalies caused by decreased traffic volume, a few true values still fall outside the confidence interval; however, this primarily results from the model’s training configuration. Since this study emphasized generalizability and computational efficiency, a relatively basic LSTM model was adopted instead of more advanced SOTA methods. In fact, as demonstrated in previous studies, 75 more advanced models are capable of achieving highly accurate frequency predictions for the same cases. Nevertheless, the figures show that the adopted model can reasonably capture the anomaly patterns caused by reduced traffic volume in January and February, while failing to fit those arising from structural anomalies between March and May. This outcome is associated with the inclusion of traffic volume as an input variable during training, which aligns with the intended design of the study.
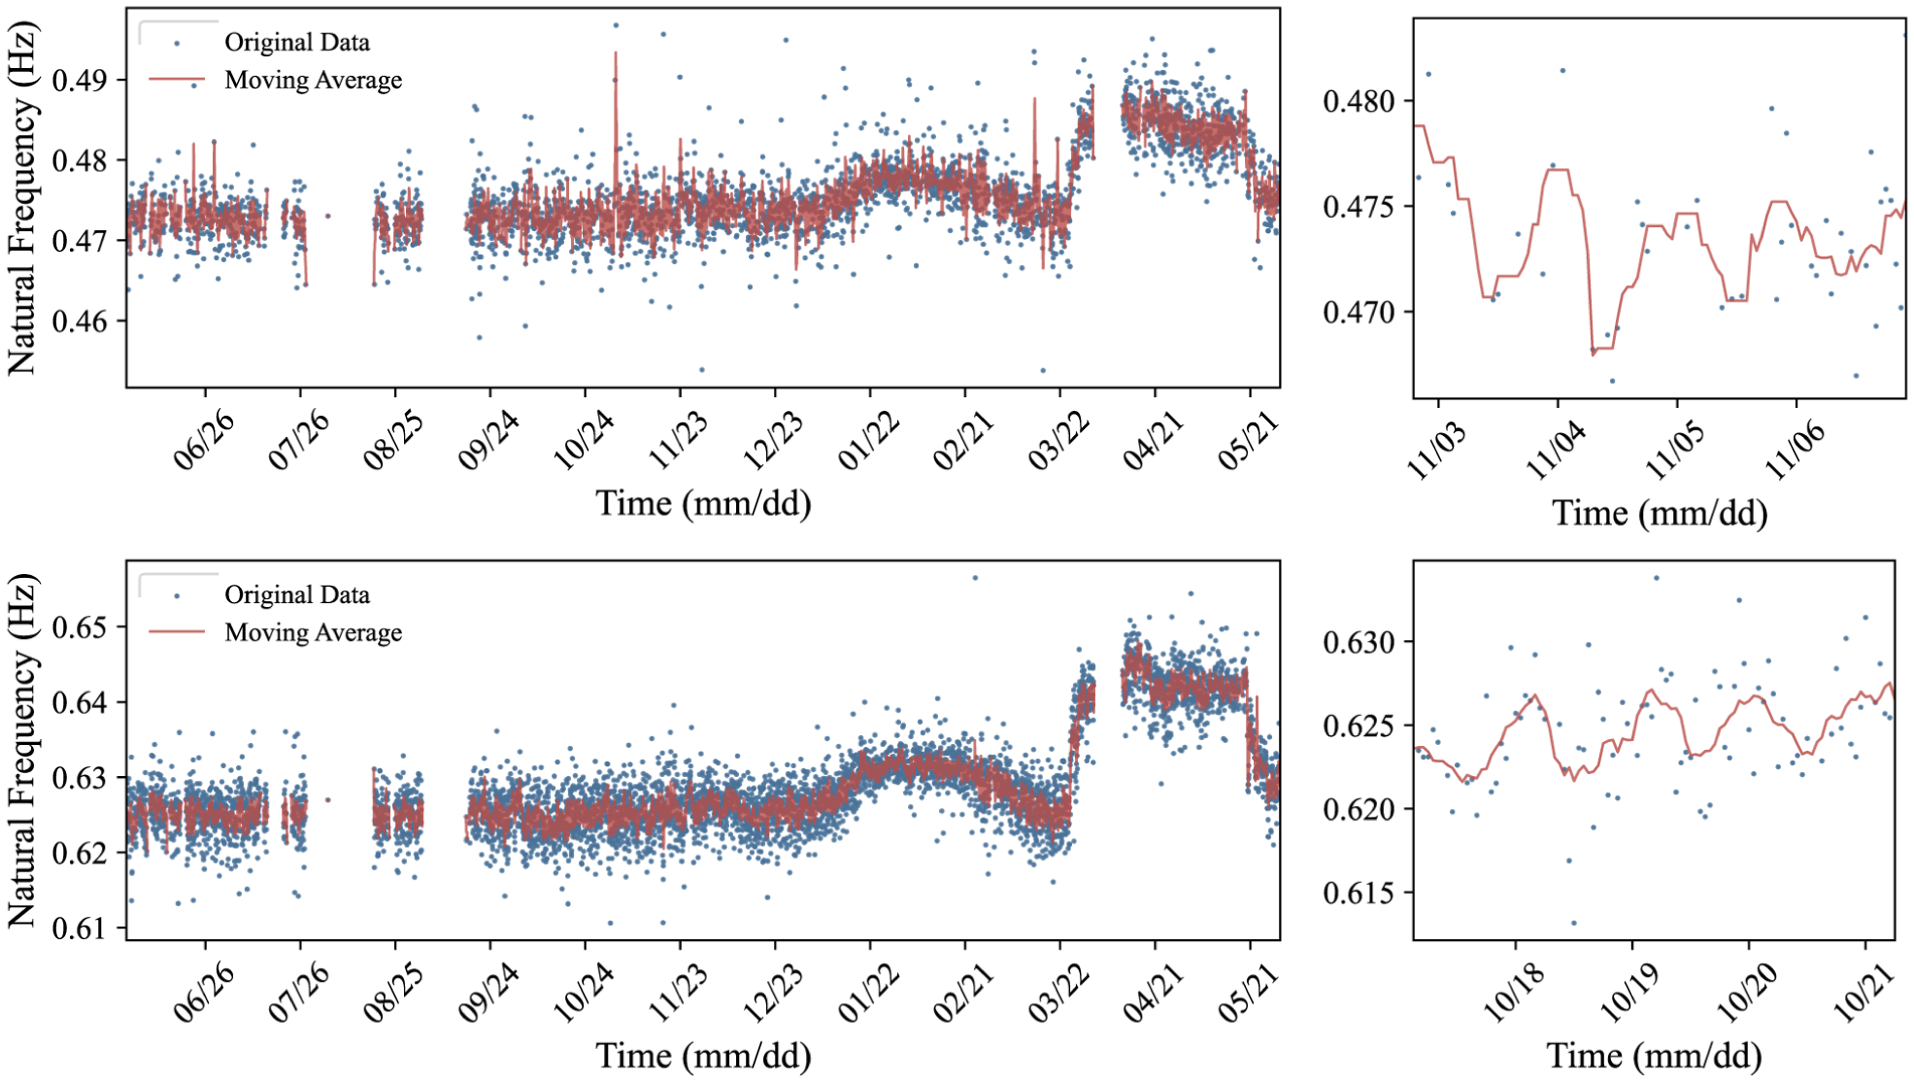
Identified natural frequencies of Mingzhou Bridge: top—first order, bottom—second order.
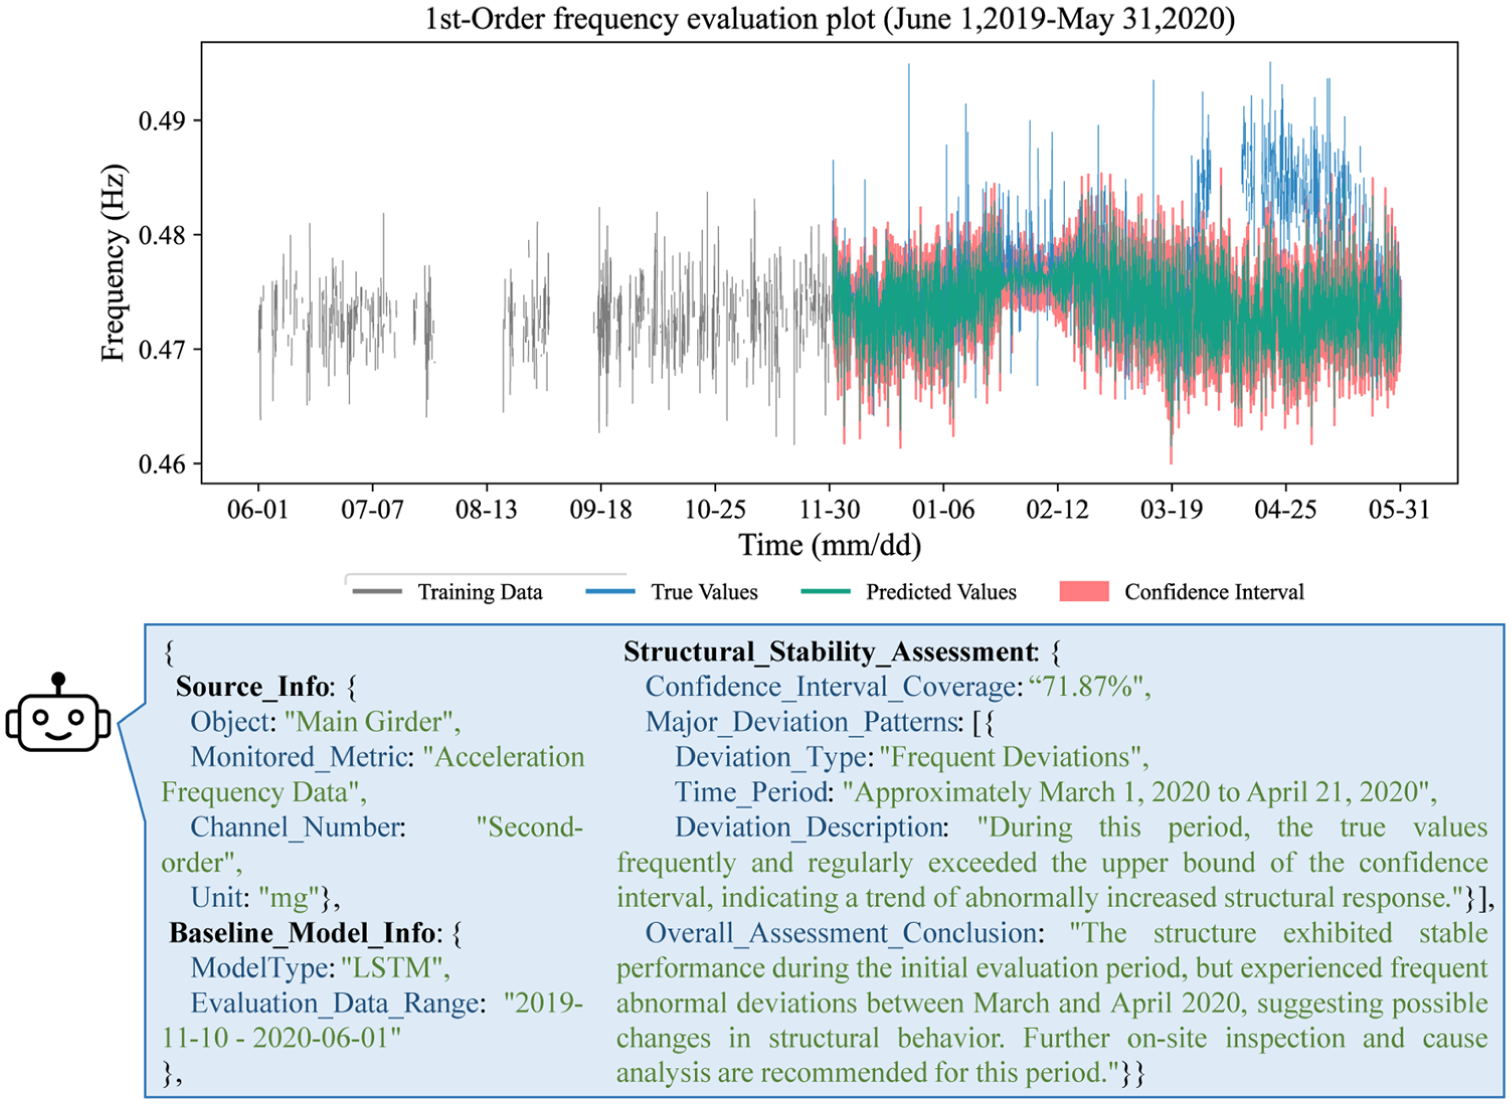
Regression analysis result of first-order natural frequencies and corresponding analysis by MLLM.
Crucially, the fine-tuned MLLM demonstrated effective interpretation capability for these regression analysis plots. As exemplified in the summary of Figure 25, the MLLM’s interpretation extended far beyond extracting basic metadata. It correctly identified key features essential for a structural condition assessment, including (1) the consistency between predicted and observed values, and (2) a qualitative description of the anomaly patterns. Furthermore, it was able to synthesize this information to derive engineering-relevant evaluation conclusions and maintenance-support recommendations. This suggests that the MLLM can, to some extent, support the high-level interpretive task of understanding model-based anomaly detection results.
Leveraging this, the fine-tuned MLLM further synthesizes regression analysis results across multiple items and channels (including displacement, strain, and frequency). As shown in Figure 26, the model detects concurrent deviations across multiple sensors from March to April, suggesting a potential system-level change, which is consistent with known facts. These findings, to some extent, verify the effectiveness of the MLLM in supporting structural condition assessment.
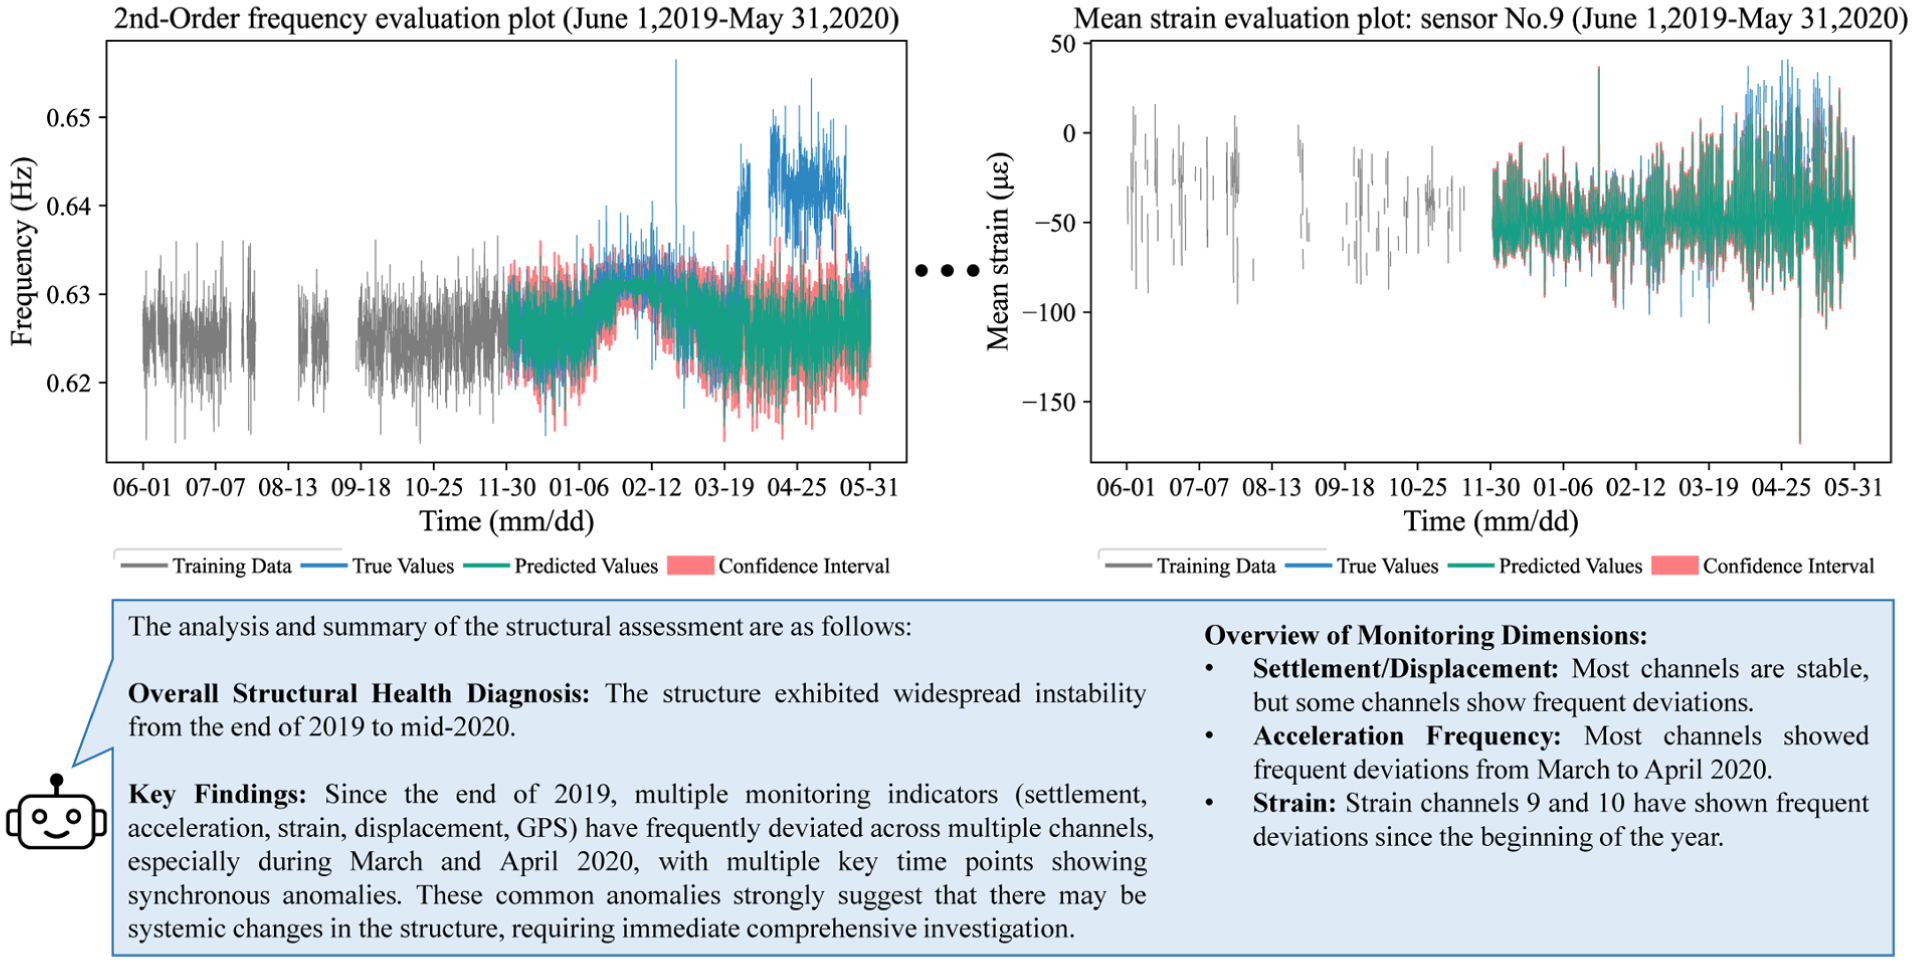
Regression analysis results and corresponding analysis by MLLM. MLLM: multimodal large language model.
Following the hierarchical reasoning strategy proposed in “Hierarchical reasoning-based monitoring assessment” section, the MLLM ultimately generated a comprehensive structural integrity assessment report for the Mingzhou Bridge. Key excerpts from the “Global structural evaluation” section of this report are presented in Figure 27, while the full, unedited report is available for review in the project’s GitHub repository.
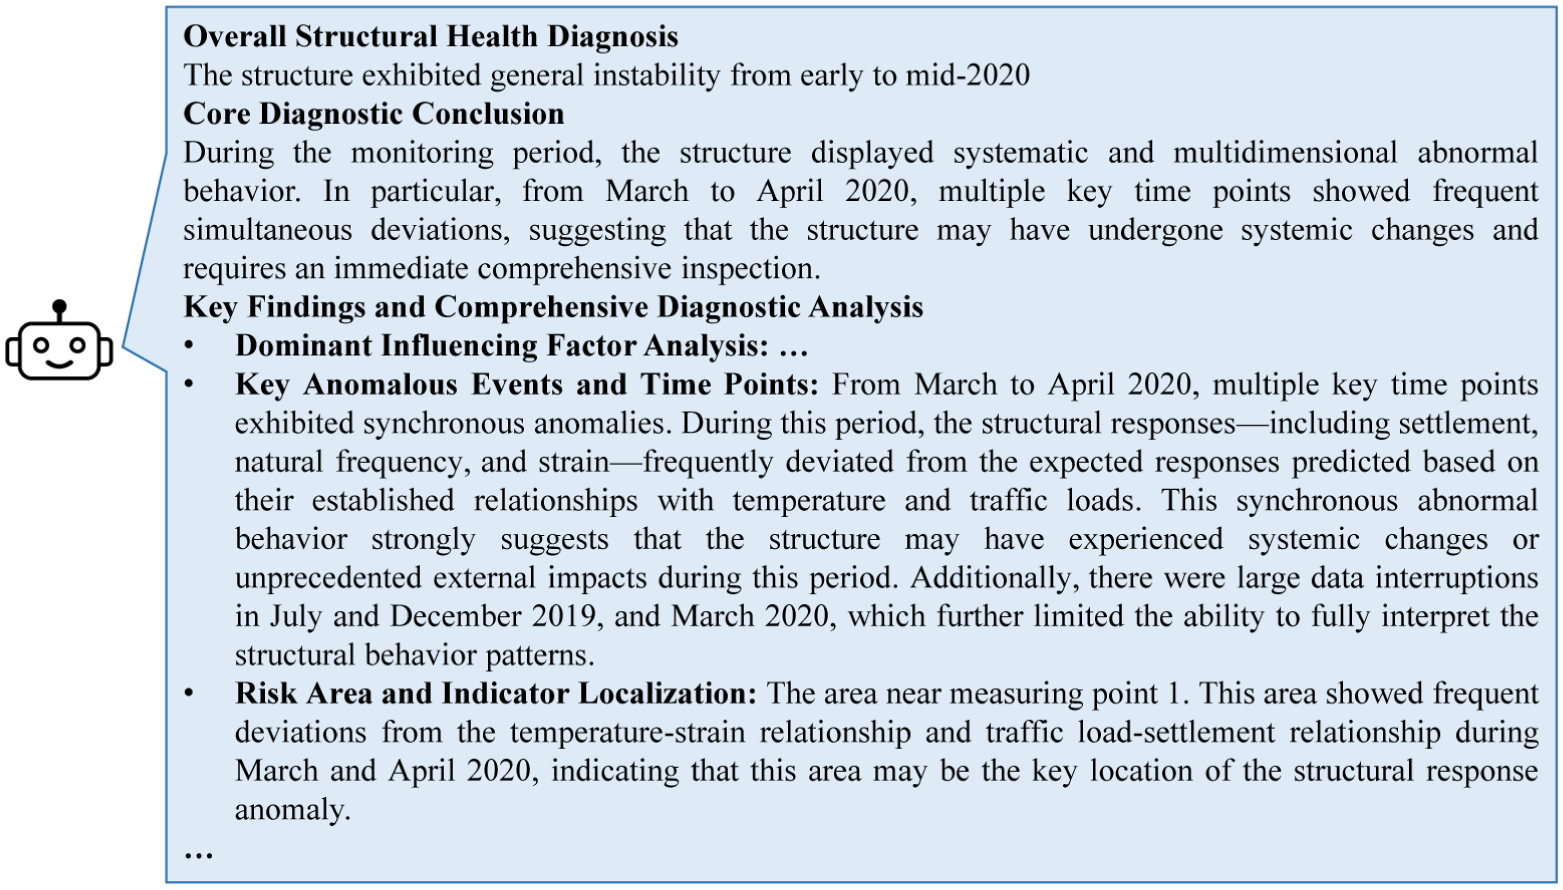
GSE results generated by MLLM. GSE: global structural evaluation; MLLM: multimodal large language model.
The results in Figure 27 are generally reasonable and logically consistent, demonstrating the model’s ability to synthesize multisource information into a coherent diagnostic conclusion. However, the evaluation process also revealed occasional instances of hallucination, a known challenge in LLMs. A representative case was observed where the MLLM correctly identified a high-risk period (March to April 2020) but incorrectly attributed the underlying anomalies to the area “near Sensor #1,” despite no direct evidence in the input data linking that specific sensor to all the cited issues. While the temporal conclusion was correct, the spatial localization was an unsupported inference.
This type of hallucination highlights a current limitation in the model’s fine-grained reasoning. While the LoRA fine-tuning and evidence-oriented prompts used in this study were designed to minimize such occurrences and proved highly effective overall, this specific case demonstrates that challenges remain. It underscores the importance of ongoing research into advanced architectures like RAG, which can further enhance a model’s factual grounding and reliability by dynamically incorporating external evidence.
Computational efficiency and scalability across additional bridges
The framework was further applied to 10 in-service bridges, chosen for their diverse structural types, monitoring configurations, and data scales (detailed in Supplemental Appendix Table S1), to demonstrate its computational efficiency, scalability, and cross-system applicability. The most significant outcome was a dramatic improvement in efficiency: the framework reduces a process that traditionally requires a team several days of manual analysis and report writing into a few hours of automated computation on a standard PC. Cumulatively, it processed 5466 GB of data, with the fine-tuned MLLM analyzing 2545 figures and generating over 837,000 words of text.
To provide a tangible benchmark, consider a typical long-span bridge generating approximately 400 GB of data annually. The framework can process this entire dataset in approximately 295 min (∼273 min for data analysis and ∼22 min for MLLM inference), producing a comprehensive report with approximately 180 figures and approximately 60,000 words. For highly instrumented structures like the Hejiang Yangtze River Bridge, the system generated nearly 300 figures and 100,000 words, with the MLLM completing its interpretation in just over 40 min.
Finally, it is worth noting that analysis duration is not solely governed by data volume. The computational complexity of specific algorithms, such as the SSI method for OMA, is more strongly dependent on the number of channels. Efficiency is also influenced by hardware, with solid-state drives offering a significant performance advantage over mechanical drives.
Discussion and conclusion
This article presented an automated framework for generating SHM assessment reports, leveraging a domain-adapted MLLM to overcome the key bottleneck of interpreting unstructured analytical outputs. The framework integrates a versatile data analysis workflow for handling heterogeneous data and an innovative hierarchical reasoning structure to guide the MLLM’s assessment. Through the representative case study and additional multibridge applications, this work demonstrates a practical framework for supporting efficient and standardized bridge condition evaluation workflows, with particular strengths in automation, computational scalability, and heterogeneous-system adaptability. The main conclusions are as follows:
(1) The proposed automated report generation framework demonstrated high processing efficiency and practical adaptability across different SHM configurations. It was applied to data from 10 real-world bridges (5466 GB in total). For a typical long-span bridge with an annual data volume of approximately 400 GB, processing on a single PC was completed in approximately 295 min (∼273 min for analysis and ∼22 min for MLLM inference). Compre-hensive reports containing approximately 180 figures and approximately 60,000 words were generated automatically, demonstrating the practical potential of the framework for efficient SHM assessment and reporting.
(2) The hierarchical reasoning framework, deeply integrated with prompt engineering, enables the MLLM to perform structured, evidence-guided reasoning and evaluation for SHM tasks. This is achieved by enabling the model not only to accurately extract key information from visual data but also to correlate and synthesize features and assessments from multiple monitoring sources. Experimental results indicate that the model can follow expert-informed reasoning patterns and distill engineering-relevant conclusions from vast, fragmented, and multimodal information.
(3) Domain-adaptive fine-tuning significantly improved model performance. Compared with the base model, it achieved substantial gains across all automated metrics, including increases of 0.1228 in BLEU-4 and 0.1598 in ROUGE-2. It also consistently outperformed the commercial benchmark GLM-4V-Plus in both automated metrics and expert human evaluation, with a 0.7-point advantage in the GSE task. In addition, it achieved the highest EGS, indicating that its high-level diagnostic conclusions were better supported by the provided monitoring evidence. These results further suggest that the fine-tuned model is better suited to bridge SHM tasks in terms of domain-specific terminological precision, semantic consistency, and engineering alignment.
However, this study has several limitations that also define avenues for future work. First, although the current framework adopts general analytical methods specified in Chinese codes to ensure broad applicability, future research could incorporate more advanced structural assessment algorithms to further improve the depth, precision, and reliability of diagnostics. Second, because the fine-tuning dataset was constructed from only four bridges, its coverage of real-world bridge SHM scenarios remains limited. Broader validation will therefore be needed to further assess the applicability of the proposed framework. Third, regarding the reasoning capabilities of the MLLM, the current implementation achieves an initial cross-dimensional integrated assessment but still represents only partial decision logic, rather than a fully verified formal decision system. Accordingly, the recommendations generated at this stage should be understood as evidence-grounded maintenance-support suggestions rather than fully verified engineering prescriptions. A more comprehensive engineering evaluation would require deeper investigation of causal relationships among anomalies and closer integration of monitoring insights with on-site inspection findings. In addition, occasional hallucinations were still observed despite LoRA fine-tuning and task-specific prompts. Future work will address these issues by introducing a RAG framework to consult periodic bridge inspection reports before generating conclusions and recommendations, and by encoding relevant monitoring standards and analytical procedures into a structured knowledge graph to further constrain the model’s reasoning.
Supplemental Material
sj-docx-1-shm-10.1177_14759217261453811 – Supplemental material for Bridge monitoring data analysis and automated report generation using multimodal large language model
Supplemental material, sj-docx-1-shm-10.1177_14759217261453811 for Bridge monitoring data analysis and automated report generation using multimodal large language model by Ye Xia, Cheng Pan, Fengzong Gong, Fidel Lozano Galant, Luyang Zhang, Seyedmilad Komarizadehasl and Limin Sun in Structural Health Monitoring
Footnotes
Funding
The authors disclosed receipt of the following financial support for the research, authorship, and/or publication of this article: This study is supported by the National Key Research and Development Program of China (2025YFF0519200), the National Natural Science Foundation of China (52278313), the visiting scholar funding of the State Key Laboratory of Disaster Reduction in Civil Engineering (SLDRCE26-F-14, SLDRCE26-F-24), and the project PID2024-161115OB-C21 funded by FEDER funds (“A way to make Europe”) and the Spanish Ministry of Economy and Competitiveness, MICIN/AEI/10.13039/501100011033/.
Declaration of conflicting interests
The authors declared no potential conflicts of interest with respect to the research, authorship, and/or publication of this article.
Supplemental material
Supplemental material for this article is available online.
References
Supplementary Material
Please find the following supplemental material available below.
For Open Access articles published under a Creative Commons License, all supplemental material carries the same license as the article it is associated with.
For non-Open Access articles published, all supplemental material carries a non-exclusive license, and permission requests for re-use of supplemental material or any part of supplemental material shall be sent directly to the copyright owner as specified in the copyright notice associated with the article.