
Abstract
This paper presents a likelihood-based time-of-flight method for localizing sequential acoustic sources in composite structures within a single structural health monitoring (SHM) acquisition. The proposed approach exploits signal arrival time information measured by a sensor network to construct a global likelihood map obtained by aggregating the individual contributions associated with successive emission events. Source locations are estimated by identifying the maxima of this global likelihood map, which correspond to the most probable source positions in a relative sense. To enhance localization accuracy and robustness, a nonlinear weighting operation is applied to the likelihood map to sharpen the spatial distribution, followed by morphological filtering to remove spurious peaks and a quadratic regression step to refine the estimation of the maximum positions. The method is experimentally validated on a carbon–epoxy composite plate using pencil lead break tests to simulate acoustic emission (AE) sources. Experimental results demonstrate that the proposed approach accurately localizes successive-AE events while maintaining a simple and computationally efficient formulation suitable for practical SHM applications. A key contribution of this work lies in its ability to localize multiple sequential acoustic events within a single SHM acquisition without requiring independent processing of each event.
Keywords
Introduction
Structural health monitoring (SHM), supported by continuous advances in signal processing, has become an essential approach for ensuring the integrity and safety of critical structures such as aircraft components, civil infrastructures, bridges, and storage tanks. 1 In this context, non-destructive testing (NDT) techniques play a central role. 2 Among these, acoustic emission (AE) monitoring is widely recognized for its capability to detect, locate, and characterize damage-related sources in real time, without requiring direct access to the damaged area.3–5
The AE technique relies on piezoelectric (PZT) sensors that record transient elastic waves generated by the sudden release of mechanical energy associated with damage mechanisms in materials. One of the primary objectives of AE-based SHM is the localization of emission sources, which allows targeted inspections or complementary NDT techniques to be focused on critical areas. Source localization is generally achieved using a network of sensors distributed over the structure, which capture the signal arrival times of the propagating acoustic waves.
Classical localization approaches exploit either the absolute arrival times of signals recorded by individual sensors6–9 or the relative arrival time differences between sensor pairs.10–17 These approaches have been extensively studied and applied due to their conceptual simplicity and strong physical basis. However, in most practical implementations, they are primarily designed to locate a single acoustic source at a time. This assumption significantly limits their applicability in more realistic scenarios, where multiple defects may form successively and generate several AE events during a single inspection or loading sequence. In recent years, the problem of detecting and localizing multiple damage sources has attracted increasing attention within the SHM community. In practical applications, once damage initiation occurs, structures are often subjected to continued loading, leading to progressive degradation and the formation of multiple defects, each producing distinct AE signals.18,19 These signals are detected by PZT sensors acting as receivers, while the damage sites are modeled as acoustic sources.
To support experimental investigations of AE localization methods, several techniques have been developed to artificially reproduce AE signals in a controlled and repeatable manner. Common approaches include pencil lead break (PLB) tests, gas jet excitation, and the use of piezoelectric actuators. 20 Among these, the Hsu–Nielsen PLB technique is widely adopted due to its simplicity, reproducibility, and ability to generate broadband transient signals representative of real damage events.16,21–23 This technique involves breaking a single pencil lead of controlled geometry against the surface of the structure, releasing elastic stress waves that propagate through the material and are detected by surface-mounted sensors. 24 A key advantage of PLB testing is the possibility of performing several successive breaks during a single acquisition session, enabling the recording of multiple temporally distinct AE events. This capability closely reflects real operational conditions, in which multiple AEs may occur successively during structural degradation. Consequently, SHM localization methods must be capable of identifying multiple acoustic sources within a single acquisition. Methods limited to single-source localization may fail to detect some defects, leading to increased inspection costs and delayed maintenance actions. This challenge has motivated the development of multi-source localization techniques that do not require prior knowledge of the number or positions of damage sources.
Several studies have addressed this issue using different methodological paradigms. Singh et al. 25 proposed a multi-damage localization method based on electromechanical impedance measurements, exploiting spatial variations in electrical impedance to identify multiple defects in polymeric and composite materials. Zhao et al. 26 introduced a multivariate Sparse Bayesian Learning approach for isotropic plates, while Prado et al. 27 proposed an image fusion technique combining the Total Focusing Method and the Sign Coherence Factor to enhance resolution and contrast. Other works have explored acoustic tomography for complex composite structures.28,29 Tao et al. 30 developed an adaptive method for simultaneously localizing two acoustic sources by separating their contributions through temporal energy filtering, while He et al. 31 combined beamforming and singular value decomposition to locate two closely spaced AE sources on metallic plates. Evolutionary “niching” algorithms have also demonstrated potential for multi-source detection using guided wave signals, 32 although their application to arrival time-based localization remains limited. More recently, Flood and Elvander 33 proposed a novel approach that jointly addresses localization and data association through a regularized optimal transport formulation, enabling the localization of multiple sources from relative arrival time information without prior knowledge of the number of sources. Data-driven deep learning approaches have also been explored for AE source localization in reinforced concrete structures, mainly focusing on improving robustness under noisy conditions and crack detection performance. Zhou et al.34,35 introduced a rapid localization technique based on relative arrival time analysis using L-shaped sensor clusters (LSSC), enabling damage localization without prior knowledge of material properties or wave velocities. While such approaches can be effective in certain contexts, their advantages are less decisive for composite structures commonly encountered in industrial SHM applications, where material properties and wave velocities are often known or can be calibrated. Moreover, cluster-based approaches typically require a relatively large number of sensors and may suffer from localization artifacts when multiple defects are present or closely spaced, particularly in anisotropic materials such as carbon–epoxy composite plates. In contrast, probabilistic localization approaches based on signal arrival time information explicitly account for propagation uncertainties, integrate data from multiple sensors in a physically interpretable manner, and can operate with a limited number of sensors. When damage events occur successively, their temporal separability can be exploited to realize localization of the AE sources, enabling robust multi-source identification within a single acquisition. Indeed, the AE acquisition system records multiple events according to their timing, and when two events arrive simultaneously at the same sensor, it will prioritize recording the most energetic one.
In this study, a likelihood-based time-of-flight method is proposed for the localization of sequential AE sources in a carbon–epoxy composite plate. The proposed approach exploits temporal information from multiple temporally separable acoustic events by constructing a global likelihood map, from which multiple source locations are extracted using morphological filtering and refined through quadratic regression.
To highlight the novelty and contributions of the proposed approach, several key aspects should be emphasized. Conventional AE source localization techniques, such as the time of arrival (TOA) and time difference of arrival (TDOA) methods, commonly assume a constant wave propagation velocity in all directions. However, this assumption is often not valid for composite materials, where wave propagation is strongly influenced by anisotropy, fiber orientation, and material heterogeneity. In the present work, the proposed method explicitly accounts for direction-dependent velocity variations and anisotropic wave propagation, which provides a more realistic representation of wave behavior in composite structures.2,36,37
Another important feature of the proposed framework is its suitability for in situ and near real-time localization of damage sources, which is particularly relevant for acoustic-emission-based SHM. Many existing methods reported in the literature are mainly developed for traditional NDE applications, where defects are typically identified during inspection campaigns after they have already formed, rather than being monitored continuously during the operation of the structure.38,39 In contrast, the proposed approach aims to localize damage events as they occur, allowing a more realistic monitoring of damage initiation and progression.
Furthermore, the acoustic sources considered in this study are both spatially and temporally evolving, which better reflects the actual nature of damage mechanisms detected by AE, such as fiber breakage, matrix cracking, or delamination. In many studies, damage is instead represented by simplified sources with fixed spatial positions and predefined geometrical characteristics. While this assumption simplifies the localization problem, it does not fully capture the dynamic nature of damage evolution in composite materials.34,35
In addition, in the post-processing stage, the proposed framework processes the complete dataset simultaneously, rather than analyzing each AE event independently. This global processing strategy significantly improves computational efficiency and reduces the overall processing time. Such an approach is particularly advantageous in situations where a large number of AE events must be analyzed, making the method well suited for practical SHM applications.
Furthermore, the integration of morphological filtering provides an effective means of separating and enhancing multiple localization peaks in the likelihood map, improving robustness to noise and spatial ambiguities. Third, quadratic regression-based refinement is introduced to accurately estimate the positions of the likelihood maxima, leading to improved localization precision without increasing computational complexity.
Finally, the proposed method is experimentally validated on a carbon–epoxy composite plate using PLB tests, demonstrating its ability to accurately localize successive-AE sources with a limited number of sensors, making it well suited for practical SHM applications.
The article is structured as follows: the second section presents the theoretical description of the likelihood-based time-of-flight method. The third section describes the experimental setup and the properties of the material used. The fourth section presents the analysis and interpretation of the localization results. Finally, the fifth section provides conclusions and prospects for future works.
Theoretical description of the likelihood-based time-of-flight method
Geometrical and anisotropic wave propagation model
Assuming that an AE is generated by a point source
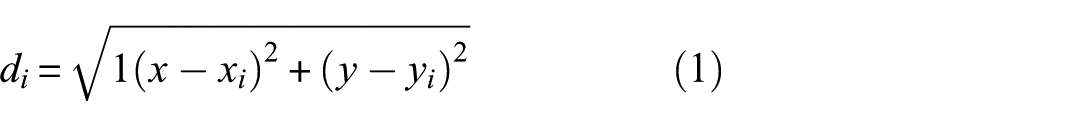
The theoretical group velocity in the direction
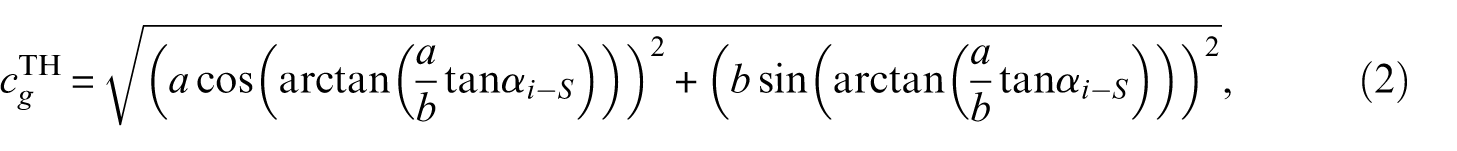
where
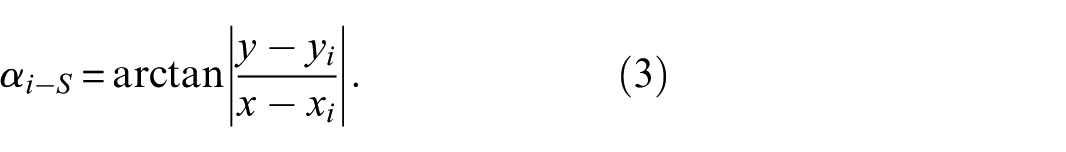
In this formulation
The parameters
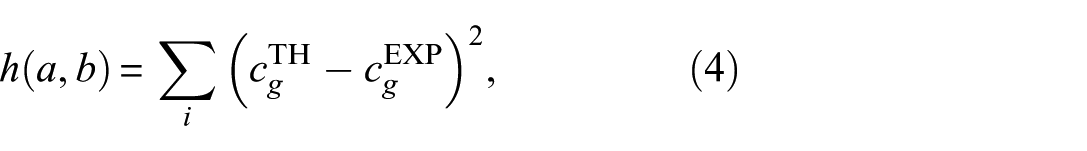
where the summation is performed over all sensor positions. This optimization ensures that the estimated parameters
Local source localization using a likelihood-based score map
For an arbitrary point
where
Global likelihood map construction and source estimation
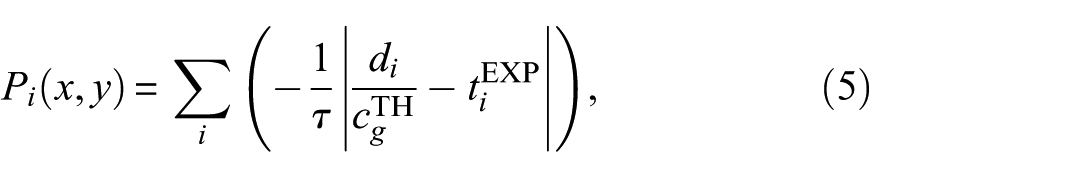
The localization of multiple successive acoustic sources is addressed by constructing a global likelihood map that aggregates individual contributions, given by:
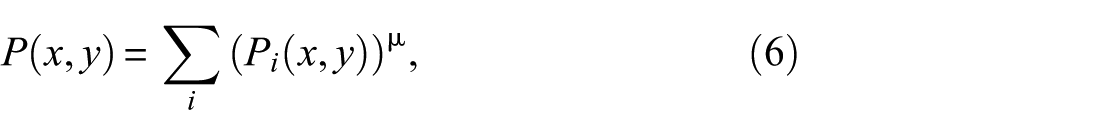
where
Normalization of the likelihood map
To facilitate interpretation and comparison of spatial values, the global score map is normalized as:
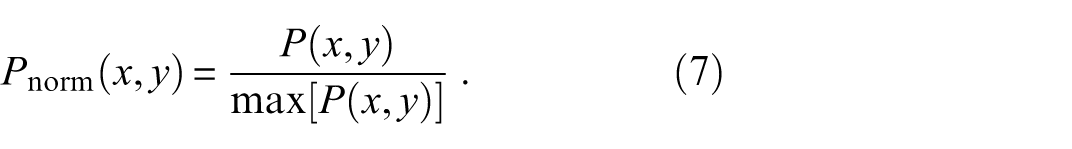
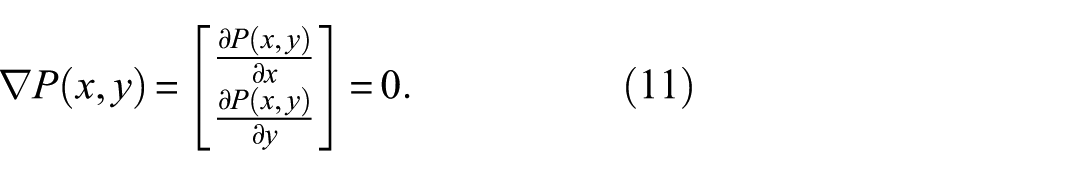
This normalization preserves the relative spatial distribution of likelihood values and therefore retains all relevant information required for source localization. The source locations are identified by extracting the local maxima of the normalized likelihood map
Let
Among these candidates, the coordinates

where
To avoid multiple detections within the same influence area, a minimum separation distance dmin is imposed between the selected maxima. Let

This criterion prevents redundant detections of neighboring peaks belonging to the same source region and ensures that each retained maximum corresponds to a distinct acoustic source. This step is generally known as “non-maximum suppression.” 42
For each local maximum
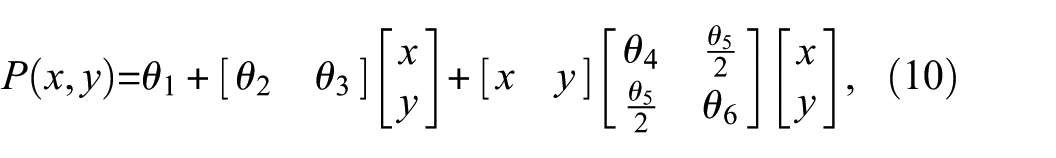
where the scalar coefficients
This gives a linear system that can be expressed in the following matrix form:
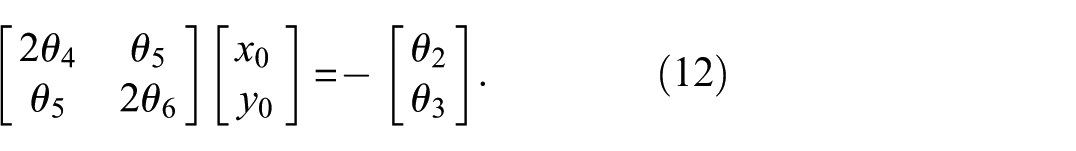
The resolution of this system allows us to obtain the maximum
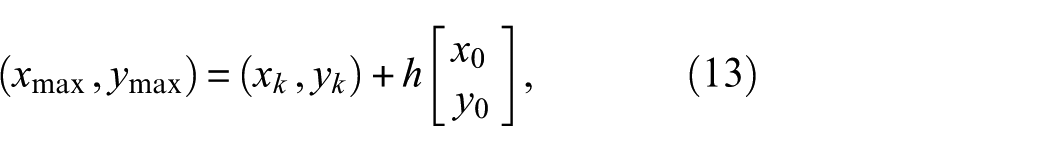
where
Figure 1 illustrates the flowchart of the proposed method for locating multiple acoustic sources.
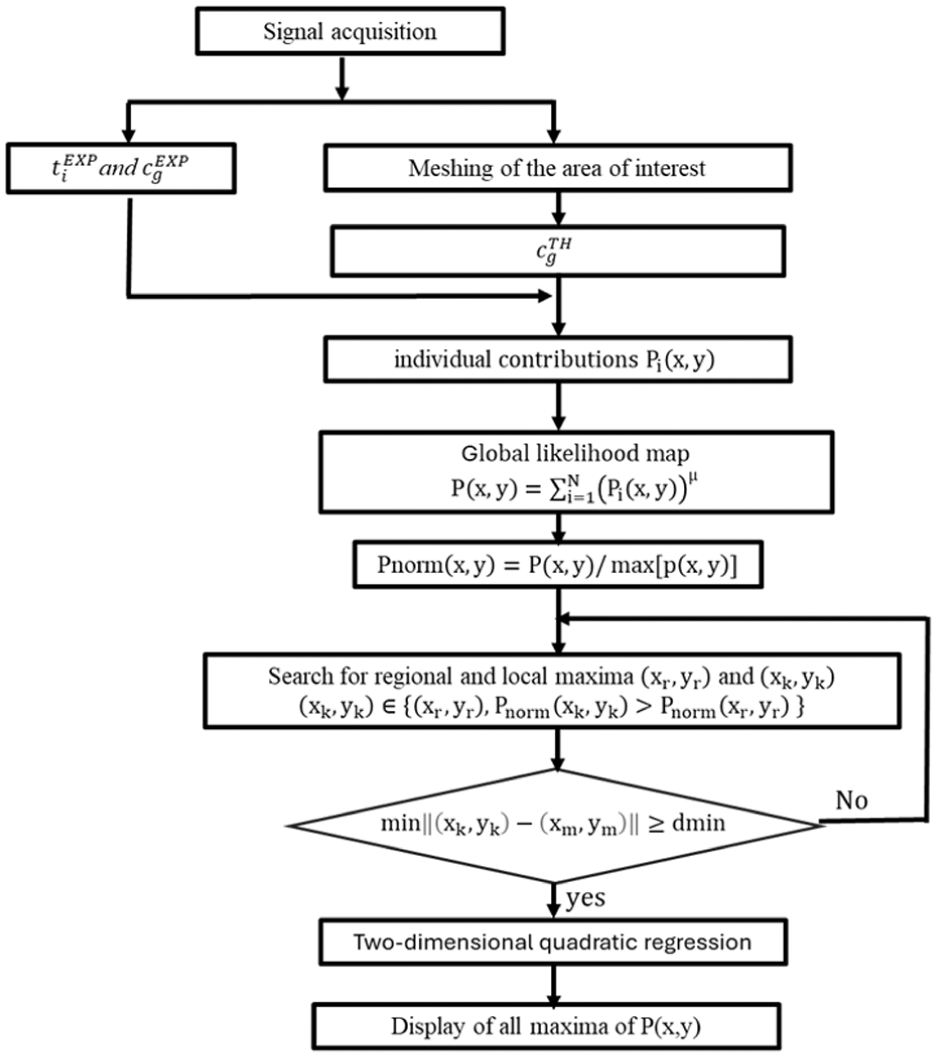
Flowchart of the successive-AE sources localization. AE: acoustic emission.
Experimental setup and sensors placement
Experimental setup
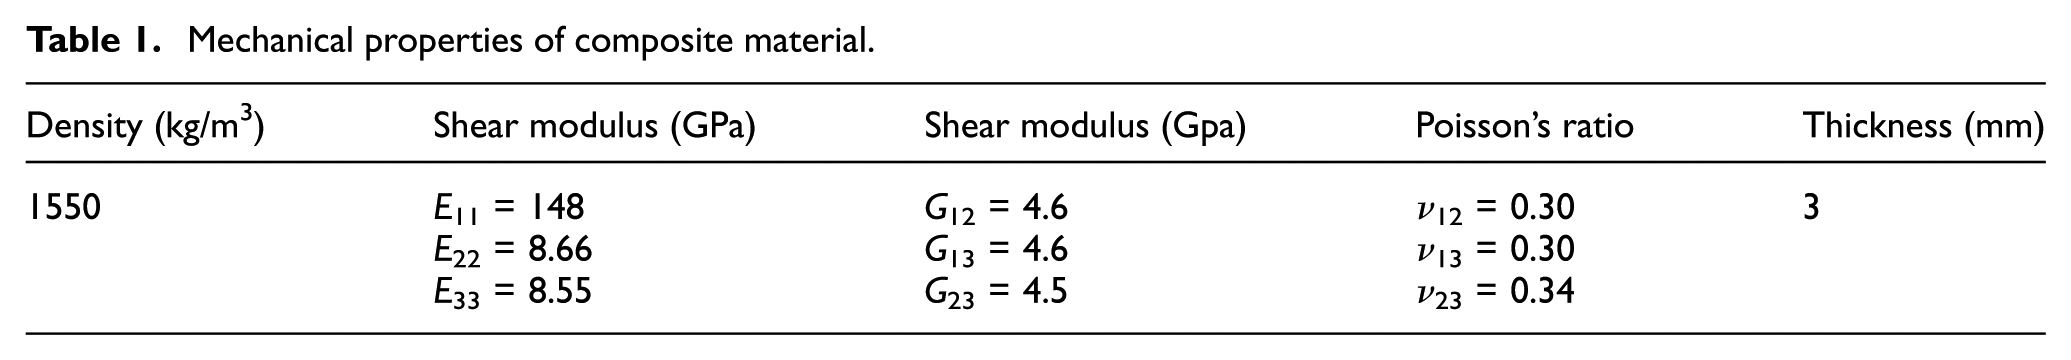
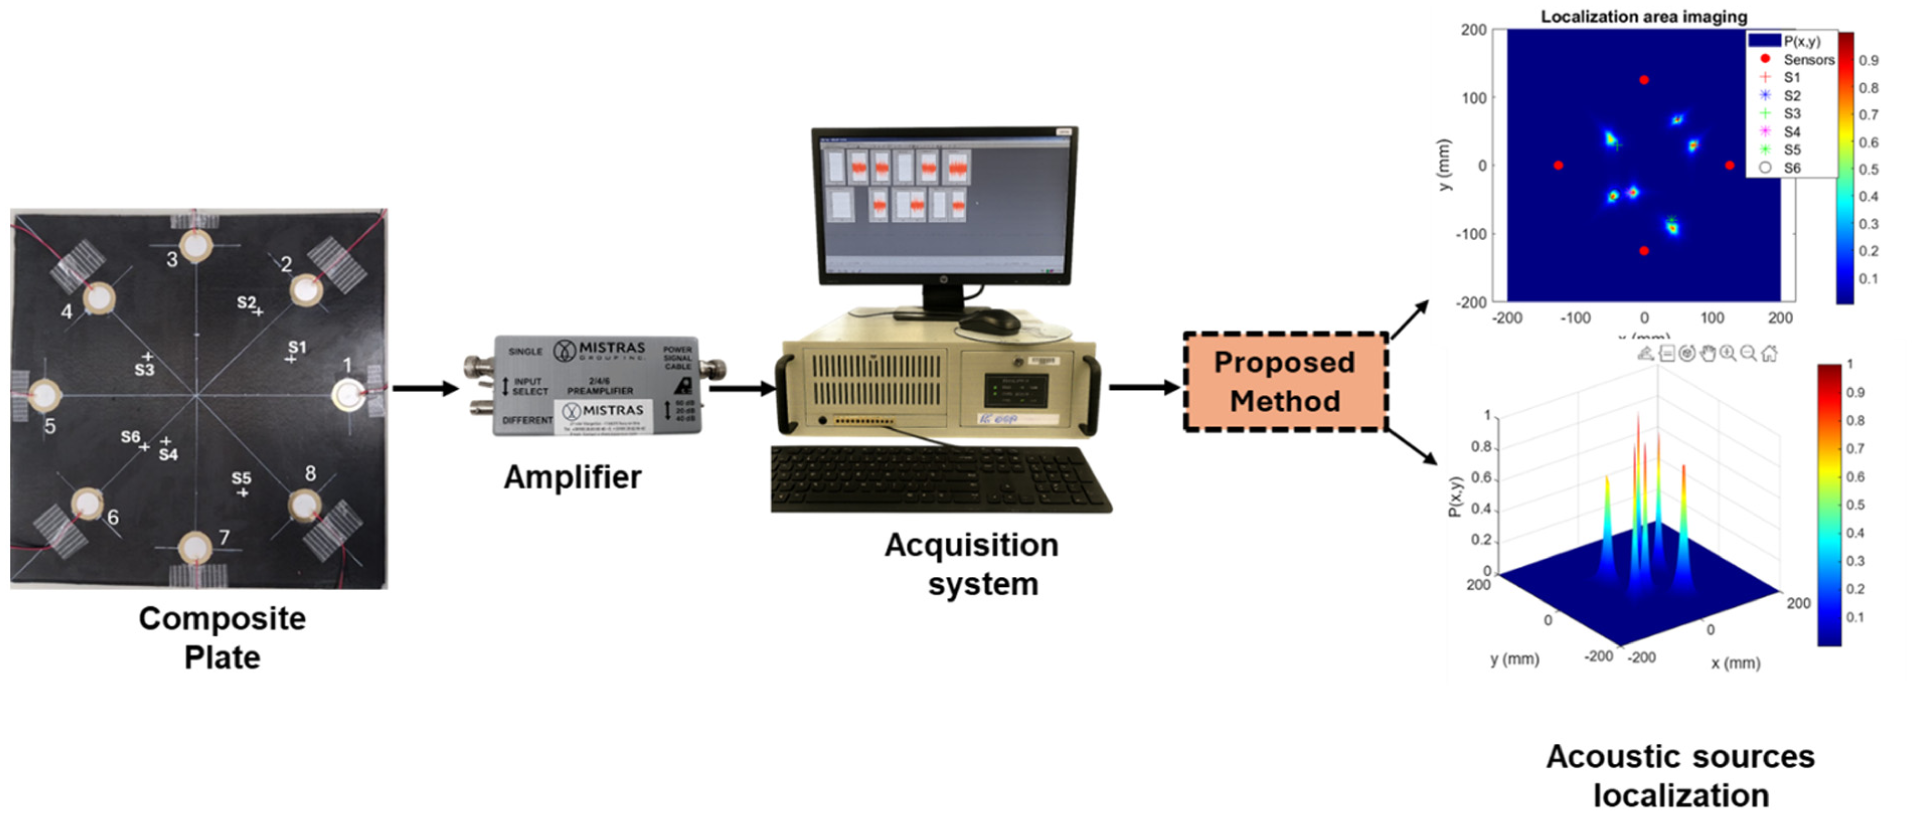
The experimental setup used in this study consists of a carbon–epoxy composite laminate, a network of eight PZT sensors, preamplifiers, and an acquisition system, as shown in Figure 2. The composite plate, which is square in shape, measures
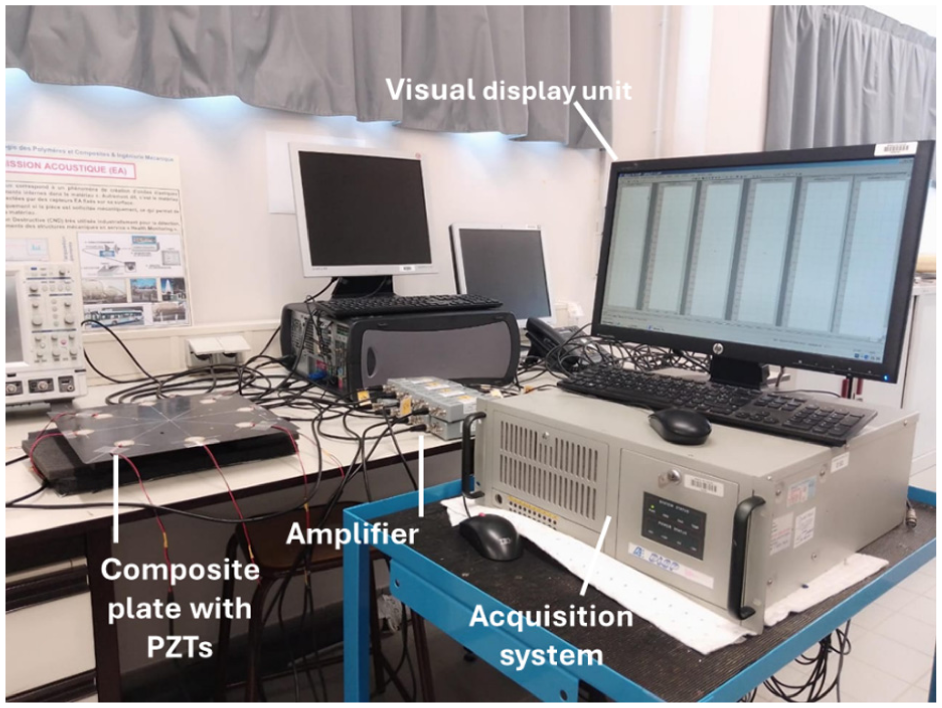
Experimental setup for AE measurements. AE: acoustic emission.
Mechanical properties of composite material.
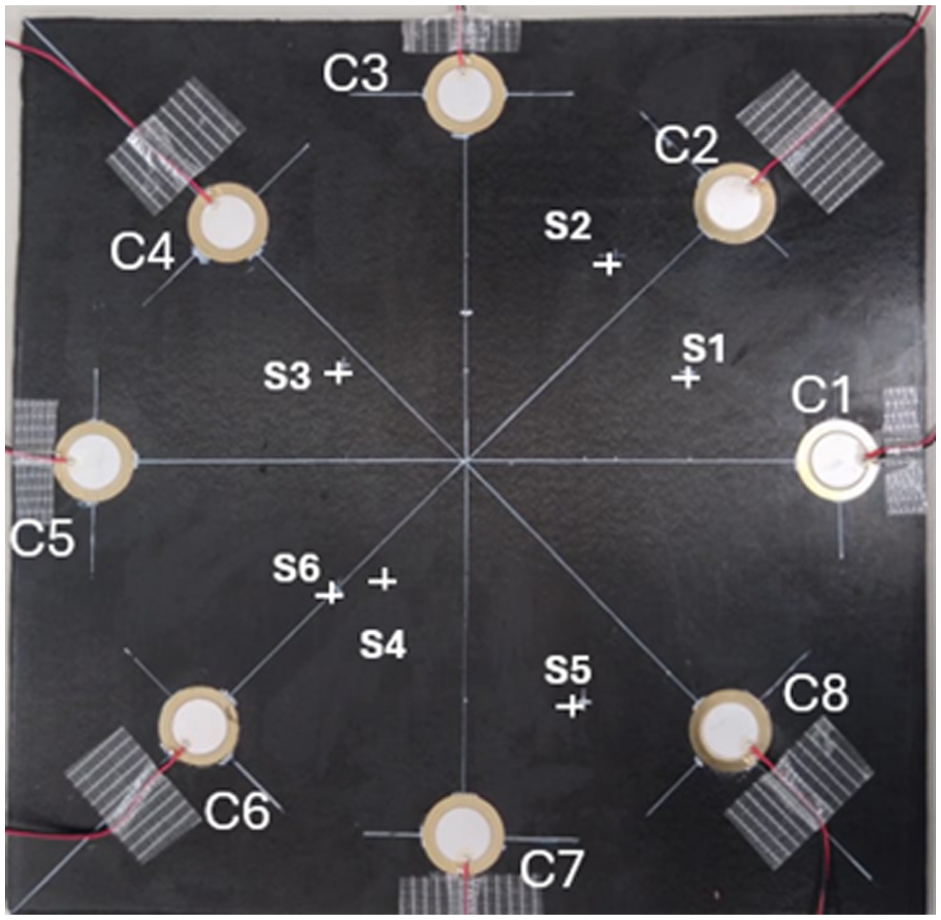
Carbone-epoxy composite plate with PZT sensors. PZT: piezoelectric.
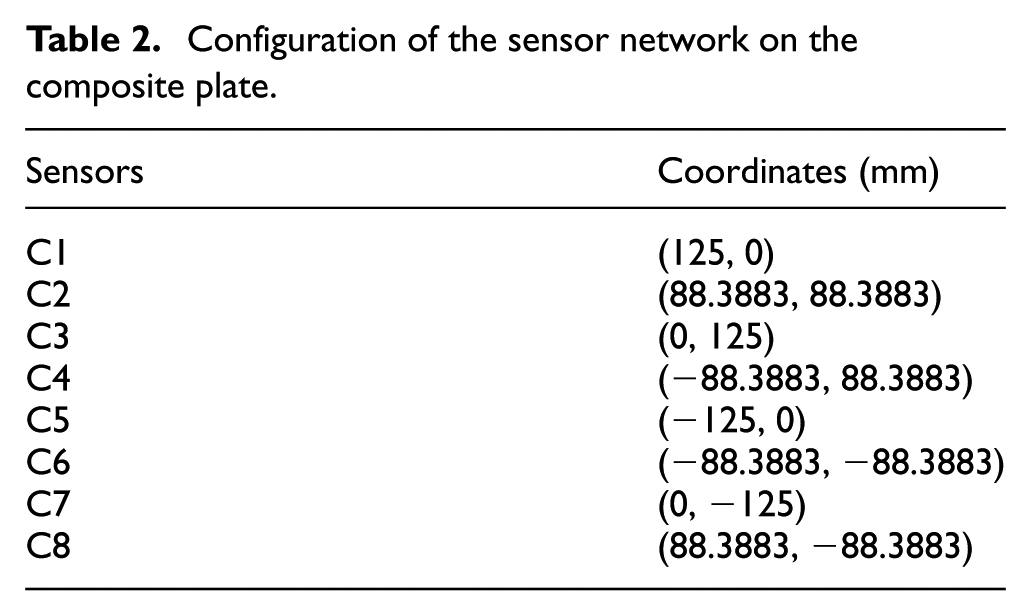
Configuration of the sensor network on the composite plate.
The acquisition system used in this study was a 16-channel MISTRAS system. RS PRO buzzer-type PZT sensors, with a diameter of 17 mm and a thickness of 0.42 mm, supplied by RS Components, were bonded to the surface of the composite plate using epoxy resin to detect AE signals.
To improve the quality of the acquired signals, each sensor channel was connected to a MISTRAS voltage preamplifier with a gain of 40 dB. In addition to amplifying the low-amplitude AE signals, the acquisition system applies signal filtering to reduce noise and improve the signal-to-noise ratio, thereby ensuring more reliable waveform acquisition.
Real-time acquisition and processing of the AE signals were performed using AEwin™ software running on Windows. This software allows the waveforms to be displayed, stored, and analyzed in real time. The acquisition system records the signals with a sampling frequency of 200 MHz, corresponding to a temporal resolution of 5 × 10⁻⁹ s. The propagation time from the source to the sensor is determined using the Hanning envelope method by selecting the time corresponding to the first peak of the envelope. This procedure improves the robustness of the arrival time estimation, particularly in the presence of noise, and contributes to the reliability of the localization process. Such noise-robust signal processing strategies are consistent with recent data-driven approaches that aim to enhance AE source localization performance under noisy conditions, including deep learning-based frameworks developed for reinforced concrete structures.46,47
To generate controlled AE sources, the PLB method was used. The leads used, with a diameter of 0.5 mm and a length of 4 mm, were broken at an angle between 35 and 40°. This method, also known as the Hsu–Nielsen source, realistically simulates the AE resulting from internal damage in the microstructure. The break produces a transient acoustic wave that propagates as a circular wavefront from the point of impact, which is then picked up by the AE sensors. The signals recorded in this way, associated with each fracture event, are saved as CSV files via the MISTRAS system and form the database for analysis. A total of six AE generation points were tested:
The various steps of the proposed method.
Choice of sensor network configuration
The positioning of sensors plays an important role in locating acoustic sources on anisotropic structures. To identify the configuration that provides an excellent match between the group velocities measured experimentally and those predicted by the theoretical model, we focused on three specific cases:
✓ Configuration 1 consists of a network of eight sensors.
✓ Configuration 2 uses sensors
✓ Configuration 3 uses sensors
In Figure 5, we compare the experimental velocities with the values predicted by the theoretical model for the three configurations described above. Good agreement is observed between the experimental and theoretical group velocities for configurations 2 and 3. In particular, configuration 2 offers greater accuracy than configuration 3.
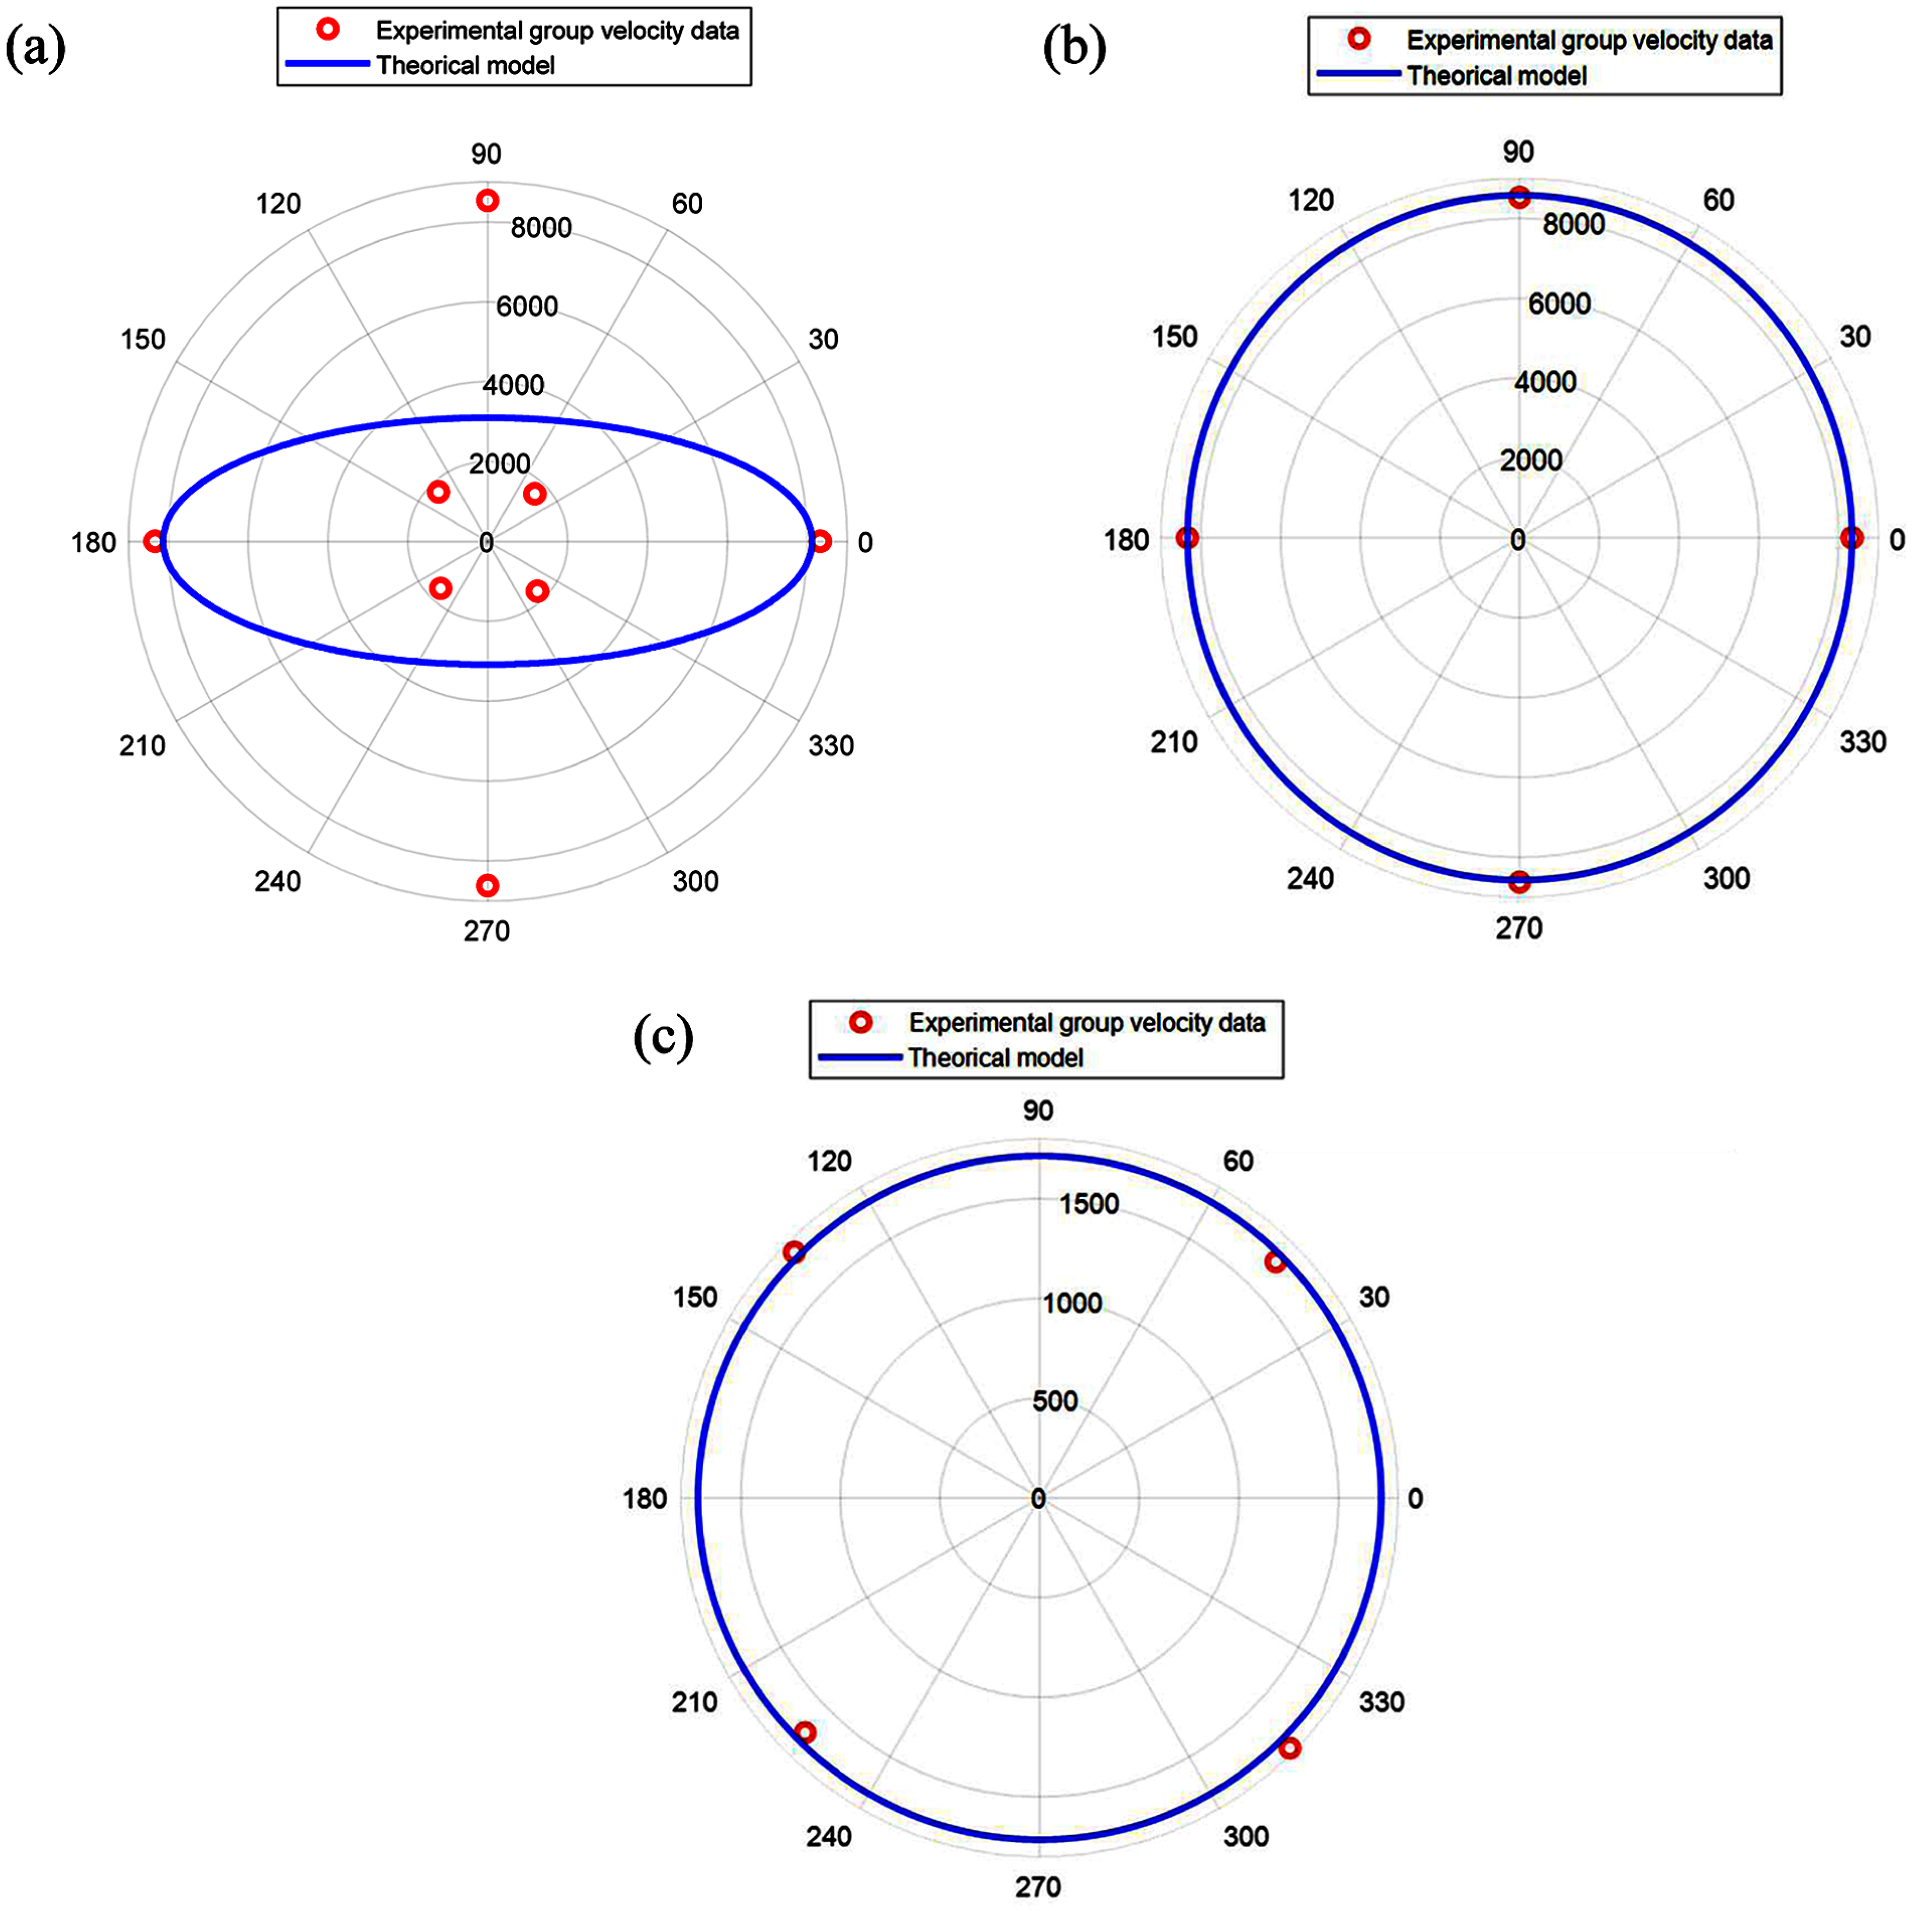
Comparison between experimental group velocity and that predicted by the theoretical model: (a) configuration 1, (b) configuration 2, and (c) configuration 3.
The better performance of configuration 2 can be attributed to the alignment of the sensors with the principal material directions (0 and 90°), which correspond to the main fiber orientations of the composite plate. Along these directions, wave propagation is more stable, and the experimentally measured group velocities are in closer agreement with the theoretical predictions. This leads to a more reliable estimation of the propagation times used in the localization process.
In contrast, configuration 3 is oriented along the 45 and 135° directions, where the anisotropic behavior of the composite is more pronounced. In these off-axis directions, wave propagation is affected by stronger directional variations, which may increase discrepancies between theoretical and experimental group velocities. As a result, the estimation of arrival times becomes less accurate, reducing the overall localization performance. For this reason, configuration 2 was selected for the localization of multiple sequential acoustic sources.
Figure 6 shows the signal emitted from point
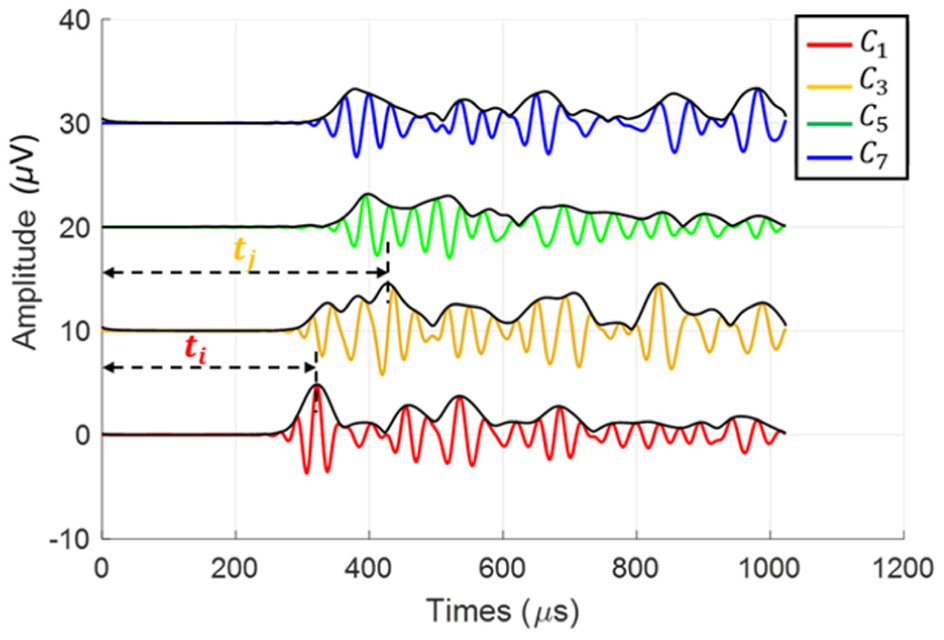
Time–amplitude representation of signal emitted from
Results, analysis, and discussion
To better reproduce realistic monitoring conditions in which AEs may arise at different locations over a continuous observation period, several successive PLBs were introduced at different (


With,

And,

where
Localization of a single acoustic source
First, we consider the localization of a single acoustic source,
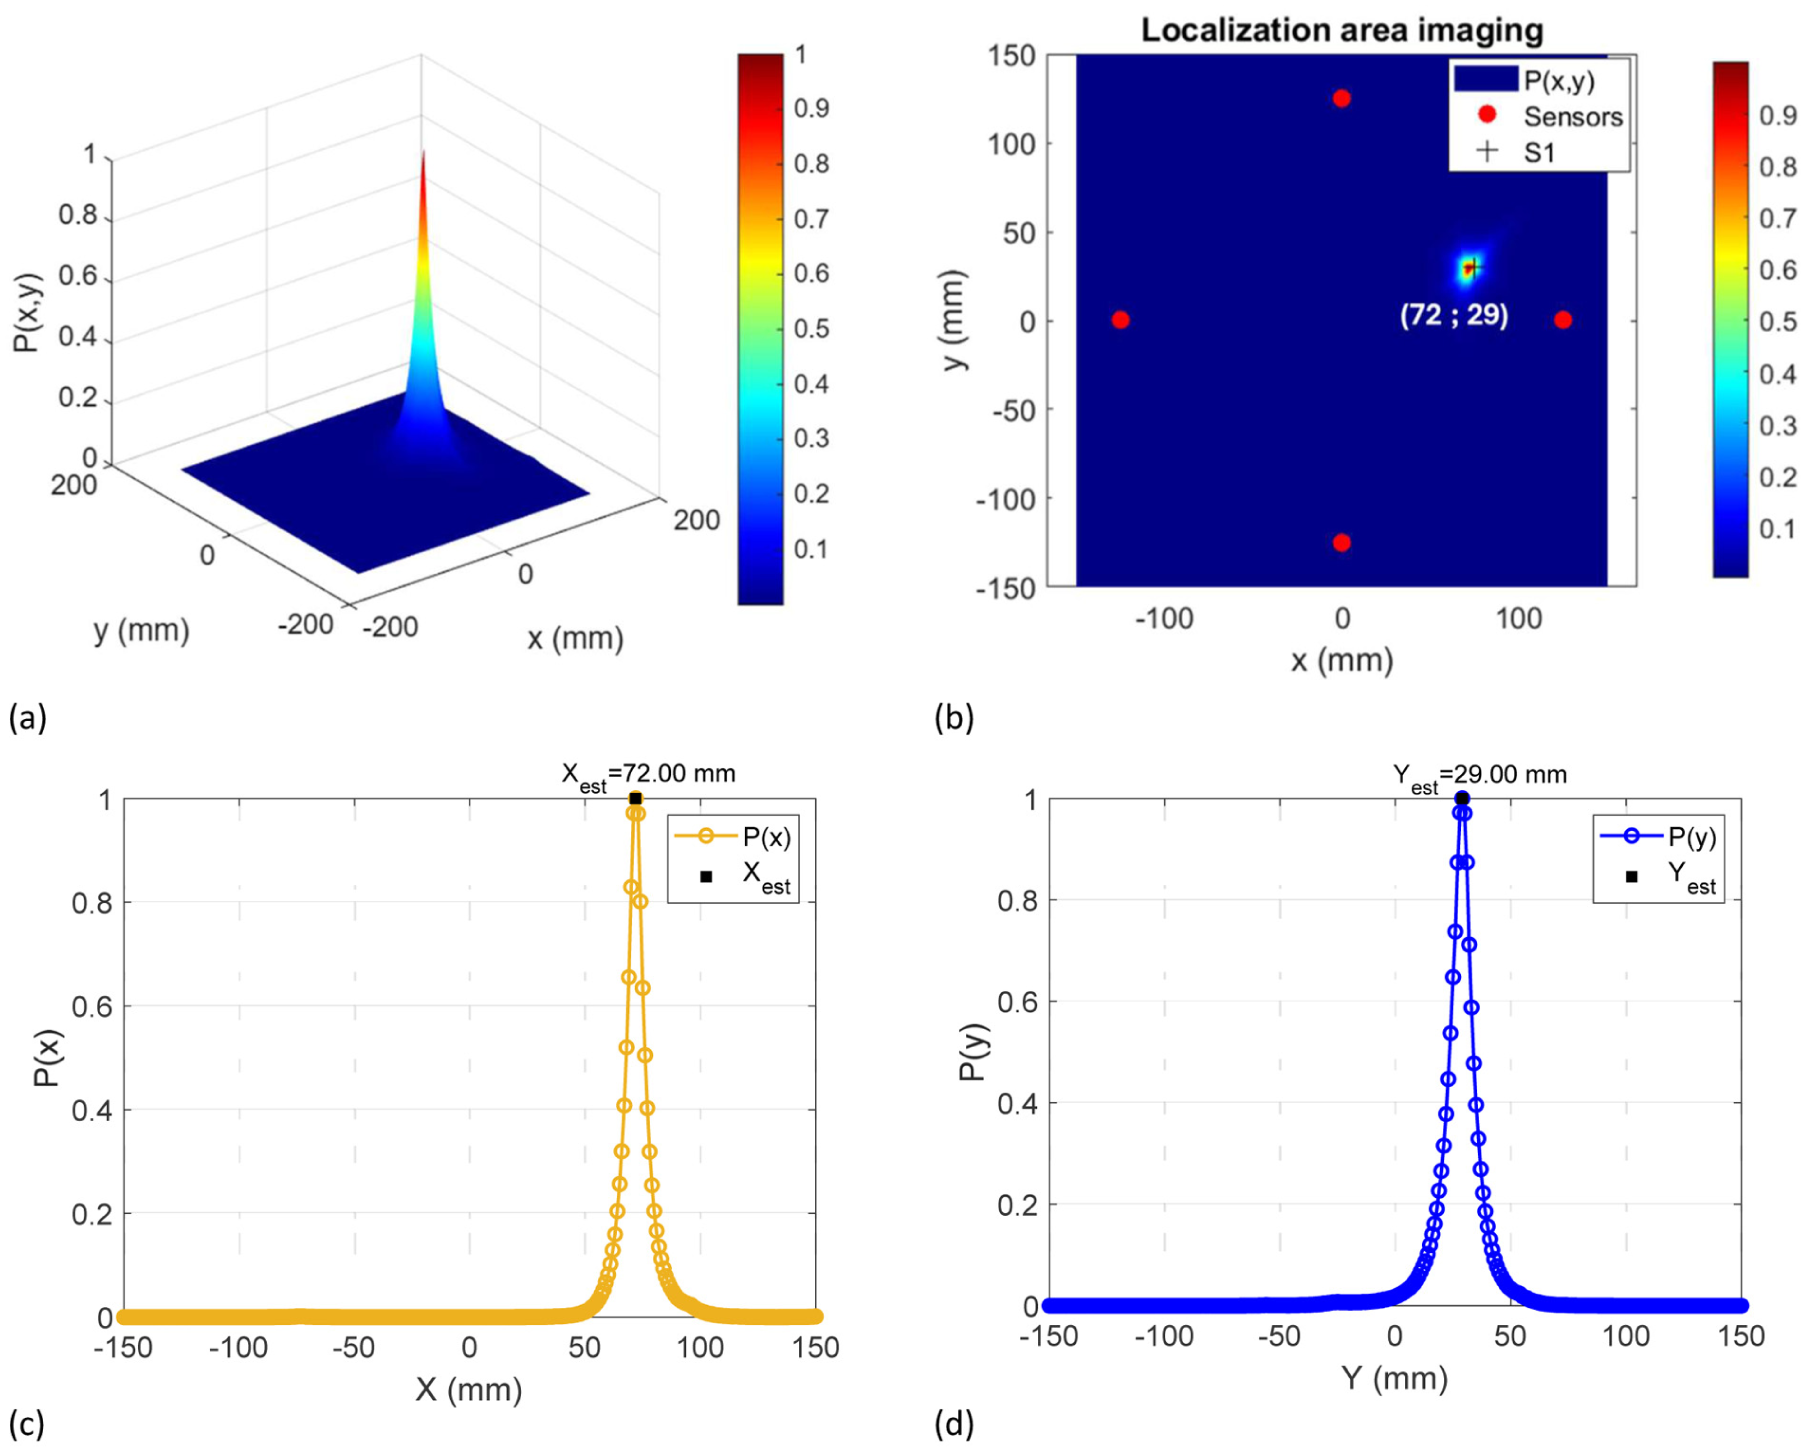
Localization of a single acoustic source: (a) 3D global likelihood map, (b) localization map, (c) global likelihood distribution along the x-axis, and (d) global likelihood distribution along the y-axis. 3D: three-dimensional.
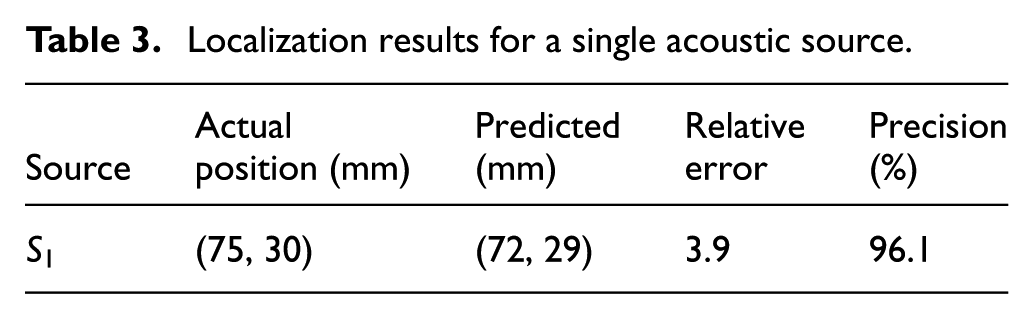
The results of the localization are summarized in Table 3, indicating that the source was localized with an accuracy of 96.3%.
Localization results for a single acoustic source.
Localization of multiple acoustic sources
In this section, we discuss the problem of the localization of multiple acoustic sources on a carbon–epoxy composite plate. For this purpose, six mine breaks are successively initiated at locations
We first present the results obtained for the localization of the first three sources. These results are then compared to those obtained from the localization of six sources to evaluate the impact of the number of sources on the accuracy of the algorithm.
The first case, illustrated in Figure 8, shows the probability density function with three distinct maxima, whose estimated coordinates are (49.13; 66.85), (72.00; 29.00), and (−50.32; 40.90). These maxima correspond to the positions predicted by the proposed method. The location accuracies obtained are 96.1% for
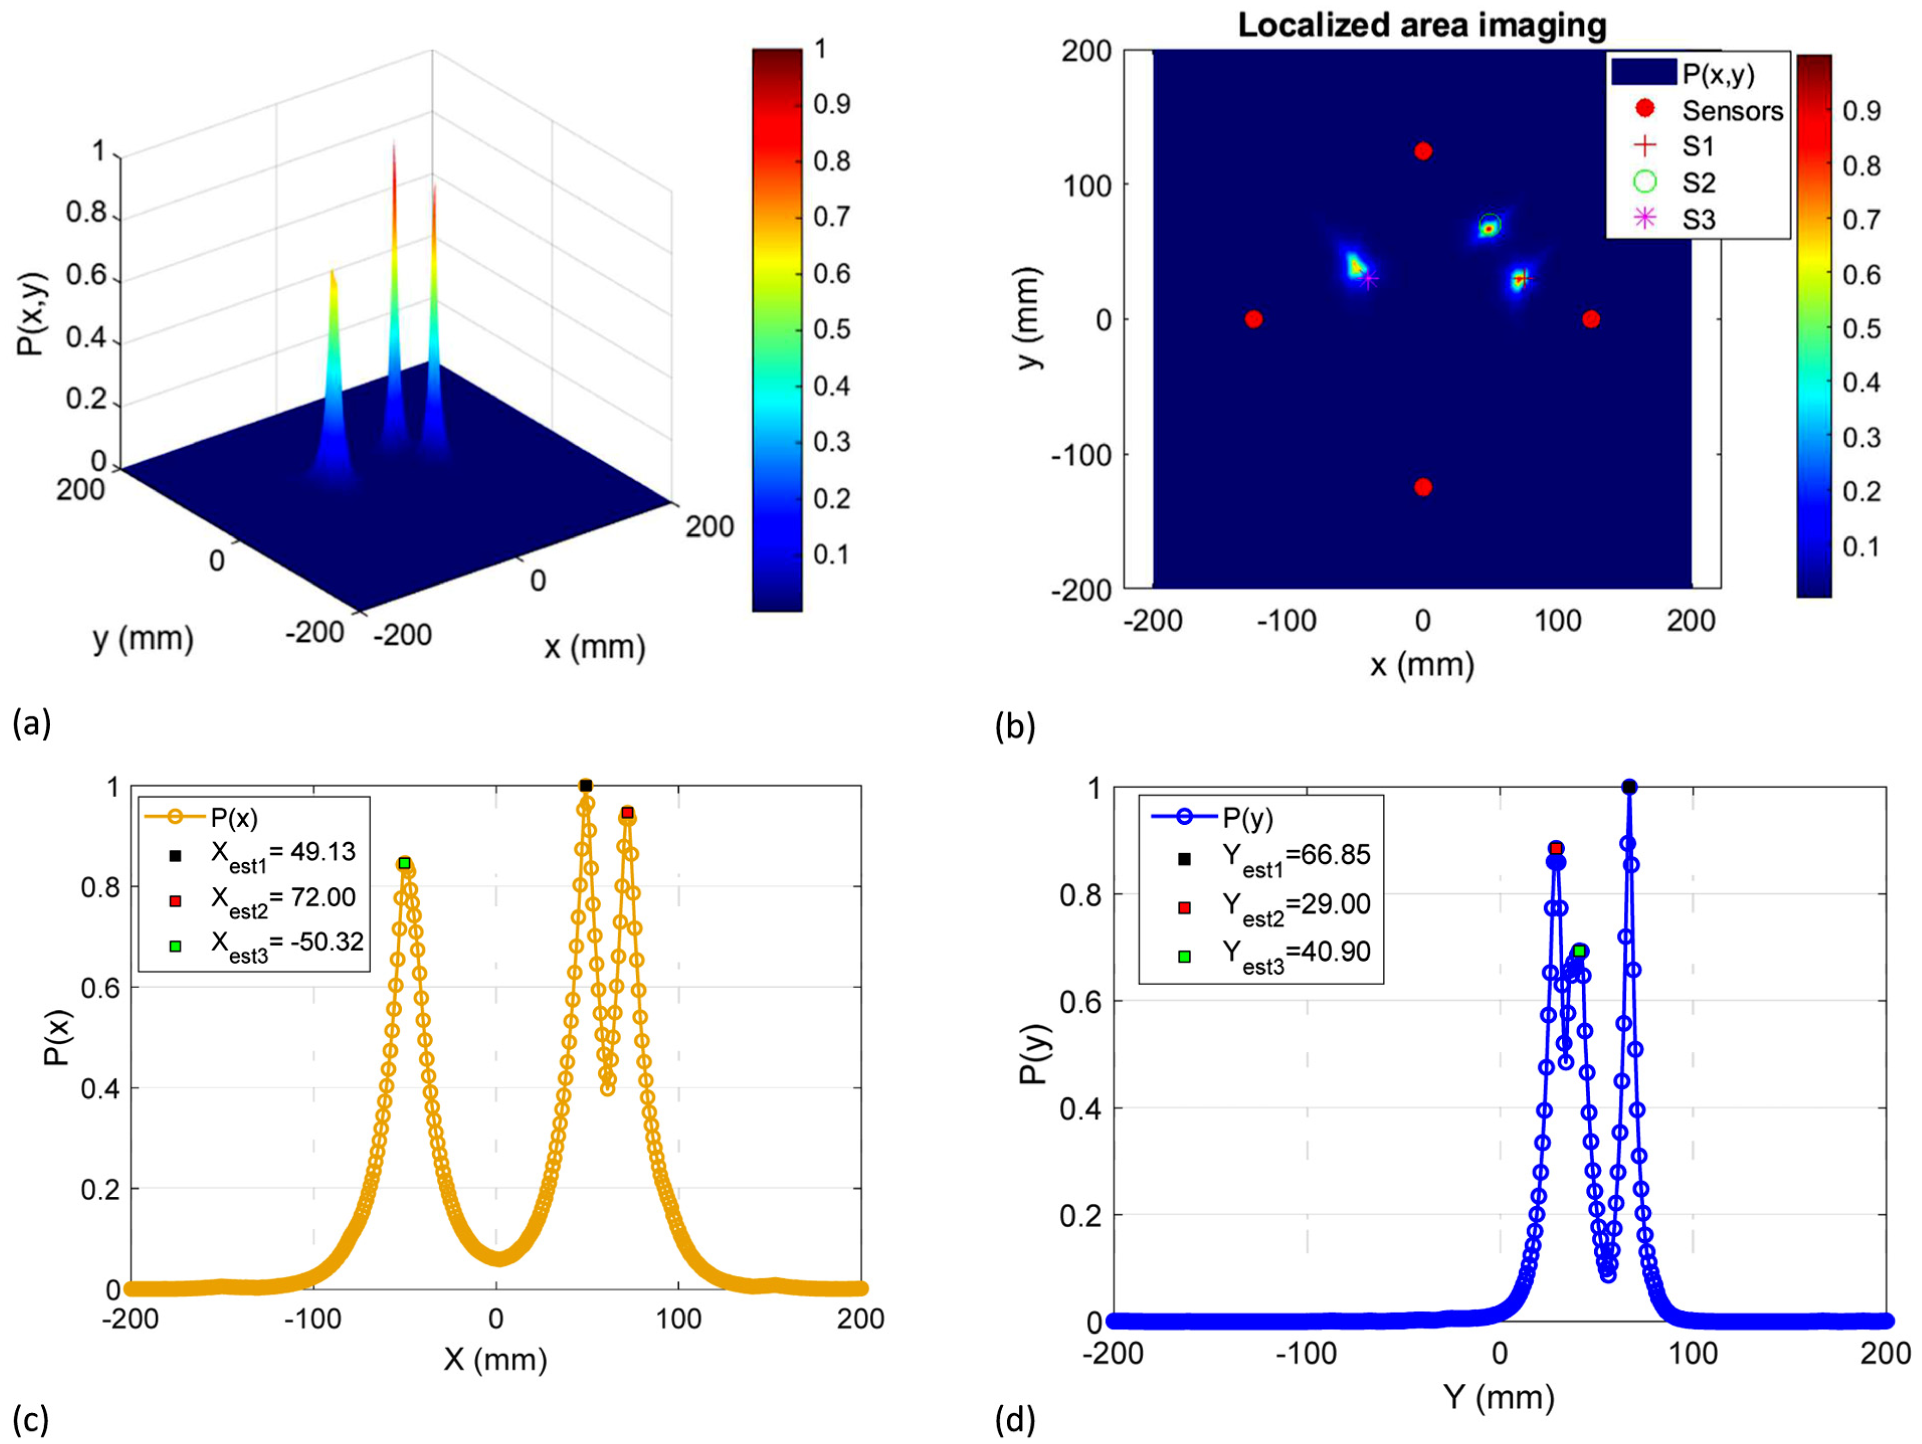
Localization of (03) sequential acoustic sources: (a) 3D global likelihood map, (b) localization map, (c) global likelihood distribution along the x-axis, and (d) global likelihood distribution along the y-axis. 3D: three-dimensional.
Localization results for three acoustic sources.
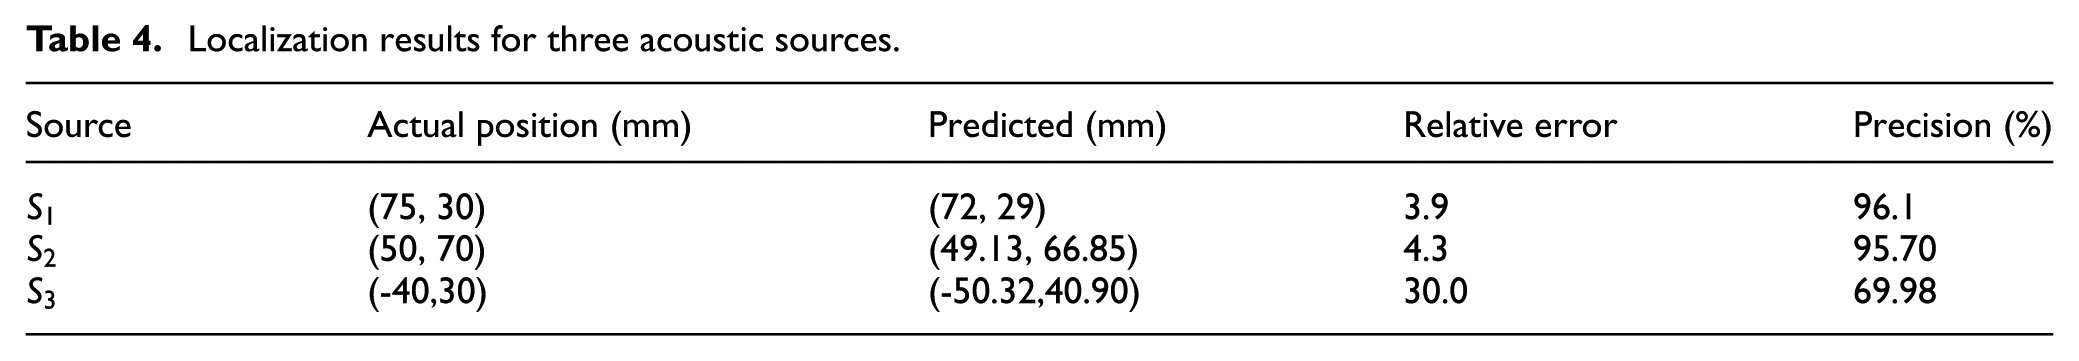
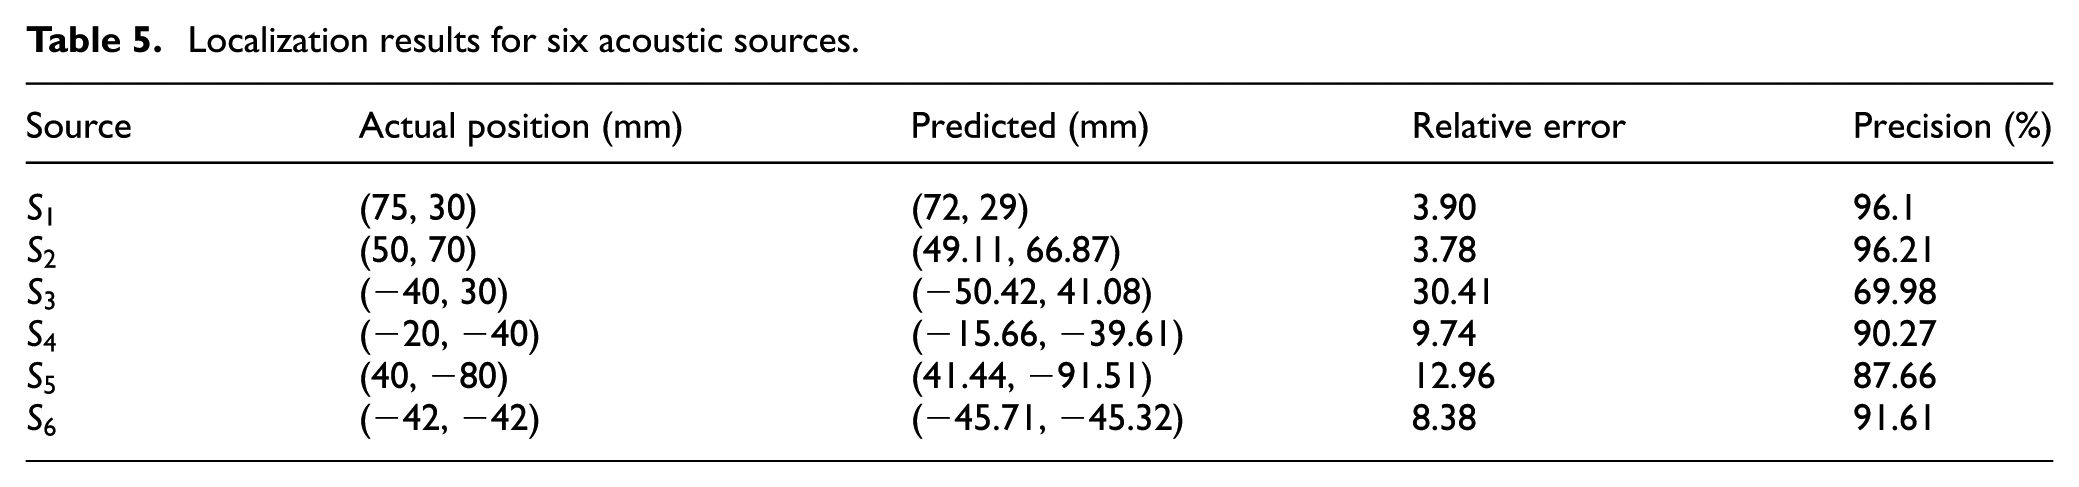
Figure 9 shows the results of the localization of six sequential acoustic sources. The maxima of the overall likelihood map are clearly identifiable and well localized in the corresponding spatial distribution. Table 5 summarizes the performance of the proposed method. The precision observed varies from 76.06 to 96.16%; this variability mainly being related to the anisotropy of the material and the directional attenuation of the acoustic waves. Indeed, the composite material used presents mechanical anisotropy, particularly because of the preferential orientation of the fibers. This characteristic necessarily causes a directional variation in the propagation speed of acoustic waves, which complicates the modeling of the actual trajectory of the signals. The lowest precisions, observed for sources
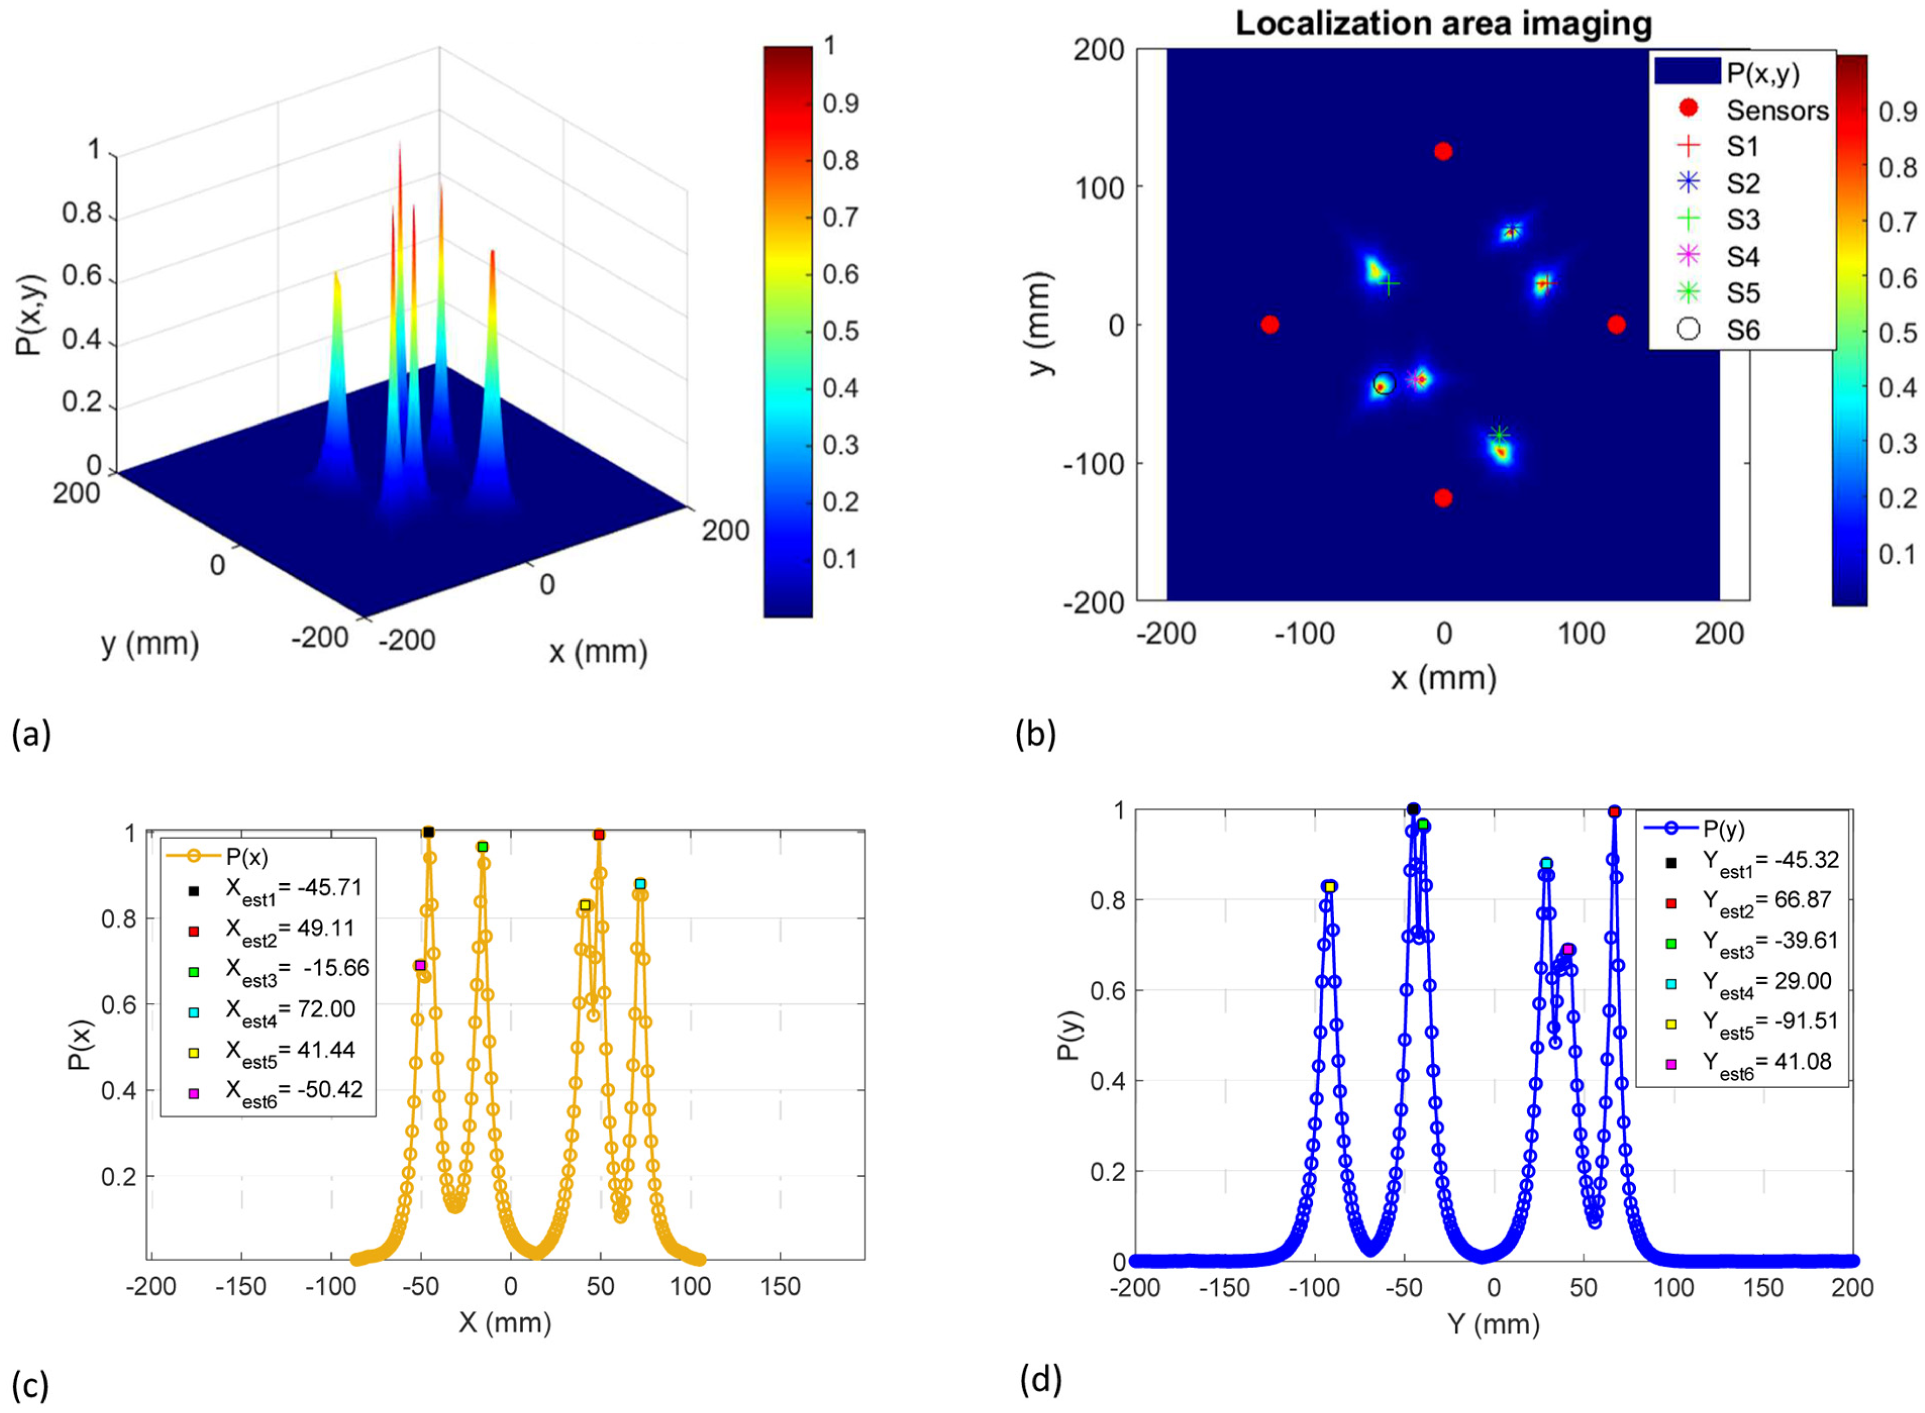
Localization of (06) sequential acoustic sources: (a) 3D Global Likelihood Map, (b) Localization Map, (c) Global Likelihood Distribution along the x-axis, and (d) Global Likelihood Distribution along the y-axis.
Localization results for six acoustic sources.
We also note that the proposed method generally provides greater accuracy, with a lower average error. This can be explained by the fact that it directly uses absolute arrival times, which allows for better consideration of directional speeds.
Finally, when comparing the localization results of the first three sources with those obtained when localizing all six sources, there is a slight decrease in accuracy. This is because as the number of sources increases, it becomes more difficult for the algorithm to correctly identify the areas where the sources are located. The presence of multiple signals makes the search for the maximum more complex, which can slightly reduce the accuracy and precision of the results.
Although the proposed method performs well under temporally separated signals, the system does not detect cases where events occur before reaching the sensor, and such events are treated as a single event. This can be considered a limitation of the method.
To further clarify the positioning of the proposed method with respect to existing approaches, a comparative summary is provided in Table 6, highlighting the main differences and advantages in terms of localization principle, multi-source capability, anisotropy handling, localization accuracy, and robustness to noise.
Comparison of the proposed method with existing AE source localization methods.
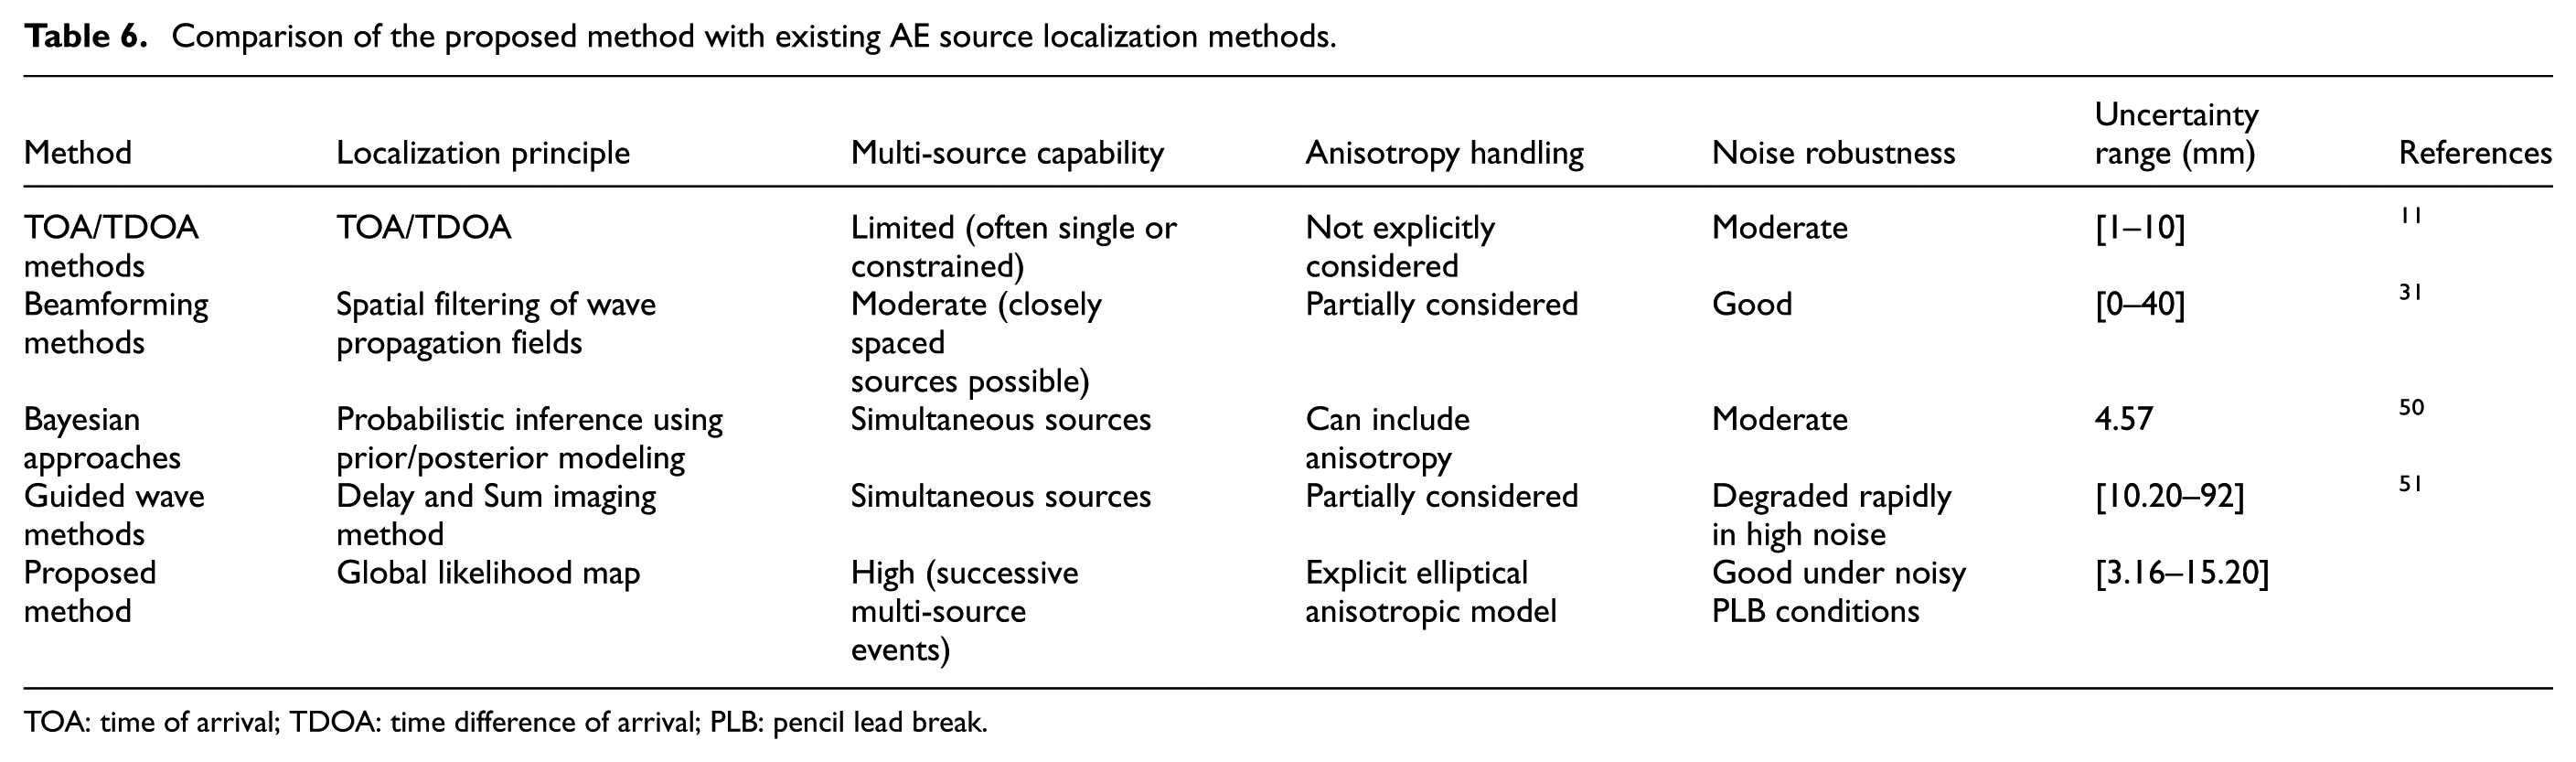
TOA: time of arrival; TDOA: time difference of arrival; PLB: pencil lead break.
Conclusion
The localization of acoustic sources is attracting growing interest as a promising approach for SHM. In this study, we proposed a likelihood-based time-of-flight method with quadratic regression for the localization of multiple sequential acoustic sources on an anisotropic carbon–epoxy composite plate. The acoustic sources were restricted to PLB tests obtained on a single plate. The proposed approach is based on the construction of a global likelihood map obtained by aggregating the individual contributions associated with temporally separated AE events using signal arrival time information. The main contributions of the proposed method can be summarized as follows:
(i) Unlike conventional AE source localization techniques such as TOA and TDOA, the proposed approach explicitly accounts for direction-dependent wave velocities and anisotropic propagation, providing a more realistic representation of wave behavior in composite materials.
(ii) The method is designed for in situ and near real-time damage localization, making it particularly suitable for acoustic-emission-based SHM, where damage events must be detected and localized during the operation of the structure.
(iii) The proposed framework considers spatially and temporally evolving acoustic sources, which better reflect the physical nature of damage mechanisms in composite materials, such as fiber breakage, matrix cracking, and delamination.
(iv) In the post-processing stage, the method analyzes the complete dataset simultaneously rather than processing each AE event independently, which improves computational efficiency and significantly reduces the overall processing time. This feature makes the approach particularly suitable for applications involving a large number of AE events.
Although recent LSSC-based approaches have demonstrated the ability to localize multiple damages without prior knowledge of wave velocity, their practical application to composite structures remains limited by the need for many closely spaced sensors and by localization artifacts arising from line intersections. In contrast, the proposed likelihood-based time-of-flight method takes advantage of known or calibrated material properties, which are commonly available in industrial SHM applications, to provide physically interpretable source locations using significantly fewer sensors. Moreover, by assuming that AE sources occur sequentially, the method avoids signal overlap effects and enables stable and computationally efficient localization of multiple sources, making it well suited for SHM applications.
Finally, the study highlights the significant influence of material anisotropy and wave attenuation on localization accuracy.
The development of adaptive compensation strategies that account for attenuation and varying noise levels, the repetition of damage events to ensure statistical consistency, as well as the incorporation of real structural damage mechanisms such as cracking or delamination, could further improve the likelihood model and enhance localization precision.
Footnotes
Acknowledgements
This work was carried out within the framework of the CPER–RITMEA project, co-funded by the Hauts-de-France Region and IMT Nord Europe. The authors also gratefully acknowledge the support of the European Community.
Funding
The authors received no financial support for the research, authorship, and/or publication of this article.
Declaration of conflicting interests
The authors declared no potential conflicts of interest with respect to the research, authorship, and/or publication of this article.