
Abstract
The effect of multi-walled carbon nanotubes (MWCNTs) on the mechanical performance, electrical percolation threshold, and structural health monitoring capability of adhesively bonded joints was investigated. Epoxy adhesives reinforced with MWCNTs were fabricated in two configurations: randomly dispersed and electrically aligned using an external electric field. The specimens were tested using double cantilever beam samples. The electrical percolation threshold was determined via dielectric relaxation spectroscopy. Furthermore, the electrical response was monitored during Mode-I fracture testing through impedance measurements. The results indicated that the alignment of nanotubes significantly reduces the electrical percolation threshold to approximately 0.1 wt% or lower, whereas this value is about 0.5 wt% for randomly dispersed systems. The optimum mechanical performance was observed at an MWCNT content of 0.3 wt%, corresponding to an increase in fracture energy of approximately 264% and 400% for the randomly dispersed and aligned specimens, respectively. Impedance measurements revealed a clear correlation between crack propagation and electrical response. While randomly dispersed systems exhibited a larger impedance increase, aligned specimens showed a more stable and gradual response due to the preservation of conductive pathways. Importantly, alignment enables the transition to conductive behavior below the mechanically optimal concentration, allowing simultaneous achievement of high mechanical performance and effective damage sensing. These findings demonstrate that controlled MWCNT alignment provides a promising strategy for the development of multifunctional adhesive joints with enhanced mechanical properties and reliable SHM capability.
Keywords
Introduction
Adhesively bonded joints have attracted considerable attention in recent years across various industries, including aerospace, automotive, and marine engineering, owing to their superior advantages.1,2 These benefits encompass a high strength-to-weight ratio, a more uniform stress distribution compared to mechanical fasteners, reduced manufacturing costs, and enhanced fatigue properties.3,4 Despite these advantages, several limitations were identified, such as prolonged curing times, susceptibility to environmental degradation, and the necessity for extensive surface preparation. 3 In addition, the mechanical performance of adhesively bonded joints is strongly influenced by surface treatment, joint configuration, and environmental conditions, which can significantly affect fracture toughness, load-bearing capacity, and damage evolution.5,6 Furthermore, these joints are generally considered permanent, as disassembly is typically impossible without causing significant damage. 7 This presents a significant challenge for structural health inspection, repair, or restoration.8,9 Consequently, the development of methodologies for in situ damage detection and prognosis without disassembly was considered critically important. 10
Numerous non-destructive testing techniques, including thermography, radiography, ultrasonic waves, and acoustic emission, have been employed to assess the integrity of adhesive joints. 11 While some success has been demonstrated, these methods were often limited by issues of accuracy and practical applicability. 12 Moreover, their utilization for continuous, in-service structural health monitoring (SHM) proved challenging, frequently requiring specialized expertise and costly equipment.12,13 To address these constraints, integrated SHM approaches were explored, which are defined as processes for the continuous in situ analysis of a structure to detect damage during its service life.14–16 In recent years, impedance- and resistance-based self-sensing approaches have attracted significant attention in SHM of adhesive joints, due to their ability to provide real-time damage detection without the need for external sensors. The incorporation of conductive nanofillers such as carbon nanotubes (CNTs) enables the formation of electrically responsive networks within the adhesive layer, allowing damage evolution to be monitored through changes in electrical properties. 17 SHM systems consist of networks of embedded sensors that are permanently installed within a structure and continuously monitored over time. SHM can be classified as either passive or active. In passive SHM, the condition of the structure is inferred using passive sensors (such as load, stress, environmental conditions, performance indicators, and acoustic emission from cracks), which are continuously monitored and their data are fed back into a structural model for health assessment. 18
Research efforts have been directed toward overcoming the inherent limitations of adhesive joints through material modification. A promising strategy involved the incorporation of nanoscale reinforcements into the adhesive polymer matrix.19–21 It was established that the mechanical properties of epoxy adhesives can be substantially enhanced by the addition of such reinforcing phases. 22 Various nanofillers, including graphene nanoplatelets (GNPs), 23 CNTs, 24 nano-silica, 25 and silicon carbide nanotubes, 26 have been investigated for this purpose. Among these, multi-walled carbon nanotubes (MWCNTs) were extensively studied due to their theoretically and experimentally validated combination of exceptional electrical and mechanical properties, which made them ideal candidates for reinforcing polymer matrices. 27
The effect of MWCNT incorporation on the fracture behavior of adhesive joints was investigated by Khoramishad and Khakzad. 19 Their findings revealed that the addition of 0.3 wt.% MWCNTs to the adhesive layer resulted in a 58.4% increase in fracture energy compared to the neat adhesive. However, a deterioration in mechanical properties was observed with further MWCNT addition. Similarly, Vahedi et al. 28 reported that MWCNT incorporation enhanced both the mechanical and electrical properties of epoxy adhesives, demonstrating that a concentration exceeding 0.5 wt.% induced a transition to the conductive phase. Ayatollahi et al. 27 determined that MWCNTs with a smaller diameter and longer length, corresponding to a higher aspect ratio, had a more considerable effect on the electrical and mechanical properties of the nanocomposite.
The enhancement in electrical conductivity is attributed to the formation of a percolated network within the polymer matrix upon the addition of conductive nanofillers.29–32 This conductivity facilitates a self-sensing capability for damage detection,33,34 as damage events disrupt the conductive pathways, leading to a measurable increase in electrical resistance.32,35–37 Furthermore, damage-induced changes in the tunneling resistance between adjacent MWCNTs due to altered spacing, alongside piezoresistive effects from deformation, provide additional sensing mechanisms that can be exploited for SHM.37,38
Daliri et al. 39 used GNPs and MWCNTs to create conductive adhesives and monitored electrical impedance variations for damage identification. The electrical behavior of these nanocomposites was further elaborated by Georgousis et al., 37 who indicated that a constant alternating current (AC) conductivity over a frequency range signified conductive behavior. The minimum nanofiller concentration required for this transition was defined as the percolation threshold, which is commonly investigated using dielectric relaxation spectroscopy (DRS). An effective strategy for enhancing composite properties at lower filler concentrations involves the alignment of nanofillers. Although nanofillers are typically randomly dispersed, alignment in a specific direction has been shown to significantly improve composite performance. 40 For instance, Khan et al. 41 reported that aligned CNTs yielded higher electrical conductivity than randomly distributed ones. Various alignment techniques have been developed, including mechanical stretching42,43 and the application of electric,44,45 magnetic, 46 or shear flow fields. 47 Among these, electric field-assisted alignment has been demonstrated to be superior for carbon nanostructures. 48 Both direct current (DC) and AC electric fields have been utilized to align MWCNTs in adhesively bonded joints.24,40 The alignment behavior is significantly influenced by the field type; DC fields cause particle migration and accumulation at electrodes, whereas AC fields are more effective for achieving a uniform aligned network. 49
Although several studies have successfully utilized the real part of electrical impedance for damage detection in adhesive joints, these methods typically require a high concentration of nanofillers to ensure sufficient conductivity. This high concentration often compromises the mechanical properties and load-bearing capacity of the joint. To address this limitation, the present study aimed to achieve electrical conductivity with lower MWCNT concentrations by implementing through-thickness alignment of the nanotubes within the adhesive layer. This approach was designed to facilitate SHM while simultaneously improving mechanical load-bearing capacity. Double cantilever beam (DCB) specimens were fabricated with both randomly dispersed and aligned MWCNTs to investigate the effect of alignment on electrical and mechanical behavior. The percolation threshold was evaluated using DRS. Crack growth was monitored in situ by tracking changes in the real part of the electrical impedance during mechanical testing, and these measurements were correlated with the load–displacement curves. Finally, the fracture surfaces of the DCB joints were examined using field emission scanning electron microscopy (FESEM) to observe the underlying fracture mechanisms.
Materials and methods
The DCB specimens were fabricated using 4 mm-thick 6061-T6 aluminum substrates with a Young’s modulus of 68.9 GPa and a yield strength of 276 MPa. The adhesive used was KER-828 epoxy resin (KUMHO P&B, South Korea), a bisphenol-A/epichlorohydrin-based liquid resin with a viscosity range of 12–14 Pa s. This epoxy was cured with triethylene tetramine (TETA), an amine-based hardener, which was added at a weight ratio of 10%. To improve the adhesive’s properties, MWCNTs supplied by Neutrino (Iran) were incorporated. The utilized MWCNTs had a length between 10 and 30 μm, an outer diameter of less than 10 nm, and a purity exceeding 95%.
Fabrication of unreinforced joints
The Aluminum 6061-T6 substrates with the dimensions of 200 mm × 25 mm × 4 mm were precisely sectioned using a laser cutter. To enhance adhesive bonding by penetration of adhesive into surface asperities, the bonding surfaces were roughened with a 120-grit aluminum-oxide sandpaper, following the methodology suggested by Banea et al. 50 (Figure 1(a)). Subsequently, the substrates were cleaned in an alkaline solution for 20 min to remove grease and contaminants. In accordance with standard ASTM D2651, an acid etching process was then conducted by immersing the aluminum surfaces in an acid solution maintained at 66°C–71°C for 12–15 min (Figure 1(b) and (c)), with the temperature being controlled using a thermometer. Finally, the substrates were rinsed with deionized water, dried in an oven, and prepared for joint fabrication (Figure 1(d)).
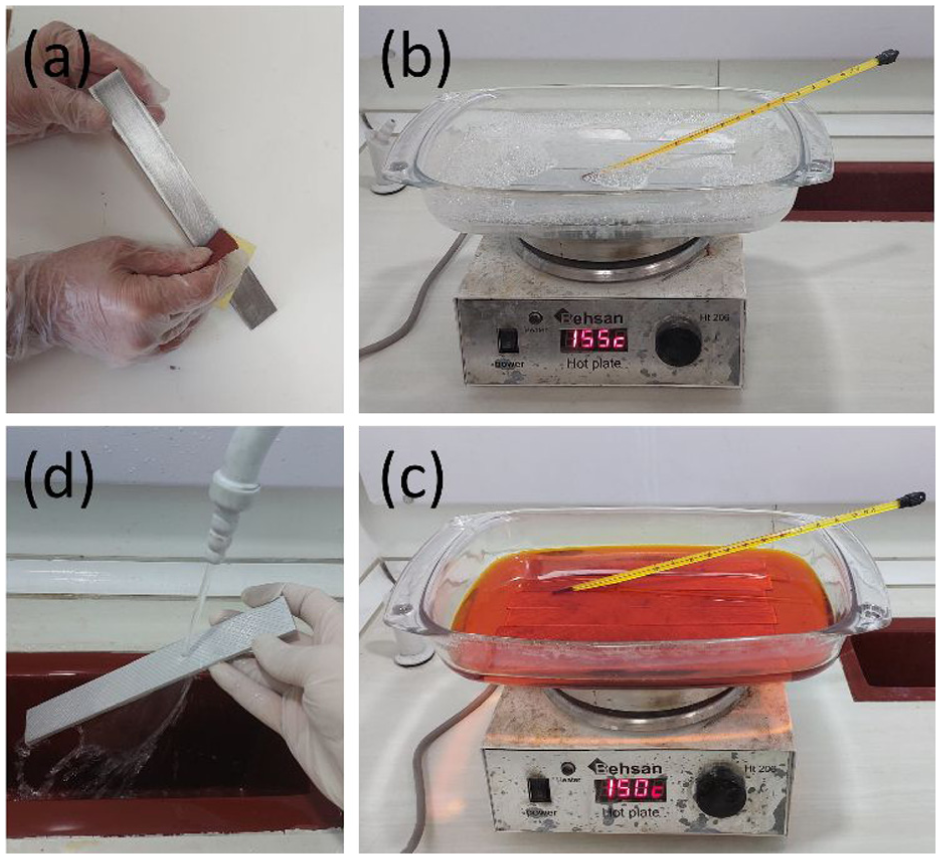
Substrate preparation procedure: (a) Surface roughening with sandpaper, (b) Alkaline solution cleaning, (c) Acidic solution cleaning, and (d) Rinsing with deionized water.
The epoxy adhesive was prepared by mixing the KER-828 resin with the TETA hardener, followed by mechanical stirring for 10 min. The treated bonding surfaces of the aluminum substrates were coated with the mixed adhesive. To maintain a consistent adhesive layer thickness of 0.5 mm, polycarbonate spacers were positioned at both ends of the specimens. An initial pre-crack was introduced by inserting a thin polyethylene film (thickness < 0.13 µm) coated with release wax at the mid-plane of the adhesive bond. The DCB specimens were then fabricated in accordance with standard ISO 25217; the specific dimensions are illustrated in Figure 2. The assembled specimens were placed in a custom fixture designed to apply uniform pressure and cured in an oven at 60°C for 90 min. Following the curing process, excess adhesive was removed using sandpaper, and piano hinges were attached to the substrates using super glue.
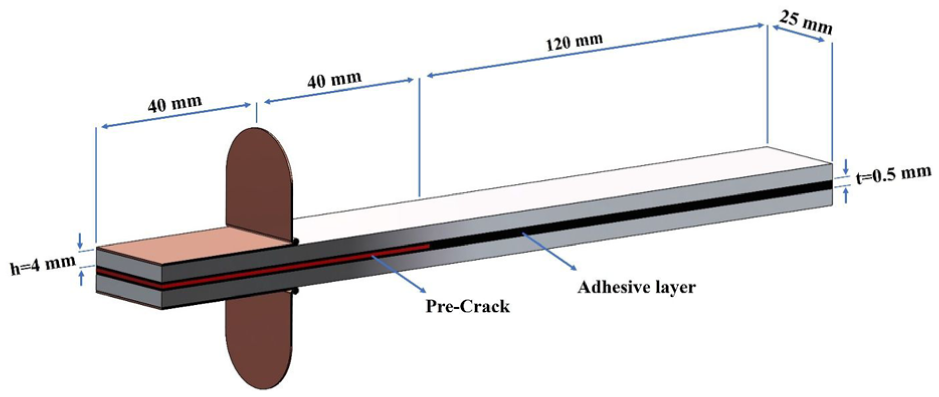
Dimensions and geometry of the DCB specimens.
Fabrication of joints with randomly dispersed MWCNTs
The nanocomposite adhesive was prepared by incorporating MWCNTs at weight percentages (wt.%) of 0.1, 0.3, 0.5, and 0.7 into the epoxy resin. The mixture of resin/nanofillers was placed on a hot plate to reduce the resin’s viscosity and facilitate initial dispersion. To achieve a uniform distribution of nanotubes, a probe-type ultrasonic homogenizer was employed to sonicate the mixture for 45 min. The homogenization parameters were selected based on the study conducted by Montazeri and Chitsazzadeh. 51 To prevent thermal degradation of the epoxy polymer chains or MWCNTs,52,53 the container was immersed in an ice-water bath throughout the ultrasonication process (Figure 3(a)), and the temperature was continuously monitored with a laser thermometer. After achieving a homogeneous dispersion, the TETA hardener was added to the mixture and mechanically stirred for 10 min (Figure 3(b)). The DCB specimens were then fabricated using this reinforced adhesive, following the identical procedure detailed in section “Fabrication of unreinforced joints.”
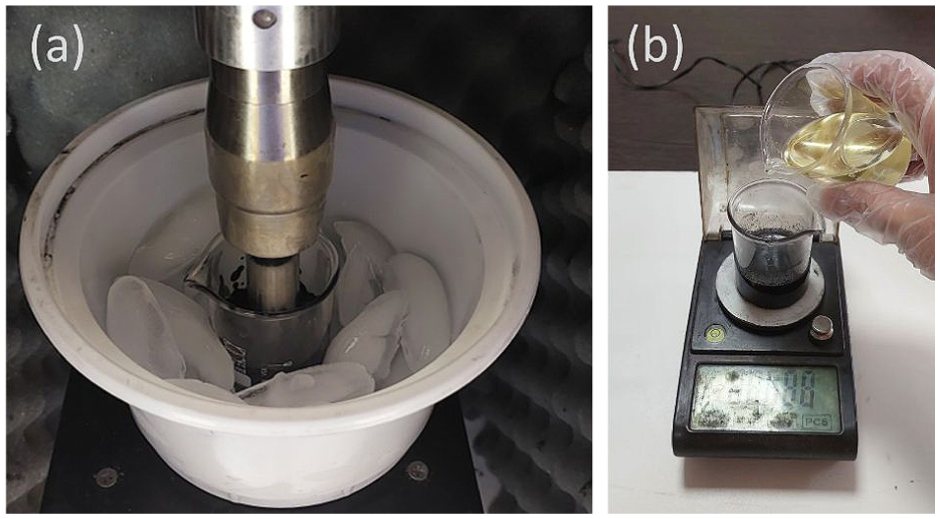
(a) Ultrasonic homogenization for dispersing reinforcing particles into the adhesive matrix and (b) Incorporation of hardener into the epoxy/MWCNT blend.
Fabrication of joints with aligned MWCNTs
The alignment of MWCNTs is accomplished through the principle of dielectrophoresis. When randomly dispersed MWCNTs within a dielectric epoxy matrix are subjected to an external electric field, they become polarized. The difference in dielectric and electrical conductivity properties between the nanotubes and the matrix leads to the formation of induced dipoles. The interaction between these dipoles and the applied electric field generates a torque, causing the MWCNTs to rotate and align parallel to the field lines,40,54 as illustrated in Figure 4.
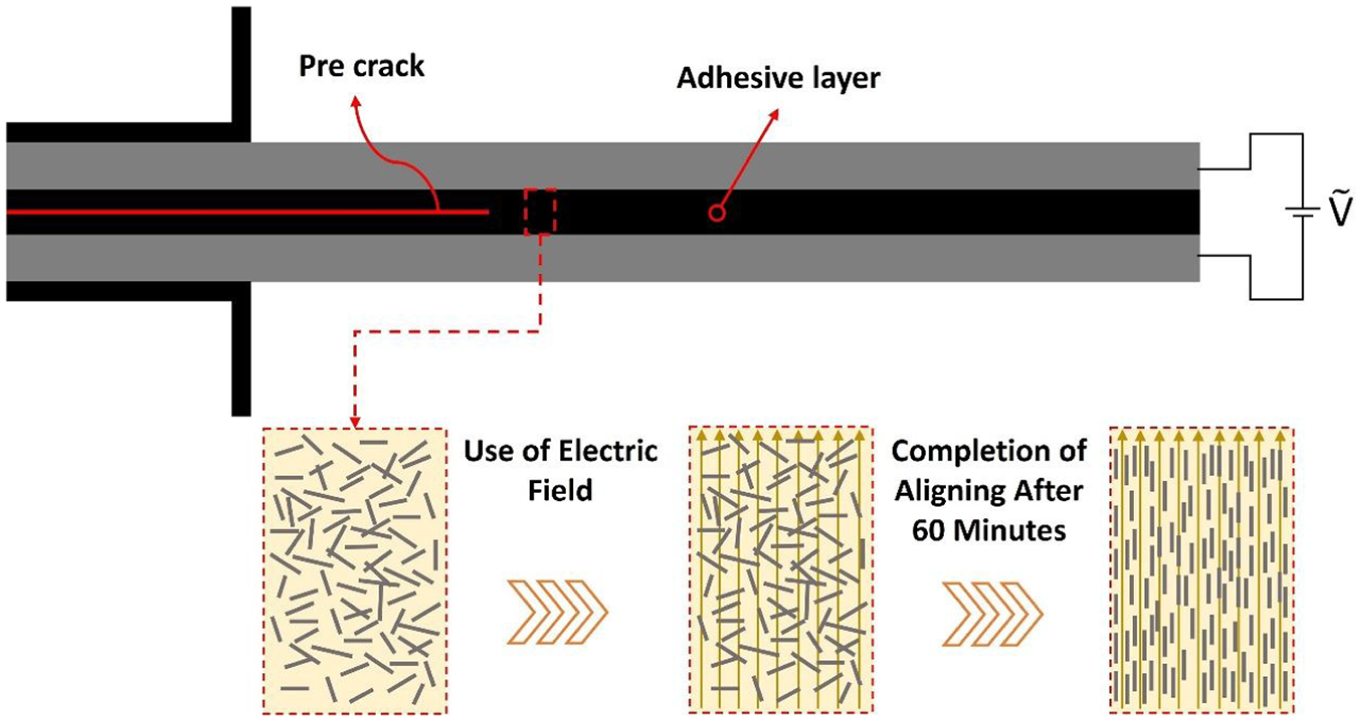
Schematic illustration of the electric field setup used for the alignment of reinforcing particles.
The fabrication procedure for these joints initially followed the method described in section “Fabrication of joints with randomly dispersed MWCNTs.” After the joints were assembled but before oven curing—while the MWCNT-reinforced adhesive remained in a low-viscosity state—the alignment process was initiated. An electrical current converter capable of generating an AC with voltages of 0–30 V was utilized. Electrical wires were connected to the aluminum substrates, which functioned as electrodes, using a copper conductive adhesive (Figure 5). According to the work of Gholami et al., 40 an electric field with a magnitude of 50 V/mm was applied for 60 min to align the nanotubes. Finally, the specimens were placed in an oven for curing.
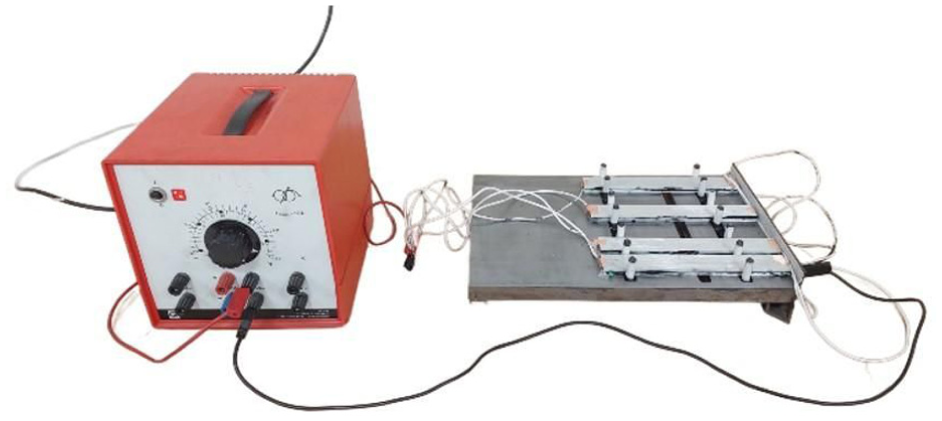
Equipment for AC power conversion used to align carbon nanotubes.
Test methods
The experimental procedure encompassed mechanical fracture testing coupled with in situ electrical monitoring. For each DCB configuration, three specimens were fabricated and subjected to Mode-I fracture testing in accordance with standard ISO 25217. The tests were conducted using a universal testing machine (SANTAM STM-20; SANTAM Engineering Design Co., Iran) at a constant crosshead displacement rate of 0.5 mm/min until complete fracture occurred. A high-resolution imaging system was used to capture images during testing, enabling crack length measurement at each interval through digital image correlation analysis, as illustrated in Figure 6.
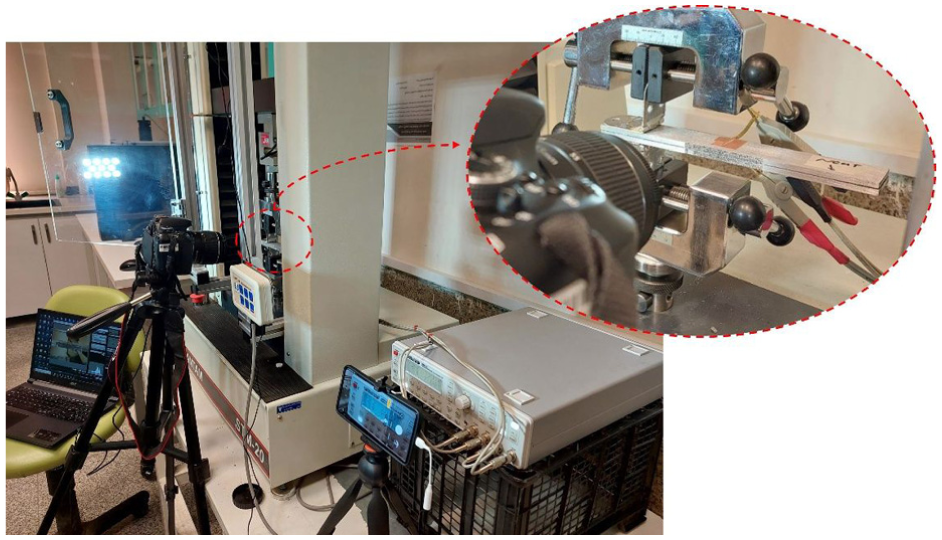
Mode-I fracture test of adhesively bonded joints with an electrical impedance monitoring setup.
To assess the electrical percolation threshold of the MWCNT-reinforced specimens, the DRS method was used. This involved measuring the AC electrical conductivity of each specimen over a frequency range of 101–106 Hz. Additionally, the real part of the electrical impedance was monitored to support SHM and damage detection in the adhesive joints, with the experimental setup shown schematically in Figure 7. All electrical measurements, including impedance and conductivity, were taken using an. Inductance – Capacitance – Resistance (LCR) meter (HUMEG-HM8118; Rohde & Schwarz HAMEG Instruments GmbH, Mainhausen, Germany). The data acquisition rate was set to its FAST mode, capturing 14 data points per second. Electrodes were attached to the center of each aluminum substrate using a copper conductive adhesive. Because of the high intrinsic conductivity of the aluminum substrates, the specific electrode placement was considered to have no significant effect on the measurement results. 39 The electrodes were attached at identical locations on all specimens to ensure a consistent measurement configuration. Although the electrical response is influenced by the combined behavior of the adherends, adhesive layer, and evolving crack geometry, the use of high-conductivity aluminum substrates provides a stable baseline current distribution. Therefore, any influence of electrode positioning or contact resistance is systematic across all tests and does not affect the comparative evaluation of damage-induced impedance variations.
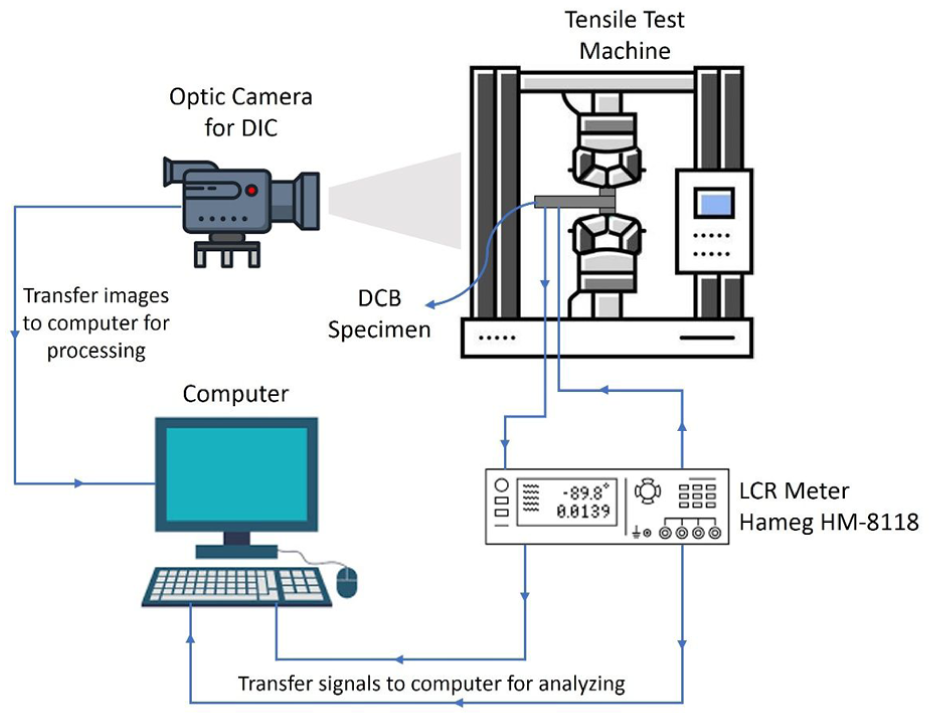
Schematic of the damage detection method based on electrical impedance variation monitoring.
Using the LCR meter, the electrical conductivity and the percolation threshold were first determined for all DCB specimens. A specific frequency at which all specimens demonstrated conductive behavior was subsequently selected to ensure consistent and feasible damage detection during the subsequent mechanical testing. Finally, the fracture surfaces of the tested specimens were examined using FESEM to analyze the underlying fracture mechanisms.
Results and discussion
Fracture behavior of DCB specimens
The unreinforced and reinforced DCB specimens were tested using a SANTAM STM-20 universal testing machine to investigate the effect of MWCNTs on the Mode-I fracture behavior of adhesive joints. The MWCNTs were incorporated in both randomly dispersed and through-thickness aligned configurations. The typical load–displacement responses of adhesively bonded joints reinforced with MWCNTs, both randomly dispersed and aligned through the adhesive thickness at various weight percentages, are shown in Figure 8. Moreover, the maximum load levels of the DCB specimens obtained in the course of testing are compared in Figure 9. Furthermore, the fracture energy of the specimens was evaluated using the compliance-based beam method (CBBM) approach, and the fracture energy response
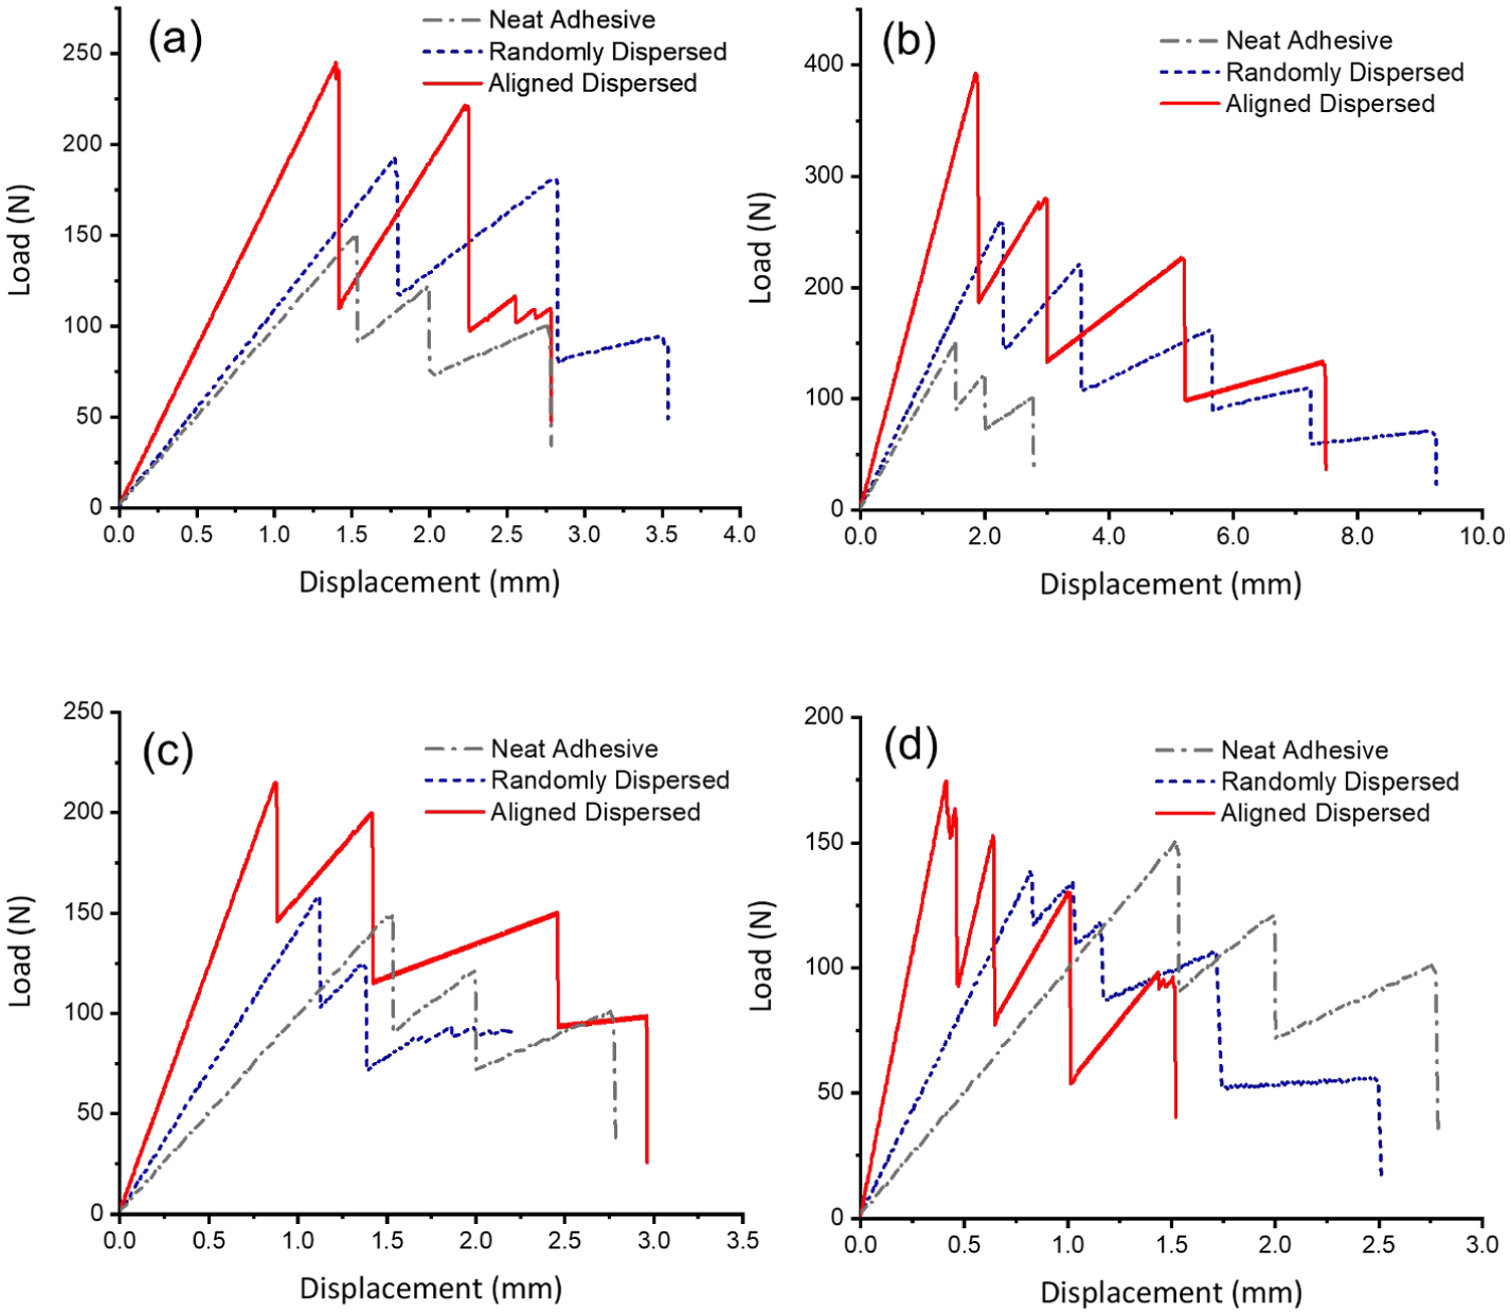
Typical load–displacement curves for the DCB specimens reinforced with (a) 0.1 wt%, (b) 0.3 wt%, (c) 0.5 wt%, and (d) 0.7 wt% MWCNTs.
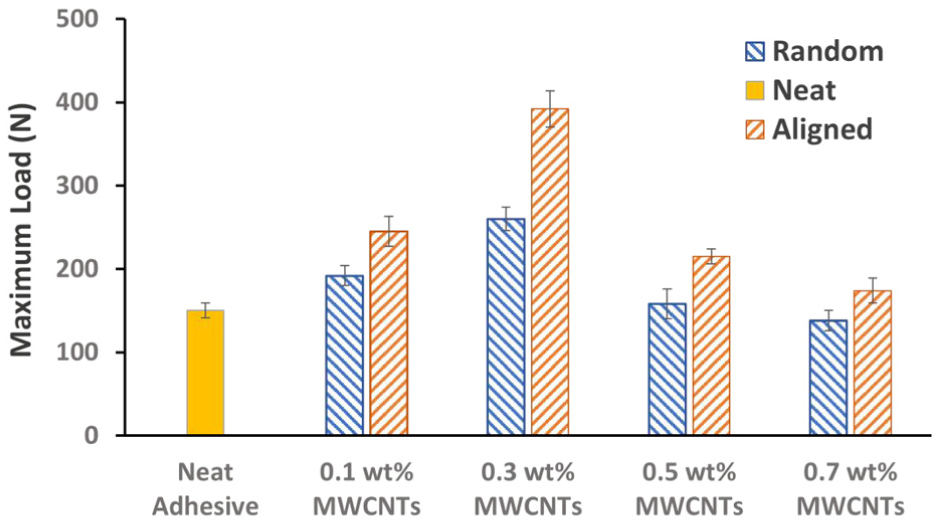
Comparison of the maximum loads for the specimens fabricated with neat adhesive and adhesives reinforced with randomly distributed and aligned MWCNTs.
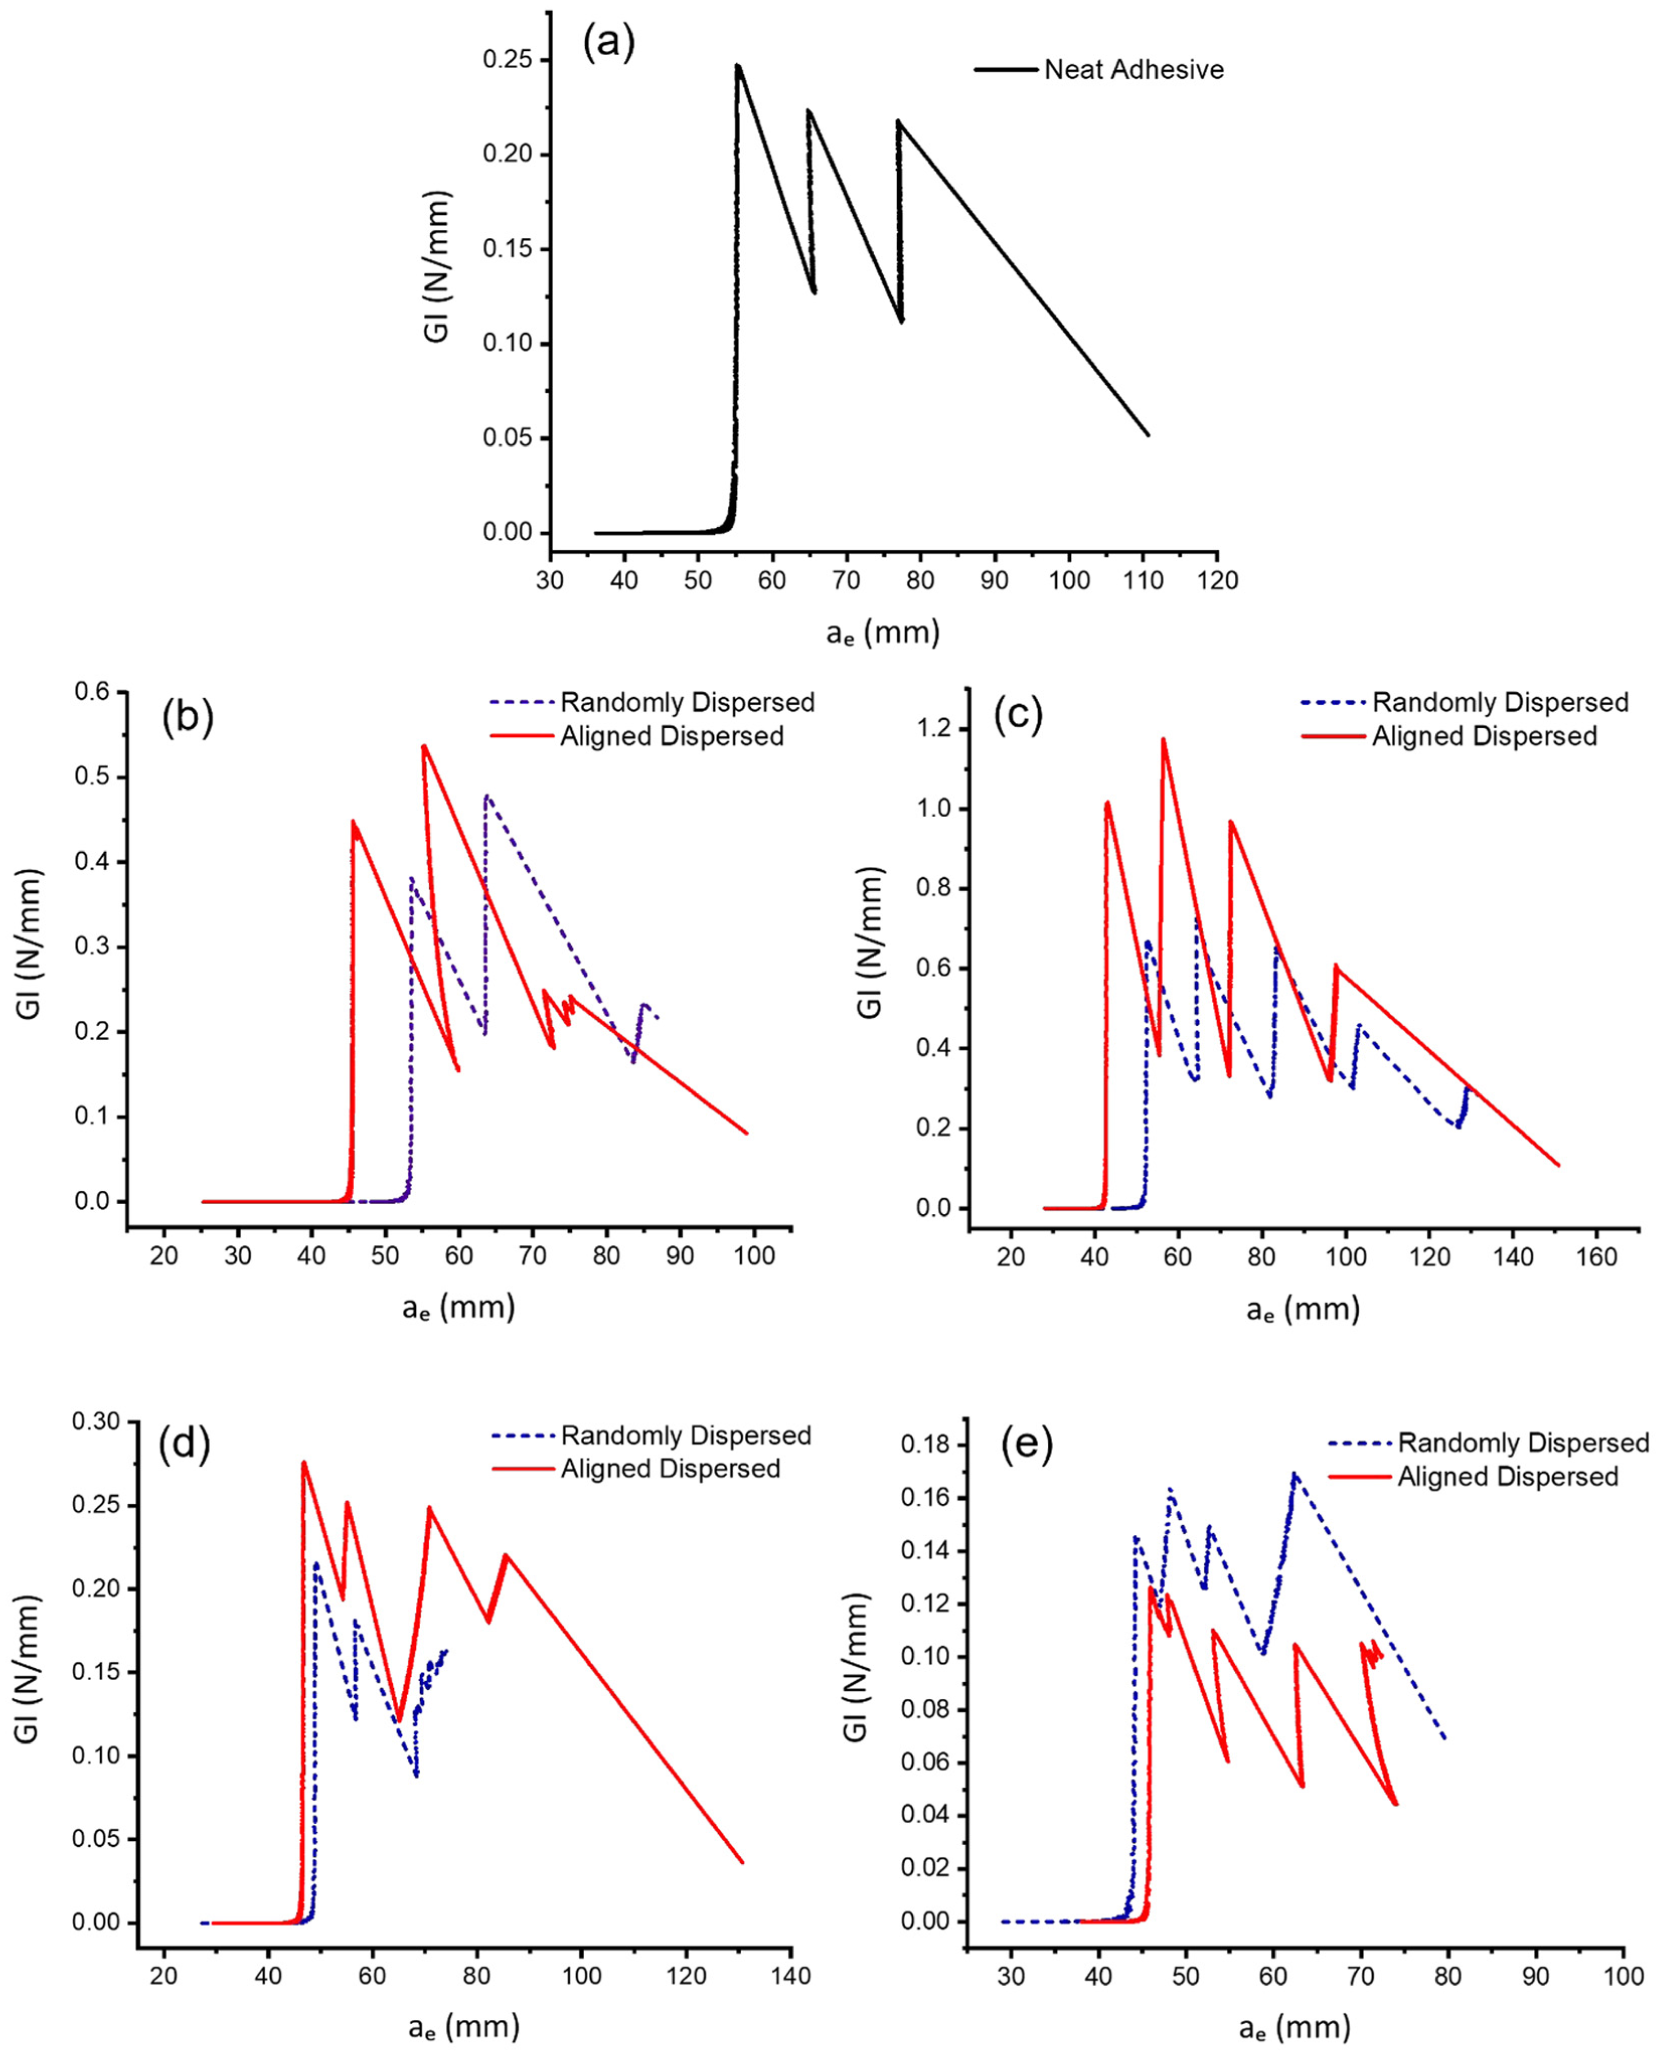
Fracture energy versus equivalent crack length
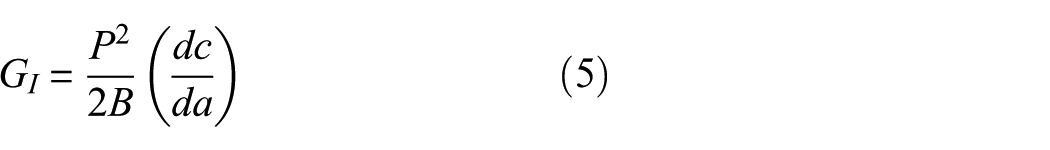
The results shown in Figure 9 indicate that the maximum load of the adhesively bonded joints increased with the addition of MWCNTs up to a concentration of 0.3 wt.%. Moreover, the aligned MWCNTs provided a greater enhancement in the maximum load of the adhesive joints compared to the randomly dispersed MWCNTs. However, increasing the filler content exceeding 0.3 wt.% led to a reduction in the maximum load for both types of joints—those reinforced with randomly dispersed MWCNTs and those reinforced with aligned MWCNTs—compared to the joints containing 0.3 wt.% MWCNTs. Specifically, by incorporating 0.1, 0.3, and 0.5 wt.% of randomly dispersed MWCNTs into the adhesive layer, the maximum load increased by 28%, 73%, and 5%, respectively, relative to the unreinforced joint. However, aligning MWCNTs through the adhesive thickness caused the maximum load to further increase by 35%, 88%, and 38% at 0.1, 0.3, and 0.5 wt.% MWCNTs, respectively, compared to the randomly dispersed MWCNTs. In contrast, the joint containing 0.7 wt.% randomly dispersed and aligned MWCNTs exhibited an 8% decrease and a 16% improvement, respectively, compared to neat adhesive joint. The fracture energy results were obtained using the CBBM method. According to this approach, the variation of the strain energy release rate is evaluated based on the specimen compliance, which, within the framework of the Timoshenko beam theory, can be expressed in the form of Equation (1):
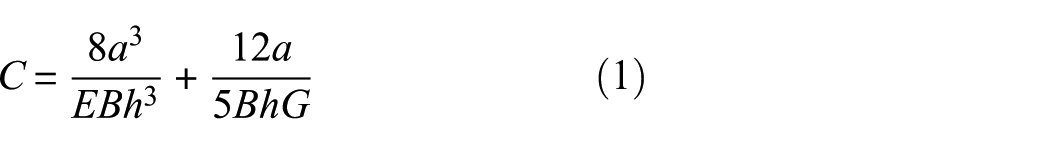
where (
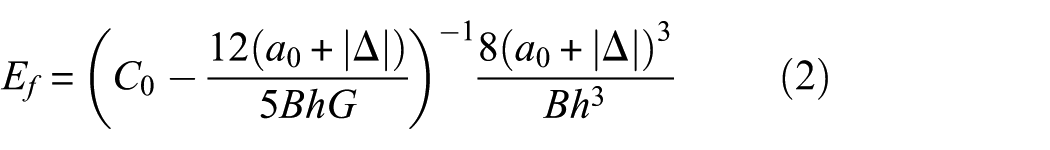
where the crack length correction factor
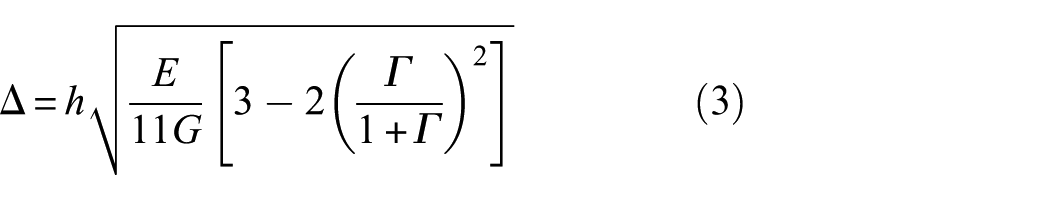
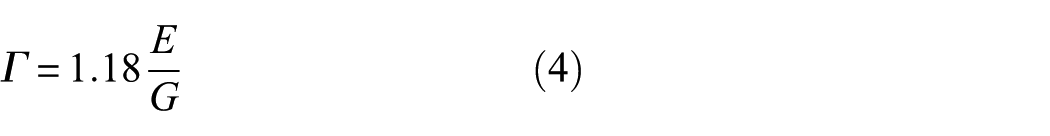
To avoid measurement errors during crack propagation, an equivalent crack length
using Equation (1), thus leading to
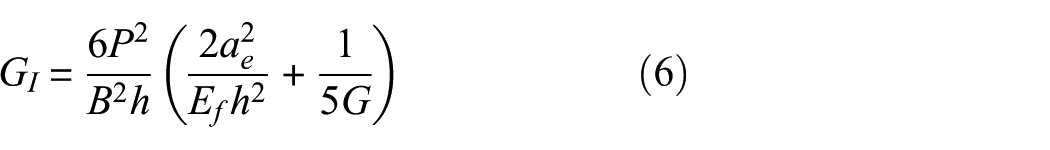
It should be noted that while all DCB specimens were manufactured with the same nominal initial crack length
The results presented in Figure 10 show that the incorporation of MWCNT nanoparticles leads to an increase in the fracture energy up to a concentration of 0.3 wt.%, followed by a decreasing trend at higher contents. For specimens containing 0.3 wt.% MWCNTs with random dispersion and aligned configurations, increases of 264% and 400%, respectively, in fracture energy were observed.
In the MWCNT-reinforced specimens, a distinctive behavior was observed in the fracture energy versus crack length curves. Specifically, the fracture energy in the second stage of crack growth (propagation) was greater than that measured at the onset of damage. This behavior can be attributed to the distinction between the Mode-I initiation fracture energy (
These results demonstrate that the alignment of MWCNTs has a more significant effect on the load-bearing capacity than random dispersion.
Electrical properties and percolation threshold
The percolation threshold and electrical properties of the DCB specimens were investigated using DRS. An increase in MWCNT concentration was found to promote the formation of a conductive network, as evidenced by the trends in the real part of the electrical impedance (
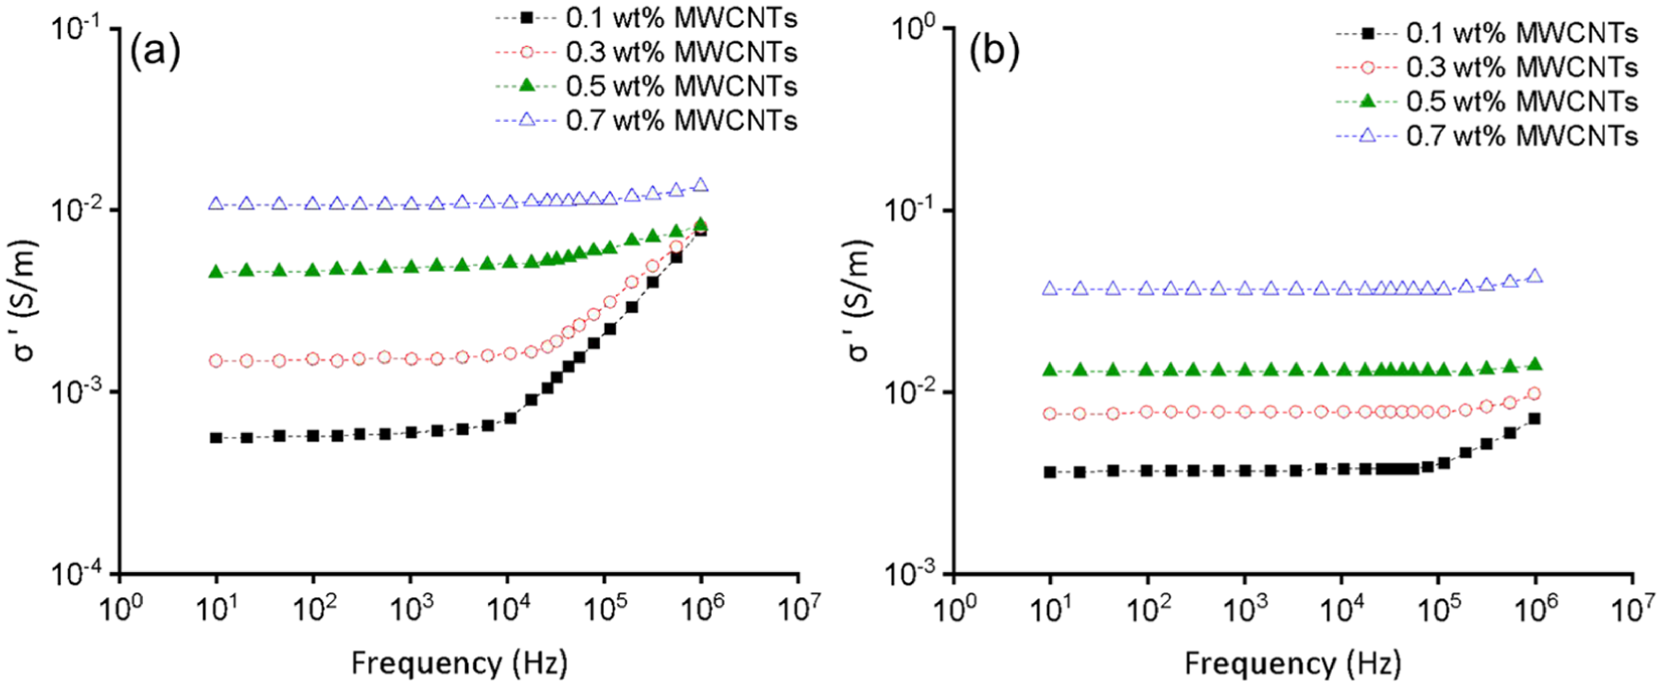
Variation of AC electrical conductivity (
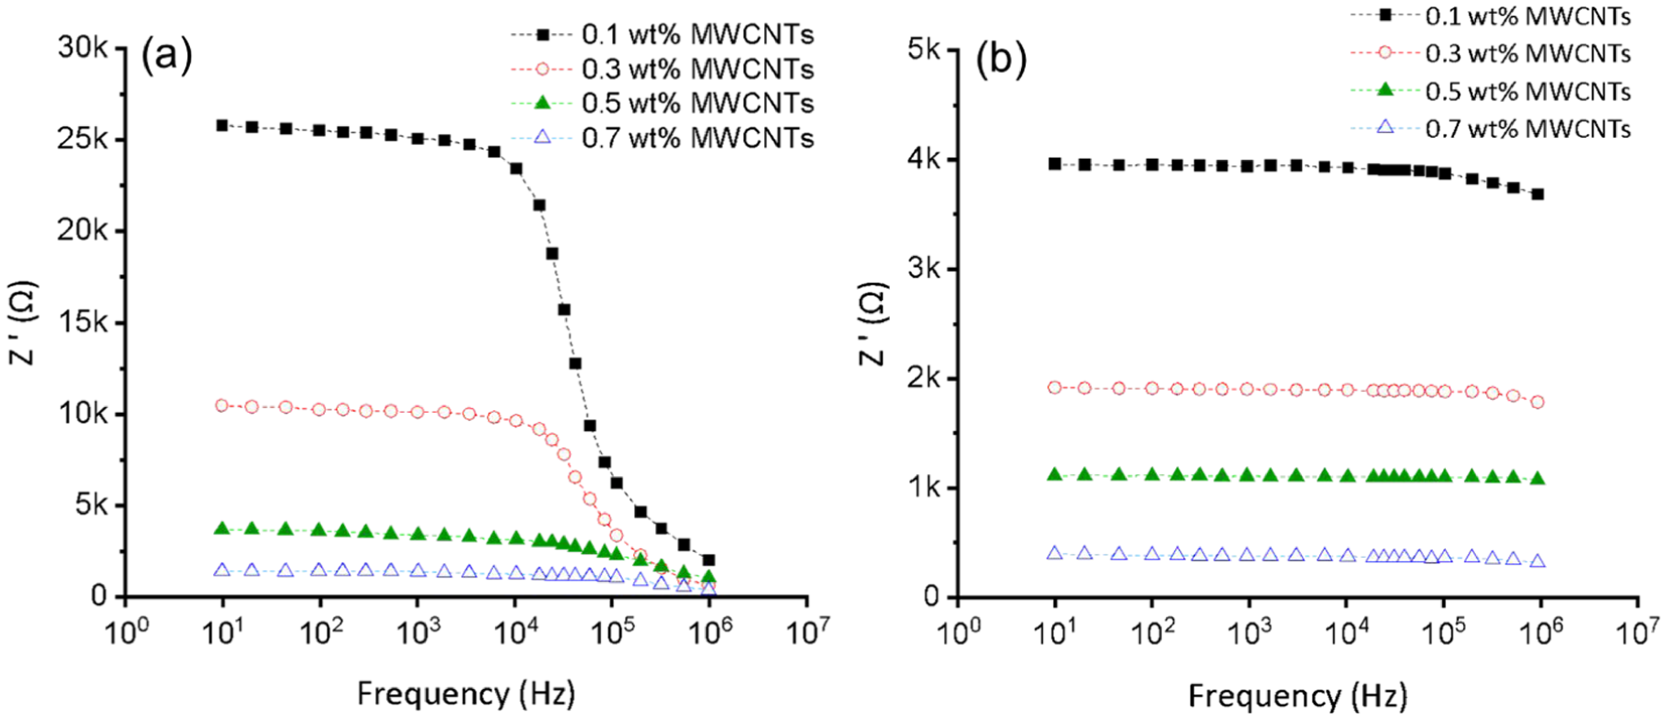
Variation of the real part of electrical impedance (
Two distinct regions were identified in the electrical conductivity curves with increasing filler concentration (Figure 11). The first, a low-frequency “plateau region,” was characterized by frequency-independent AC conductivity and a similarly constant
For the investigated nanocomposite joints, a characteristic “hopping frequency” (
Two distinct electrical behaviors were observed based on filler concentration: a frequency-dependent insulating behavior and a frequency-independent conductive behavior.
37
In aligned specimens, the plateau region (representing DC conductivity,
For joints with randomly dispersed MWCNTs, insulating behavior was observed up to 0.5 wt.%, above which the behavior shifted to conductive. At 0.5 wt.%, both AC conductivity and
A critical finding was the divergent effect of high filler loading on mechanical and electrical properties. While the optimal load-bearing capacity was achieved at 0.3 wt.% for randomly dispersed MWCNTs, concentrations above this level were necessary to achieve electrical percolation but resulted in reduced mechanical performance. This highlights a trade-off between achieving enhanced electrical conductivity and maintaining optimal mechanical strength in the adhesive joints.
More importantly, the alignment of MWCNTs enables the transition to conductive behavior to occur below the mechanically optimal concentration (0.3 wt.%), which is critical for achieving simultaneous mechanical performance and effective damage sensing capability. In particular, the results indicate that the onset of conductive behavior in the aligned configuration occurs at around 0.1 wt.% or even below this value.
When the filler concentration was increased above 0.1 wt.% in the aligned specimens, the electrical behavior exhibited characteristics consistent with conductive materials. Joints containing 0.3 wt.% of aligned MWCNTs demonstrated electrical behavior fully representative of a conductive material.
Damage detection via electrical impedance monitoring
Prior to mechanical loading, an appropriate frequency was selected for monitoring electrical impedance to enable damage detection. The selection of the monitoring frequency was based on the frequency-dependent impedance behavior of the nanocomposite adhesively bonded joint. At low frequencies (below ∼104 Hz), the response is dominated by interfacial polarization and capacitive effects, leading to increased signal fluctuations and reduced correlation with macroscopic mechanical behavior. At higher frequencies (above 105 Hz), the response becomes nearly frequency-independent, governed by the conductive MWCNT network, resulting in reduced sensitivity to crack propagation. Therefore, a frequency of 105 Hz was selected as a compromise between sensitivity and signal stability. At this frequency, the impedance response shows a clear and consistent correlation with crack growth and load–displacement behavior, making it suitable for monitoring mechanically relevant damage.
To investigate crack propagation within the adhesive layer, the relationship between the real part of the electrical impedance and the mechanical loading was described. In all electromechanical plots (Figure 13), the applied force (F) and the corresponding variations in the real part of the electrical impedance at different displacement levels are presented. To improve the comparability of the electrical measurements, the impedance data were normalized with respect to their initial values, and this normalization was defined as the Damage Index (Equation (7)):

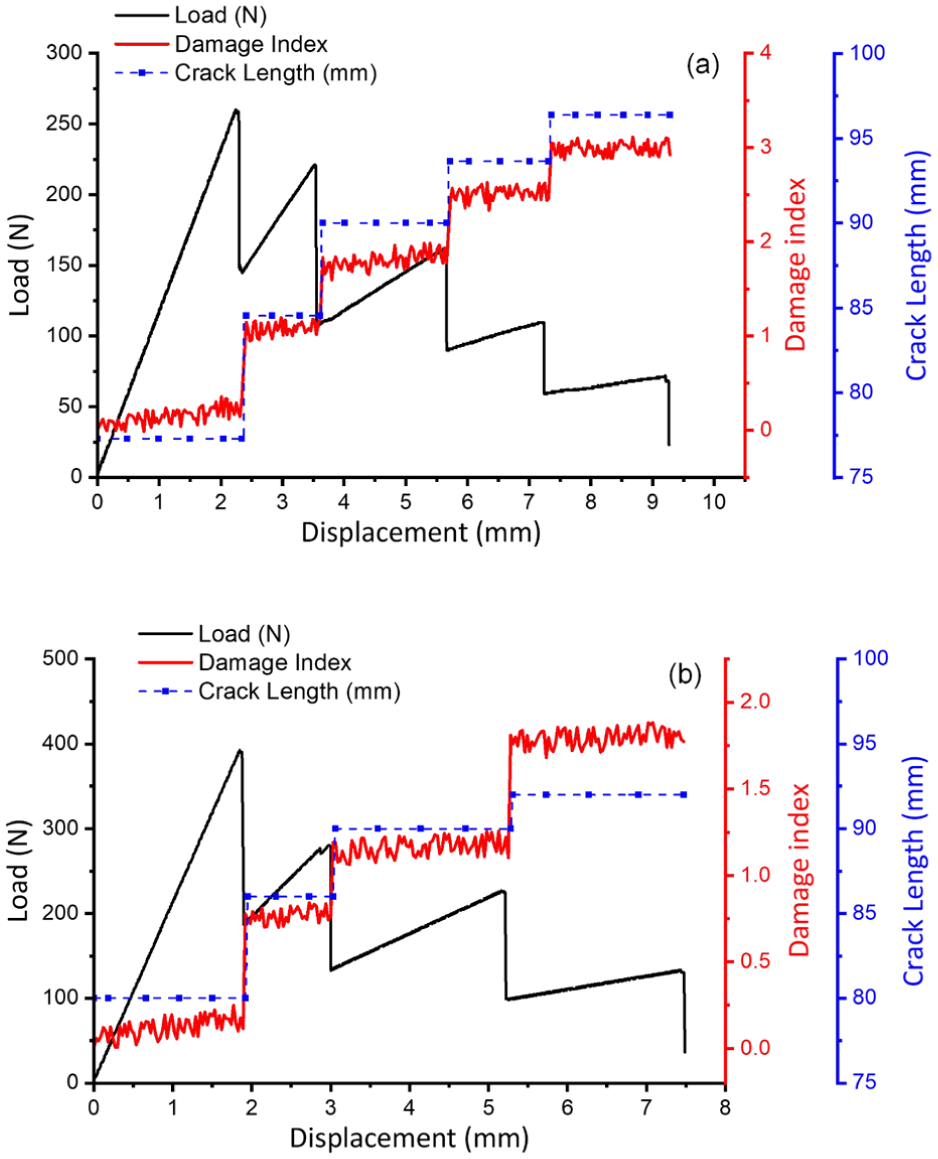
Graphs of normalized real part of electrical impedance and crack length versus load–displacement curve for specimens reinforced with 0.3 wt.% MWCNTs: (a) randomly dispersed MWCNTs and (b) aligned MWCNTs.
This approach allows a clearer assessment of the relative changes associated with damage evolution.
As established in the section “Fracture behavior of DCB specimens,” the specimen containing 0.3 wt.% of MWCNTs exhibited optimal mechanical properties in both randomly dispersed and aligned configurations. Furthermore, as shown in section “Electrical properties and percolation threshold” (Figures 11 and 12), specimens with 0.3 wt.% randomly dispersed MWCNTs demonstrated increased electrical conductivity and a significant decrease in impedance at 105 Hz, indicating that the electrical properties were sufficient for effective impedance-based damage monitoring. Specimens with 0.3 wt.% aligned MWCNTs also exhibited favorable electrical conductivity. Consequently, the impedance response under mechanical loading is reported exclusively for specimens reinforced with 0.3 wt.% MWCNTs.
As shown in Figure 13, a sudden drop in mechanical load was accompanied by a sharp increase in the normalized real part of impedance in regions associated with crack growth. During loading, the initial crack within the adhesive layer began to propagate, increasing the stress concentration at the crack tip. At the onset of fracture, the conductive network formed by the CNTs near the crack tip was disrupted, resulting in a sudden increase in the normalized real part of impedance. The magnitude of this abrupt normalized real part of impedance rise in the crack growth regions was observed to be higher in the specimens with randomly dispersed fillers than in those with aligned reinforcements. Although the percentage increase in the normalized real part of impedance is lower in the aligned specimens, this does not indicate reduced sensitivity to damage. Instead, it reflects the presence of a more stable and continuous conductive network, in which a larger number of conductive pathways remain intact during crack propagation due to the bridging effect of aligned nanotubes. Consequently, the impedance response remains sufficiently sensitive to detect damage initiation, while exhibiting improved signal stability compared to randomly dispersed systems. The impedance responses obtained from different specimens exhibited good repeatability in terms of overall trends, despite minor variations in absolute values. Key features such as the onset of impedance change and its evolution during crack propagation were consistently observed across all samples, confirming the reliability of the measurement approach.
In the aligned specimens, CNTs oriented through the adhesive thickness formed direct electron transfer pathways via a bridging mechanism. This configuration contained a greater number of MWCNTs aligned in the thickness direction than the randomly dispersed configuration. Therefore, after crack propagation, more direct conductive paths remained intact in the aligned specimens. The alignment of CNTs perpendicular to the crack growth direction increased the number of MWCNTs actively contributing to crack bridging compared to the random configuration. This enhanced involvement of aligned nanotubes effectively retarded crack propagation, improved the joint’s mechanical strength, and reduced the crack growth rate. Consequently, the effective remaining area for electrical conduction in the aligned specimens after cracking was larger. As a result, the aligned configuration maintained a relatively stable real part of the electrical conductivity, and the percentage increase in normalized real part of impedance following each damage stage was lower than in the randomly dispersed specimens. The difference in impedance response between randomly dispersed and aligned specimens can be further interpreted by considering multiple interacting mechanisms. In the aligned configuration, the orientation of MWCNTs promotes crack-bridging and enhances the effective conductive cross-sectional area that remains active during crack propagation. In addition, the fracture surface geometry and crack path tortuosity influence the progressive disruption of the conductive network. Unlike randomly dispersed systems, where conductive pathways are more uniformly distributed and can be abruptly disconnected, the aligned structure allows for a more gradual breakdown of the conductive network due to directional connectivity. Consequently, the impedance increase in aligned specimens is less pronounced but more stable, reflecting a progressive rather than sudden loss of electrical pathways. The impedance response can be qualitatively divided into two stages corresponding to damage initiation and crack propagation. The initiation stage is marked by a slight deviation from the baseline impedance, associated with the onset of microcracking and initial crack growth. As the crack propagates, a more pronounced and continuous increase in impedance is observed, reflecting the progressive disruption of conductive pathways. This distinction is consistent with the load–displacement behavior and crack length evolution.
Table 1 presents the percentage increase in Z′ and the corresponding sudden drop in mechanical load-bearing capacity following the first stage of damage. The aligned configuration reduced the crack growth rate by approximately 30% compared to the randomly dispersed case (from 10% to 7% in the first damage stage), highlighting the effectiveness of through-thickness nanotube alignment in resisting crack propagation.
Percentage changes in the normalized real part of electrical impedance and crack length at the first step of damage for 0.3 wt.% specimens with randomly dispersed MWCNTs compared to specimens with aligned MWCNTs.
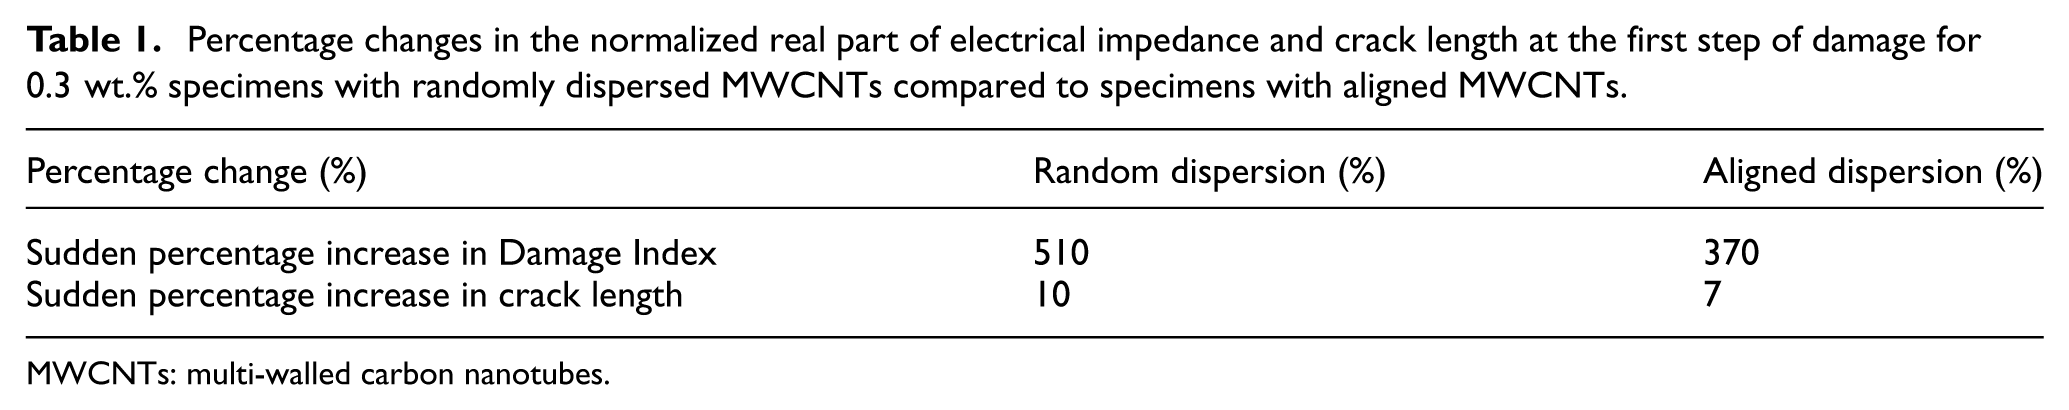
MWCNTs: multi-walled carbon nanotubes.
Fractographic analysis via FE-SEM
The dispersion of reinforcing nanofillers was evaluated using FE-SEM images of the fracture surfaces, as shown in Figure 14. The dispersion quality of MWCNTs in the epoxy matrix was found to be directly related to their weight percentage. In the specimens with 0.1 and 0.3 wt.% MWCNTs, the nanotubes were dispersed relatively uniformly. In nanocomposite adhesives containing conductive fillers within an insulating epoxy matrix, electron tunneling between neighboring nanotubes or clusters, as well as direct contact between reinforcing particles, are the main mechanisms responsible for electrical conductivity.39,60,61
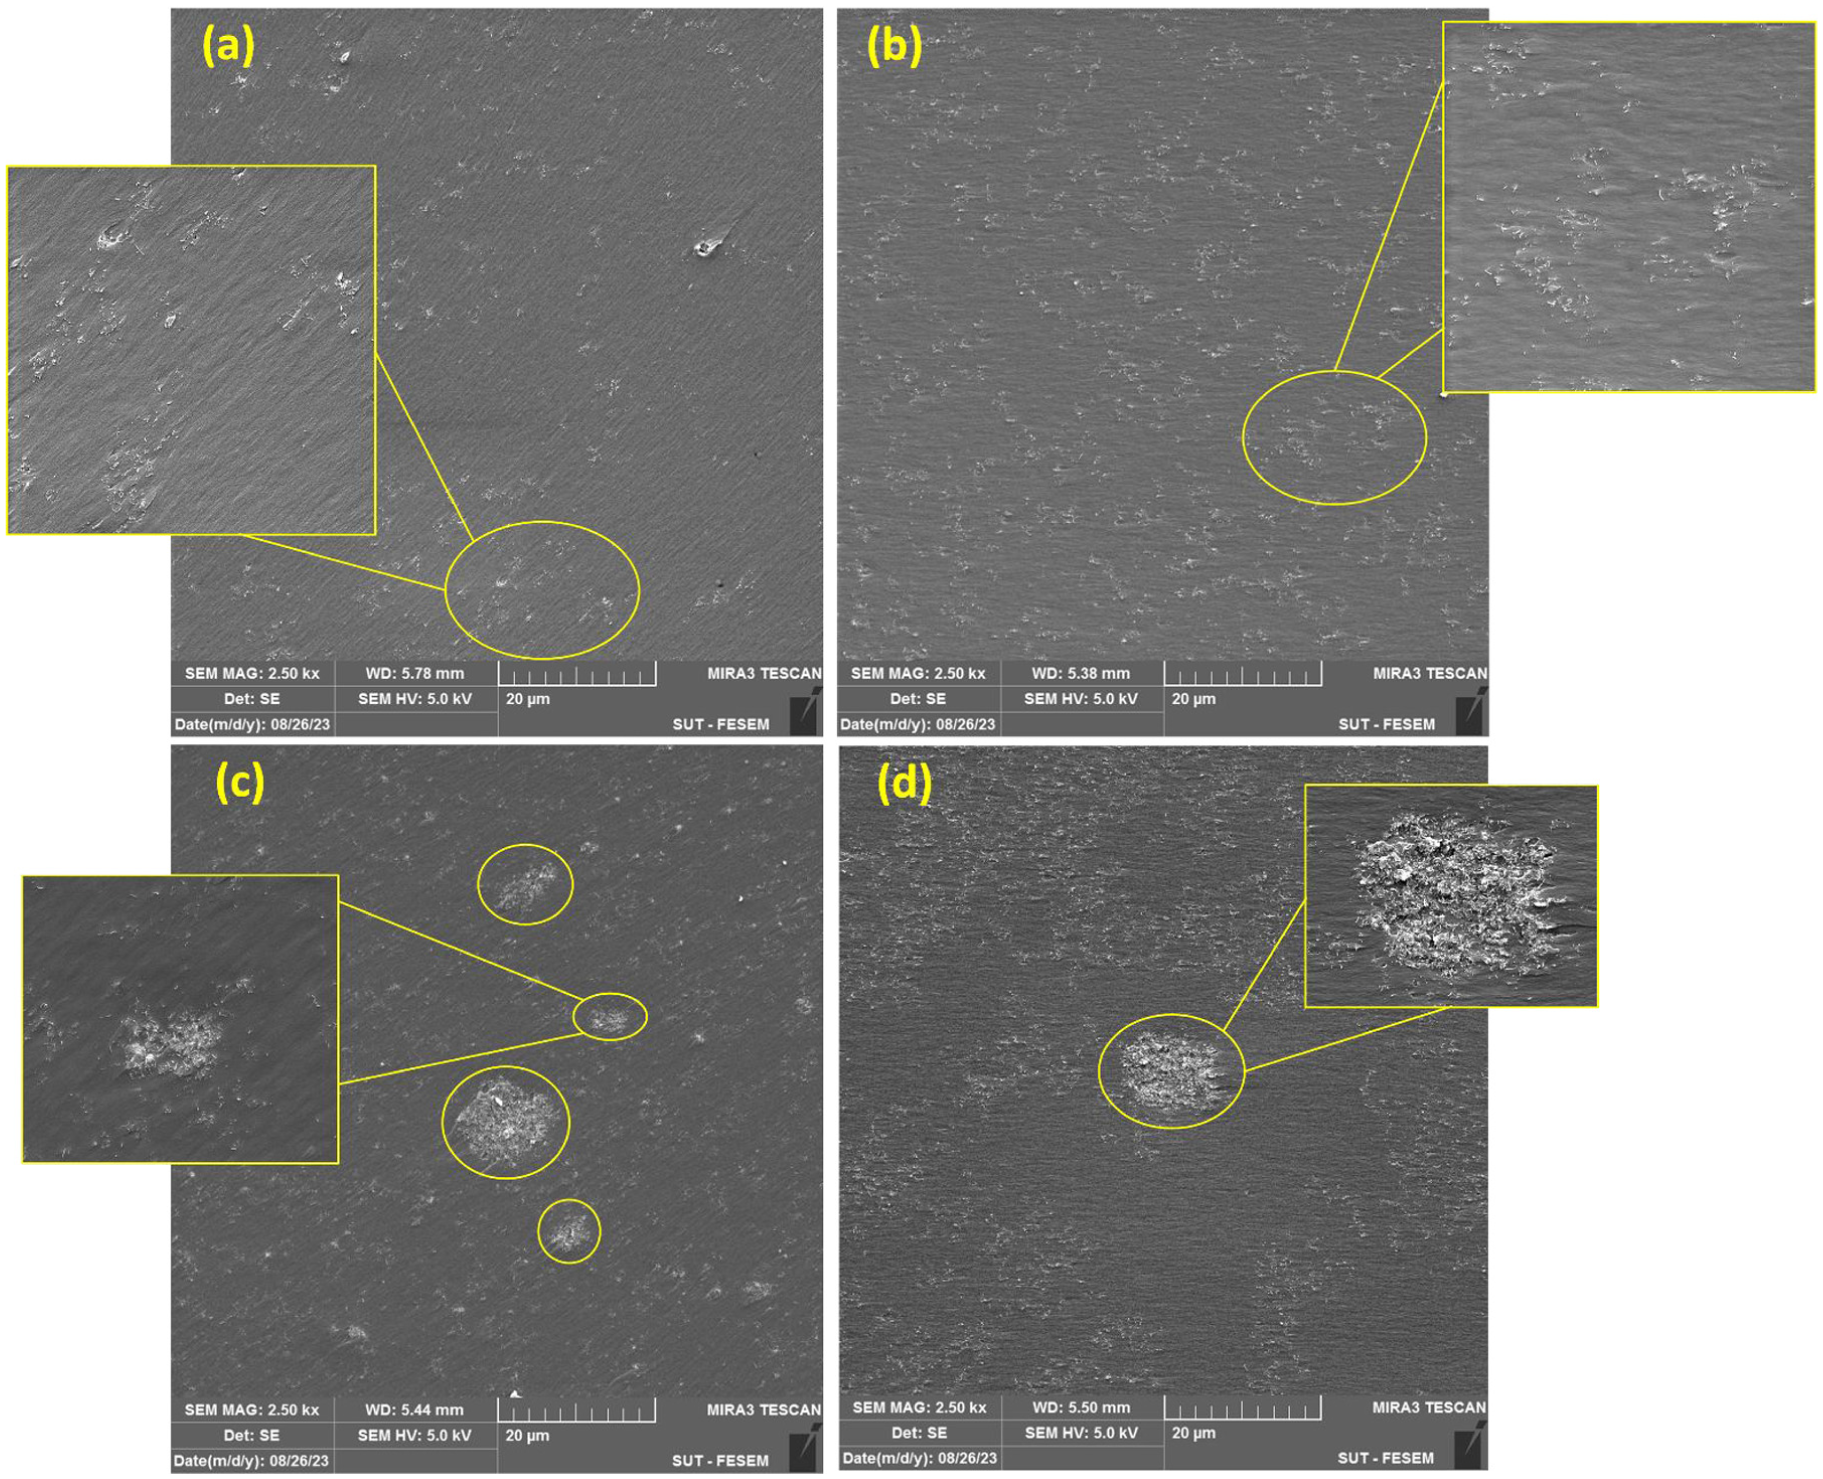
FESEM images of MWCNT dispersion in specimens with (a) 0.1 wt.%, (b) 0.3 wt.%, (c) 0.5 wt.%, and (d) 0.7 wt.% MWCNTs.
At the lower concentrations of 0.1 and 0.3 wt.%, the dispersion of nanotubes facilitated electron tunneling between neighboring particles. This phenomenon enabled electron transfer between nanotubes even without direct contact, thereby creating continuous conductive pathways at the nanoscale. In contrast, regions of nanotube agglomeration were observed in the specimens with 0.5 and 0.7 wt.% concentrations. Due to their high specific surface area, MWCNTs are prone to van der Waals interactions, which become more extensive at higher concentrations, leading to the coalescence of nanotubes into clusters or agglomerates. In this structure, direct contact among nanotubes within clusters occurred in addition to electron tunneling mechanisms.
This direct contact in densely packed regions enabled the formation of continuous electrical conduction pathways, complementing the tunneling mechanisms. These dense MWCNT clusters acted as localized conductive nodes and electrically active zones within the epoxy matrix. The interconnection of these clusters via chains of nanotubes established a hybrid network of direct contact and electron tunneling, which significantly enhanced the overall electrical conductivity. However, the formation of agglomerates can also introduce local stress concentration zones, thereby degrading the mechanical performance. This behavior is common in nanocomposite systems, where a critical filler concentration often exists above which mechanical properties deteriorate due to agglomeration.
Furthermore, CNTs exhibit significantly higher electrical conductivity along their longitudinal axis than in the radial direction. Therefore, aligning MWCNTs along the thickness direction of the adhesive layer was shown to create more direct electron transfer pathways, thereby enhancing electrical conductivity. The ordered alignment also increased the number of direct inter-tube contacts, which further contributed to the improved conductivity. Moreover, aligning MWCNTs perpendicular to the crack propagation direction allowed a greater number of nanotubes to participate in bearing the applied mechanical load. Consequently, the alignment of reinforcing nanotubes enhanced both the mechanical and electrical properties compared to random dispersion.
Raman spectroscopy has been widely used in numerous studies to confirm the alignment of CNTs. 41 Research conducted by Gholami et al. 40 and Ghanbari et al., 21 under electric field conditions similar to those used in the present study, has provided microstructural evidence confirming the alignment of CNTs.
Various toughening mechanisms that contribute to the improvement of the mechanical properties were also identified from the FESEM images of the fracture surfaces (Figure 15). Mechanisms such as nanotube debonding, pull-out, and bridging were observed. These mechanisms lead to increased energy absorption during crack propagation, thereby enhancing the fracture toughness. Interfacial shear stresses can cause the pull-out of CNTs from the adhesive, a process that requires overcoming the interfacial bonds and absorbs a significant amount of energy.19,62 Similarly, in the debonding mechanism, separation occurs at the interface between the CNTs and the epoxy resin, which also consumes energy to overcome the interfacial bonds.
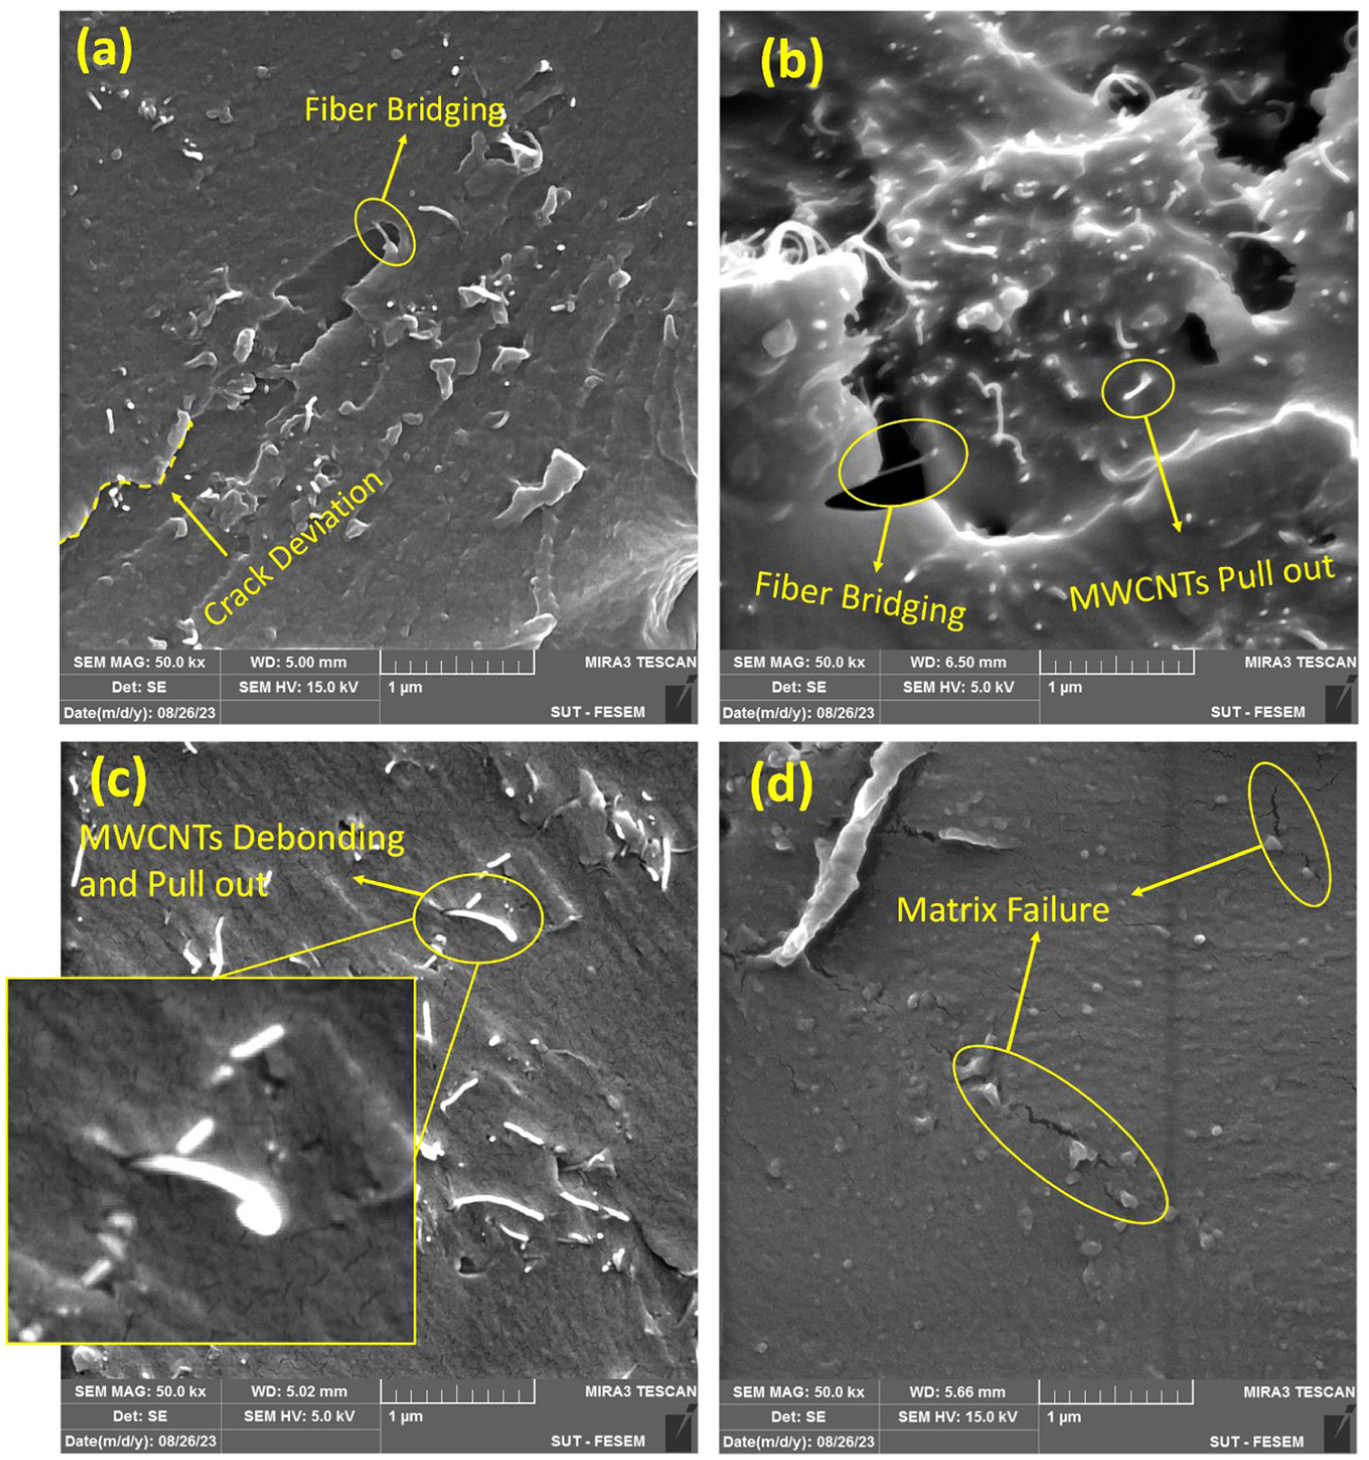
FE-SEM images of fracture mechanisms on the fracture surfaces of adhesively bonded joints.
Conclusion
This study investigated the enhancement of mechanical and electrical properties in adhesively bonded joints through the incorporation of MWCNTs into the epoxy adhesive. Two configurations were examined: randomly dispersed MWCNTs and MWCNTs aligned through the adhesive thickness using an AC electric field. DRS revealed that the alignment of MWCNTs significantly reduced the electrical percolation threshold to 0.1 wt.%, compared to 0.5 wt.% for the randomly dispersed configuration, highlighting the effectiveness of alignment in forming conductive pathways. Mode-I fracture tests demonstrated that the maximum load-bearing capacity for both configurations was achieved at an optimal concentration of 0.3 wt.% MWCNTs, with the aligned specimens exhibiting superior performance. In situ monitoring of the real part of the electrical impedance during mechanical loading confirmed that sudden changes in this parameter served as reliable indicators of damage initiation and crack propagation. The magnitude of these impedance increases was more pronounced in the randomly dispersed specimens, a result attributed to the greater number of preserved conductive pathways in the aligned configuration, where nanotubes bridge the crack. Fractographic analysis via FE-SEM confirmed the presence of active toughening mechanisms, including nanotube debonding, pull-out, and bridging, which contributed to enhanced energy absorption and fracture toughness. A key finding was the identified trade-off between mechanical and electrical properties at higher filler concentrations; while loading above 0.3 wt.% was necessary to achieve electrical percolation in random dispersions, it led to agglomeration and a consequent reduction in mechanical strength. In contrast, the aligned configuration mitigated this issue, maintaining improved conductivity without a significant loss in mechanical performance. It should be noted that the optimal MWCNT content depends on the performance criterion considered. While 0.3 wt.% corresponds to the maximum mechanical performance in terms of load-bearing capacity and fracture resistance, the requirements for effective SHM are governed by the formation of a conductive network. In aligned specimens, this transition occurs at significantly lower concentrations (around or below 0.1 wt.%). Therefore, the alignment strategy enables a decoupling between mechanical optimization and sensing capability, allowing both to be achieved simultaneously.
In summary, the alignment of MWCNTs presents a promising strategy for fabricating multifunctional adhesive joints that simultaneously offer enhanced mechanical properties and an integrated capability for SHM.
Footnotes
Ethical considerations
This article does not contain any studies with human or animal participants.
Consent to participate
There are no human participants in this article, and informed consent is not required.
Funding
The authors received no financial support for the research, authorship, and/or publication of this article.
Declaration of conflicting interests
The authors declared no potential conflicts of interest with respect to the research, authorship, and/or publication of this article.
Data availability statement
All the data generated or analyzed during this study are included in this published article.