
Abstract
Structural health monitoring based on Lamb waves is significantly challenged by environmental temperature variations, which introduce complex signal distortions that can obscure damage-related features. A Lamb wave damage localization methodology based on a compensated multiple signal classification (MUSIC)-beamforming framework using dual sensor arrays is presented under variable temperature conditions. The methodology is underpinned by a comprehensive array signal propagation model that has been developed to characterize temperature-induced effects on wave propagation, with explicit consideration given to both amplitude and phase variations. An enhanced near-field MUSIC formulation is developed in which temperature-induced amplitude and phase distortions are characterized by a calibrated error matrix; phase compensation restores the angular estimate while amplitude compensation preserves the beamforming gain and imaging quality. The methodology is further augmented through the integration of beamforming techniques, which serve to enhance spatial filtering capabilities and improve imaging resolution under varying temperature conditions. Extensive experimental validation has been conducted on aluminum plates with artificial damages, where temperature conditions were systematically varied from −40 to 80°C. The experimental results have demonstrated that consistent localization accuracy can be achieved with relative errors maintained below 9% across all temperature conditions.
Introduction
Structural health monitoring (SHM) of critical engineering structures has attracted significant attention in recent decades due to its crucial role in ensuring operational safety and maintenance efficiency.1–3 Among various SHM techniques, Lamb wave-based methods have emerged as particularly promising approaches due to their high sensitivity to structural damage and capability for large-area monitoring.4–7 Recent advances in ultrasonic wavefield imaging techniques have enabled direct visualization of wave propagation across structural surfaces, facilitating damage inference through the identification of wavefield pattern variations.8,9 These visualization approaches, known as ultrasonic propagation imaging, 10 acoustic wavefield imaging,11,12 and Lamb wavefield imaging, 13 have significantly enhanced damage detection capabilities. However, the reliability of these methods is substantially challenged by environmental variations, especially temperature fluctuations, which can significantly alter wave propagation characteristics and mask damage-related signal features. This challenge becomes particularly critical in aerospace and high-speed rail applications, where structures are frequently subjected to extreme temperature variations during operation, necessitating the development of more robust damage detection approaches.14,15
To enhance damage detection capabilities, researchers have developed various high-resolution signal processing techniques based on piezoelectric sensor arrays. Wang et al. 16 developed a phased array ultrasonic method for localization and severity prediction of impact damage in composite plates. Wang et al. 17 proposed an active structural multi-damage monitoring method based on ultrasonic phased arrays. Yang et al. 18 integrated the MUSIC algorithm with electrodynamics theory for multiple impact source localization. These array-based methods have demonstrated significant advantages in damage imaging under controlled laboratory conditions. Su et al. 19 enhanced the accuracy and real-time performance of composite structure impact localization by combining the MUSIC algorithm with wavelet transform technology. Zhong et al. 20 proposed an improved impact localization method for composite structures by combining optimized ensemble empirical mode decomposition with two-dimensional multiple signal classification (2D-MUSIC) algorithm. This method eliminated the need for specific center frequency analysis, significantly reducing algorithmic estimation time. Zuo et al. 21 developed a 2D-MUSIC algorithm for plate structure damage identification based on wave propagation models, establishing cross-correlation functions between experimentally received residual signals and modeled scattered signals. While these methods have demonstrated significant advantages in laboratory environments, their performance under varying temperature conditions, requires further investigation.
Separately, the influence of environmental temperature variations on Lamb wave-based SHM has been extensively studied. Radecki et al. 22 investigated temperature effects on Lamb wave amplitude and arrival time, proposing a clustering algorithm to assess damage states under temperature variations. Sikdar et al. 23 studied the influence of delamination on Lamb wave propagation in composite materials under varying environmental temperatures. Francesco et al. 24 proposed a numerical method based on a semi-analytical finite element model to predict the temperature effects of guided waves generated and received by low-profile piezoelectric ceramic (PZT) sensors, and used it to predict the response spectrum of aluminum plates in the temperature range of −40°C to +60°C. Bao et al. 25 proposed an anisotropy-compensated MUSIC method that incorporates phase errors from structural anisotropy and sensor position into the steering vector for composite impact localization. Zhang et al. 26 developed a phase-corrected MUSIC method for temperature effects, using comparative signals between normal and varying temperatures. However, both rely on phase-only correction and extensive experimental calibration of sensor phase errors. Moreover, most existing approaches address phase compensation but do not explicitly model the temperature-induced amplitude behavior, which, while having limited influence on the angular estimate, is important for beamforming-based imaging and near-field range estimation.
In parallel with temperature compensation approaches, an important alternative direction has been the development of baseline-free damage detection methods based on the time-reversal process of Lamb waves, which fundamentally alleviates the effects of temperature fluctuations by eliminating the need for baseline signals. Agrahari and Kapuria 27 developed a refined Lamb wave time-reversal method (RTRM) with enhanced sensitivity for damage detection in isotropic plates, where the probe is conducted at the best reconstruction frequency and an extended wave packet is used for computing the damage index. Kannusamy et al. 28 further integrated the RTRM with the reconstruction algorithm for probabilistic inspection of defects for accurate baseline-free damage localization using a sensor network. Notably, Sharma et al. 29 demonstrated that the time reversibility of Lamb waves at the best reconstruction frequency is invariant to temperature changes, providing a theoretical foundation for temperature-robust baseline-free detection. Building on this, Sharma et al. 30 established that the RTRM is effective for accurate damage detection and sizing under varying temperatures without requiring any temperature compensation. Recent comprehensive reviews31–33 have further consolidated these developments and highlighted the significant potential of time-reversal-based approaches for practical SHM applications. While these baseline-free methods offer the distinct advantage of not requiring healthy-state reference signals, the MUSIC-beamforming approach proposed in this study provides complementary capabilities including high-resolution spatial imaging, precise damage coordinate estimation through dual-array triangulation, and detailed damage boundary characterization. The temperature compensation framework developed herein enables these imaging capabilities to be maintained under varying temperatures, which is particularly valuable for applications requiring quantitative damage sizing and location mapping in addition to damage detection. Furthermore, the proposed method’s ability to provide full-field imaging with enhanced spatial resolution through beamforming integration offers advantages for scenarios where detailed damage characterization is needed.
Unlike previous compensated MUSIC approaches, which generally address phase correction alone, the present work characterizes both the temperature-induced gain and phase distortion through a near-field array model, and corrects the steering vector by a temperature error matrix in a cost-function localization, where phase governs the angular estimate and amplitude supports the near-field range estimate. Building on this, dual-array triangulation yields absolute Cartesian coordinates rather than a single bearing, and a MUSIC–beamforming weighted fusion delivers damage-boundary imaging. Amplitude compensation is not claimed to improve the angular direction of arrival (DOA), which is inherently phase-dominated; its role lies in the beamforming and imaging stages.
The rest of this article is organized as follows. In the section “Methodology development”, the overall framework of the Lamb wave damage imaging method based on improved MUSIC-beamforming under variable temperature environment is introduced. In the section “The damage imaging experiments”, the damage imaging method based on improved MUSIC-beamforming is described in detail. In the section “Data analysis”, the damage imaging experiments under variable temperatures presented and the results are discussed. Conclusions are drawn in the final section.
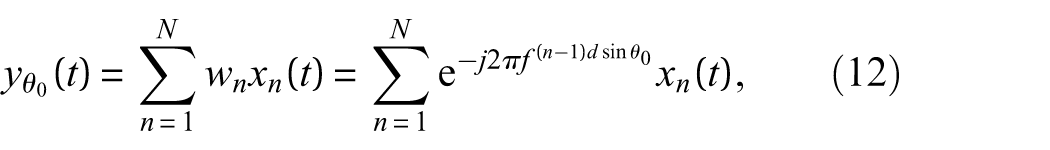
Methodology development
A novel methodology for damage localization under variable temperature conditions has been developed by integrating a compensated MUSIC algorithm with beamforming techniques based on dual sensor arrays. The overall framework of the proposed method is illustrated in Figure 1. Initially, an array signal propagation model is established to systematically characterize temperature-induced effects on Lamb wave signals, where both amplitude and phase variations are explicitly considered. To address temperature-induced signal distortions, an improved MUSIC algorithm incorporating amplitude-phase error compensation has been formulated. The temperature error matrix is calibrated offline from baseline temperature sweeps. At run time, the cost function minimizes the projection of the temperature-compensated steering vector onto the noise subspace to estimate the damage location, where the phase correction restores the angular accuracy and the amplitude correction stabilizes the near-field range estimate and the subsequent beamforming gain. Beamforming techniques are subsequently integrated to enhance spatial filtering capabilities and improve imaging resolution by optimizing the array gain pattern in the direction of interest while suppressing interference from other directions. The damage imaging is ultimately achieved by combining the optimized MUSIC spectrum with beamforming outputs through a weighted fusion strategy.
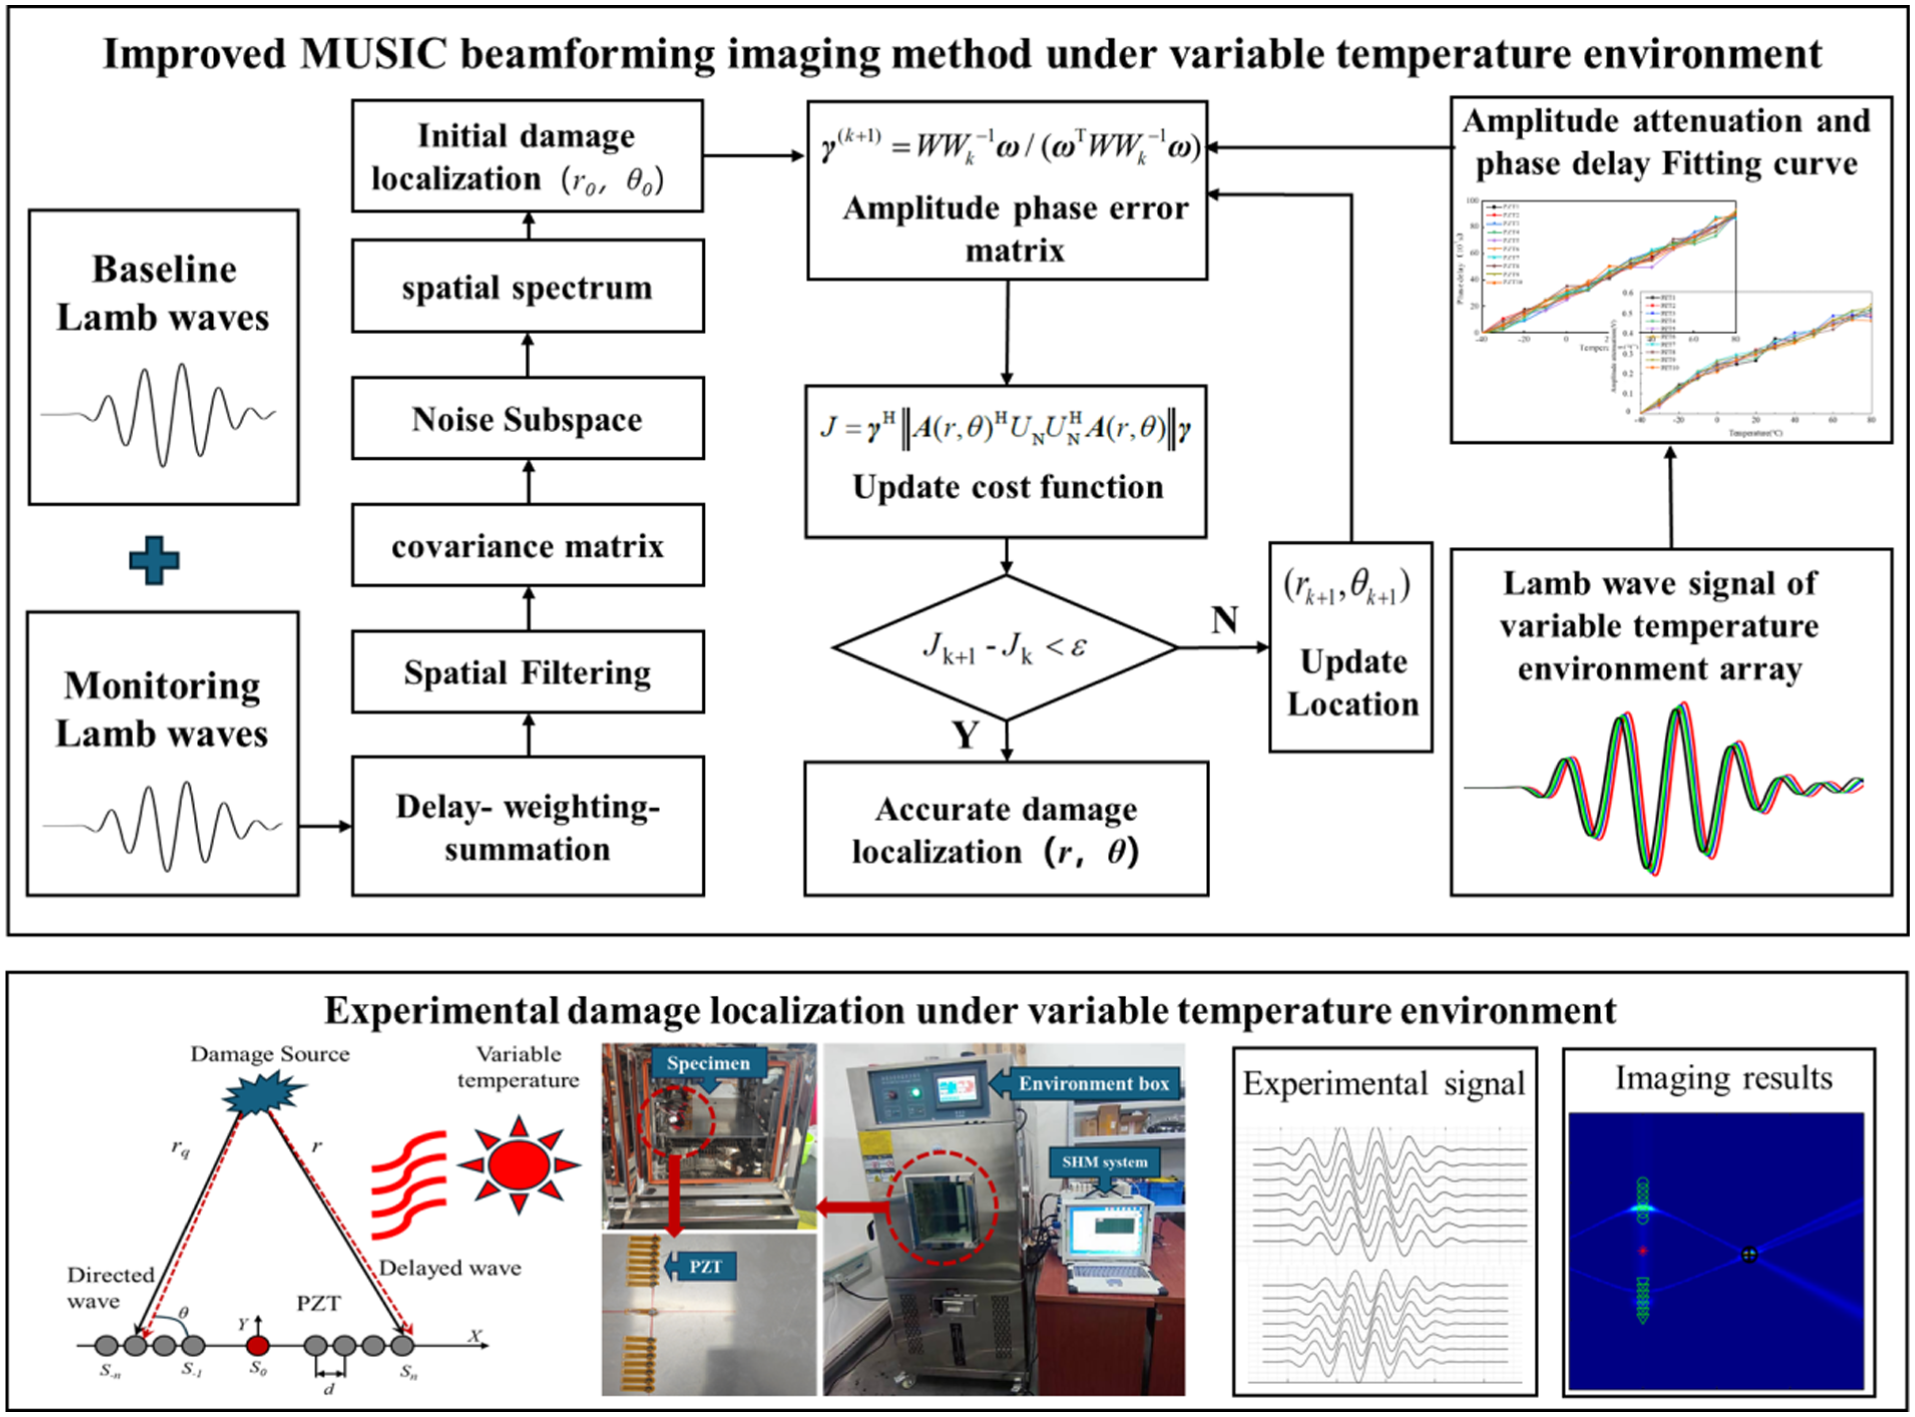
Method framework diagram.
MUSIC and beamforming algorithm
The MUSIC algorithm separates the signal subspace from the noise subspace through eigen decomposition of the covariance matrix of array-received signals. The DOA estimation is then achieved by constructing a spatial scanning spectrum based on the orthogonality between the signal steering vectors and the noise subspace. A linear array configuration, commonly employed for signal reception, is illustrated in Figure 2. The linear array consists of N sensor elements with uniform spacing d. Consider M uncorrelated far-field sources impinging on the array, where θ represents the incident angle between the source direction and the normal vector of the first array element. The received signal matrix

where
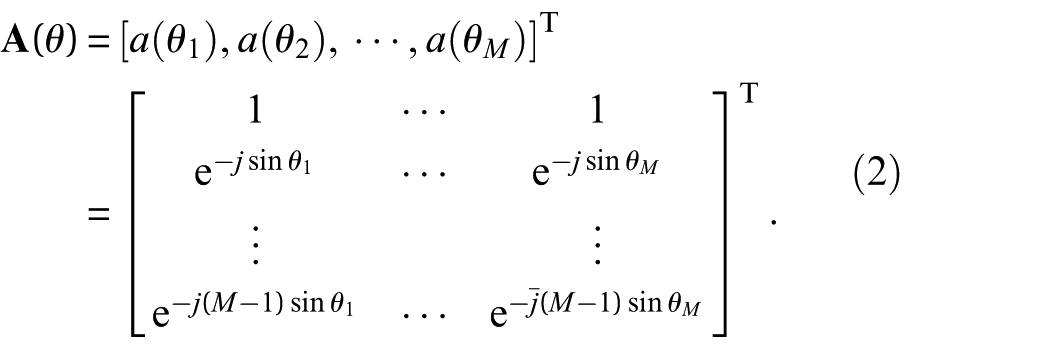
where M denotes the number of uncorrelated far-field sources, N represents the total number of sensor elements in the linear array, and


where
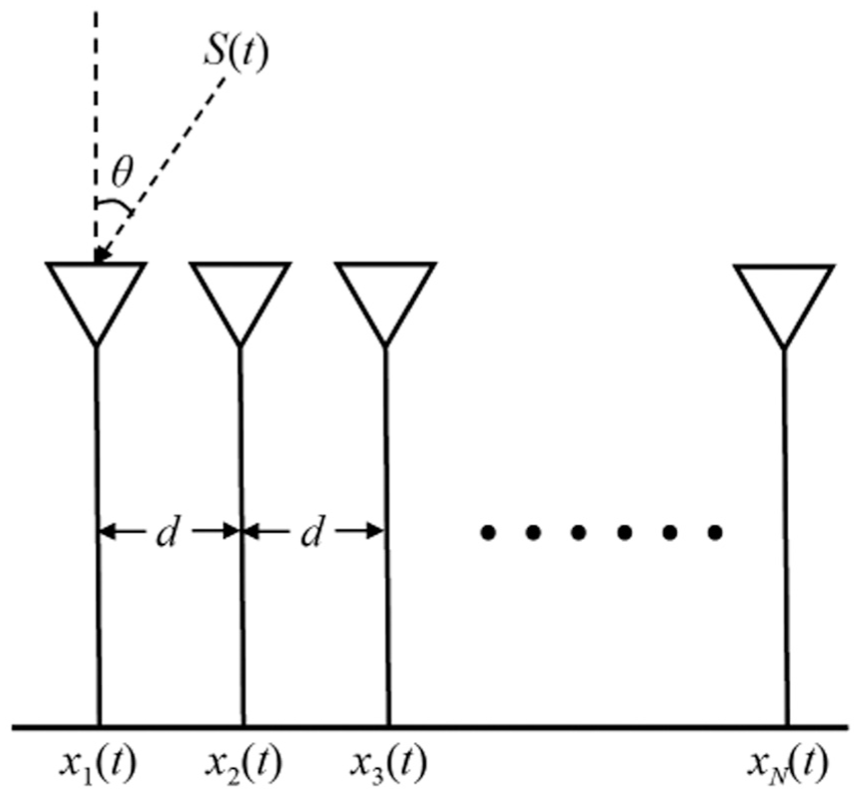
Schematic diagram of linear array.
The cross-correlation matrix of the received signals is defined as
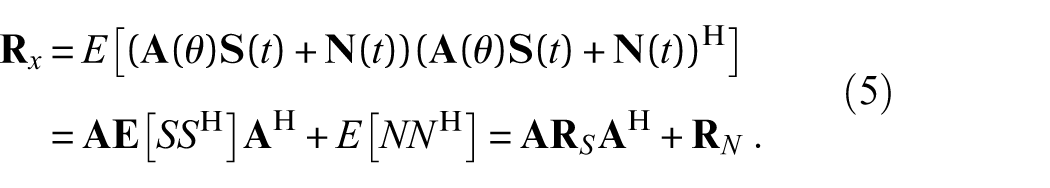
Where
According to the definition of eigenvalues and eigenvectors:

Multiplying both sides of Equation (16) by


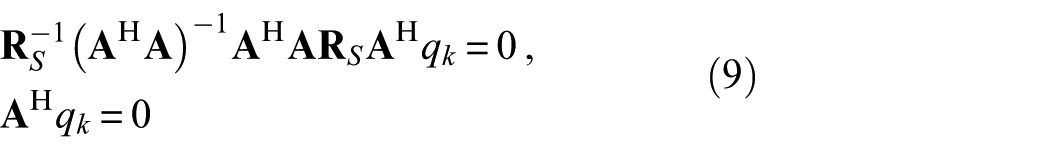

Equation (10) establishes the orthogonality relationship between the noise eigenvectors and array steering vectors. By utilizing this orthogonality property, DOA estimation is achieved through the generation of a spatial spectrum, where the noise eigenvectors EN are obtained from the cross-correlation matrix of the array signals. The spatial spectrum function is expressed as:
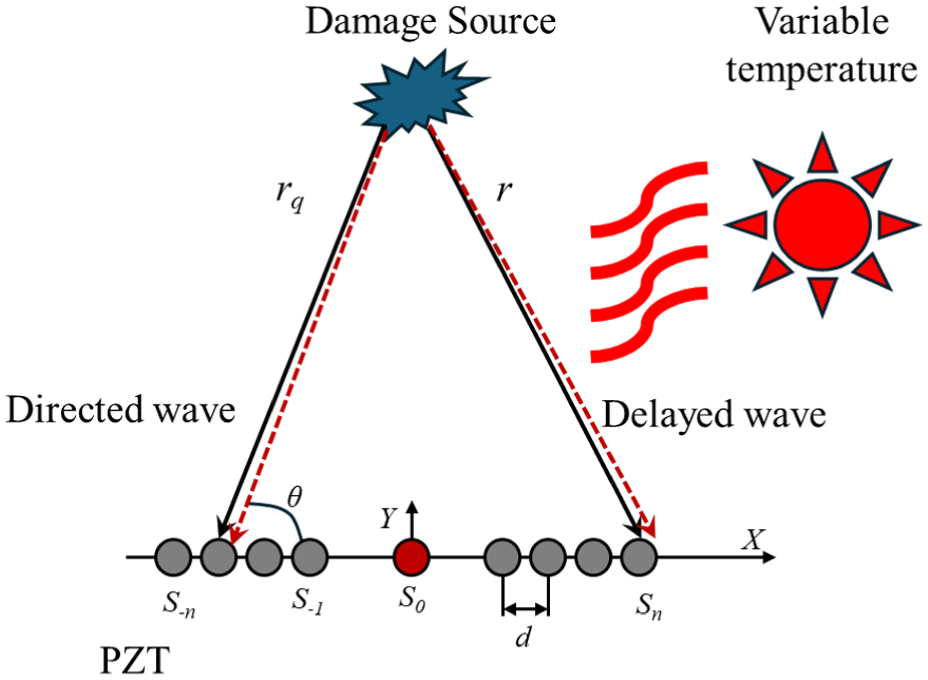
Spatial filtering is implemented through a sequence of processing operations on the signals received by the linear array, including time delay adjustment, weight application, and summation across multiple array elements. This process is designed to achieve high gain in the designated direction while maintaining low gain in other directions. The traditional beamforming approach, utilizing either phase-shift or time-delay methodologies, selectively weights signals to enhance reception from the desired direction while suppressing signals from other directions. This technique is particularly effective for extracting low-amplitude damage signals that would otherwise be obscured by noise. The Conventional Beamforming algorithm, based on the time-delay-weight-sum method, is employed in this study to perform spatial filtering of damage signals. The beamforming operation on the array signals is expressed by Equation (12).
where
It should be noted that the MUSIC algorithm and beamforming serve distinct and complementary roles in the proposed framework. The MUSIC algorithm provides high angular resolution through noise subspace orthogonality, but its pseudo-spectrum does not directly reflect physical signal power and may exhibit spurious peaks under temperature-induced distortions. The beamforming step performs spatial filtering on the actual received signals, physically enhancing the signal-to-noise ratio in the direction of interest while suppressing interference. The final damage image is obtained by fusing the MUSIC spectrum with the beamforming output through a weighted combination, thereby leveraging the high resolution of MUSIC and the robust spatial filtering capability of beamforming.
Array Lamb wave modeling under variable temperature environment
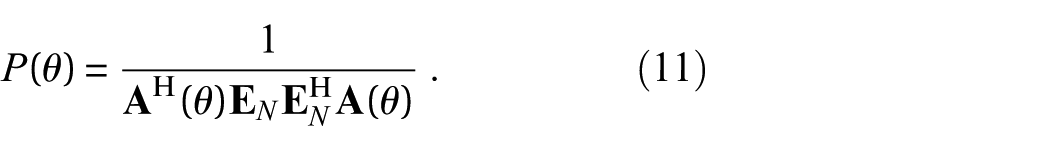
Temperature variations in operational environments can significantly affect the propagation characteristics of Lamb waves, introducing both amplitude and phase uncertainties in the received signals. To accurately model these effects, we need to modify the conventional array signal model to incorporate temperature-dependent parameters. Figure 3 illustrates the geometric configuration of the array signal propagation model under temperature variations, where multiple sensor elements receive scattered waves from a damage source through paths affected by temperature-induced medium changes.
Array signal propagation model under temperature variations.
In this model, the reference point O serves as the array center, with sensor elements distributed symmetrically along the array axis. The incident wave from the damage source arrives at each array element with different path lengths and propagation characteristics influenced by the temperature field. The temperature variations affect both the wave propagation velocity and the material properties, leading to amplitude attenuation and phase shifts that vary across the array elements.
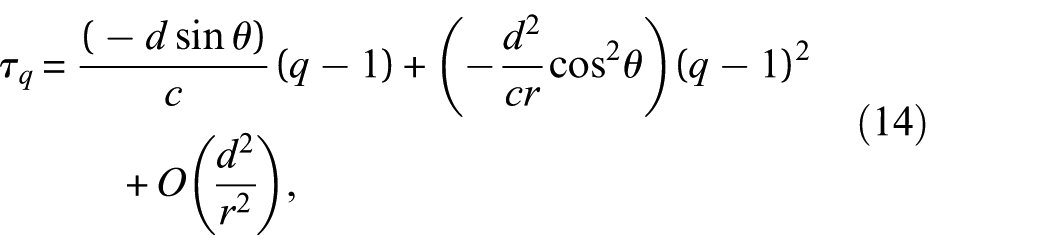
When these temperature effects are taken into account, the signal received at each array element can be expressed through a modified near-field array signal model that incorporates temperature-dependent amplitude and phase terms. For a uniform linear array with 2M + 1 elements, the signal received at the qth element is modeled as
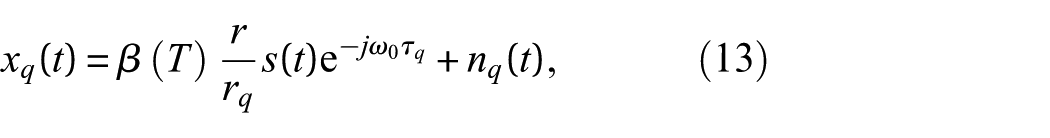
where s(t) is the damage-scattered source signal and n
q
(t) is additive measurement noise. The facto r
q
is the near-field geometric spreading term, in which r denotes the distance from the damage source to the array reference point
Let
The modified observation data from the qth array element can be expressed as:

Let

The array sensor error matrix is thus derived as:

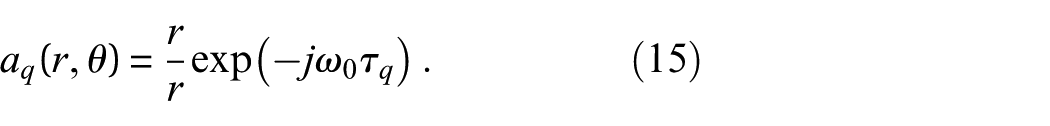
By incorporating the error matrix, the array steering vector for near-field damage signals can be expressed as:

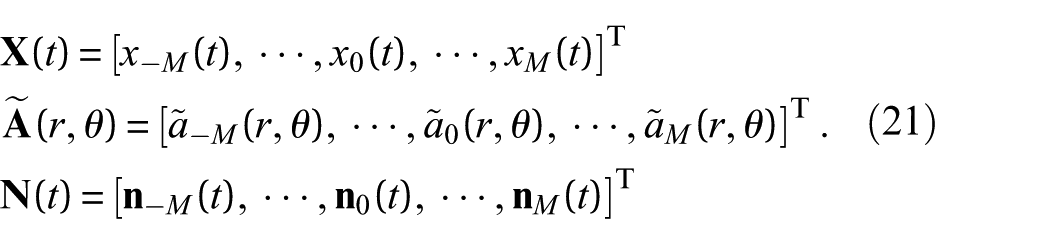
For a uniform linear array, the observed input array signal vector is given by:

where:
The covariance matrix of the sensor array observation signal vector under variable temperature field conditions is:

where
where
To characterize the orthogonal properties, the spatial spectrum of the sensor array under variable temperature field conditions can be calculated through:
To effectively estimate both the damage location parameters and amplitude-phase errors simultaneously, a cost function needs to be constructed that captures the essential characteristics of the MUSIC algorithm while incorporating temperature-induced uncertainties. The fundamental principle underlying the MUSIC algorithm is that the steering vector corresponding to the true damage location should be orthogonal to the noise subspace. Under variable temperature conditions, this orthogonality is affected by both positioning errors and amplitude-phase distortions. Therefore, we propose a cost function that quantifies the projection of the temperature-compensated steering vector onto the noise subspace. Using the offline-calibrated error matrix Γ(T), minimizing this cost function yields the damage location parameters under temperature variations. The proposed cost function J is formulated as:

Where:
In the context of damage localization under variable temperature conditions, the cost function
The actual estimated values
subject to the constraint

where:
The cost function update procedure is as follows:
Update position estimation (r, θ):
Calculate new cost function value:
Compare new and old cost function values: If
Identifiability and convergence of the iterative optimization
The cost function in Equation (26) jointly estimates the damage location (r, θ) and the amplitude–phase error matrix
The compensated steering vector is ã(r, θ, Γ) = Γa(r, θ), in which the location parameters (r, θ) set the inter-element phase gradient through the source-to-element path-length differences, while Γ = diag{α1e^{jφ1}, …, α_N e^{jφ_N}} applies an element-wise amplitude and phase modification. These two mechanisms are structurally distinct, so for an array with N ≥ 3 elements they produce linearly independent perturbations of ã and the joint parameter set is locally identifiable. A scalar ambiguity remains—scaling Γ by a complex constant and dividing a(r, θ) by the same constant leaves ã unchanged—and is removed by anchoring the reference element to γ1 = 1. Under ideal conditions (sufficient signal-to-noise ratio (SNR), correct model order, and no model mismatch), the signal–noise subspace orthogonality established in Equation (24) guarantees that the cost function attains its theoretical minimum J = 0 uniquely at the true location and the true amplitude–phase errors. At finite SNR the cost surface may exhibit shallow secondary minima; their effect is suppressed by the physics-informed initialization described below.
The update defined by Equation (27) and steps (1)–(3) is a block coordinate descent (BCD) scheme that alternately minimizes J over Γ with (r, θ) fixed and over (r, θ) with Γ fixed. Since each sub-step minimizes J over one parameter block, the cost function is monotonically non-increasing, J^(k+1) ≤ J^(k), and it is bounded below by zero, being the squared projection of ã onto the noise subspace. A monotonically non-increasing sequence that is bounded below converges, and by the convergence theory of BCD the iterates converge to a stationary point of J. The convergence curves in Figure 4 confirm this behavior: for the five representative temperatures (−40°C, −10°C, 20°C, 50°C, 80°C) the cost function decreases monotonically and the algorithm converges within 5–8 iterations at a threshold of ε = 10−6.
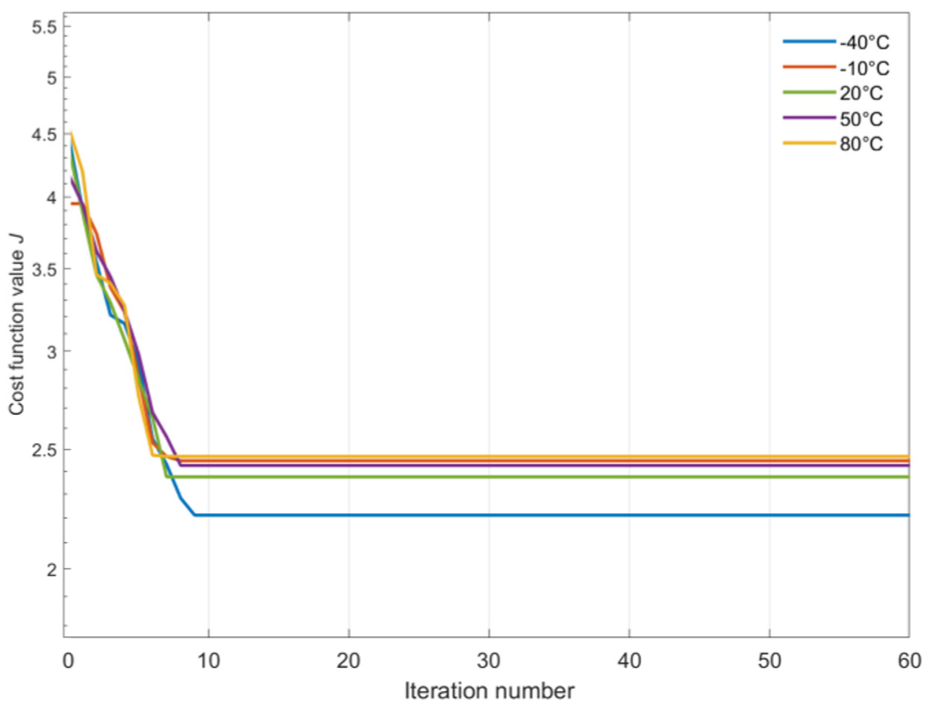
Iteration curve.
The initialization is not arbitrary. The initial error matrix Γ0 is built directly from the measured amplitude-attenuation and phase-delay curves, and the initial location (r0, θ0) is taken from an uncompensated MUSIC scan, whose peak—though shifted by temperature—still falls within the main lobe of the true peak. A perturbation study (±10% and ±20% of the baseline-derived initial values, 50 trials per temperature) shows that the converged estimate is stable, the standard deviation of the converged location remaining within about 2 mm; the detailed results are given in Appendix 2 (Table 10). The simultaneous estimation of (r, θ) and Γ also raises the possibility of crosstalk. This is limited by the structural separation noted above—(r, θ) governs the array-wide phase gradient whereas Γ acts element-wise—and by the alternating BCD updates, which constrain the interaction between the two blocks to higher-order effects across successive iterations. The cross-coupling analysis in Appendix 2 (Table 11) confirms that the recovered Γ varies smoothly and consistently with temperature in accordance with Figure 7, while the location estimates remain clustered around the true position without systematic bias.
The damage imaging experiments
Experiment setup
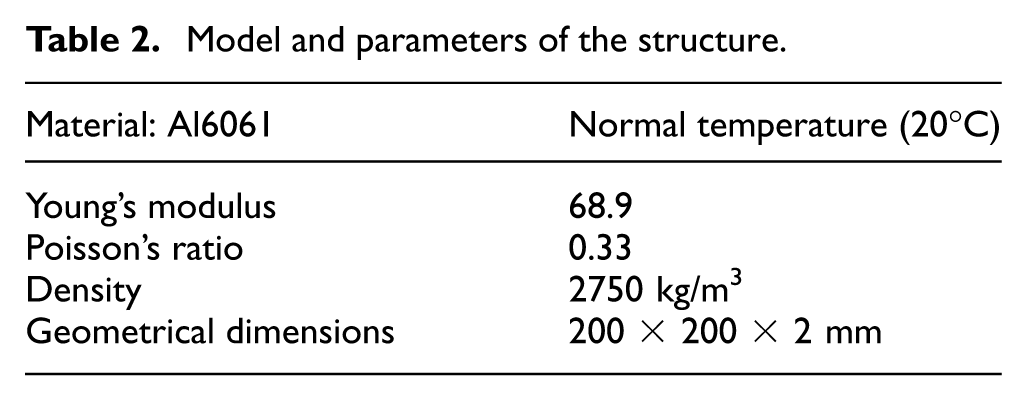
The experimental setup, as depicted in Figure 5, comprises a sensing and data acquisition system along with an environmental enclosure. The excitation signal and recorded received signal are generated by the SHM system (Nanjing Smart Monitoring Technology Co., Ltd, China) with a sampling frequency of 60 MHz and a resolution of 12 bits. The environment box (RK-THX-100, KaiRui Co., Ltd, China) is used to control the temperature of the structure with a temperature accuracy of 0.1°C. The specific properties of the PZT and structure are shown in Tables 1 and 2. The entire temperature range is between −40 and 80°C, with signals collected every 30°C. The entire experimental process takes 12 h, and there is no continuous signal collection during the heating process. The signal will only be collected when the temperature reaches the expected value.
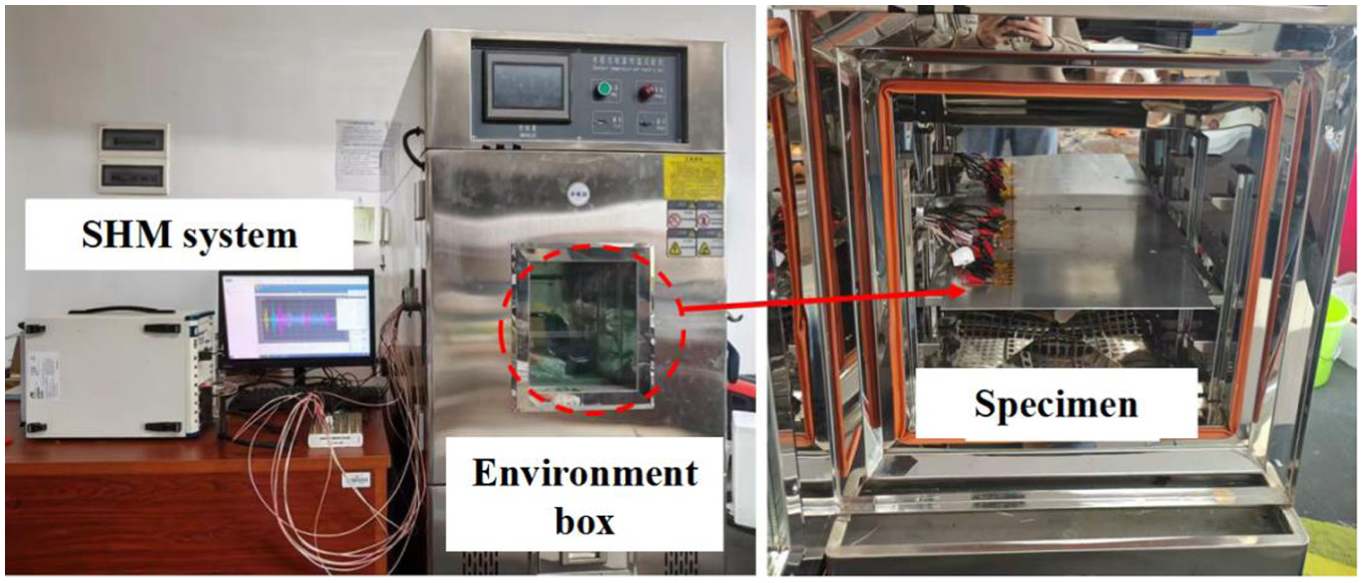
Overall diagram of experimental equipment.
Model and parameters of the PZT.
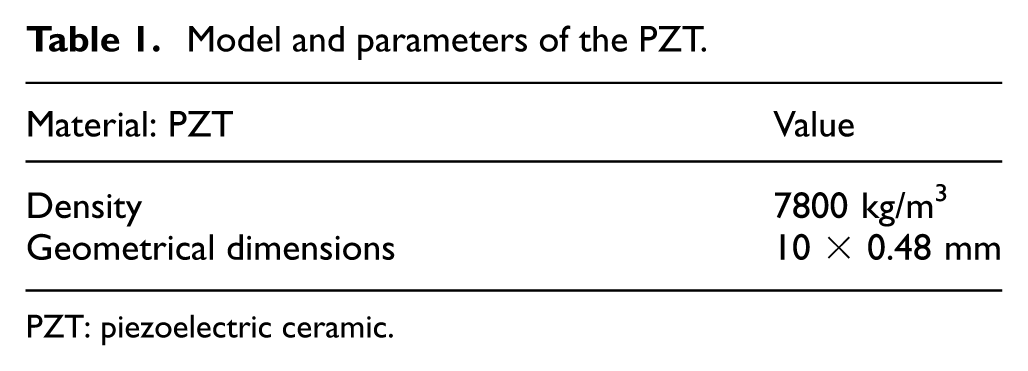
PZT: piezoelectric ceramic.
Model and parameters of the structure.
The piezoelectric transducers used in this study are PZT-5H ceramic discs (diameter: 10 mm, thickness: 0.48 mm), which are widely employed in Lamb wave-based SHM due to their high piezoelectric coefficients and electromechanical coupling efficiency. The transducers are bonded to the aluminum plate surface using a cyanoacrylate adhesive. The excitation signal is a five-cycle Hanning-windowed tone burst with a center frequency of 160 kHz, which is generated by the SHM monitoring system. The center excitation frequency of 160 kHz was determined through a combined consideration of wave propagation characteristics, damage interaction, and transducer response. (i) Dispersion characteristics and mode selection. At a frequency–thickness product of fd = 0.32 MHz·mm for the 2 mm Al6061 plate, the fundamental symmetric (S0) Lamb mode lies within a low-dispersion region of the dispersion curves, with a nearly constant group velocity of approximately 5400 m/s. This low-dispersion behavior preserves wave-packet coherence over the propagation distance and limits temporal spreading, which is essential for accurate extraction of amplitude and time-of-arrival features under variable temperature conditions. Moreover, at this fd, the group velocity of the S0 mode (≈5400 m/s) differs substantially from that of the A0 mode (≈2900 m/s), allowing the first-arriving S0 wave packet to be reliably isolated in the time domain. The S0 mode is also less sensitive to surface conditions and coupling-layer variations than A0, which is advantageous when ambient temperature alters the bond-layer behavior of the PZT–plate interface. (ii) Wavelength and array configuration. The S0 wavelength at 160 kHz is λ ≈ 33 mm, which is sufficiently short relative to the propagation distance to allow detectable scattering from the machined defect, while remaining well above the high-dispersion regime that would otherwise complicate phase measurements. The 5 mm inter-element spacing of the dual array satisfies the spatial sampling requirement (≈λ/6.6), avoiding spatial aliasing in the MUSIC angular spectrum. (iii) Transducer response. The 10 mm diameter PZT-5H discs have a radial resonance in the vicinity of 200 kHz; operating at 160 kHz therefore corresponds to a sub-resonant regime in which the electromechanical response is stable and approximately linear, providing adequate excitation amplitude without exciting strong resonant ringing that would degrade temporal resolution. The tone burst excitation is applied to the actuating transducer, which converts the electrical signal into mechanical strain to generate symmetric (S0 mode) Lamb waves propagating through the plate structure. The experimental configuration employs a dual-sensor arrangement: for each excitation channel, a sensor is positioned on both the upper and lower surfaces at the same location to generate symmetric Lamb wave excitation signals. During operation, one transducer acts as the excitor while all seven transducers on the upper surface function as receivers.
To validate the effectiveness of the proposed method across different damage configurations, three test plates of identical geometry and material (Al6061, 200 × 200 × 2 mm), denoted T1, T2, and T3, were prepared, each containing an artificial square defect machined at a different location relative to the dual-array configuration. The material characteristics and geometric shape of PZT are detailed in Table 2. The sensor layout is shown in Figure 6.
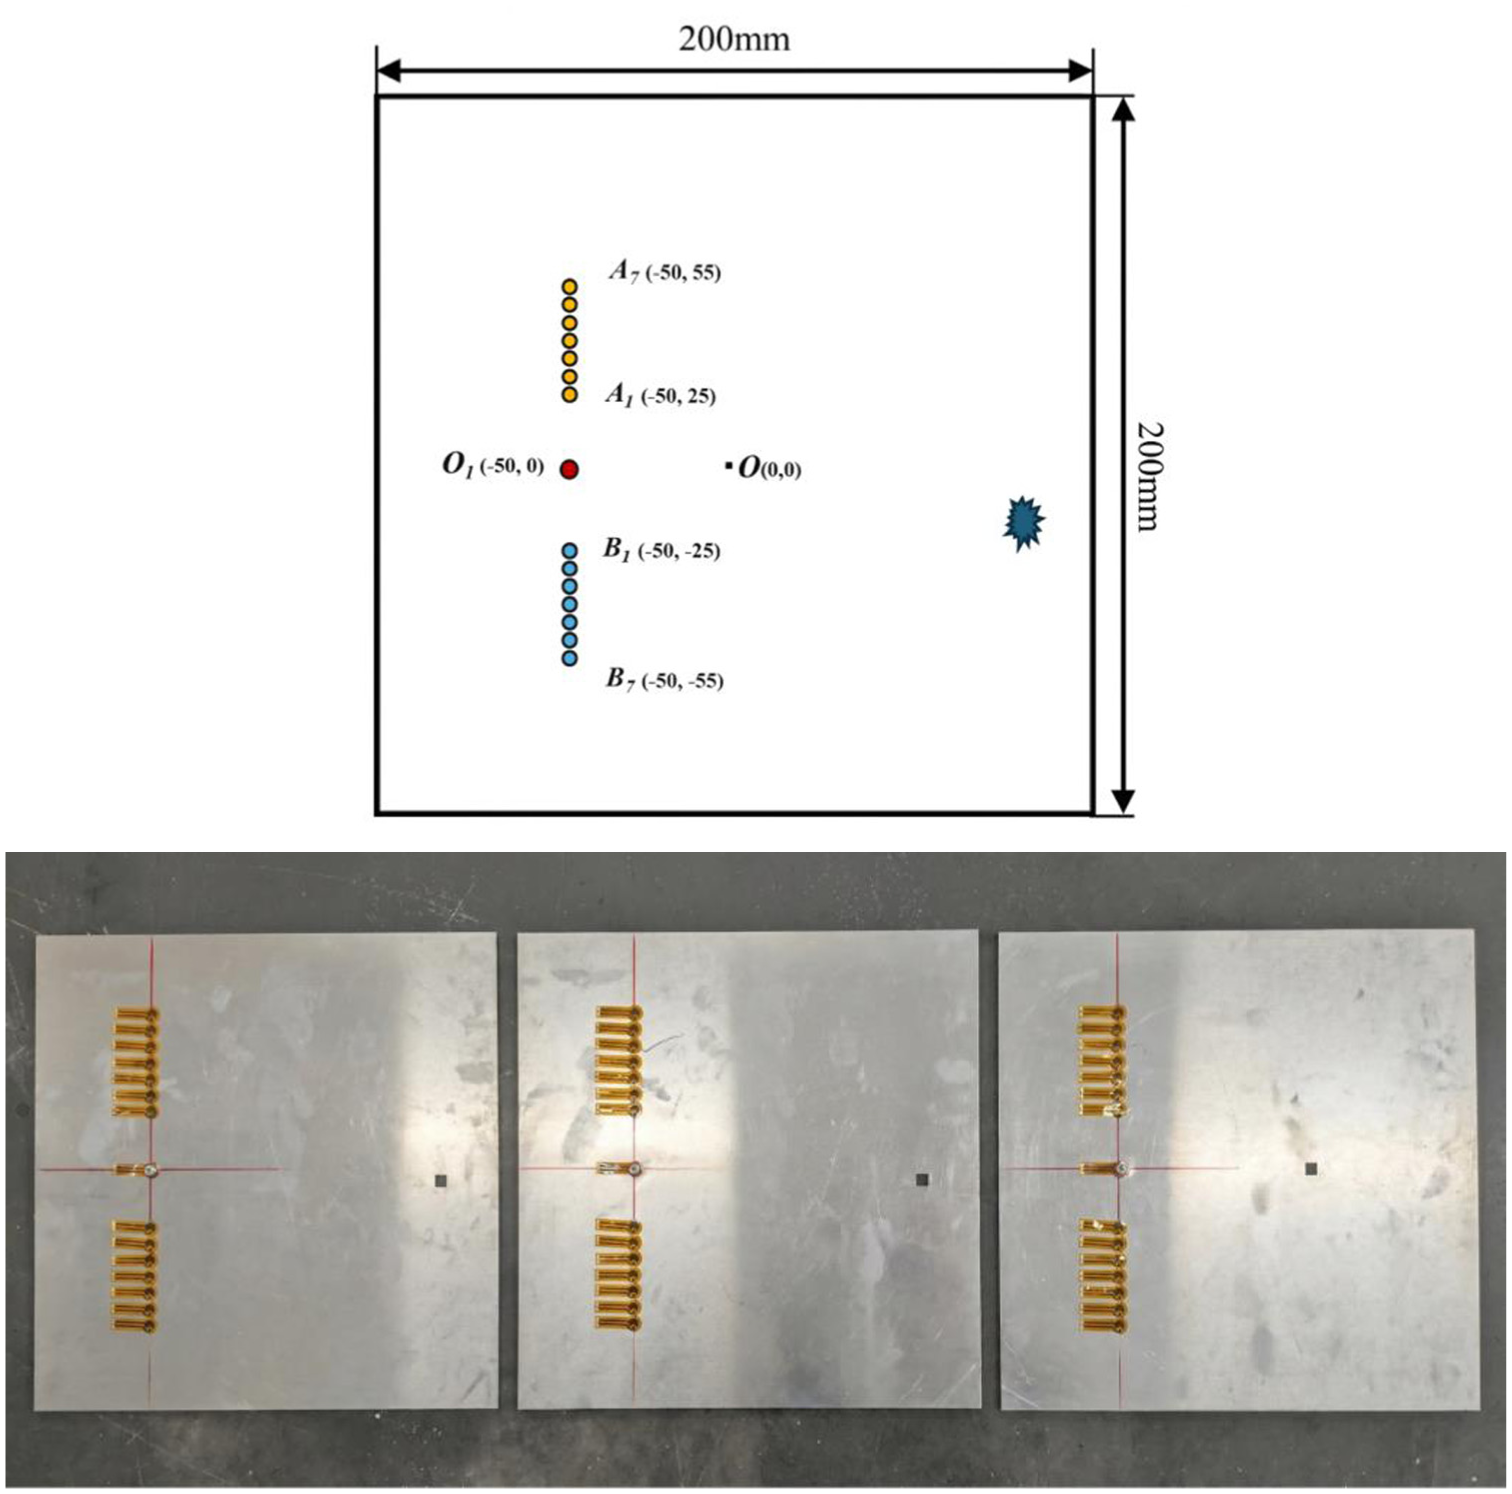
PZT sensor layout. PZT: piezoelectric ceramic.
The artificial damage is a 5 × 5 mm square through-cut (full thickness penetration) created by wire electrical discharge machining (wire-EDM). At the excitation frequency of 160 kHz, the experimentally measured S0 mode phase velocity in the 2 mm thick 6061 aluminum plate is approximately 5350 m/s at 20°C, corresponding to a wavelength of λ ≈ 33.4 mm. The resulting dimensionless wavenumber-radius product ka ≈ 0.47 (where a = 2.5 mm is the effective scatterer radius) places the scattering problem firmly in the long-wavelength regime (ka < 1). In this regime, the scattered wavefield is dominated by low-order (monopole and dipole) components, and the defect can be reasonably approximated as a point-like source for DOA estimation purposes. Moreover, the temperature-induced velocity variation (approximately ±2–3% across the −40 to 80°C range) results in wavelength changes of less than 1 mm, ensuring that the point-source approximation remains valid across all tested temperature conditions.
A coordinate system is established with the geometric center of each plate serving as the origin, where the length and width directions are designated as the x-axis and y-axis, respectively, and the thickness direction as the z-axis. Two sensor arrays (array A and array B) are implemented, each consisting of seven elements with an inter-element spacing of 5 mm. The first elements of these arrays are positioned at point A1 (coordinates: −50 mm, 25 mm) and point B1 (coordinates: −50 mm, −50 mm), respectively. An excitation source is applied at coordinates (−50 mm, 0 mm) to generate Lamb waves within the plate. A linear sensor array comprising seven elements is installed on the upper surface of the plate at approximately (0 mm, −50 mm), with sensors labeled sequentially from left to right as A1, A2, …, A7. The experimental configuration employed a dual-sensor arrangement: when any one of the seven upper surface sensors acted as an excitation source, a corresponding sensor is positioned directly beneath it on the lower surface. This sensor pair is utilized to generate symmetric Lamb wave excitation signals. During operation, while one sensor served as the excitor, all seven sensors on the upper surface functioned as receivers, collecting echo signals from the target region.
In the present experimental configuration, a single damage scatterer is located in the plate, and the MUSIC algorithm estimates the DOA of the scattered wave from this single source (M = 1). The uncorrelated-source assumption is therefore inherently satisfied. To avoid contamination from boundary-reflected waves that could introduce coherent multipath components, time-domain windowing is applied to extract only the first-arrival scattered wave packet from the damage prior to covariance matrix construction. This ensures that the received signal conforms to the single-source model assumed in the MUSIC formulation.
Propagation characteristics of Lamb waves under variable temperature
In the amplitude-phase error matrix construction experiment, specimens are subjected to systematic thermal loading from −40 to 80°C. During the heating process, Lamb wave signal data excited by PZT transducers are collected at regular 10°C temperature intervals to ensure comprehensive coverage across the entire temperature range. The temperature variation was carefully controlled using the environmental chamber with a stability of ±0.1°C at each measurement point to ensure reliable data acquisition.
As illustrated in Figure 7, the Lamb wave signals under different temperatures from −40 to 80°C are compared to analyze the temperature effects on wave propagation. The waveforms clearly demonstrate the temperature-dependent behavior of Lamb waves, where both amplitude and phase variations are observed with changing temperatures. In the temperature range below 0°C (−40 to −10°C), the signals show relatively smaller amplitudes and phase shifts. As temperature increases from 0 to 40°C, a gradual increase in signal amplitude is observed, accompanied by progressive phase shifts. The amplitude variation at each temperature is quantified by extracting the peak-to-peak amplitude of the first-arrival S0 mode wave packet from the time-domain signal. The phase delay is computed by measuring the time-of-arrival shift of the S0 mode wave packet relative to the reference signal at 20°C, using the cross-correlation method. Specifically, the cross-correlation function between the reference signal xref(t) and the signal at temperature x T (t), is calculated, and the time shift corresponding to the maximum cross-correlation value is identified as the phase delay. This time shift is then converted to phase delay using the excitation center frequency.
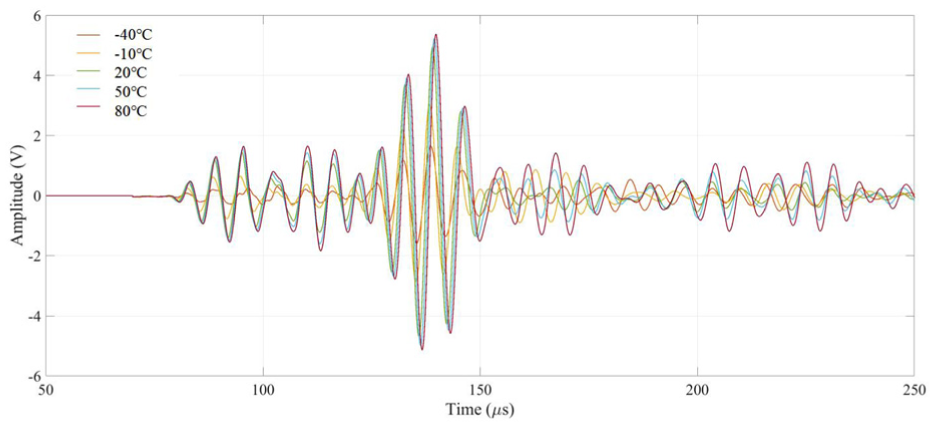
Lamb wave signals at different temperatures.
To investigate the propagation characteristics under various temperature field conditions, comprehensive amplitude attenuation and phase delay curves are fitted for all ten PZT transducers as a function of temperature variation, as illustrated in Figure 8. The experimental results demonstrate that with increasing temperature, the signal amplitude showed a generally increasing trend, though the rate of increase varied among different sensors. The amplitude variation exhibited good consistency across all sensors, with a maximum deviation of ±5% between different array elements. A slight nonlinear behavior was observed at temperature extremes (−40 and 80°C), suggesting potential material property changes affecting wave propagation. The phase analysis reveals that the direct wave phase of signals from each sensor exhibited systematic unidirectional drift with increasing temperature. These systematic patterns of thermal effects on wave propagation can be attributed to temperature-induced changes in material elastic properties, thermal expansion effects on wave propagation paths, and variations in piezoelectric coupling efficiency of the PZT transducers. This comprehensive analysis provides valuable insights into the temperature-dependent characteristics of Lamb waves, serving as the foundation for developing the temperature compensation strategy implemented in the damage localization algorithm. The consistent and predictable nature of the temperature-induced changes enables effective correction through the amplitude-phase error matrix approach detailed in “Array Lamb wave modeling under variable temperature environment” section.
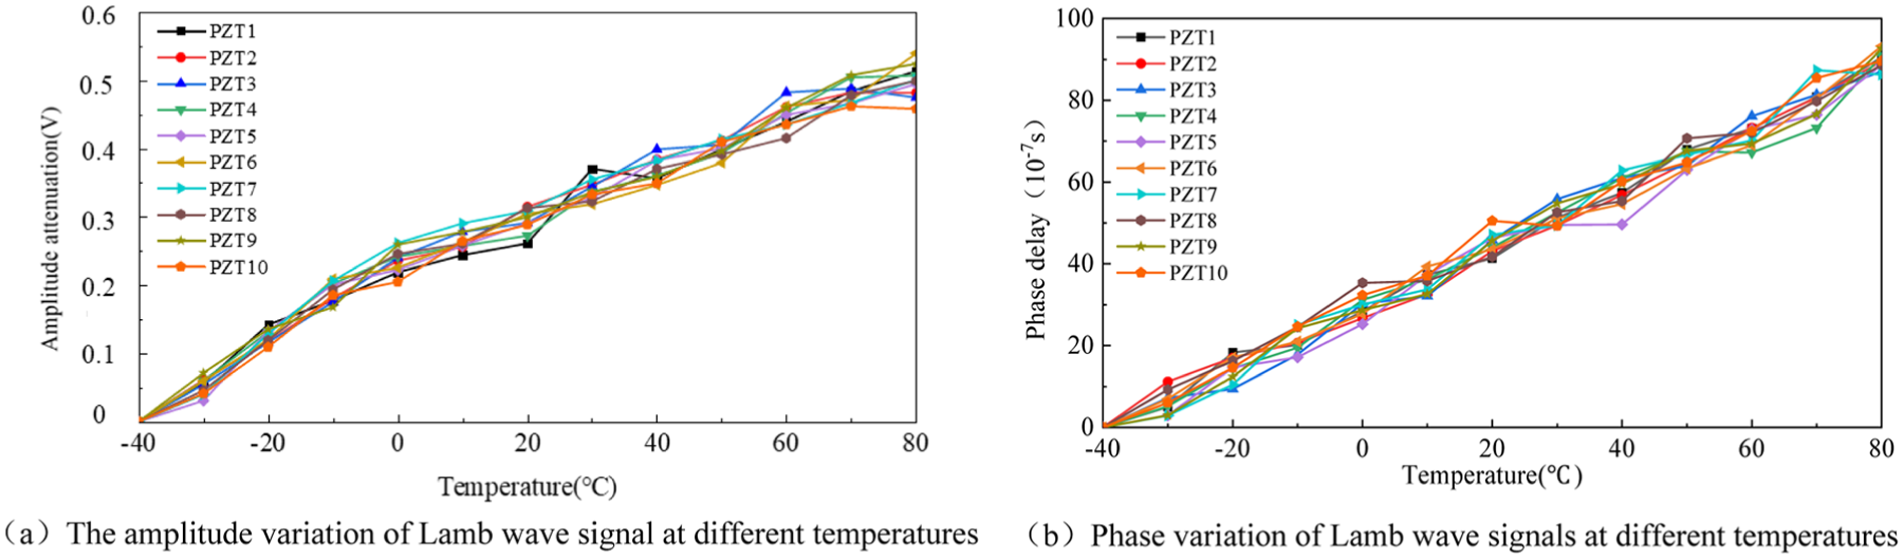
Changes in Lamb wave amplitude and phase at different temperatures: (a) the amplitude variation of Lamb wave signal at different temperatures and (b) phase variation of Lamb wave signals at different temperatures.
Data analysis
Validation across multiple damage scenarios
To validate the universality of the proposed method beyond specific defect locations, three separate 6061 aluminum specimens (denoted as T1, T2, and T3) were fabricated. Each specimen incorporated a machined square-shaped artificial defect created by wire electrical discharge cutting, with each defect positioned differently relative to the dual-array configuration. This intentional variation resulted in distinct differences in the wave propagation distances and incident angles between arrays A and B across the three specimens. For every specimen, damage localization was performed over the full temperature range from −40 to 80°C using the same compensated MUSIC-beamforming framework, along with a specimen-specific amplitude-phase error correction matrix. Figure 9 presents the damage localization images obtained for specimen T1 at various temperatures, while Figure 10 shows the corresponding imaging outcomes for specimens T2 and T3 under both room temperature and extreme environmental conditions.
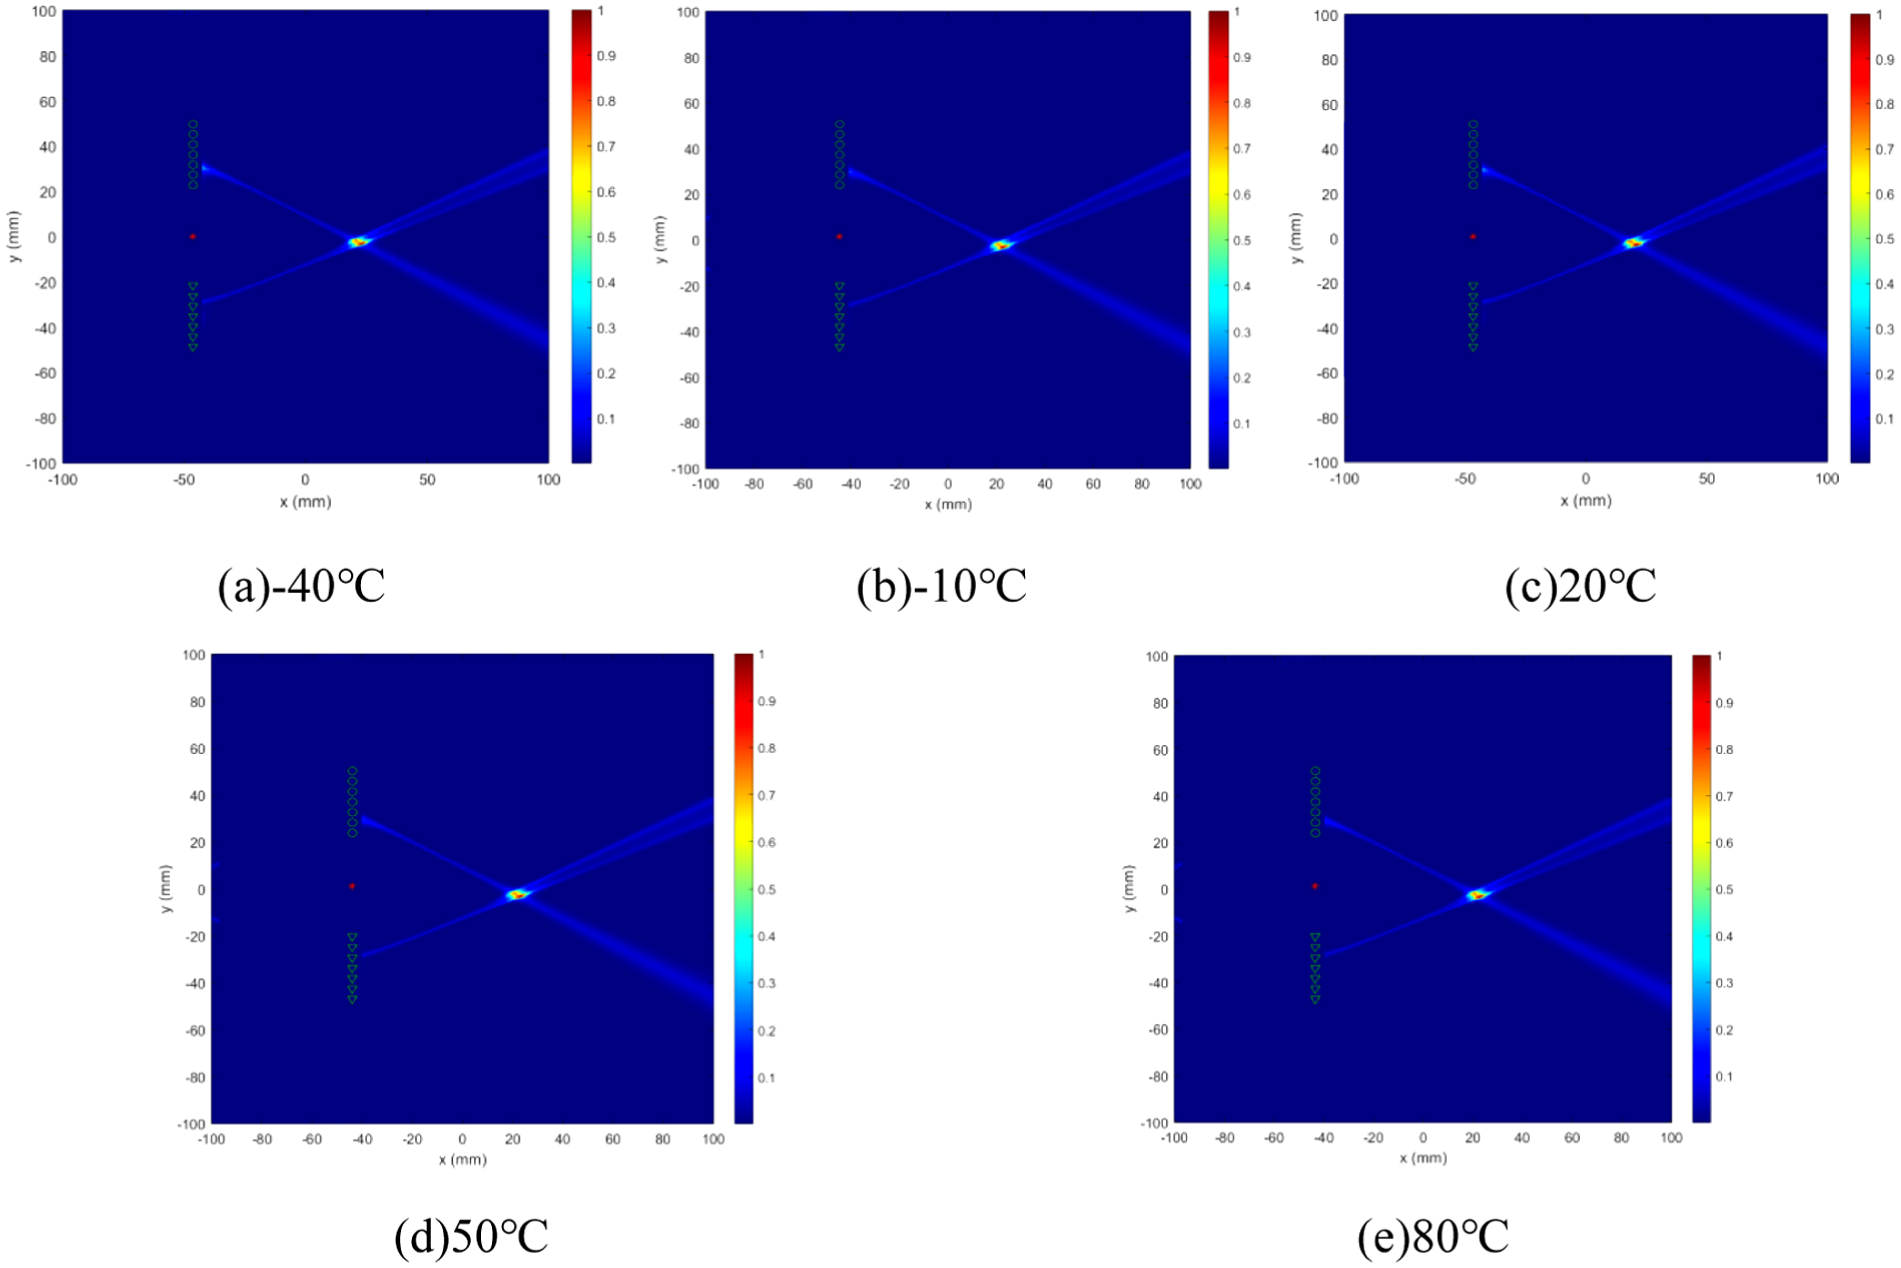
Damage localization results under different temperatures of T1: (a) −40°C, (b) −10°C, (c) 20°C, (d) 50°C, and (e) 80°C.
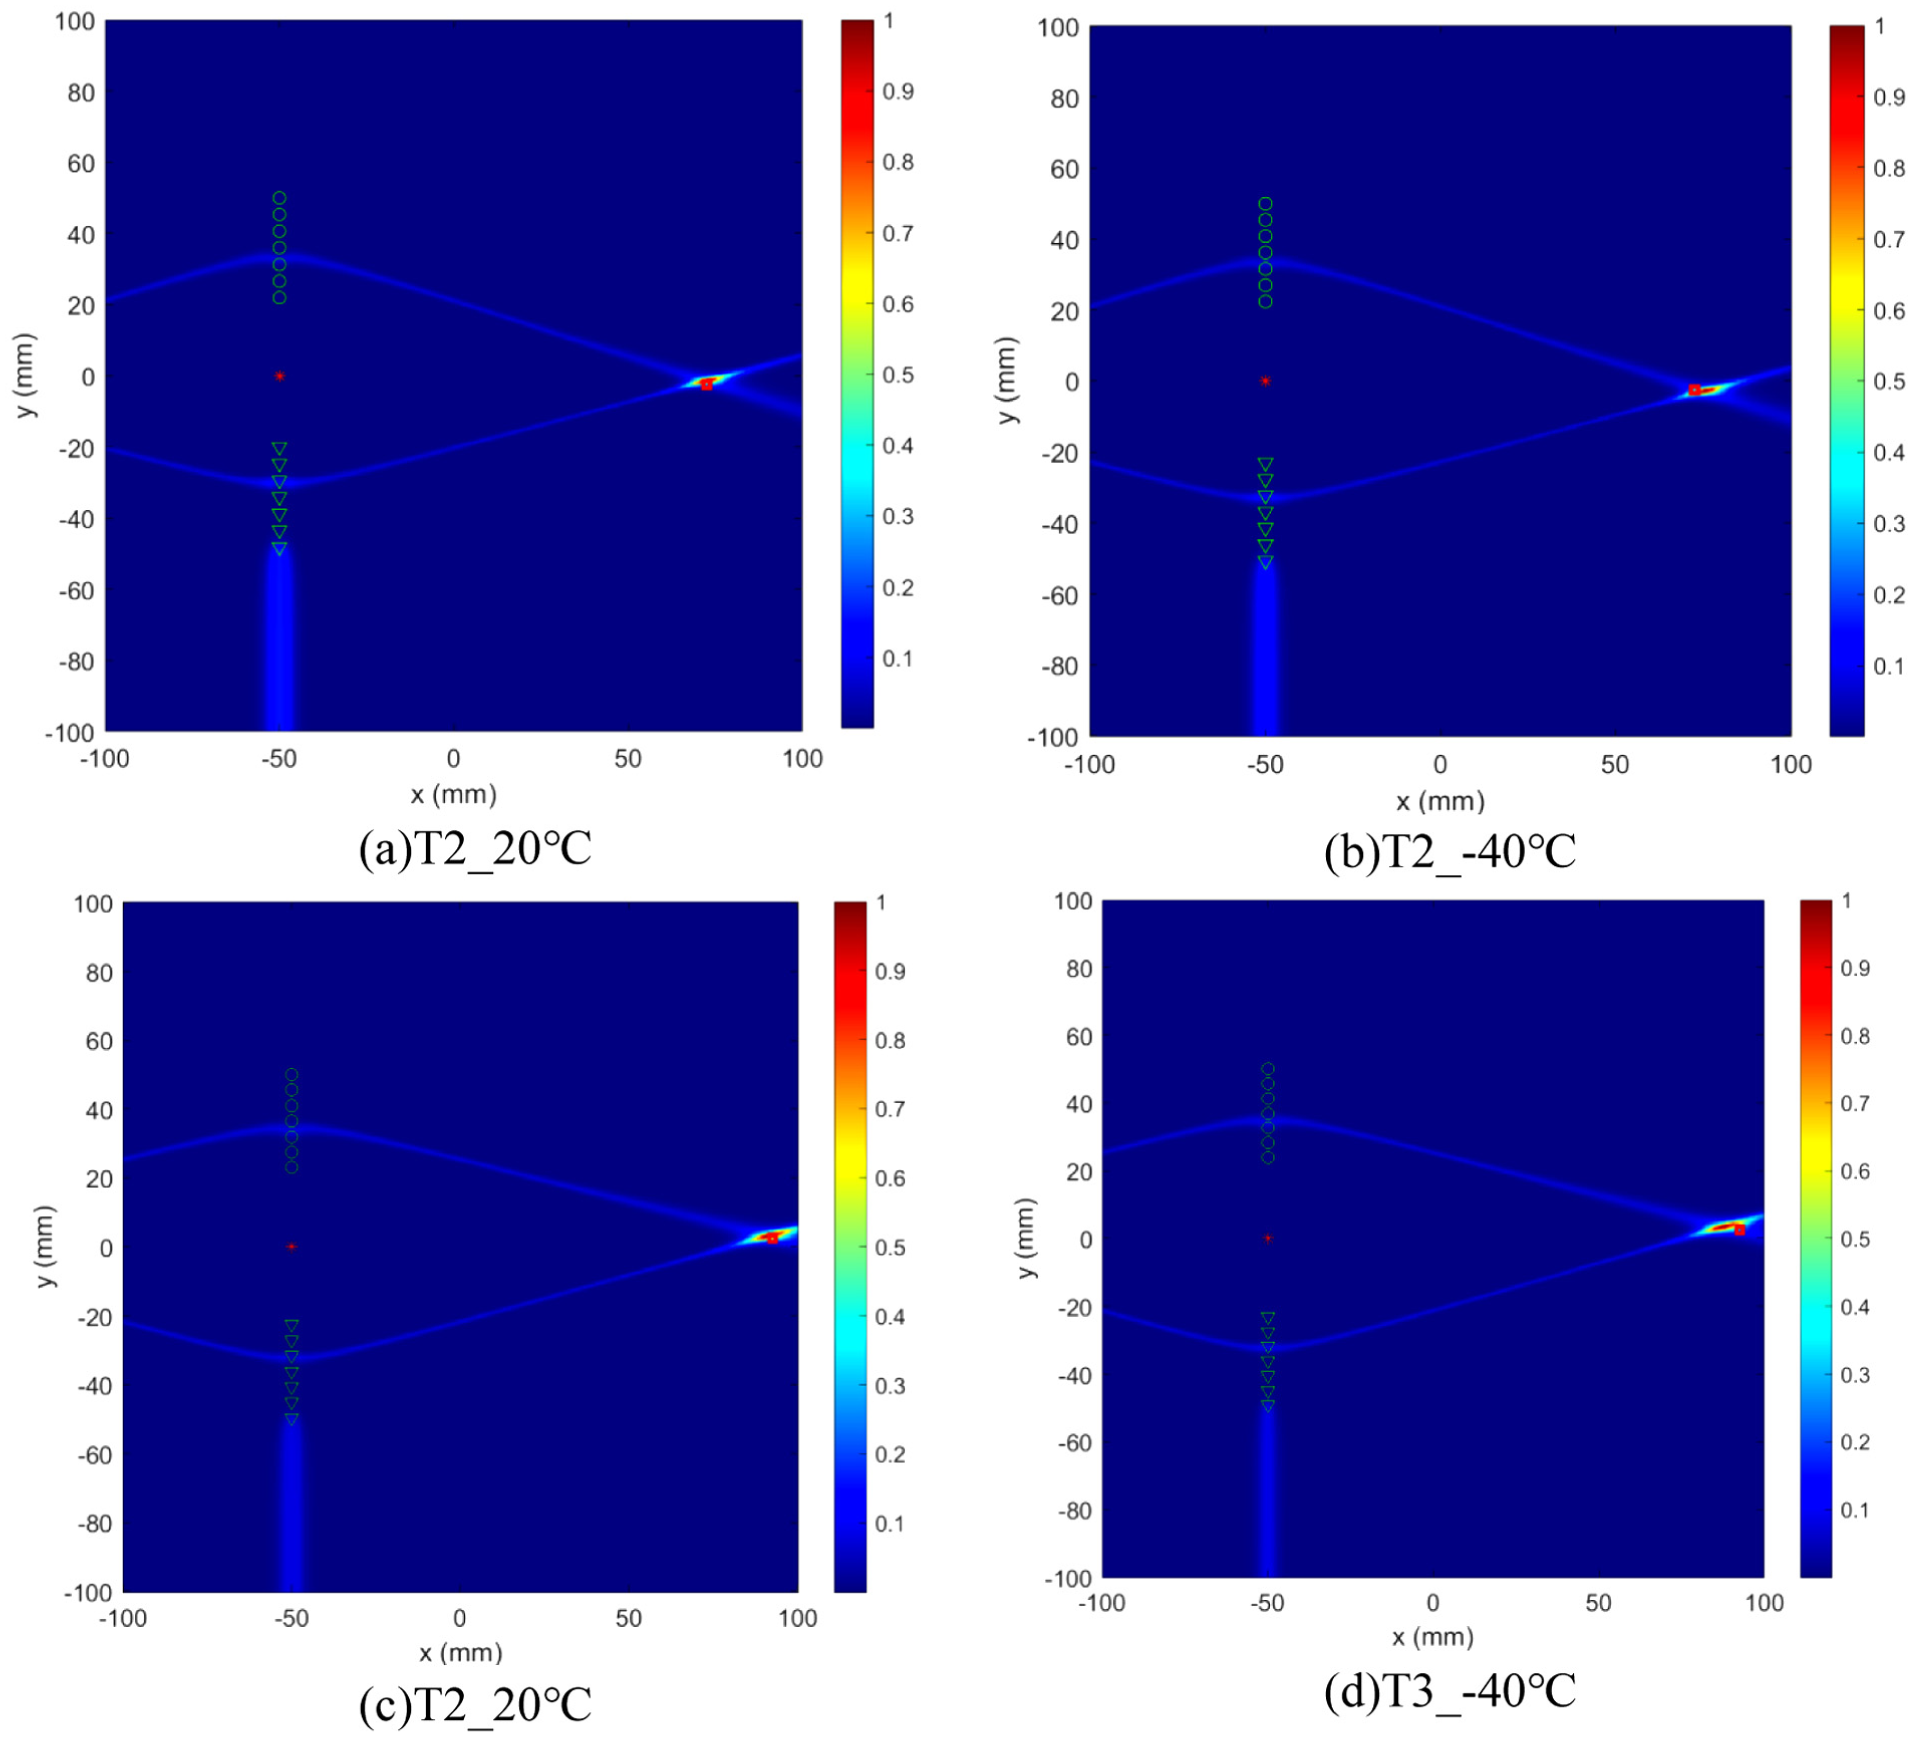
Damage localization results under of T2 and T3: (a) T2_20°C, (b) T2_−40°C, (c) T2_20°C, and (d) T3_−40°C.
The color map represents the normalized MUSIC-beamforming spatial spectrum P(r, θ), obtained by dividing all spectrum values by the global maximum, with values ranging from 0 (blue, no damage indication) to 1 (red, strongest damage indication).
To evaluate the positioning accuracy, relative error is used as the evaluation index. Assuming the actual coordinates of the damage location are
Calculate the distance from the actual damage point to the coordinate origin:

The relative error can be expressed as:
Table 3 Damage localization errors for the three specimens across the temperature range.
Damage localization errors under different temperatures.
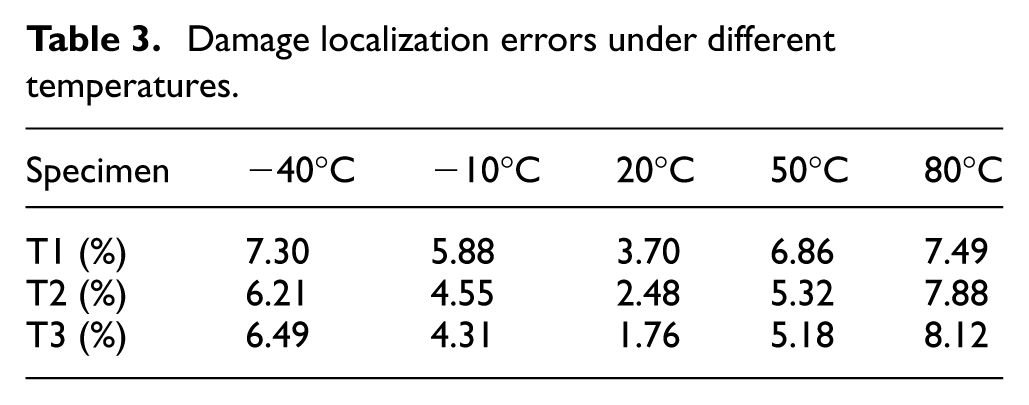
The reference position (25, 5) mm of T1 corresponds to the geometric center of the 5 × 5 mm square defect. Since the MUSIC algorithm estimates the equivalent point-source location of the scattered field, the estimated position represents the effective scattering center of the defect rather than a specific geometric point. For the sub-wavelength defect used in this study (ka ≈ 0.47), the effective scattering center is expected to closely coincide with the geometric center, and the positioning errors reported above are calculated with respect to this reference.
Figure 10 presents the damage localization imaging results under varying temperature conditions ranging from −40 to 80°C. Imaging quality and spatial resolution are maintained consistently across the entire temperature range. Slight blurring is observed at −40°C due to enhanced signal attenuation, while optimal imaging performance is achieved at 20°C. Although a minor degradation in image quality occurs at elevated temperatures of 50 and 80°C, the damage localization accuracy remains sufficient to meet the required specifications. The relative error is minimized at room temperature (3.70%), and under extreme temperatures, the error remains controlled within 7.5%. These results demonstrate that the amplitude-phase error compensation mechanism effectively suppresses temperature-induced interference with Lamb wave signals.
Effect of excitation frequency
The results presented above were obtained at the 160 kHz excitation frequency selected in “Experiment setup” section. Since the temperature-induced amplitude attenuation and phase delay of Lamb waves are inherently frequency-dependent—different frequencies correspond to different operating points on the temperature-perturbed dispersion curves—it is necessary to verify that the proposed compensation framework does not rely on a single operating frequency. To this end, an additional set of experiments was carried out at 120 kHz, so that the method is evaluated at two distinct excitation frequencies. The 120 kHz frequency keeps the S0 mode within its low-dispersion region (fd = 0.24 MHz·mm), preserves clear temporal separation from the A0 mode, and represents a 25% downward shift from the nominal 160 kHz—large enough to change the temperature-induced signal behavior appreciably while keeping the S0 mode in the same qualitative regime.
For the 120 kHz excitation, the amplitude attenuation and phase delay curves were re-measured independently over the full −40 to 80°C range, and a frequency-specific amplitude-phase error matrix Γ(r, θ) was reconstructed from these curves. Damage localization was then performed at each temperature point using the same dual-array MUSIC-beamforming procedure described in the second and third sections, without any modification to the algorithm. To keep the main text concise, the time-domain waveforms, the amplitude/phase-versus-temperature curves for the ten PZT elements, and the imaging maps at all temperature points for the 120 kHz case are provided in Appendix 1; only the summary results are reported here.
The relative localization errors obtained at the two excitation frequencies are compared in Table 4. Across all ten frequency–temperature combinations, the maximum relative error remains below 8%, and the error at each temperature is comparable to that obtained at 160 kHz. At both frequencies, the error follows the same trend with temperature, reaching its minimum near room temperature (20°C) and increasing slightly toward the two extremes, consistent with the stronger signal attenuation and larger phase drift observed at −40 and 80°C.
Relative localization errors at different excitation frequencies.
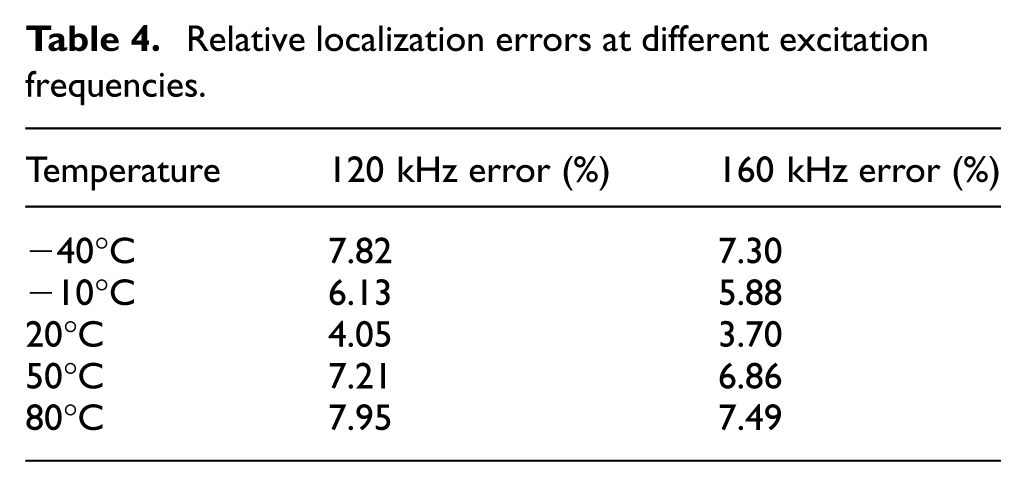
At both 120 and 160 kHz the damage is clearly localized at −40 and 80°C, with only minor differences in the size and sharpness of the focal spot. The slightly broader focal region at 120 kHz reflects its longer wavelength (λ ≈ 44 mm), which lowers the sensitivity of the steering vector to residual phase uncertainties but also coarsens the angular resolution of the MUSIC spectrum; the net effect on localization accuracy is small. These results confirm that, although the absolute magnitudes of the temperature-induced amplitude and phase variations differ between the two frequencies, the proposed framework restores comparable localization accuracy in both cases. The frequency dependence is absorbed into the experimentally calibrated matrix Γ(r, θ), while the cost-function optimization in Equation (26) remains frequency-agnostic. Consequently, when a different excitation frequency is adopted, only the amplitude-phase calibration curves need to be re-acquired, whereas the algorithmic framework itself is unchanged.
Ablation analysis of the compensation and fusion strategy
To clarify the distinct contributions of the two core components of the proposed framework—the temperature error-matrix compensation and the MUSIC–beamforming fusion—a unified ablation study was conducted on the identical −40 to 80°C experimental dataset. The study is organized around a single underlying principle established in “MUSIC and beamforming algorithm” section: the angular estimate of the damage location is governed by the inter-element phase structure and is therefore phase-dominated, whereas the imaging quality and final localization refinement depend on the physical signal-power distribution restored by amplitude compensation and beamforming. The following analysis verifies this principle from two complementary directions.
The necessity of integrating beamforming with the MUSIC algorithm was first examined by comparing two approaches on the same dataset: (i) the MUSIC algorithm alone, (ii) conventional delay-and-sum (DAS) beamforming alone, and (iii) the proposed combined method. Two quantitative metrics were used: localization error and peak-to-sidelobe ratio (PSR, defined as the ratio of the peak intensity to the maximum sidelobe level outside a 10 mm radius from the peak). A smaller main-lobe area indicates sharper focusing, and a higher PSR indicates stronger suppression of spurious artifacts.
The results are summarized in Table 5. DAS beamforming alone produced a broadly diffused energy distribution with a main-lobe area of 11,285.8 mm2 and a PSR of 0.0 dB. Although its estimated centroid happened to fall close to the true location (error of 1.41 mm), the absence of any focusing means this figure reflects a coarse energy centroid rather than a resolved damage point; DAS alone therefore cannot serve as a standalone localization tool. The MUSIC algorithm alone yielded a far more focused image, with a compact main-lobe area of 14.2 mm2, confirming the high angular resolution derived from noise-subspace orthogonality, although its pseudo-spectrum nature left a residual localization error of 6.32 mm. The proposed combined method retained the compact 14.2 mm2 main-lobe while reducing the localization error to 0.71 mm by incorporating the physical signal-power distribution from the actual received waveforms into the fused spectrum (Figure 11).
Ablation comparison of imaging performance.
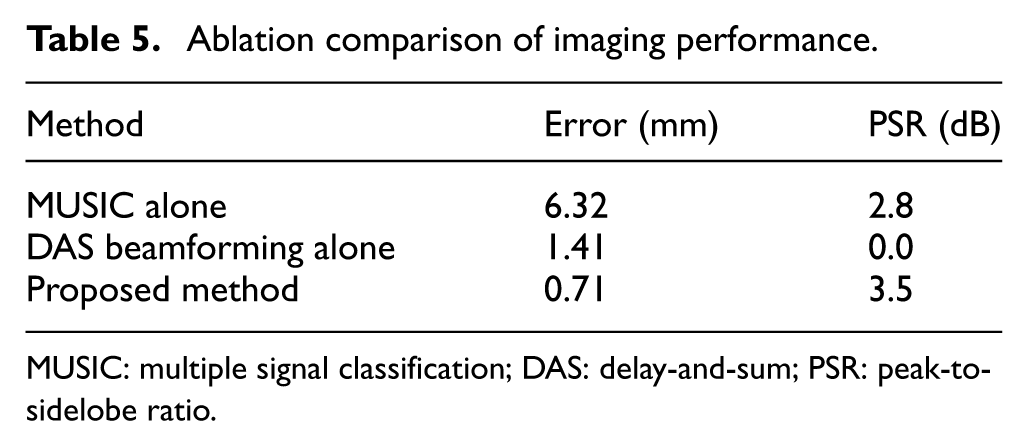
MUSIC: multiple signal classification; DAS: delay-and-sum; PSR: peak-to-sidelobe ratio.
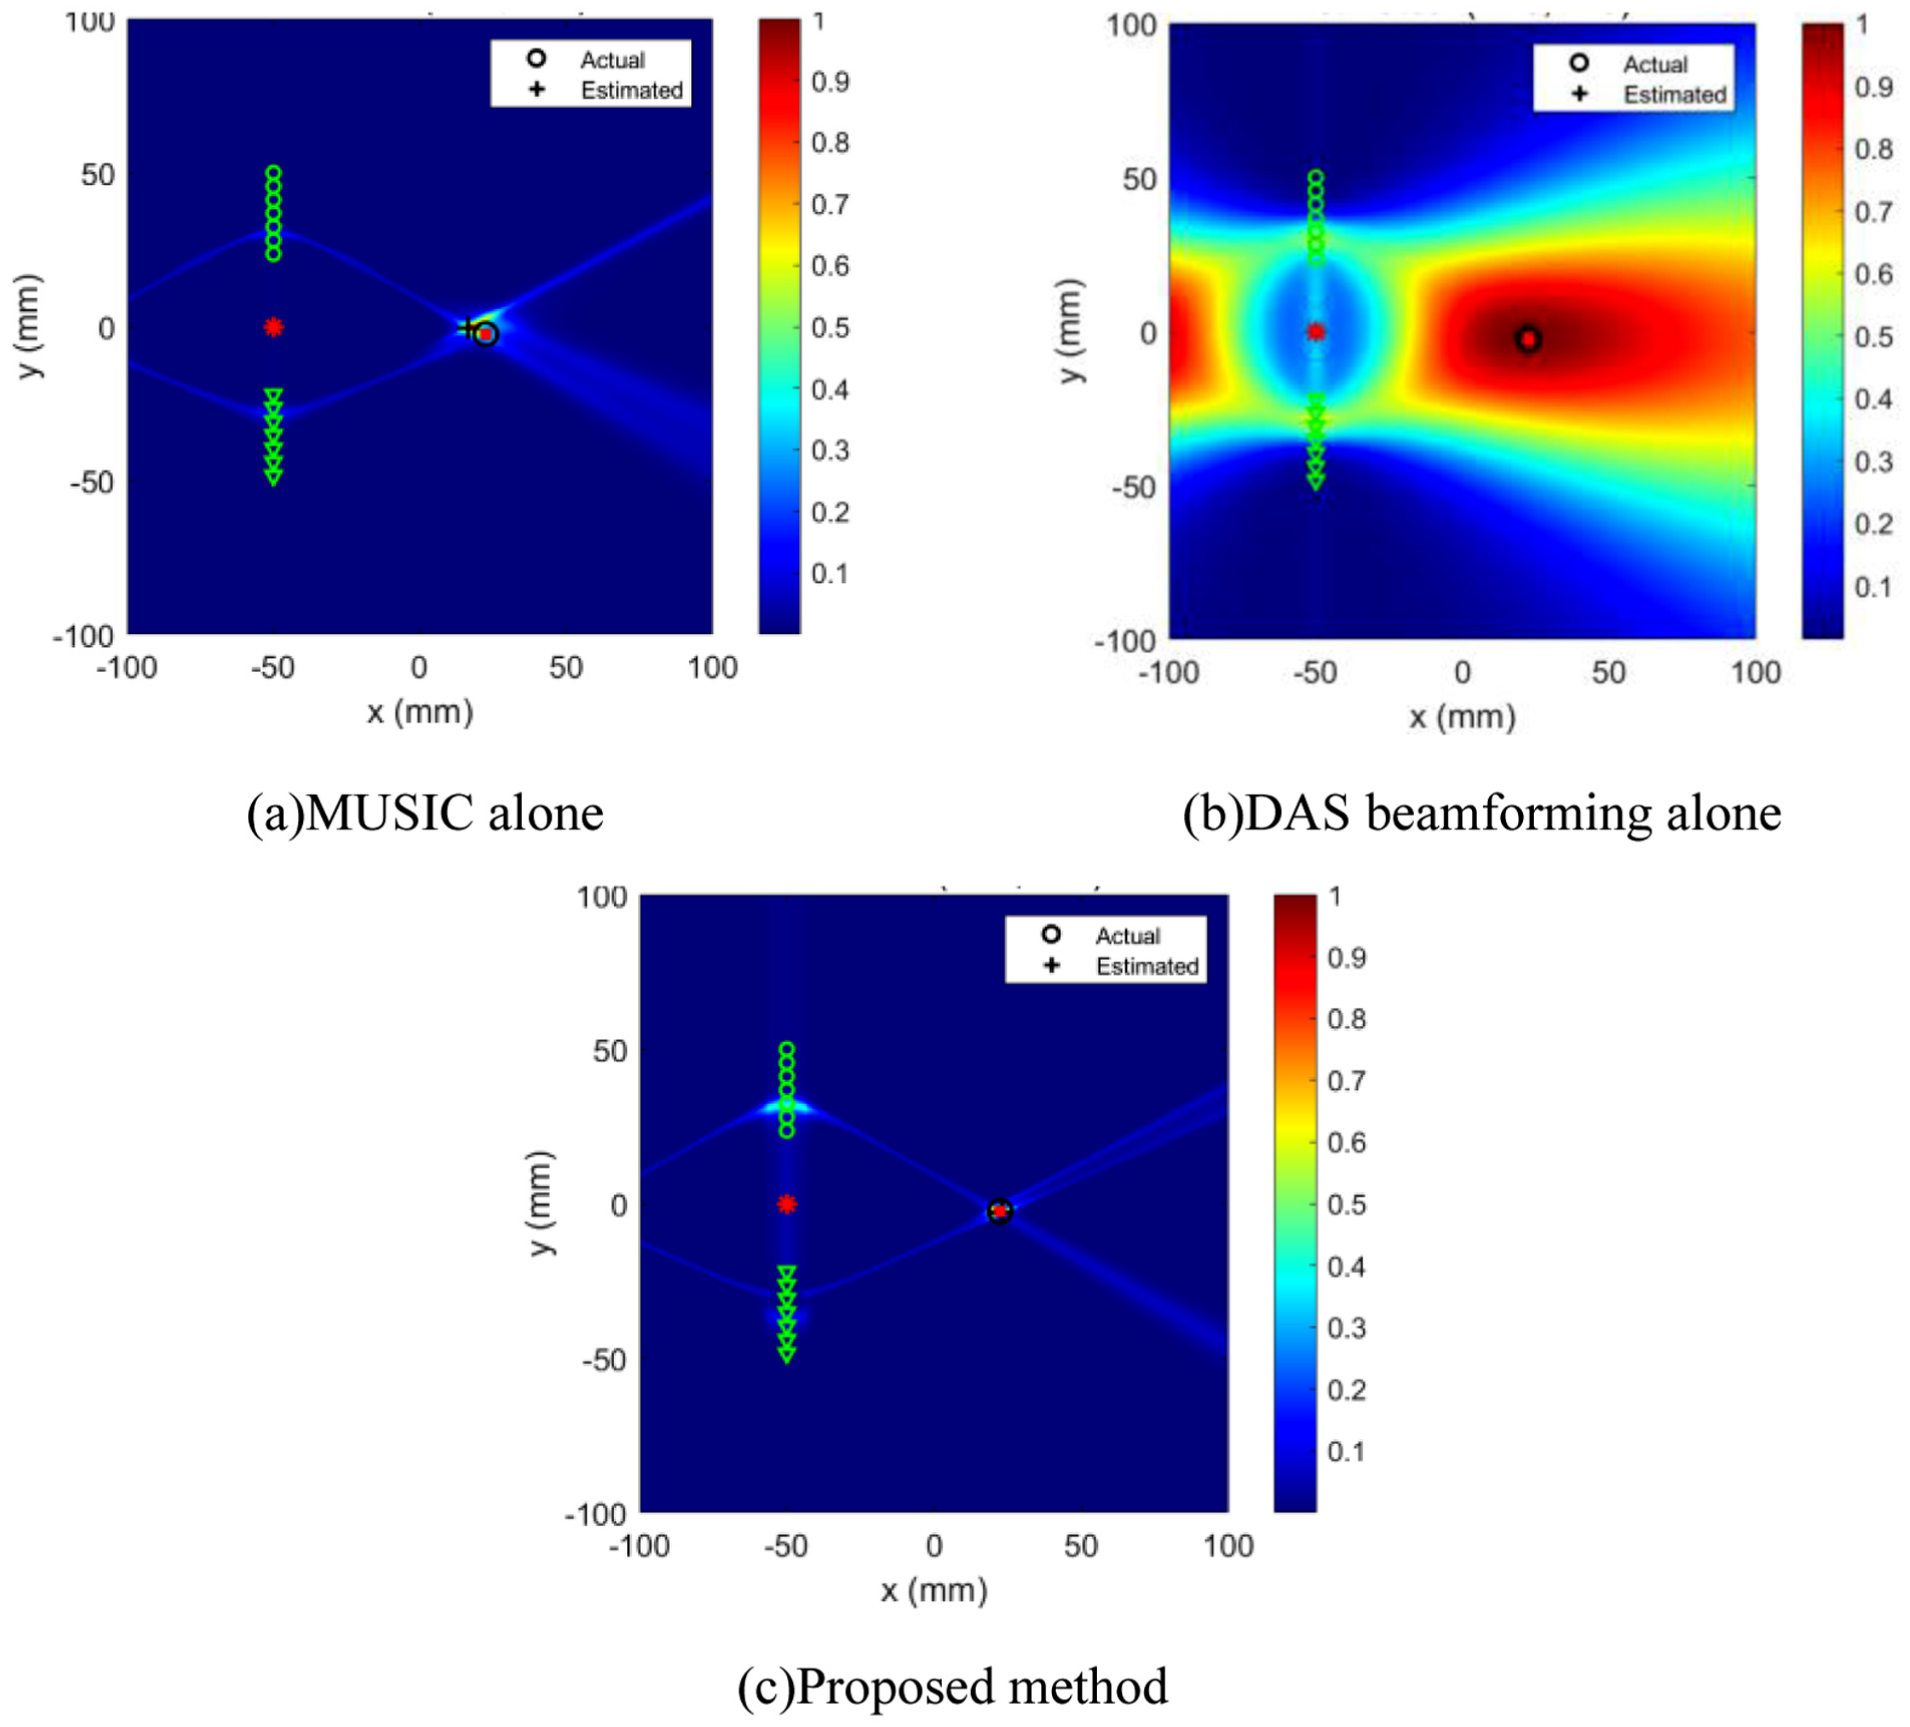
Damage imaging results: (a) MUSIC alone, (b) DAS beamforming alone, and (c) proposed method. MUSIC: multiple signal classification; DAS: delay-and-sum.
These results confirm the complementary roles of the two components: MUSIC provides the sharp focusing required for high resolution, while beamforming refines the localization accuracy by anchoring the estimate to the physical signal energy. Neither component alone is sufficient—DAS lacks resolution, and MUSIC, being a pseudo-spectrum, does not directly reflect physical signal energy and may retain artifacts under temperature-induced distortions.
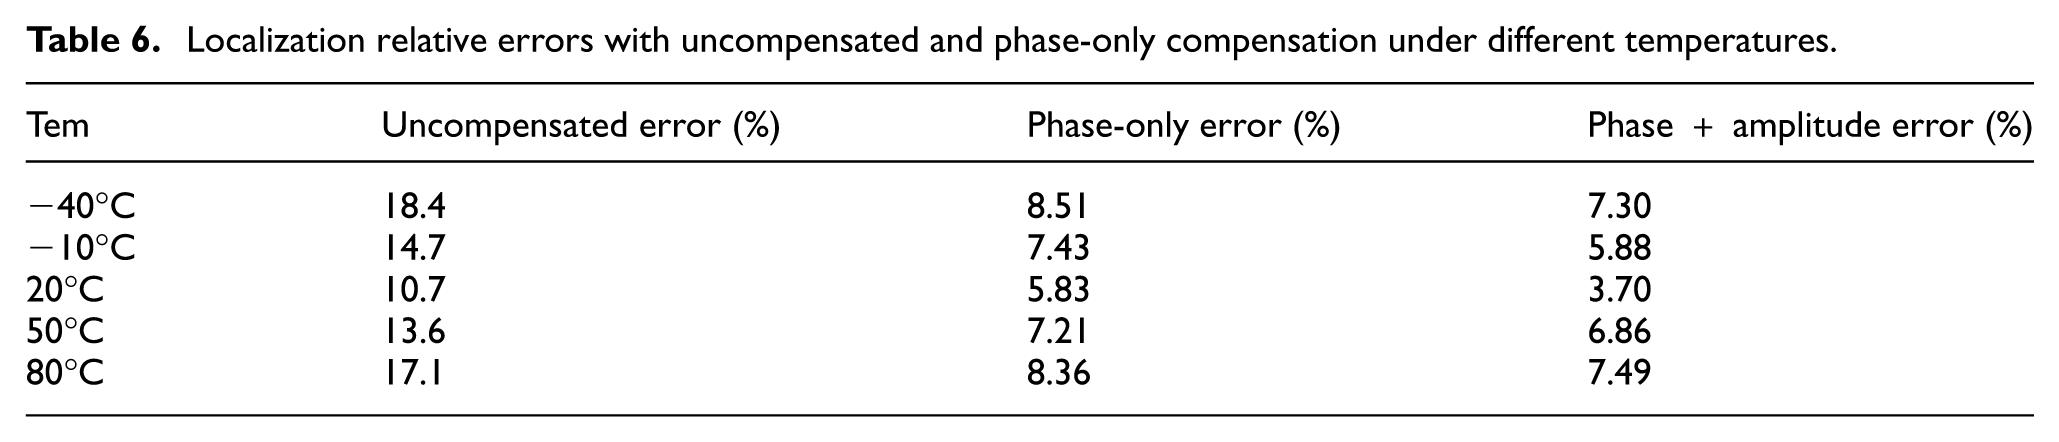
The second direction of the study isolates the role of the amplitude term of the temperature error matrix. Since the angular estimate is phase-dominated, two configurations of the proposed framework were compared on the identical −40 to 80°C dataset: a phase-only configuration, in which the amplitude entries of the error matrix were fixed to unity, and the full phase-plus-amplitude configuration. The localization results are summarized in Table 5. The relative localization error is only weakly affected by amplitude compensation, the mean relative error changing from 7.47% (phase-only) to 6.25% (phase-plus-amplitude) across the temperature range. This confirms that the angular estimate is essentially phase-dominated and largely insensitive to the temperature-induced amplitude variation, consistent with the small inter-element amplitude deviation (≤±5%) reported in “Propagation characteristics of Lamb waves under variable temperature” section.
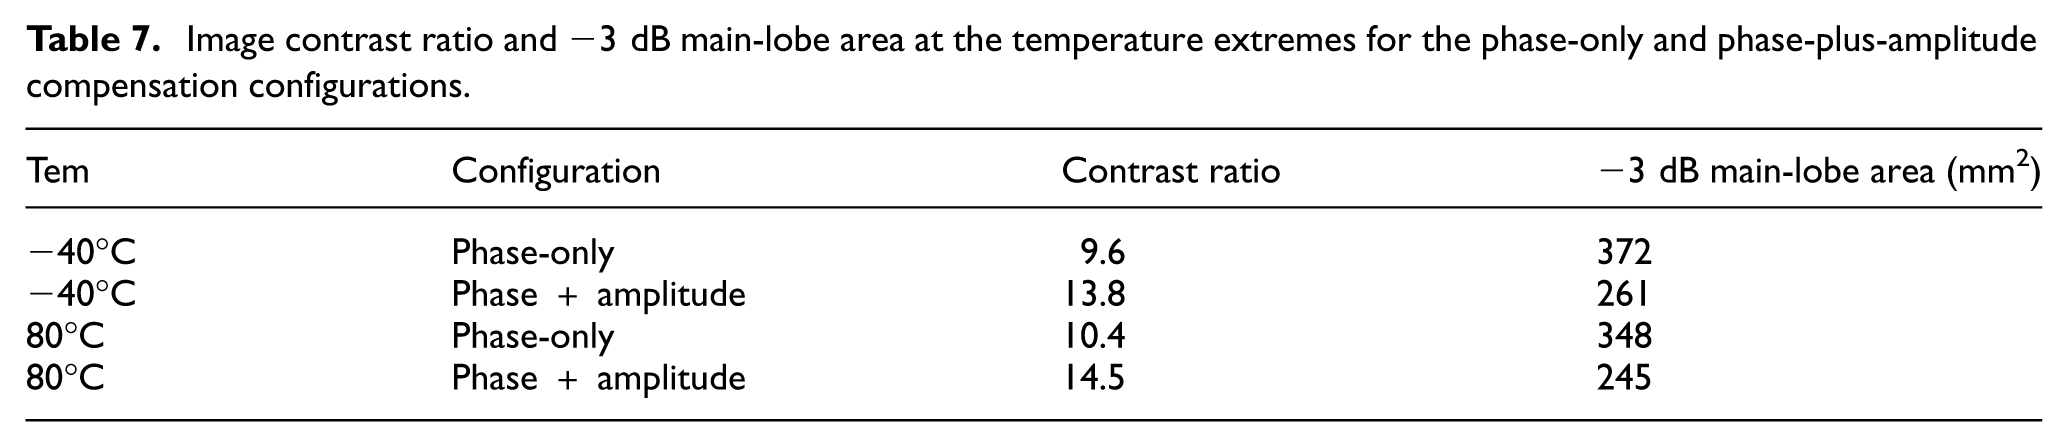
The influence of amplitude compensation on imaging quality is, however, pronounced, particularly at the temperature extremes. Table 6 reports the image contrast ratio (the ratio of the peak spectrum value to the mean background level) and the −3 dB main-lobe area at −40 and 80°C. Amplitude compensation increases the contrast ratio by 43.8% and reduces the −3 dB main-lobe area by 29.8% at −40°C, where the enhanced low-temperature attenuation would otherwise blur the damage region. A corresponding visual comparison is shown in Figure 12, where the damage boundary in the phase-plus-amplitude images is more sharply delineated than in the phase-only images. Amplitude compensation therefore contributes mainly to the beamforming-based imaging stage—preserving image contrast and boundary definition—rather than to the angular estimate (Table 7).
Localization relative errors with uncompensated and phase-only compensation under different temperatures.
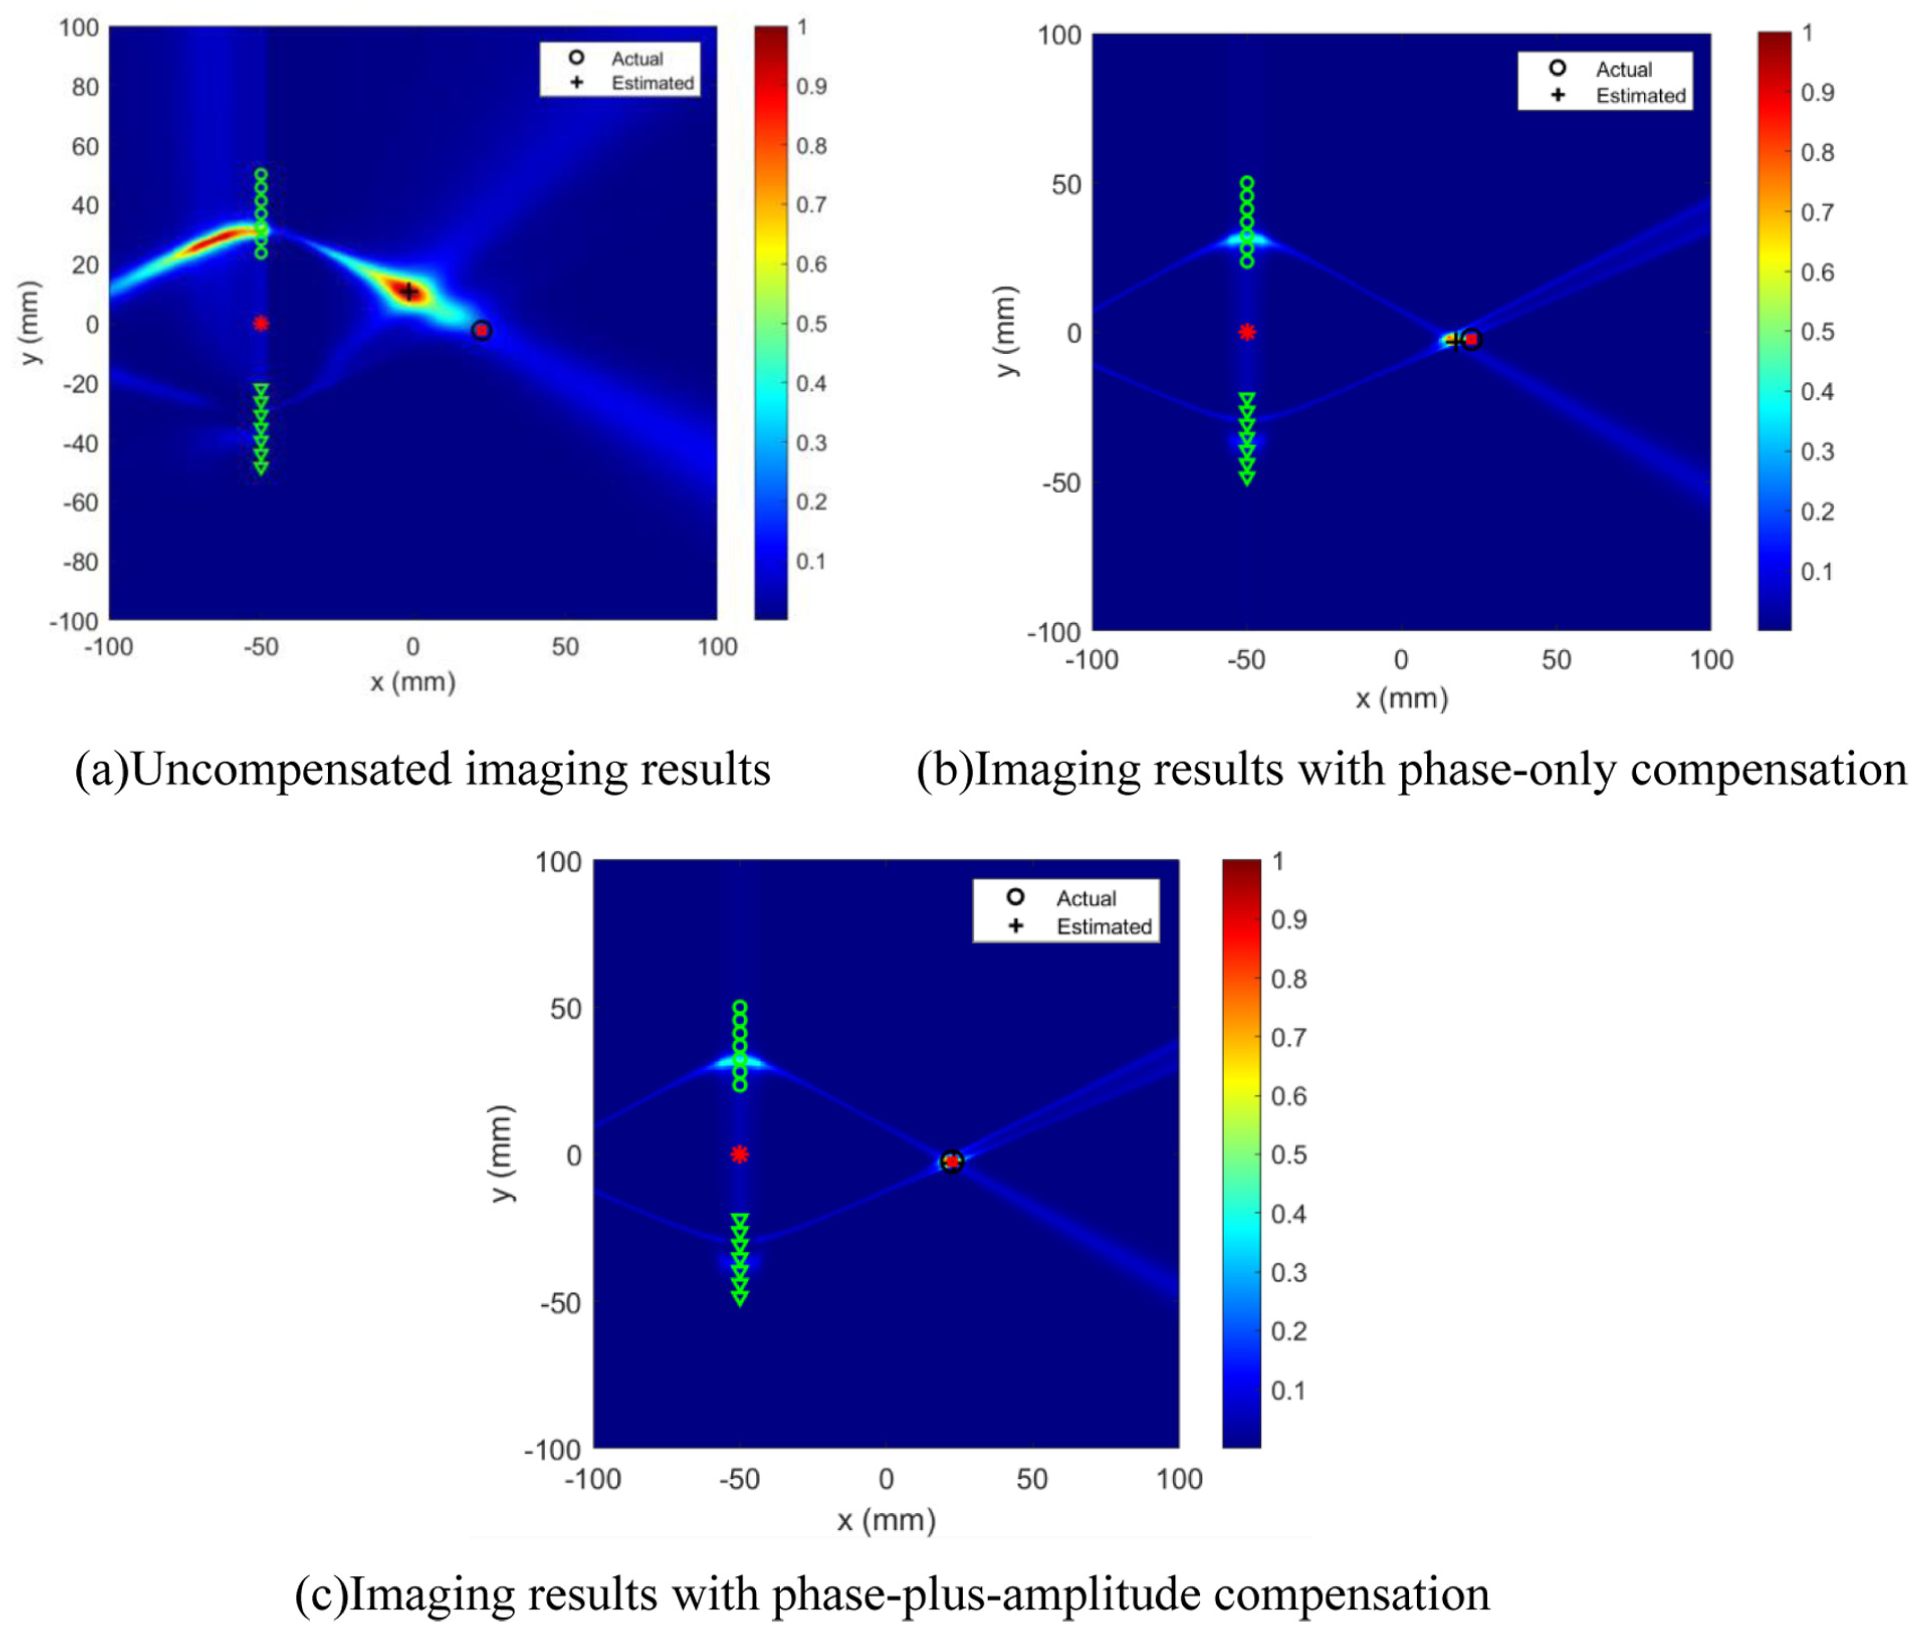
Damage imaging results at −40°C: (a) uncompensated imaging results, (b) imaging results with phase-only compensation, and (c) imaging results with phase-plus-amplitude compensation.
Image contrast ratio and −3 dB main-lobe area at the temperature extremes for the phase-only and phase-plus-amplitude compensation configurations.
Comparison with existing compensated MUSIC methods
To further assess the proposed method against prior work we re-implemented the MUSIC method of Zhang et al. 26 For a fair comparison, identical received signals, array configuration, and damage scenario were used for all methods, and the localization accuracy was evaluated using the relative error.
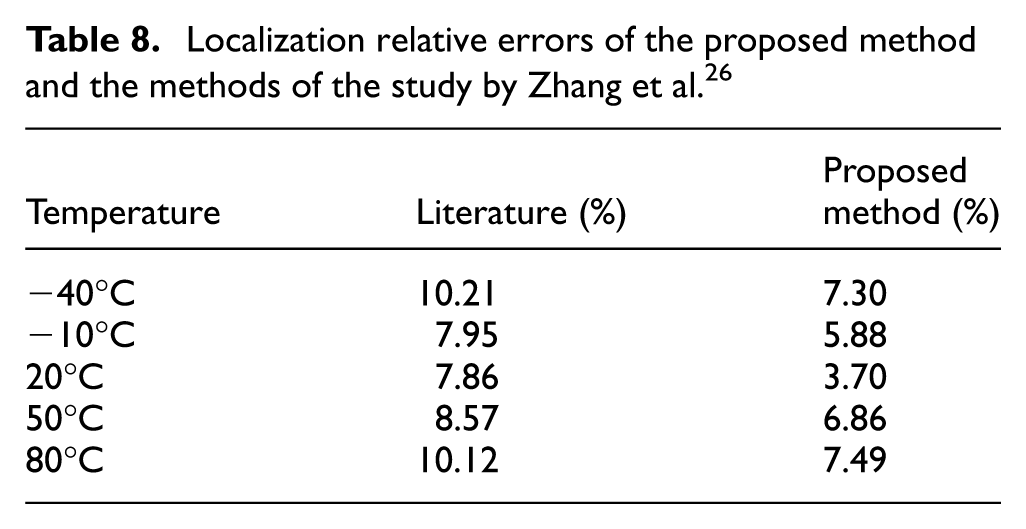
The results are compared in Table 8. The two methods achieve comparable angular accuracy, which is expected since all of them restore the inter-element phase relationship. However, the proposed method attains a lower coordinate relative error, with a mean value of 6.25% compared with 8.9% in the study by Zhang et al., 26 and maintains this advantage across the full temperature range. The improvement is attributable to the dual-array triangulation, which resolves the absolute Cartesian coordinate rather than a single bearing, and to the explicit modeling of the temperature-induced amplitude behavior, which preserves the quality of the fused image. A visual comparison of the imaging results at the temperature extremes is given in Figure 13, where the proposed MUSIC–beamforming fusion yields a more clearly defined damage boundary than the reference methods. It should be noted that the proposed method and the study by Zhang et al. 26 both rely on baseline calibration; the principal advantage of the proposed framework lies in the combined amplitude–phase modeling, the absolute-coordinate localization, and the boundary-resolved imaging, rather than in eliminating the need for baseline data.
Localization relative errors of the proposed method and the methods of the study by Zhang et al. 26
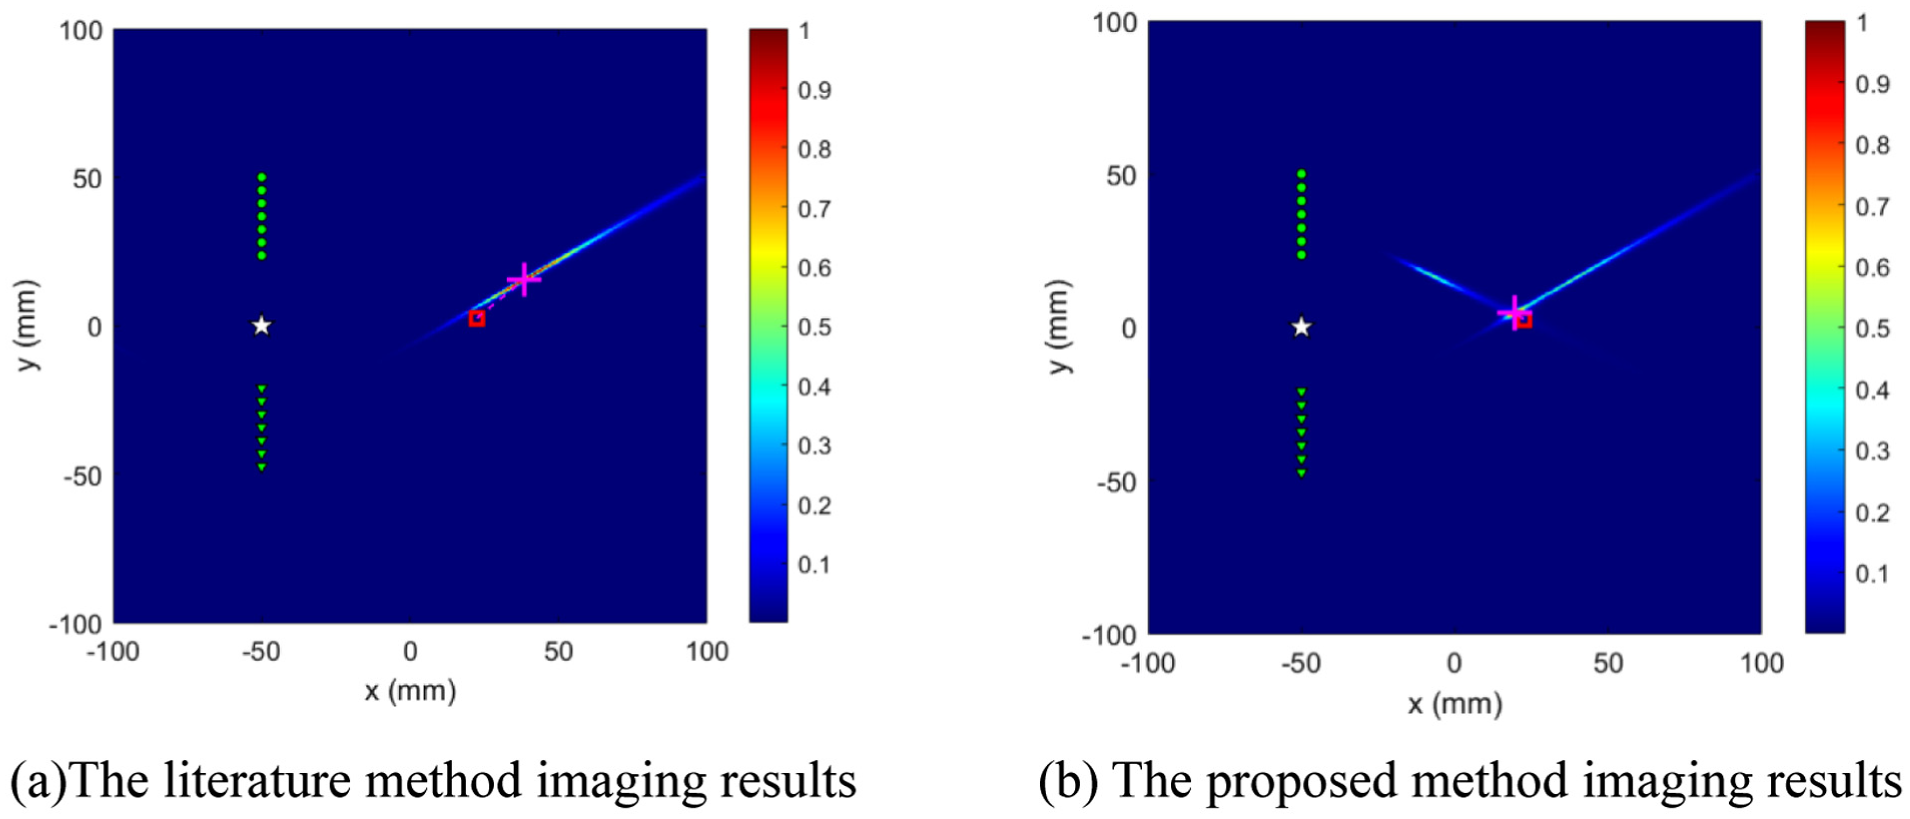
Comparison of damage imaging results with literature and the proposed method at −40°C: (a) the literature method imaging results and (b) the proposed method imaging results.
Localization performance at uncalibrated temperatures
In practical deployment scenarios, it is impractical to perform calibration at every possible operating temperature. Therefore, it is essential to evaluate the proposed method’s localization capability at temperatures where no baseline signals are directly available. To this end, additional localization experiments were conducted at six intermediate temperatures: −35, −25, 5, 25, 35, and 65°C. These temperatures were selected to fall between the calibration points (−40, −10, 20, 50, and 80°C) used in the third section.
Figure 14 presents the comparison between the measured amplitude attenuation and phase delay curves (obtained from the full dataset at 10°C intervals) and the linearly interpolated curves constructed using only the calibration points. As shown in Figure 14(a), the linear interpolation provides a close approximation to the measured amplitude attenuation across most of the temperature range, with the largest deviations occurring near the temperature extremes where the amplitude response exhibits mild nonlinearity. The phase delay comparison in Figure 14(b) demonstrates even better agreement, as the phase delay exhibits a nearly linear relationship with temperature over the entire range. The calibration points (marked by star symbols) are accurately reproduced by both curves, confirming the internal consistency of the interpolation scheme.
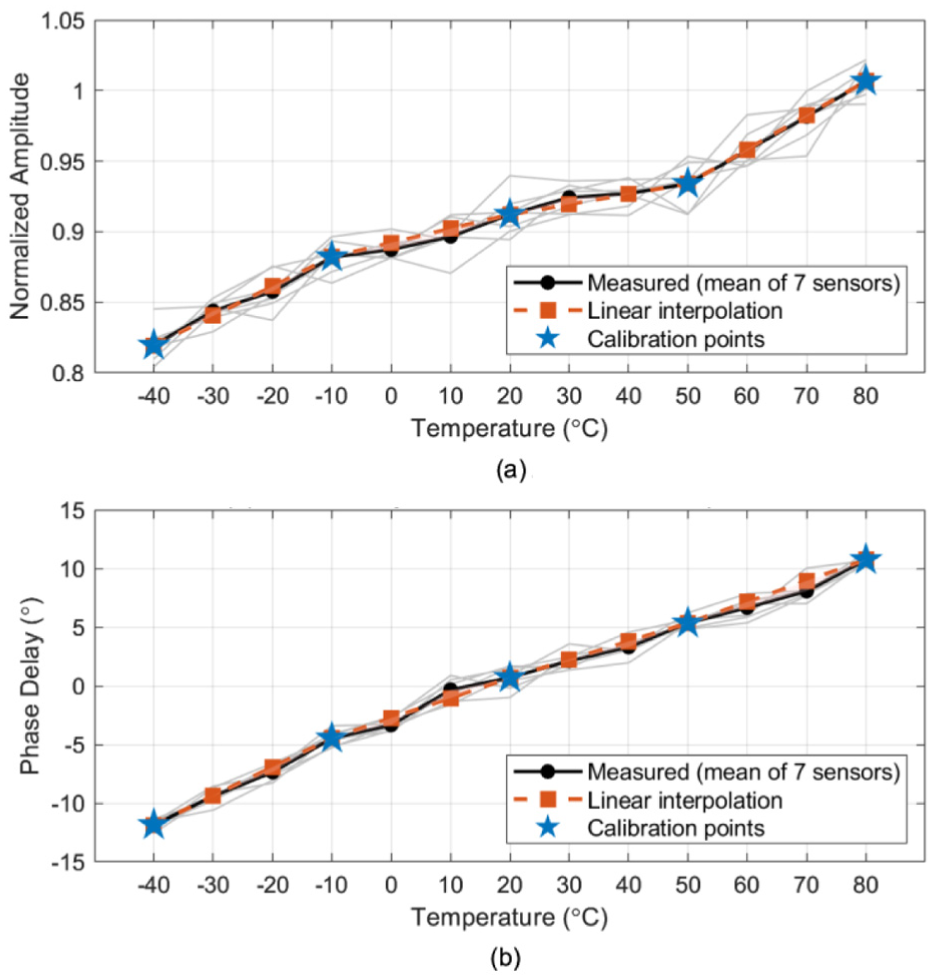
Comparison of measured and linearly interpolated temperature-dependent Lamb wave parameters: (a) amplitude attenuation: measured versus linear interpolation and (b) phase delay: measured versus linear interpolation.
The MUSIC-beamforming spatial spectrum images at four representative intermediate temperatures are shown in Figure 15. The imaging results demonstrate that the proposed method successfully identifies the damage location at all intermediate temperatures, with clearly defined spectral peaks near the true damage position. At moderate intermediate temperatures (5 and 25°C), the imaging quality is comparable to that obtained at directly calibrated temperatures, with well-focused spectral peaks and clear damage boundary delineation. At extreme intermediate temperatures (−35 and 65°C), while the spectral peaks remain identifiable, slight broadening and reduced peak sharpness are observed, consistent with the larger interpolation errors at these temperatures.
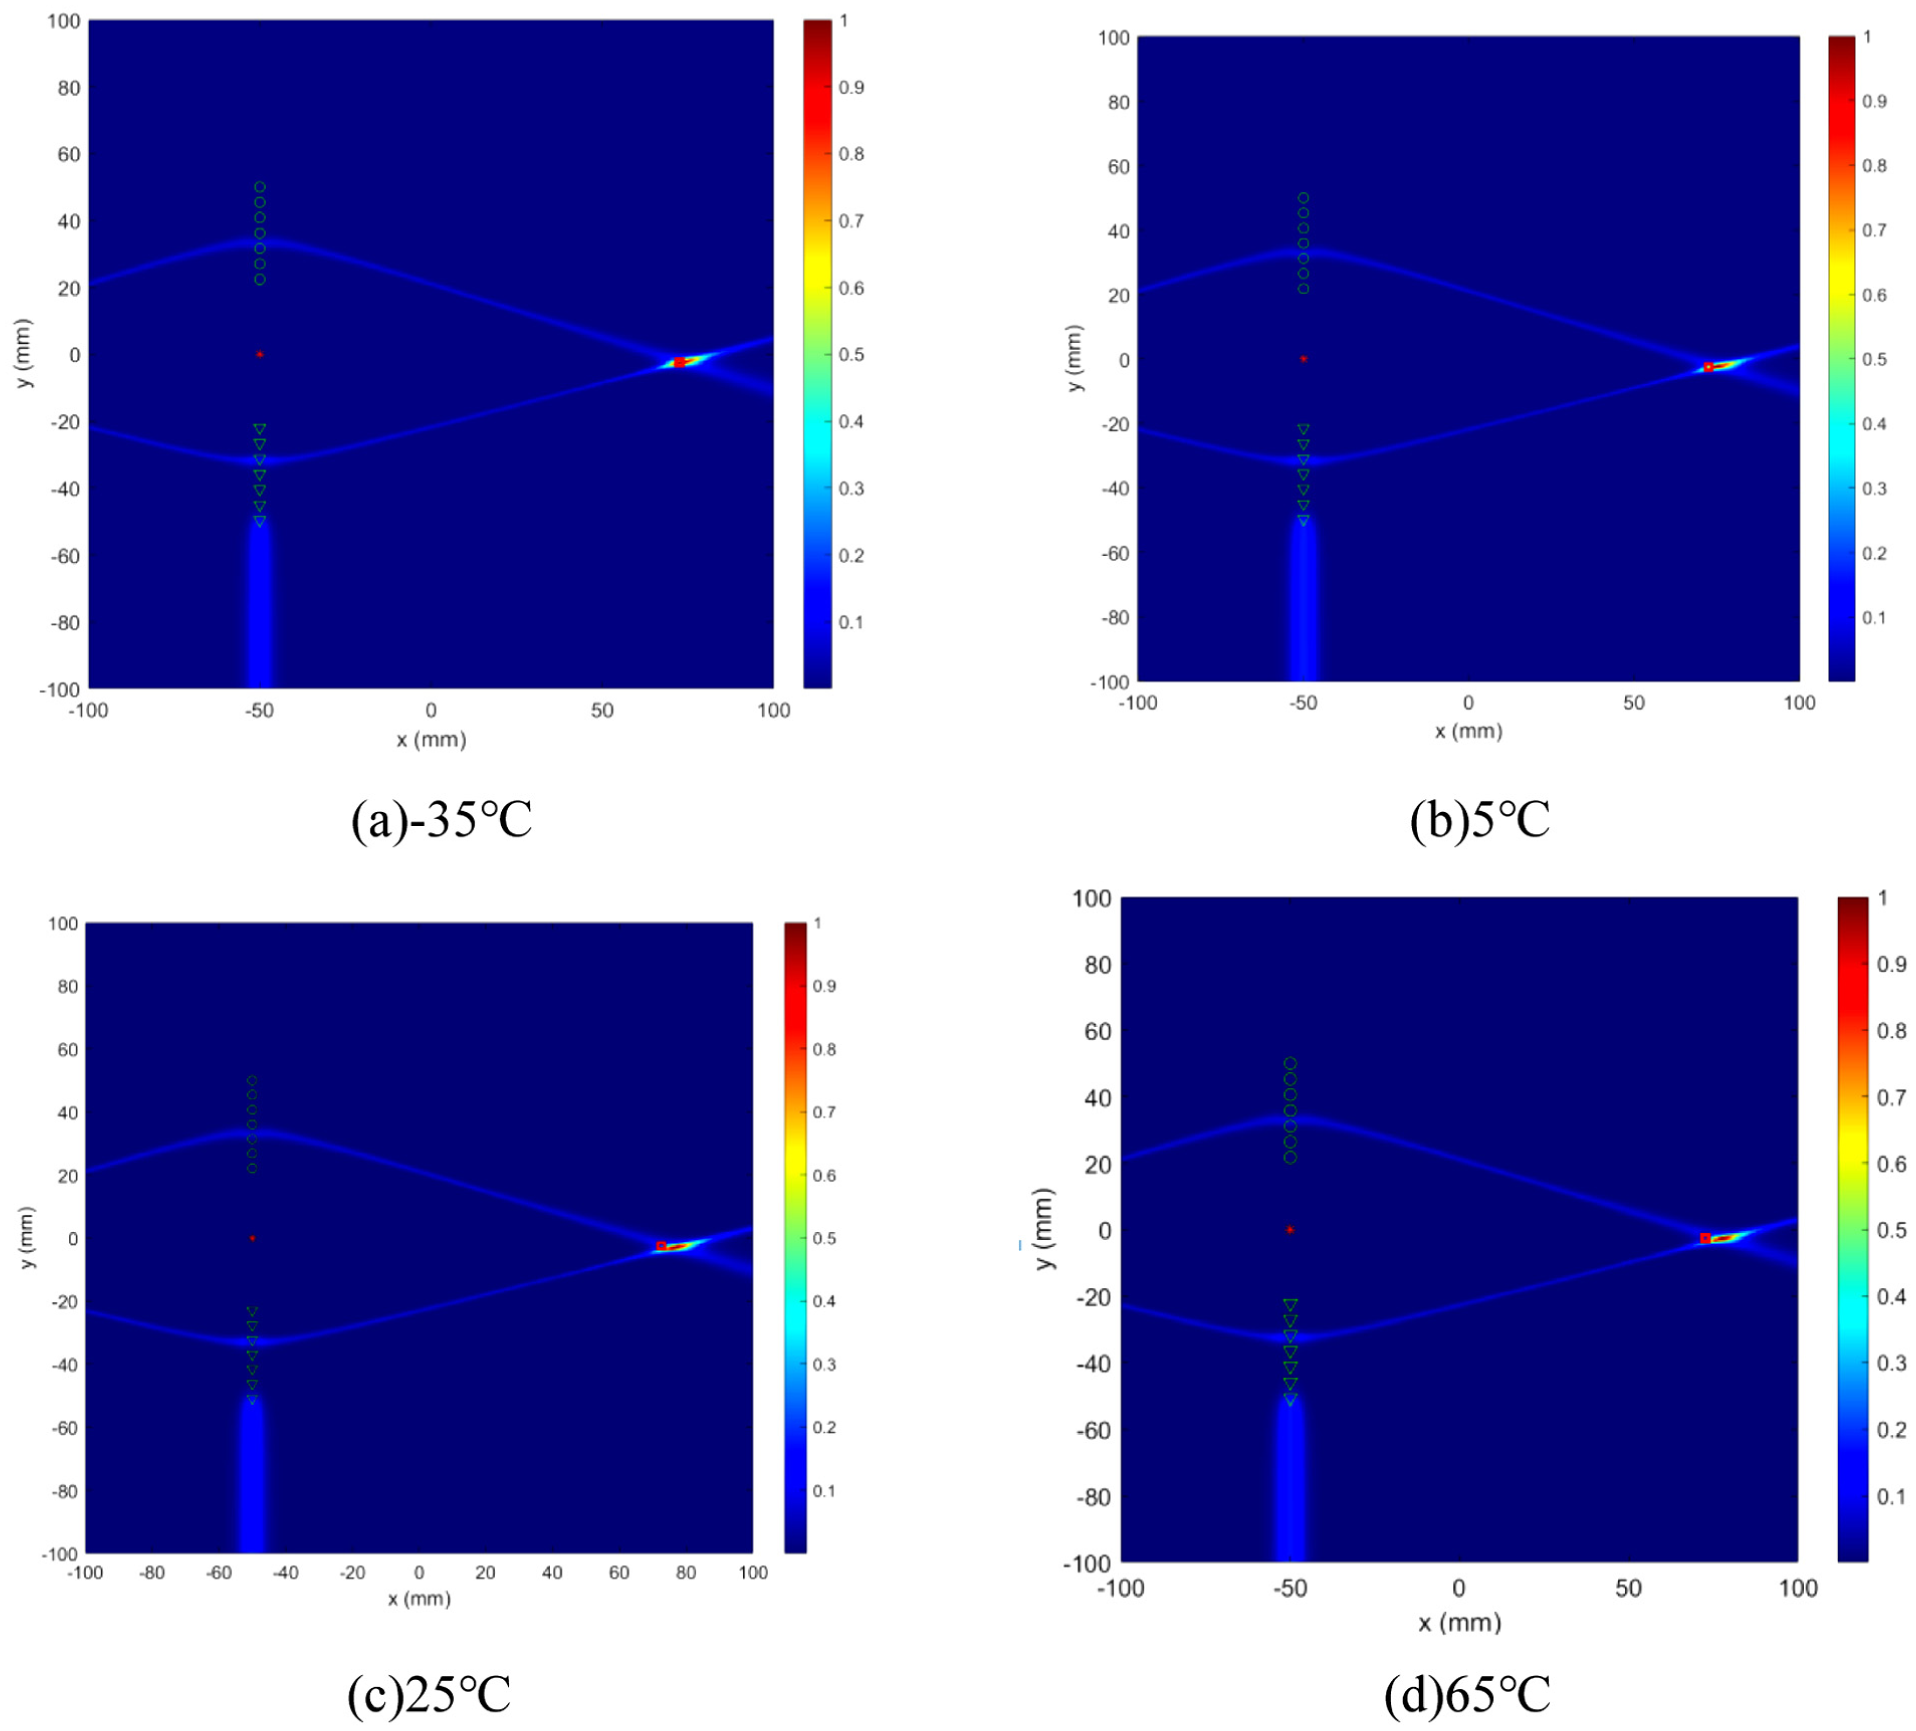
MUSIC-beamforming damage localization results at interpolated temperatures: (a) −35°C, (b) 5°C, (c) 25°C, and (d) 65°C. MUSIC: multiple signal classification.
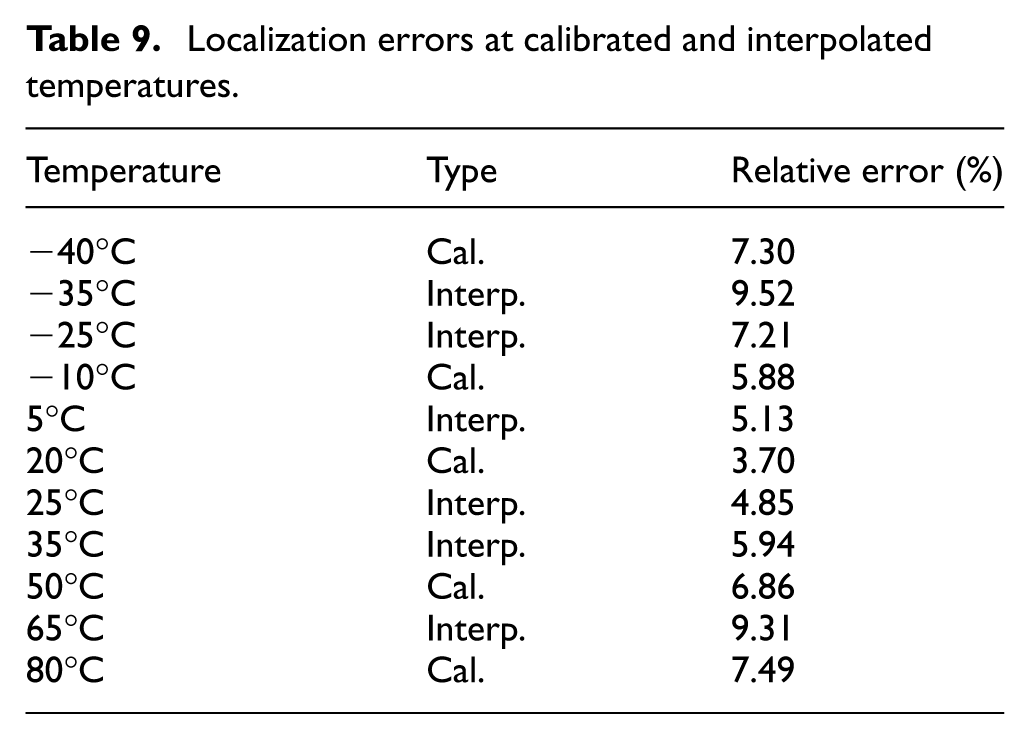
The quantitative localization results at all intermediate temperatures are summarized in Table 9. The relative positioning errors range from 4.85% (at 25°C) to 9.52% (at −35°C), with a mean error of 6.99%. For comparison, the mean error at the five directly calibrated temperatures is 6.25%. Figure 16 presents a comprehensive comparison of the localization errors across all tested temperatures, distinguishing between calibrated and interpolated conditions. The results reveal a characteristic U-shaped error distribution, where errors are minimized near room temperature and increase toward both temperature extremes. This pattern is observed for both calibrated and interpolated temperatures, indicating that the interpolation process preserves the fundamental error characteristics of the method while introducing a modest additional error.
Localization errors at calibrated and interpolated temperatures.
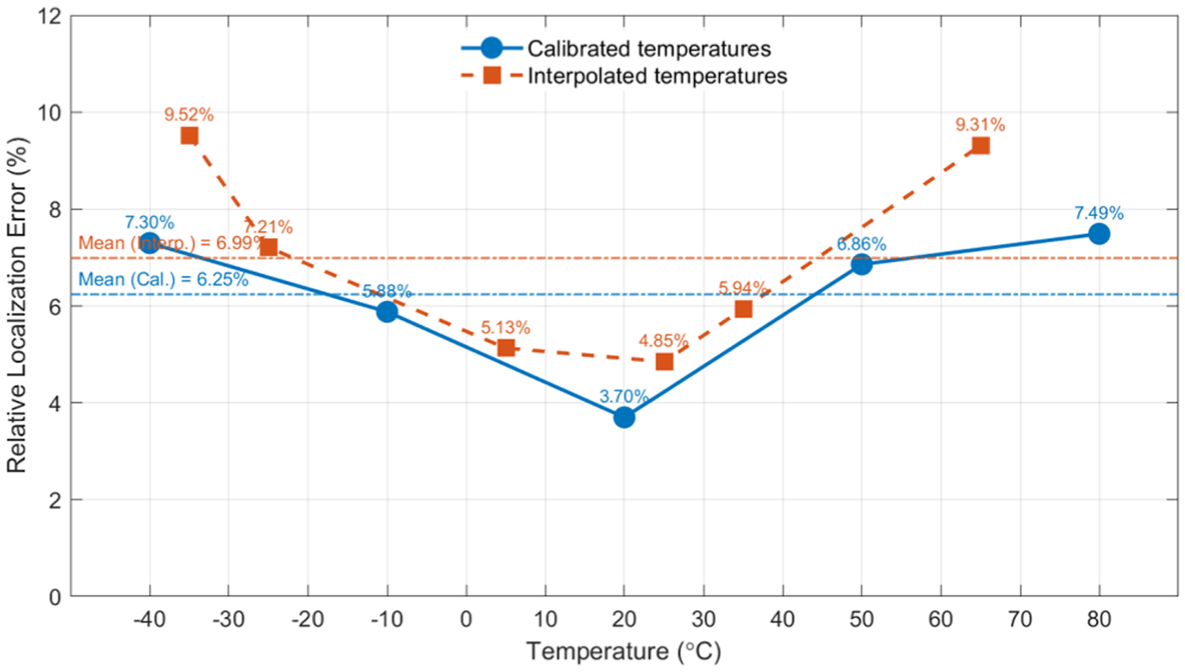
Localization error at calibrated and interpolated temperatures.
The mean error increase from calibrated to interpolated temperatures is approximately 0.74 percentage points, which is acceptable for most practical SHM applications. It is worth noting that the interpolation accuracy is closely related to the degree of nonlinearity in the temperature-dependent amplitude and phase characteristics. At temperatures near the center of the calibration range (5°C, 25°C, 35°C), where the amplitude and phase curves are approximately linear, the interpolation errors are comparable to or even lower than those at some calibrated temperatures. In contrast, at temperatures near the extremes (−35°C, 65°C), where the nonlinearity is more pronounced, the interpolation errors are noticeably higher. This observation suggests that in practical deployment, the calibration temperature intervals should be selected based on the expected nonlinearity of the temperature-dependent behavior, with denser calibration points allocated to regions of stronger nonlinearity to ensure adequate interpolation accuracy.
Conclusion
A novel methodology for Lamb wave-based damage imaging and localization under variable temperature conditions has been proposed and experimentally validated in this article. Based on the current research, several significant conclusions have been drawn:
An improved MUSIC algorithm incorporating amplitude-phase error compensation has been successfully developed to address temperature-induced signal variations. Using an offline-calibrated temperature error matrix, the algorithm estimates the damage location by cost-function optimization, with phase compensation governing angular accuracy and amplitude compensation preserving beamforming-based imaging. Experimental validation has demonstrated the algorithm’s capability to maintain consistent localization accuracy across a temperature range from −40°C to 80°C, with positioning errors remaining with relative positioning errors not exceeding 7.5%.
The synergistic integration of beamforming techniques with the MUSIC algorithm has been proven effective in enhancing spatial filtering capabilities and imaging resolution. This combined approach successfully suppresses environmental noise while preserving critical damage-related signal features, thereby significantly improving the reliability of damage detection under variable temperature conditions. The enhanced spatial resolution achieved through this methodology enables more precise damage characterization and localization.
A comprehensive experimental validation has been conducted using aluminum plate specimens under different temperature conditions. The results demonstrate the relative positioning errors consistently maintained below 7.5% across all test cases. This validation confirms the practical applicability of the proposed method in real-world SHM scenarios where temperature variations are inevitable.
While the proposed method demonstrates effectiveness on aluminum plates with artificial defects under controlled conditions, its practical applicability requires further validation. Additionally, the method relies on baseline signals from the healthy structure under various temperature conditions, which limits its application to structures without prior reference data—though this aligns well with standard commissioning procedures in many engineering applications. Future work will focus on: extending validation to different materials (e.g., composite laminates and steel) and multi-site, varying-size damage scenarios; employing broadband excitation signals to evaluate frequency-dependent performance; conducting field tests under realistic operational conditions with natural damage growth; and reducing baseline acquisition effort through integration with baseline-free techniques or physics-based predictive models for temperature-dependent signal characteristics.
Footnotes
Appendix 1
Appendix 2
Funding
The authors disclosed receipt of the following financial support for the research, authorship, and/or publication of this article: This study was financially supported by National Natural Science Foundation of China (no. 52472372) and National Natural Science Foundation of China (no. 52472372).
Declaration of conflicting interests
The authors declared no potential conflicts of interest with respect to the research, authorship, and/or publication of this article.