






Abstract
Reinforcement corrosion is a critical issue affecting structural integrity and service life of existing reinforced concrete (RC) structures. While acoustic emission (AE) monitoring provides early damage detection and localization, its application during slow natural corrosion processes and in noisy outdoor environments remains challenging. This study investigates the feasibility of periodic AE monitoring during natural chloride-induced corrosion of two pre-damaged RC beams stored outdoors. Two AE sensor types were evaluated under realistic environmental influences. A dedicated filtering approach was developed to distinguish damage-related AE signals from environmental noise. The results demonstrate that periodic AE monitoring can effectively track damage evolution and localize corrosion hotspots in both one dimensional and two dimensional. Furthermore, a previously developed methodology for estimating accelerated corrosion levels based on AE localization was successfully applied to natural corrosion, confirming its broader applicability. These findings highlight the potential of the AE technique for structural health monitoring of RC structures under field conditions.
Keywords
Introduction
Corrosion of the steel reinforcement in reinforced concrete (RC) structures is a major concern in civil engineering. It compromises structural safety 1 and reliability 2 and leads to significant economic and societal costs. 3 The increasing number of RC structures requiring repair has made this issue more visible to the public as many structures are integral to our daily lives. Current inspection techniques are mainly limited to visual inspection, hammer tapping, and core drilling. Dedicated monitoring techniques are of outmost importance for an early detection of the internal damage process. The acoustic emission (AE) technique may offer many advantages such as early detection, damage localization, and characterization. However, many research challenges still remain to fully exploit the technique for on-site application.
A successful practical application of AE monitoring in concrete structures is the detection and localization of wire breaks due to corrosion in prestressed concrete bridges.4–6 This has recently led to the formulation of guidelines describing the use of the AE technique for this application. 7 Wire breaks are very sudden, and their AE signals are characterized by high amplitudes and energies. 8 These signals can therefore be separated from noise, such as traffic. In conventional RC, reinforcement corrosion starts internally with the reduction of the cross-section of the reinforcement steel and the formation of rust products, eventually leading to concrete cracking. It can take years before any signs are visible on the surface. Monitoring early during the corrosion process and the first stages of concrete cracking is particularly challenging as this phase is characterized by lower energy events, which are more difficult to distinguish from noise sources.
Monitoring of the corrosion process itself and related concrete cracking has been extensively studied in a laboratory environment. A detailed literature review can be found in the study by Verstrynge et al. 9 It is proven that the AE technique is able to detect and localize corrosion hotspots.10–13 Moreover, lower frequency signals are observed once concrete macro-cracking has initiated.14,15 In most studies, the corrosion process is accelerated by application of a direct current in order to obtain results within a limited time span. In this case, corrosion products rapidly expand and cracking occurs sooner and faster than in natural circumstances, which could influence the AE result in terms of emitted AE energy. So far, only limited research has been performed on the monitoring of more naturally deteriorating RC structures due to corrosion, for example by the use of dry-wet cycles.16–18 Therefore, it is not yet fully investigated whether the AE technique allows to capture natural (slow) degradation processes in RC structures.
Besides natural degradation processes occurring in real RC structures, existing structures are subjected to noisy environments. This noise may consist of electric noise or originate from external sources other than the damage under investigation. Typical examples of the latter are wear, traffic, wind and rain, which are not occurring in controlled lab conditions. Although an interest in case studies can be noticed,5,19–21 the influence of noise on AE data remains an important challenge, and dedicated data processing steps should be adopted. Only limited research has been performed to study the effect of environmental conditions on AE measurements. Lyons et al. 22 related AE and corrosion rate measurements during daily and seasonal temperature changes. During daily temperature changes, an increase in the galvanic current was found with increasing temperature, albeit with a small time lag due to thermal inertia. AE measurements showed a similar trend as the temperature variations, that is, an increase with increasing temperature and vice versa. Based on control specimens in which almost no emissions were detected, it was concluded that the observed AE data resulted from corrosion rather than other mechanisms such as expansion and shrinkage of concrete or water evaporation in the pores. It was found that the seasonal fluctuations had an insignificant effect on the magnitude of AE.
In most experimental programs, AE monitoring is applied continuously. Continuous monitoring of a structure provides the most insight into its behavior, both for newly build structures and for monitoring the damage progress in existing structures. However, it is not always possible to incorporate such a system due to economical restraints and time considerations. The installation, operation, and maintenance of a continuous structural health monitoring system are costly, and it produces large amounts of data that need to be processed and analyzed. As such, it should be investigated whether discontinuous or periodic monitoring serves as a valuable alternative for continuous monitoring without loss of valuable information. A recent study has shown the potential of periodic monitoring for assessment of the corrosion level (CL) based on a short-term monitoring period during accelerated corrosion. 23 An important next step is to verify this with periodic monitoring of slow, natural corrosion processes.
This paper investigates the periodic application of the AE technique during natural corrosion in RC beams, stored in an outdoor environment. Based on the observations from the literature, following main novelties are addressed within this paper: (1) the application of periodic AE monitoring rather than continuous AE monitoring, (2) the assessment of slow chloride-induced corrosion in RC instead of accelerated corrosion using a direct current, and (3) the consideration of environmental influences such as rain, wind, and solar exposure. The paper first describes the experimental setup. Second, the progressive and resulting damage level of the beams is assessed by means of crack width and rebar mass loss measurements, in order to verify the AE results. Third, results from periodic AE monitoring with two AE sensor types are presented. Fourth, CLs are assessed based on selective crack measurements and one-dimensional (1D) AE localization results. Finally, conclusions and remarks are summarized in view of on-site applications.
Experimental approach
Materials and specimen preparation
Two beams, having dimensions 150 × 200 × 2000 mm, were monitored periodically over a period of 2 years. Both beams were reinforced with two rebars having a diameter of 12 mm in the tensile zone and two rebars having a diameter of 10 mm in the compression zone. As shear reinforcement, 17 stirrups with a diameter of 6 mm were used, spaced at 100 mm near the ends and 125 mm in the central region of the beam. The reinforcement scheme is shown in Figure 1. The concrete composition consisted of 350 kg/m3 of CEM I 52.5 N cement, 620 kg/m3 of sand (0/4), 1270 kg/m3 of gravel (4/14), 164 kg/m3 of water (W/C 0.47), and 1.4 kg/m3 of salt (NaCl). The latter corresponds to 0.4% by weight of cement, which is in line with the maximum allowed chloride content according to EN 206. 24 After casting, the beams were placed in a curing chamber with a constant temperature of 20 ± 1°C and relative humidity (RH) of 95 ± 3% for 28 days. The mean cube compressive strength at 28 days was 63.06 MPa (±1.54 MPa) based on tests performed on three cubes according to EN 12390-3. 25
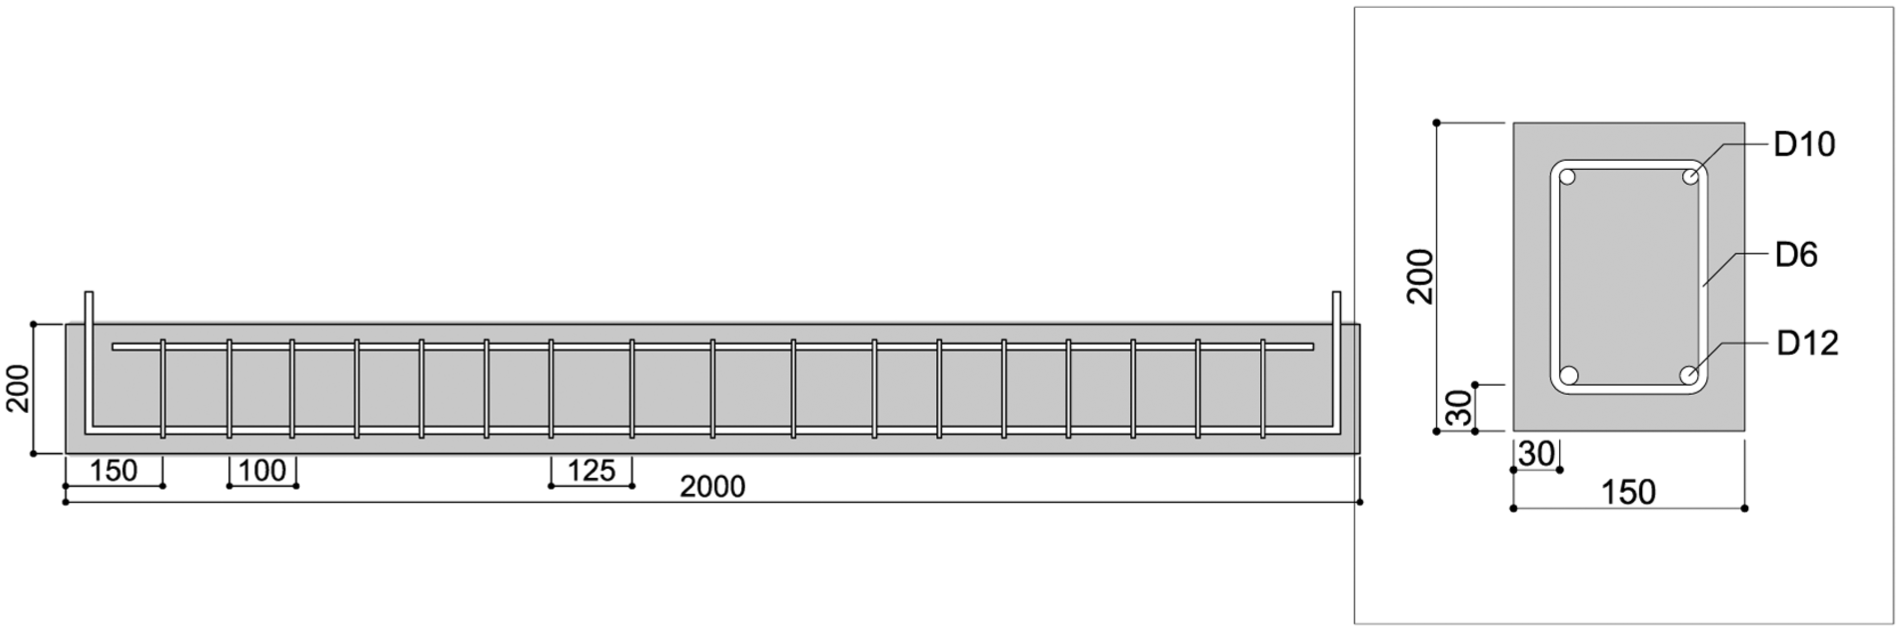
Longitudinal (left) and cross (right) section of the beams.
Accelerated and natural corrosion process
As the main focus is the application of the AE technique for existing RC structures, the beams were first subjected to an accelerated corrosion process to shorten the initiation period of rebar corrosion and reach a predefined damage level. The aim was to obtain two different damage levels, namely one cracked beam and one uncracked beam, in order to compare their damage progress under natural corrosion conditions and corresponding AE activity. At an age of 28 days, the beams were placed in an accelerated corrosion setup. The beams were positioned upside down, with the tensile zone facing upward. A wooden tank containing a 3.5% sodium chloride solution was placed on the top surface. The tensile rebars were connected to a power supply and acted as the anode. A stainless-steel plate was positioned in the sodium chloride solution and acted as the cathode. On the first beam, denoted as B1-LC (Beam 1-Low Corrosion), a current density of 50 μA/cm2 was applied. On the second beam, denoted as B2-HC (Beam 2-High Corrosion), a current density of 100 μA/cm2 was used. Since the time to the onset of concrete cover cracking could not be predicted beforehand, terminating the corrosion process based on duration while applying the same current density was not feasible. To address this, both beams were subjected to accelerated corrosion for the same duration while applying different current densities. This approach allowed the corrosion process to be terminated once longitudinal surface cracking was observed in beam B2-HC. At that moment, it was ensured that beam B1-LC had experienced corrosion, but had not cracked yet. This resulted in a total accelerated corrosion duration of three weeks, reaching target CLs of 1% for beam B1-LC and 2% for beam B2-HC as calculated afterwards using Faraday’s law. A schematic representation of the accelerated corrosion setup is shown in Figure 2.
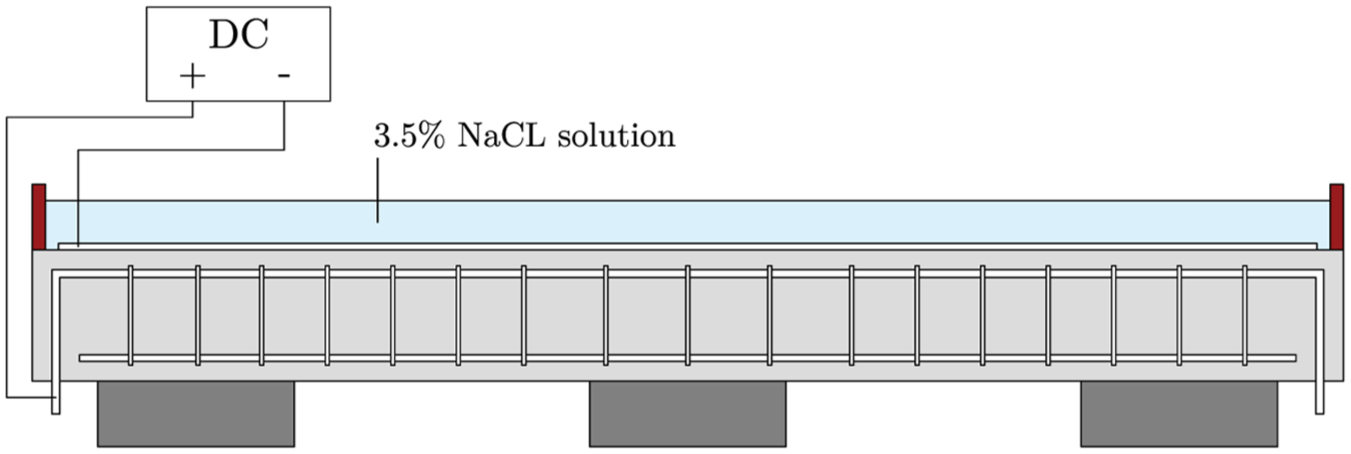
Schematic representation of the accelerated corrosion setup.
After the accelerated corrosion process, both beams were stored in a climatized room (20 ± 1°C and 60 ± 5% RH) for 3 months in order for the corrosion process to decrease to a very slow rate. After this period, a baseline crack width and AE measurement were performed. Indeed, limited AE activity was observed during this baseline measurement, indicating that the corrosion process had slowed down. Subsequently, the beams were placed outdoors with the tensile reinforcement, and thus the corroded zone, facing upward, maintaining the same orientation as shown in Figure 2. The orientation was chosen for practical considerations as it allowed easy access for AE sensor installation and visual inspections. Maintaining the same orientation throughout the entire test program avoided the need to repeatedly flip the beams. The beams were exposed to variations of ambient temperature and RH, but were protected from direct rainfall by a cover sheet, while remaining fully exposed to wind. Although the beams were flipped and were not exposed to direct rainfall, this can be considered as a realistic environment as real RC structures are exposed to a wide range of environmental conditions, including partially sheltered configurations. The focus of the study was not to reproduce a specific exposure class, but to investigate differences in AE activity related to corrosion-induced damage in an outdoor environment. A picture of the setup is shown in Figure 3. The top surface of each beam was sprayed weekly with a 3.5% sodium chloride solution to induce natural corrosion. During each spraying session, the beams were sprayed three times along their full length with a waiting period of 10 min in between. The total duration of the natural corrosion process was 575 days.
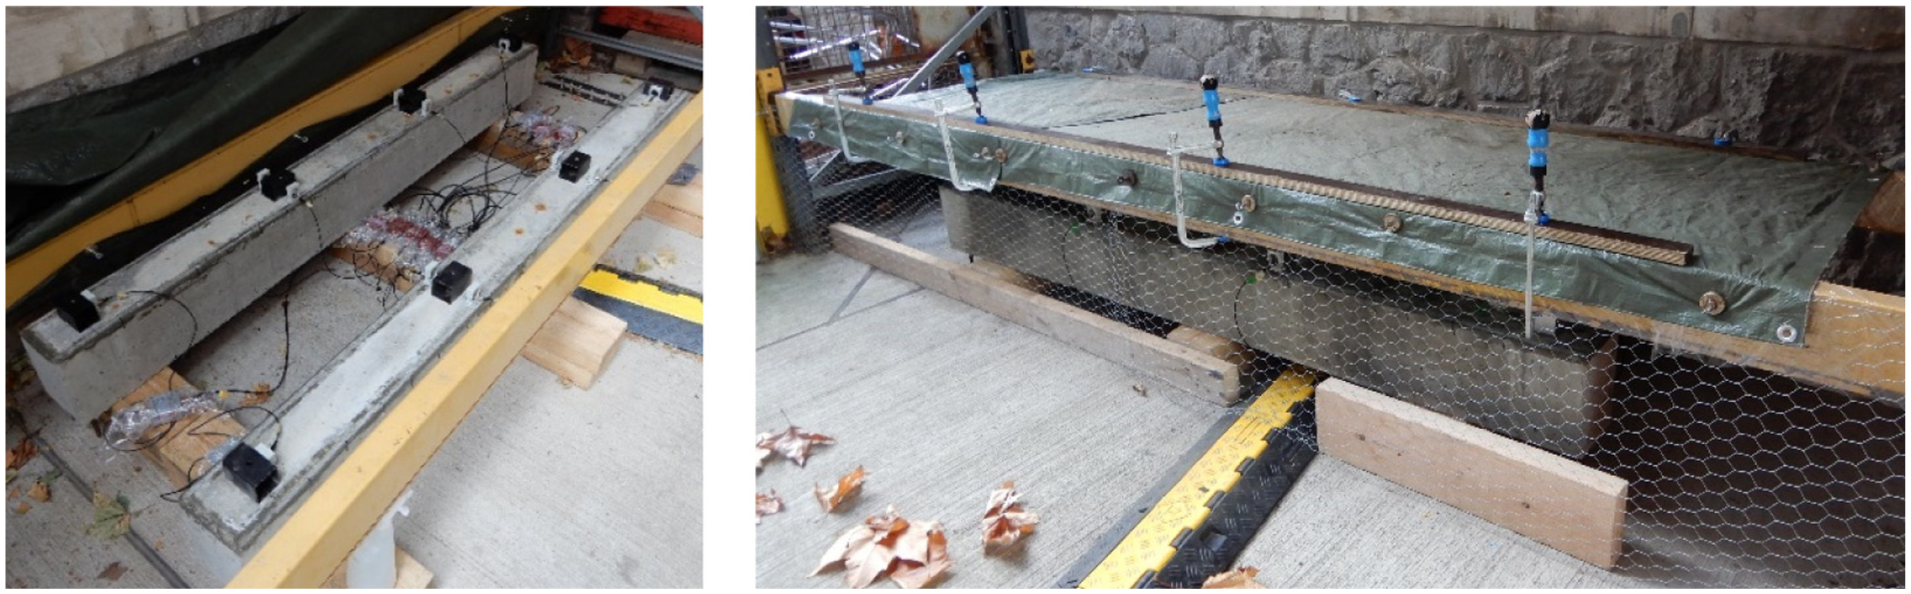
Picture of the beams placed outside. The beams were sheltered from rain by a sheet.
AE sensing
Two AE sensor types and layouts were sequentially applied on the beams. The first layout was a two-dimensional (2D) setup using 100–400 kHz flat response sensors (type AE104A; Fuji Ceramics, Fujinomiya City, Shizuoka, Japan). These sensors were used by the authors in previous work on accelerated corrosion on similar beam configurations.14,26 Six sensors were attached on each beam using vacuum grease. The second layout was a 1D setup using four 75 kHz resonance sensors (type VS75-V; Vallen Systeme, Wolfratshausen, Germany) on each beam. This sensor type is more suitable for field applications due to its sensitivity at lower frequencies. 27 In both layouts, all sensors were attached on the top surface. Due to practical constraints and the need to maintain comparable sensor positions with the 1D layout, the sensor distribution for the 2D setup was non-uniform along the beam length, resulting in denser coverage in the central region than near the beam ends.
The coordinates of the sensors are listed in Table 1. Figure 4 shows a visual representation of the top surface of the beams with indication of the sensor positions. In this paper, where AE source locations are compared between sensor setups, only X-axis coordinates are considered for layout 1 to transfer it from a 2D to a 1D setup.
Coordinates of the AE sensors placed on the beams.
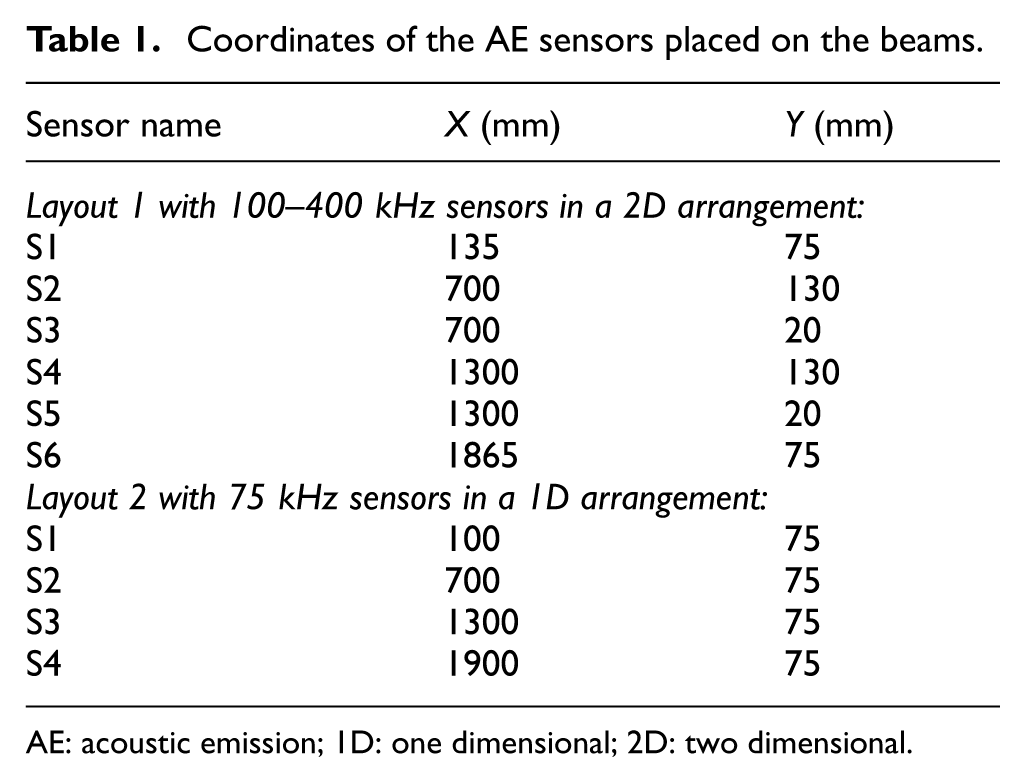
AE: acoustic emission; 1D: one dimensional; 2D: two dimensional.

Top view of the beams with indication of the AE sensor positions of both sensor layouts and the position of the internal reinforcement. AE: acoustic emission.
The sensors were all connected to a preamplifier (AEP5, Vallen Systeme) with a 34-dB gain. The amplifiers were connected via coax cables, which were placed in cable ducts, to a Vallen AMSY-6 data acquisition system and laptop. The AE system and laptop were stored indoors.
A fixed amplitude threshold of 34 dB was applied. Before the measurements, AE acquisition was carried out using a low threshold to monitor background noise levels under the actual outdoor conditions. Based on these observations, the final threshold was set approximately 5 dB above the maximum noise level. For acquisition of AE hits, the pre-trigger recording time, duration discrimination time, and rearm time were set to 400, 500, and 5000 μs, respectively. The sampling rate was 5 MHz, and the length of the stored AE signals was 1638.4 μs. The digital frequency filter was set to 50–500 kHz for the 100–400 kHz sensors and 25–300 kHz for the 75 kHz sensors. The selected acquisition parameters were kept constant throughout the monitoring periods for consistency and comparability of the AE data.
Before the beams were placed outside, an AE baseline measurement was performed under controlled laboratory conditions (20 ± 1°C and 60 ± 5% RH). The beams were consecutively monitored using sensor layout 1 and sensor layout 2. For layout 1, the baseline measurement lasted 6 days. For layout 2, the duration was 5 days.
Afterwards, the beams were monitored periodically in the outdoor setup. Sensor layout 1 was applied for 7 days. This was followed by 3 days of monitoring with layout 2. A schematic overview of the periodic monitoring scheme and applied sensor layouts is shown in Figure 5. Between each monitoring period, the sensors and cables were removed. Both sensor types were mounted in custom-made holders that remained in place to ensure consistent sensor positioning and contact conditions during each monitoring period. In addition, coupling quality was verified at each monitoring period using ultrasonic pulsing and pencil lead break (PLB) tests. The latter is described in ASTM E976-15. 28 These checks confirmed that the signal transmission characteristics remained consistent and that the coupling conditions were adequate and comparable over time.
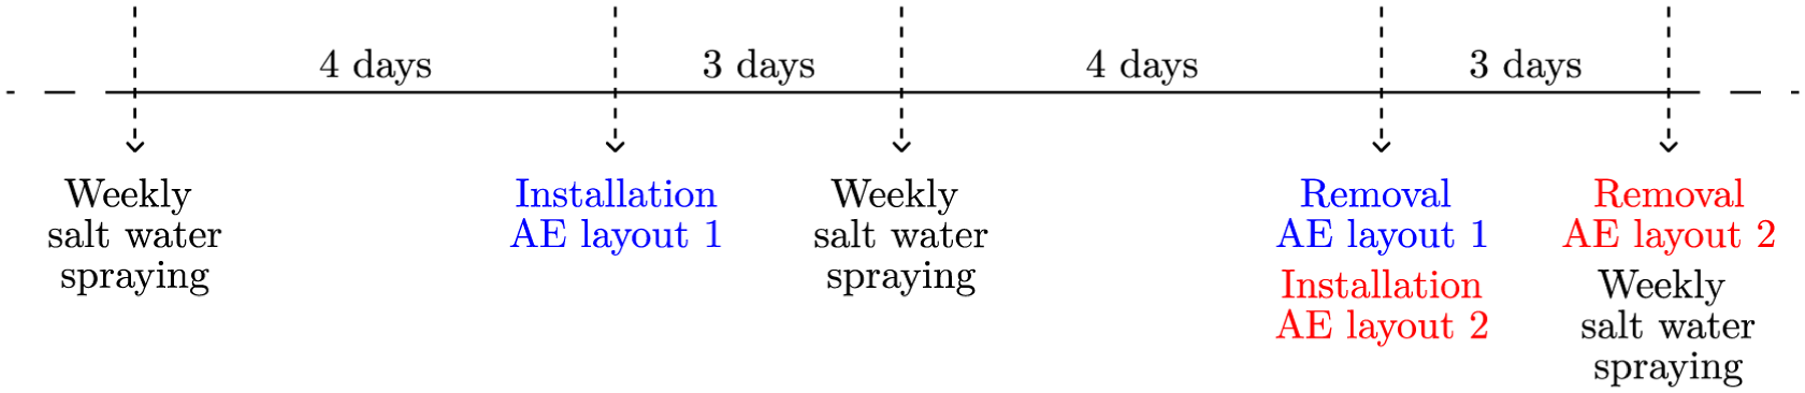
Schematic representation of periodic monitoring.
During the first 6 months, representing the early phase of the experiment, the beams were therefore monitored every 5–6 weeks. In later stages, the intervals between monitoring periods were increased in order to investigate whether damage progression could still be reliably followed using less frequent measurements.
Three-point bending test
After 500 days of natural corrosion exposure, the beams were subjected to an eccentric three-point bending test to initiate additional cracks due to mechanical loading. This timing allowed the beams to develop corrosion-induced damage under natural exposure before any mechanical intervention. The introduction of additional cracks reflects realistic scenarios in RC structures, where mechanical actions (e.g. high external loads) may occur after corrosion has already initiated. The aim of this test was to assess how the AE response evolves with changes in the mechanical damage level and to provide potential corrosion hot spot locations by means of transversal cracking.
Figure 6 shows the setup of the three-point bending test. A displacement-controlled test was performed at a speed of 0.1 mm/min and was stopped once a crack width of approximately 0.5 mm was observed below the loading point. New cracks mainly formed in the central region of the beam span, near the stirrup locations. Afterwards, the beams were placed back outside to continue the natural corrosion process and periodic AE monitoring. It should be noted that the cracks induced by bending partially closed when repositioning the beams outdoors, retaining a maximum value of 0.05 mm. The crack width of one of the longitudinal cracks in beam B2-HC increased locally, near the loading point, from 0.20 to 0.35 mm, and some minor spalling was observed.
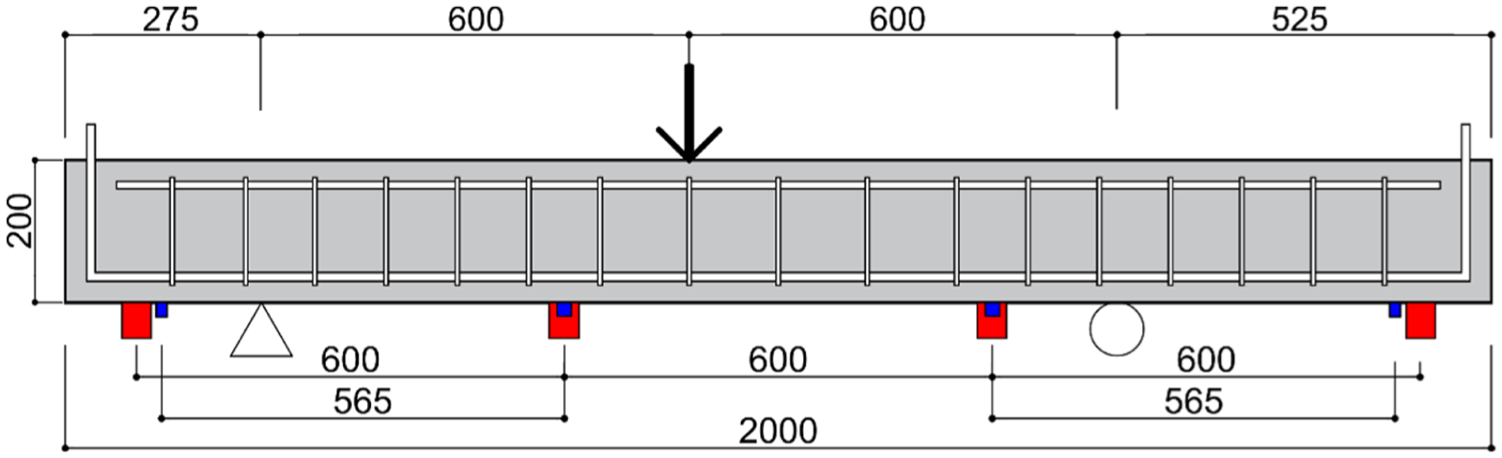
Side view of the beam subjected to eccentric three-point bending.
Visual inspection and definition of damage parameters
To evaluate the damage level, a visual inspection and crack width measurements were performed before each AE monitoring period. At the end of the test program, the longitudinal rebars were extracted from the beams to obtain the resulting CL. In this section, the results from these observations are presented. This will be used in later sections to analyze and validate the AE results.
Reinforcement corrosion leads to concrete cover cracking and rebar mass loss. To obtain a single representative value for comparison purposes, an equivalent crack width and equivalent CL are defined, following the approach proposed by Martens et al. 29
Crack width measurements were carried out using a crack ruler having an accuracy of 0.05 mm, as commonly applied in field inspections of RC structures. Along each longitudinal rebar, measurements were taken every 5 cm within the AE monitoring zone, resulting in 33 data points per longitudinal rebar. Additionally, one measurement was performed at each stirrup location. A schematic representation of the position of the crack width measurements as well as a picture of the used crack ruler are shown in Figures 7 and 8, respectively.
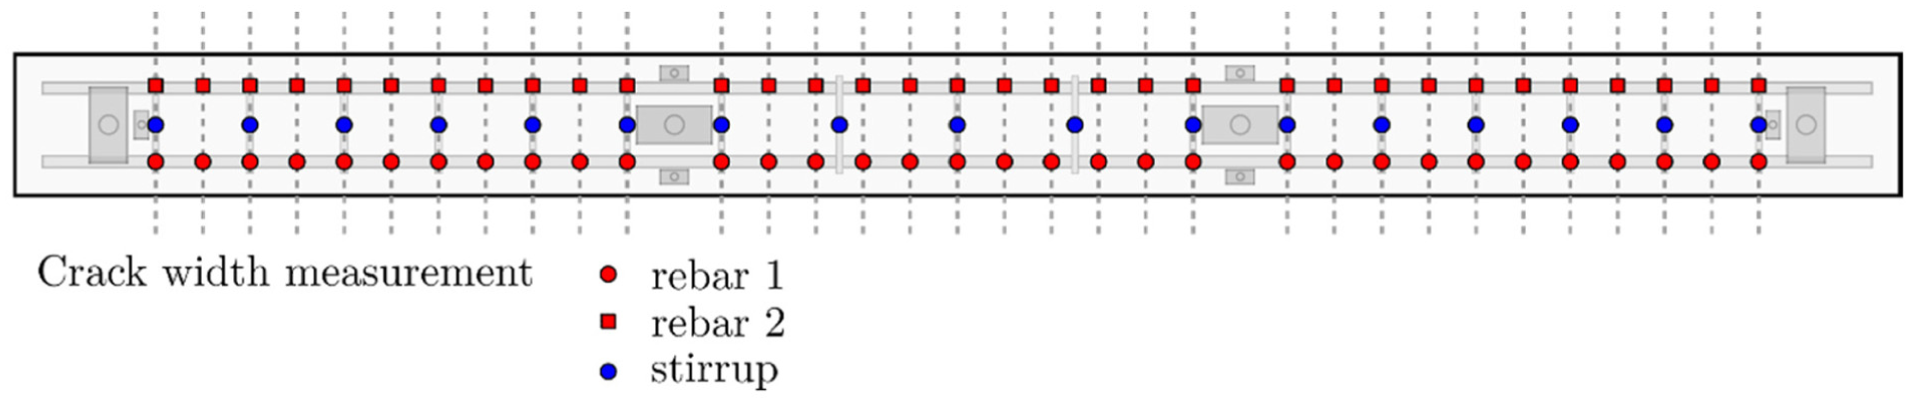
Schematic representation of the locations of the crack width measurements.
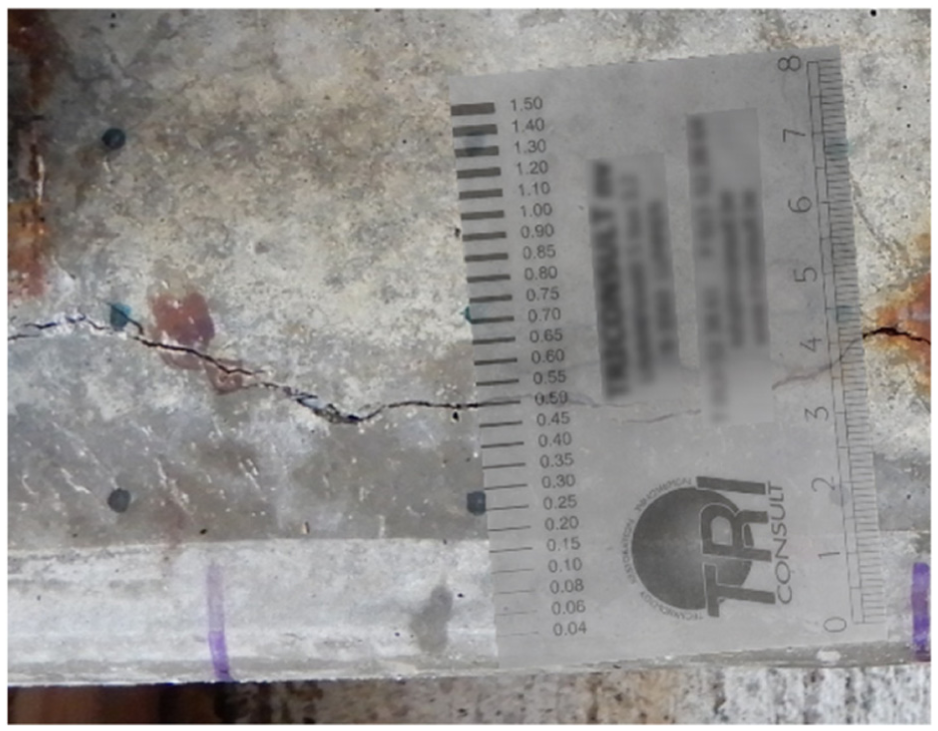
Close-up of a crack width measurement.
An equivalent crack width is defined in Equation (1). This equivalent crack width can be calculated for specific parts or sub-elements of the beams or for the entire beam. This definition was obtained from Martens et al. 29 and was adapted to include crack measurements at the position of the stirrups. In this way, it can serve as an indicator of the corrosion-induced damage state of a specific zone or the entire beam. First, the average crack width along each longitudinal crack is calculated. Then, the arithmetic mean of the average crack widths of the individual cracks is taken. Next, the sum of the crack width measurements of the stirrups is divided by the number of stirrups.

with w l,j a crack width measurement along a longitudinal rebar in mm, n l the number of discrete crack width measurements for each longitudinal rebar, N l the number of longitudinal rebars, w s,j a crack width measurement of a stirrup in mm, and n s the number of discrete crack width measurements for the stirrups, which is equal to the number of stirrups.
The evolution of the total equivalent crack width, that is, calculated for the entire beam, over time is presented in Figure 9 for both beams. Figure 10 shows the crack patterns of both beams before and after natural corrosion, that is, before and after periodic AE monitoring. For beam B1-LC, only a few hairline cracks (<0.05 mm) were present after accelerated corrosion. These cracks extended over time, but their width remained small. Numerous rust spots were observed, indicating ongoing corrosion activity, with one being very extended in the middle region of the beam. During the three-point bending test, new cracks were mainly initiated near the stirrups in the middle region of the beam. For beam B2-HC, most cracks were already formed during accelerated corrosion, having small initial crack widths around 0.05 mm. Over time, especially the crack width at the location of longitudinal rebar 1 significantly increased, reaching values up to 0.70 mm. The number of rust spots also increased.
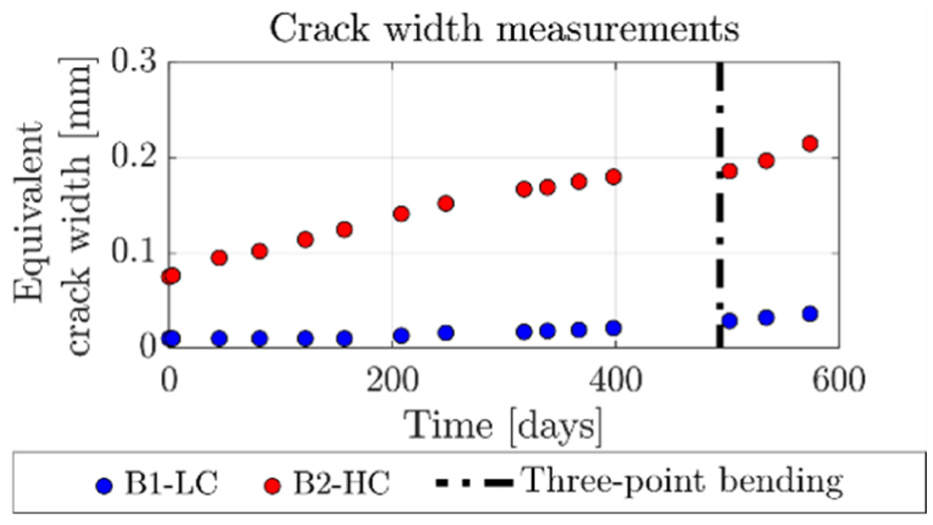
Evolution of the total equivalent crack width of beams B1-LC and B2-HC over time with indication of the three-point bending test. B1-LC: Beam 1-Low Corrosion; B2-HC: Beam 2-High Corrosion.
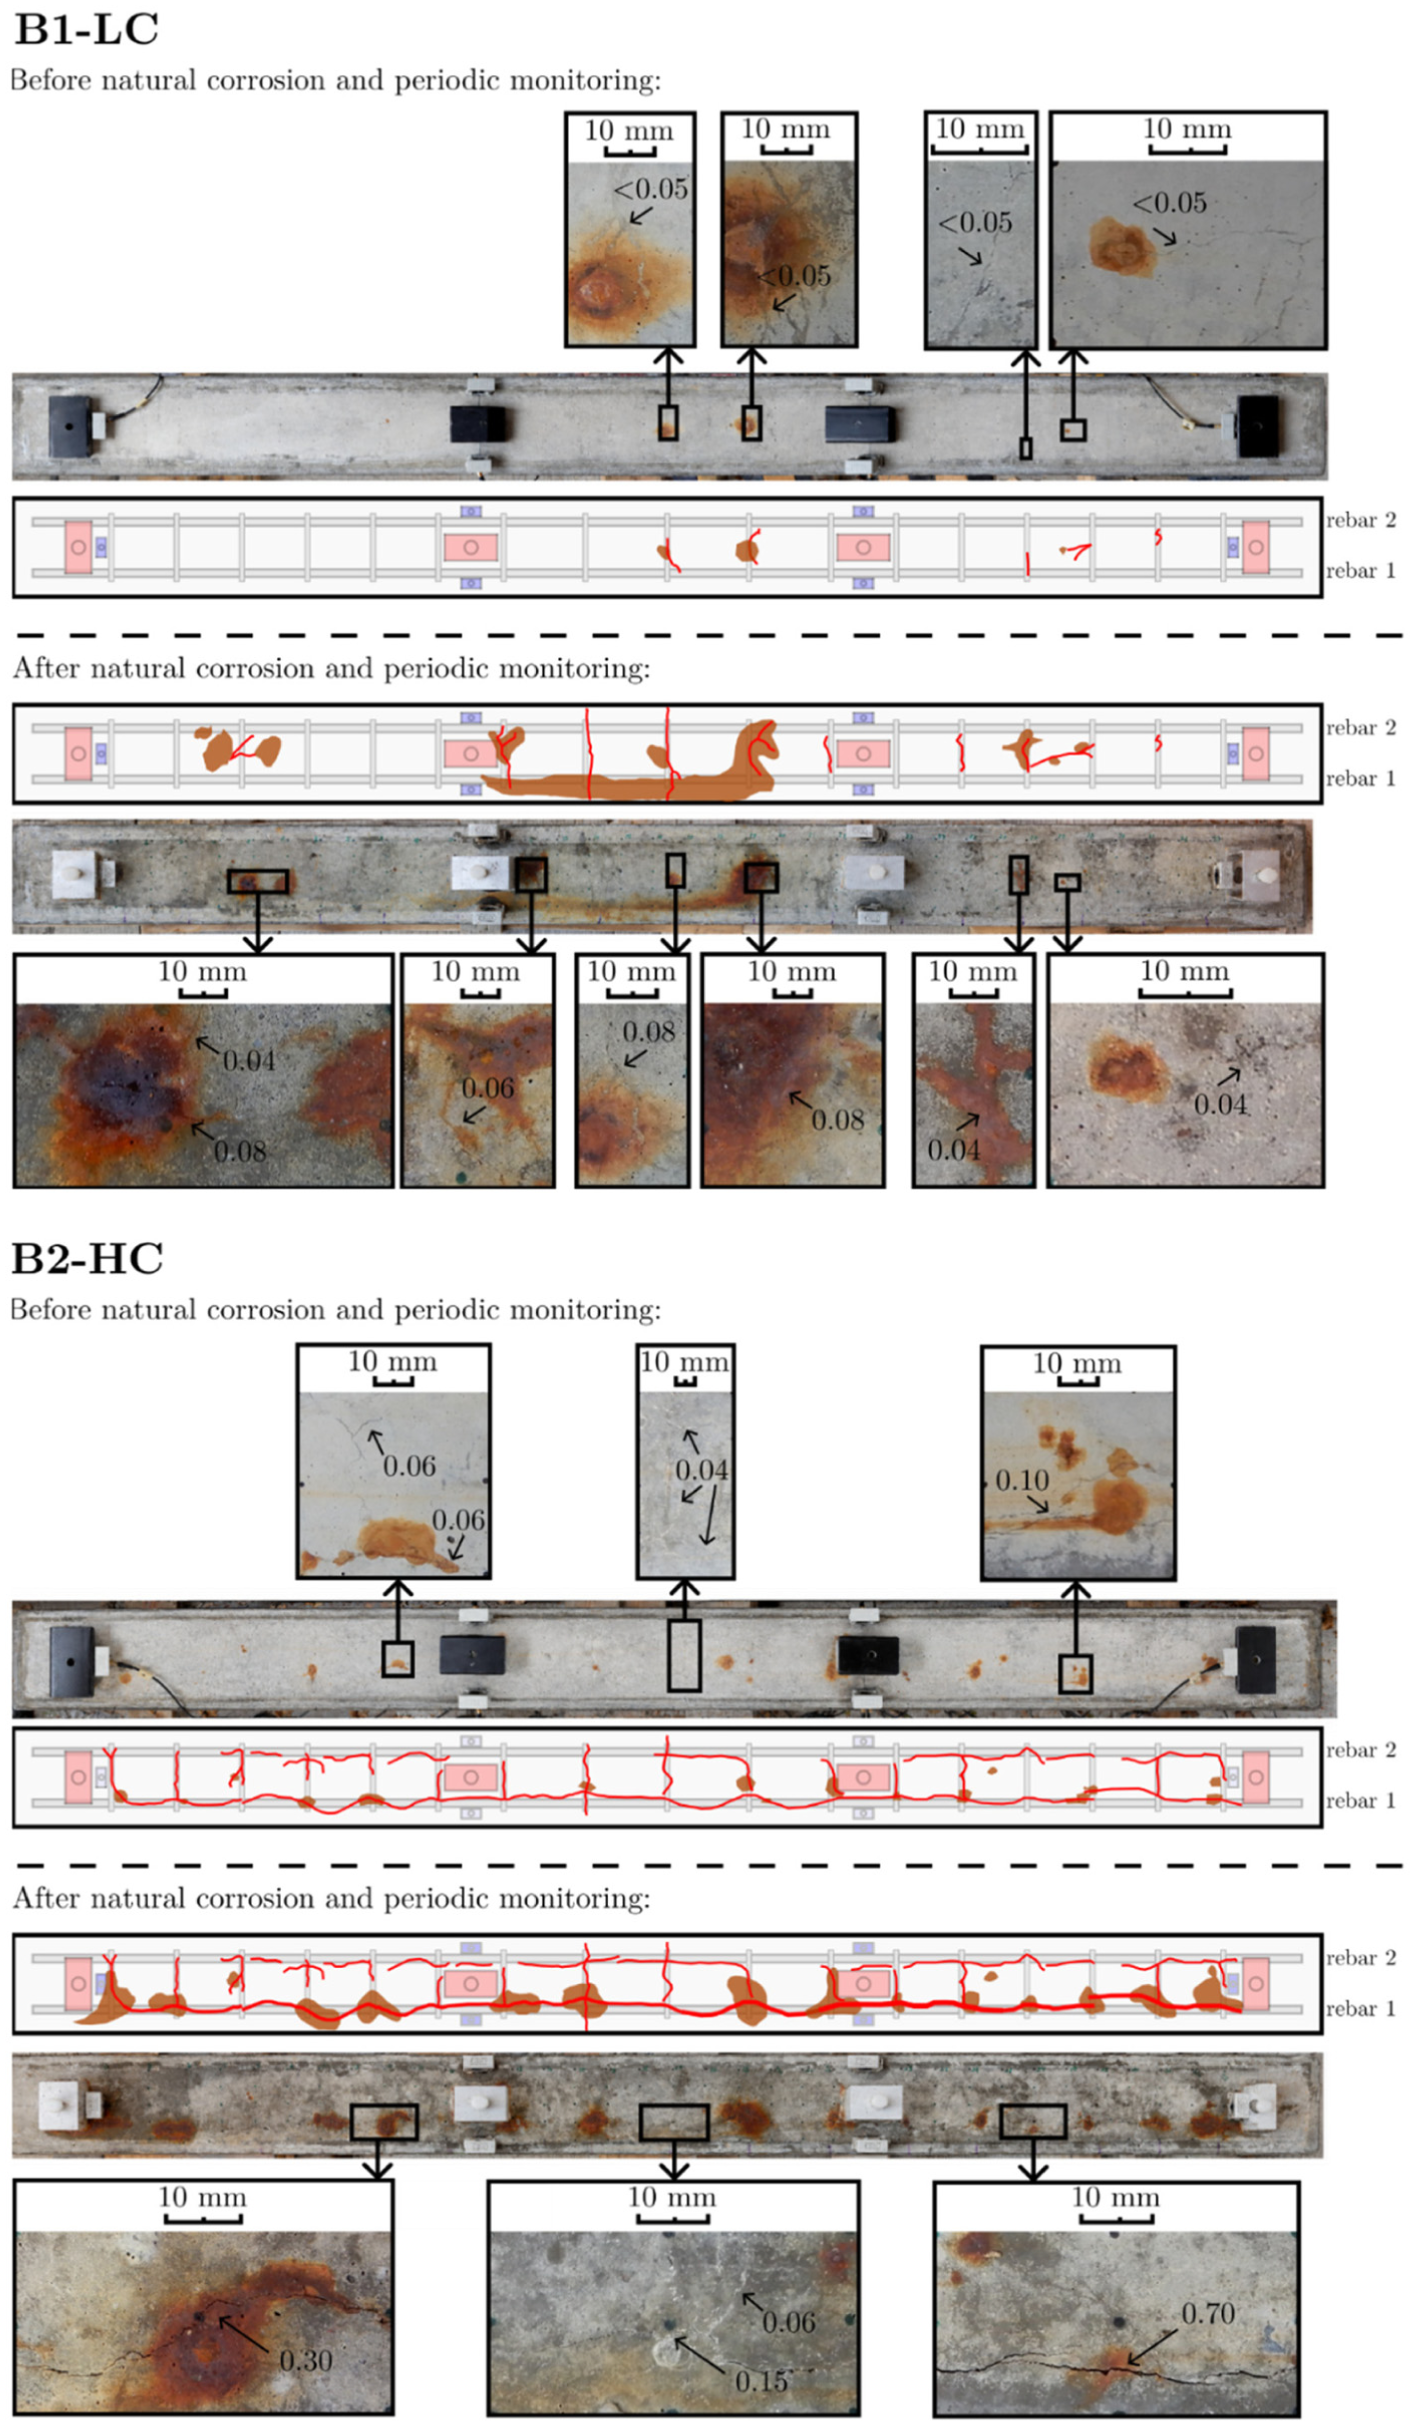
Top view of the beams indicating the crack patterns and rust spots before and after natural corrosion and periodic AE monitoring, cracks are exaggerated for readability. AE: acoustic emission.
After almost 2 years, the longitudinal rebars were extracted from the beams and cleaned according to ASTM G1-03 30 to determine the CL. The rebars were cut into pieces of 100 or 125 mm according to the stirrup spacing. The rebar segments were put in Clark’s solution for 25 min and were weighed afterwards in order to determine the mass loss. This process was repeated until no significant mass loss difference was observed between the cleaning cycles.
The obtained CLs for each rebar segment are shown in Figures 11 and 12 for beams B1-LC and B2-HC, respectively. Rebars 1 and 2 refer to the two longitudinal rebars as indicated in Figure 10. The CL is calculated as:

with CL j the CL of rebar segment j in %, m0 the original mass before corrosion, m a the mass after corrosion.
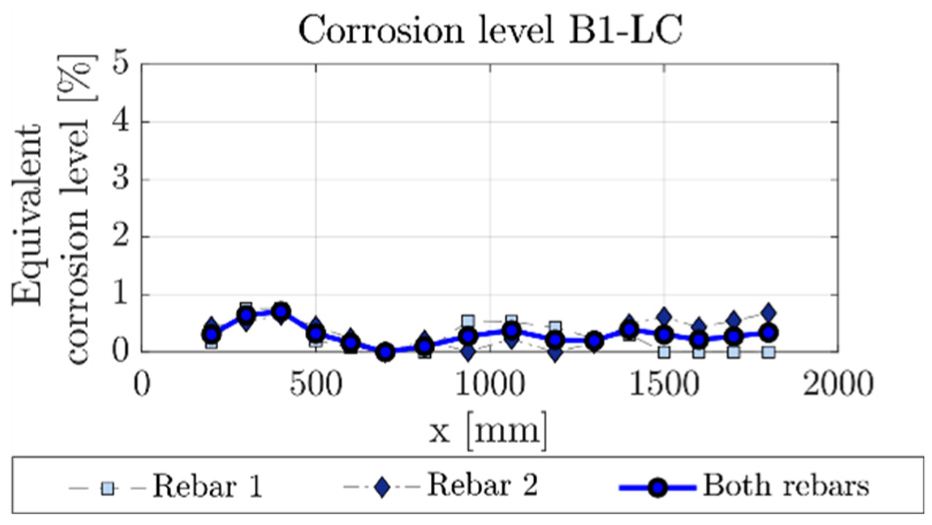
Equivalent CLs of the rebar segments of B1-LC. CL: corrosion level; B1-LC: Beam 1-Low Corrosion.
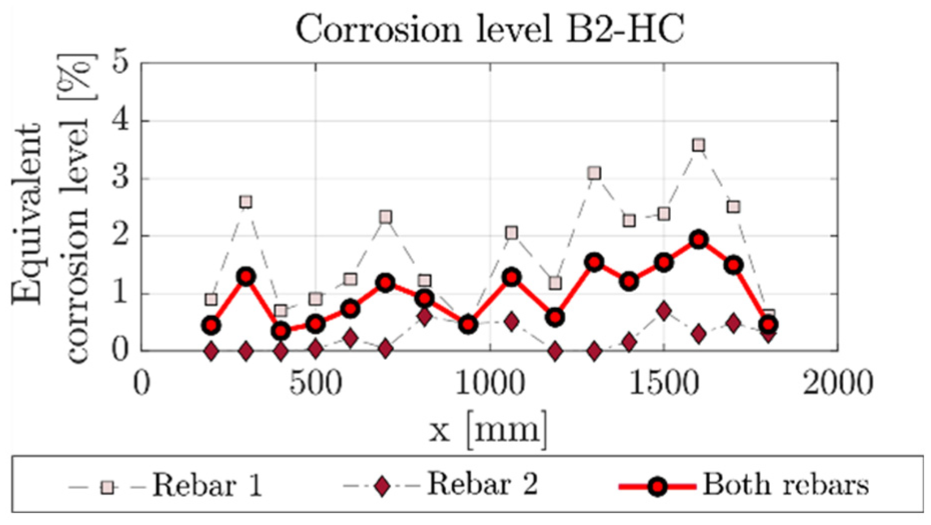
Equivalent CLs of the rebar segments of B2-HC. CL: corrosion level; B2-HC: Beam 2-High Corrosion.
An equivalent CL per sub-element or per beam is defined as 29 :

with CL j the CL of rebar segment j, and n r the number of rebar segments.
For beam B1-LC, the equivalent CLs of both rebars are similar and range between 0 and 0.75%. The beam reached a total equivalent CL, that is, average CL, of 0.30%. For beam B2-HC, equivalent CLs were different for rebar 1 and rebar 2, which is in line with the observed surface cracking. For rebar 1, CLs range between 0.45 and 3.58%. Rebar 2 showed CLs between 0 and 0.70%. The beam reached a total equivalent CL, that is, average CL, of 1%.
Analysis of AE data and development of a filtering protocol
As the beams were stored outside, they were exposed to fluctuating environmental conditions. This may lead to noise in the AE data as opposed to lab conditions where signals are mainly originating from active damage processes. This influence is clearly visible in the raw AE data shown in Figure 13 for both sensor layouts. The unfiltered cumulative AE events show similar trends for both beams, with occasionally intense activity occurring simultaneously. At times, high activity is also observed in individual beams, although the magnitude suggests this is not related to damage. This indicates that many AE events originate due to external influences or noise sources, other than the degradation of the beam.
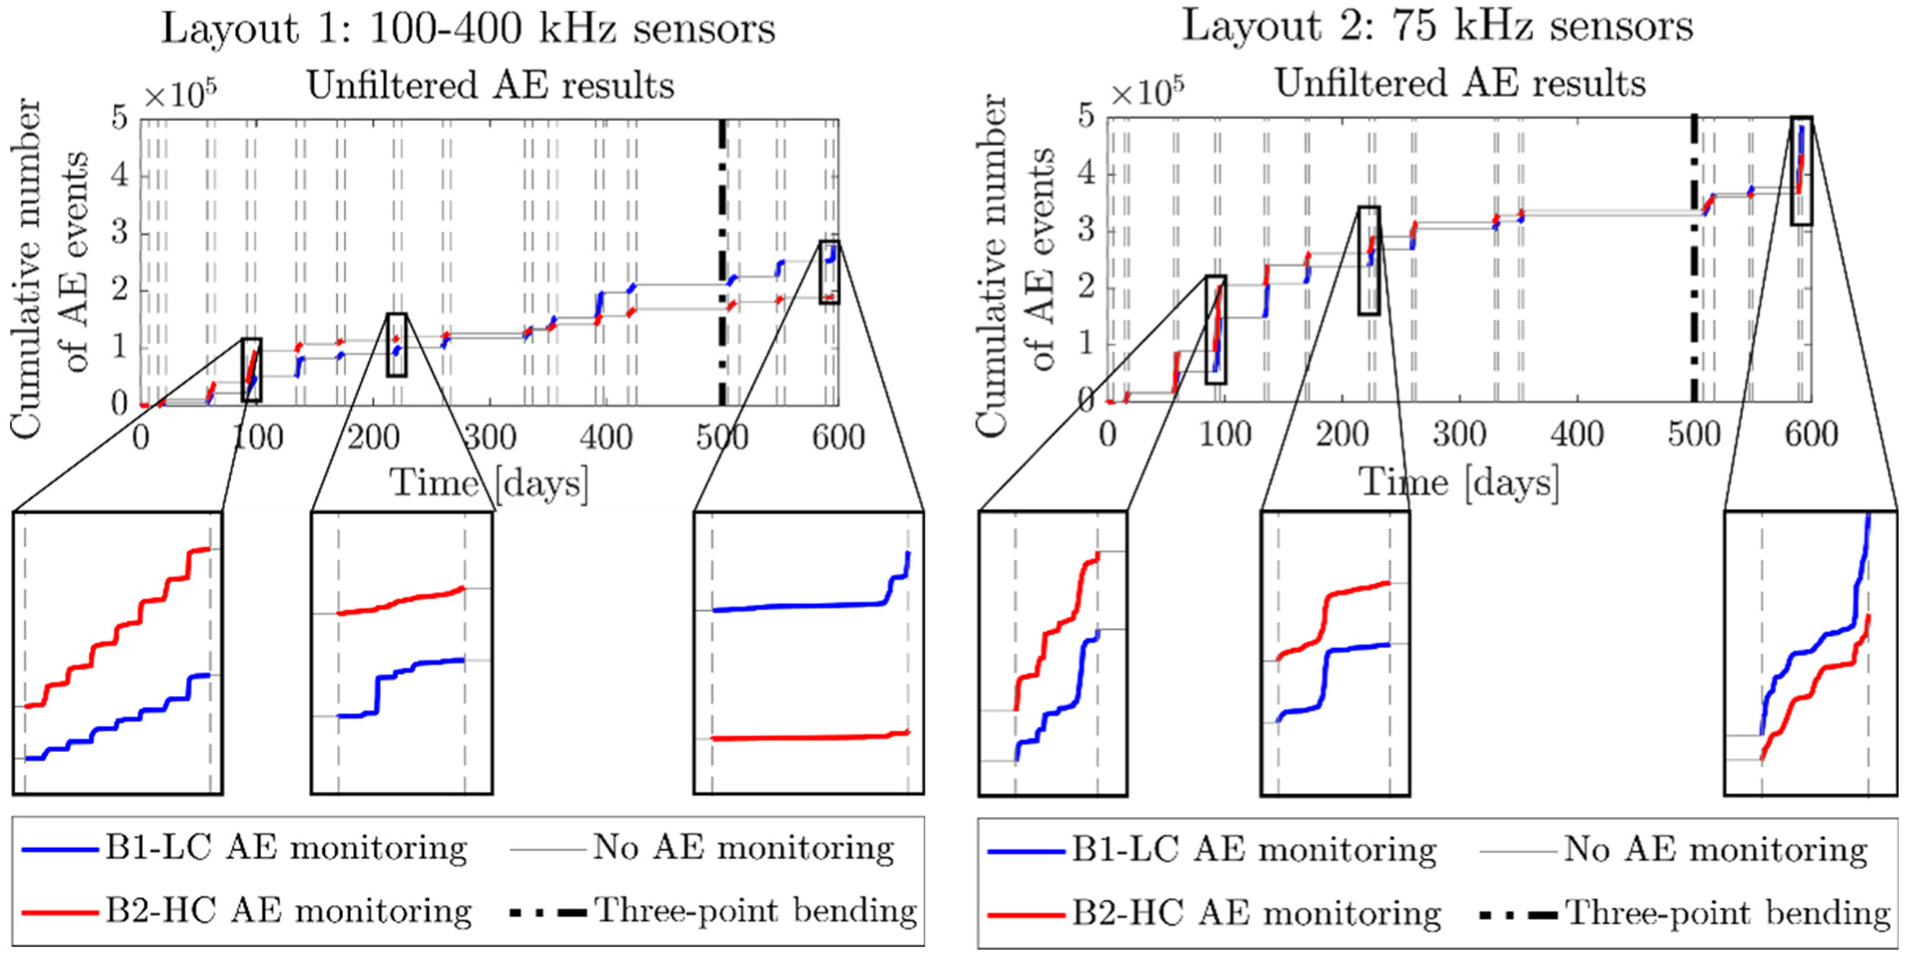
Unfiltered cumulative number of AE events versus time obtained with sensor layout 1 (100–400 kHz, 2D) (left) and layout 2 (75 kHz, 1D) (right) for beams B1-LC (blue) and B2-HC (red), with indication of the monitoring periods and three-point bending test. AE: acoustic emission; 1D: one dimensional; 2D: two dimensional; B1-LC: Beam 1-Low Corrosion; B2-HC: Beam 2-High Corrosion.
In addition, preliminary 1D localization results were investigated. Therefore, each beam was divided into six elements, each having a width of 300 mm. For each element, the total number of localized AE events per day was determined by summing all AE signals localized within that element over the entire monitoring period and dividing this by the total monitoring time. These results were compared with the equivalent crack width and equivalent CL of each element. The 1D localization does not correspond well to the observed surface cracking or CL as shown in Figures 14 and 15.
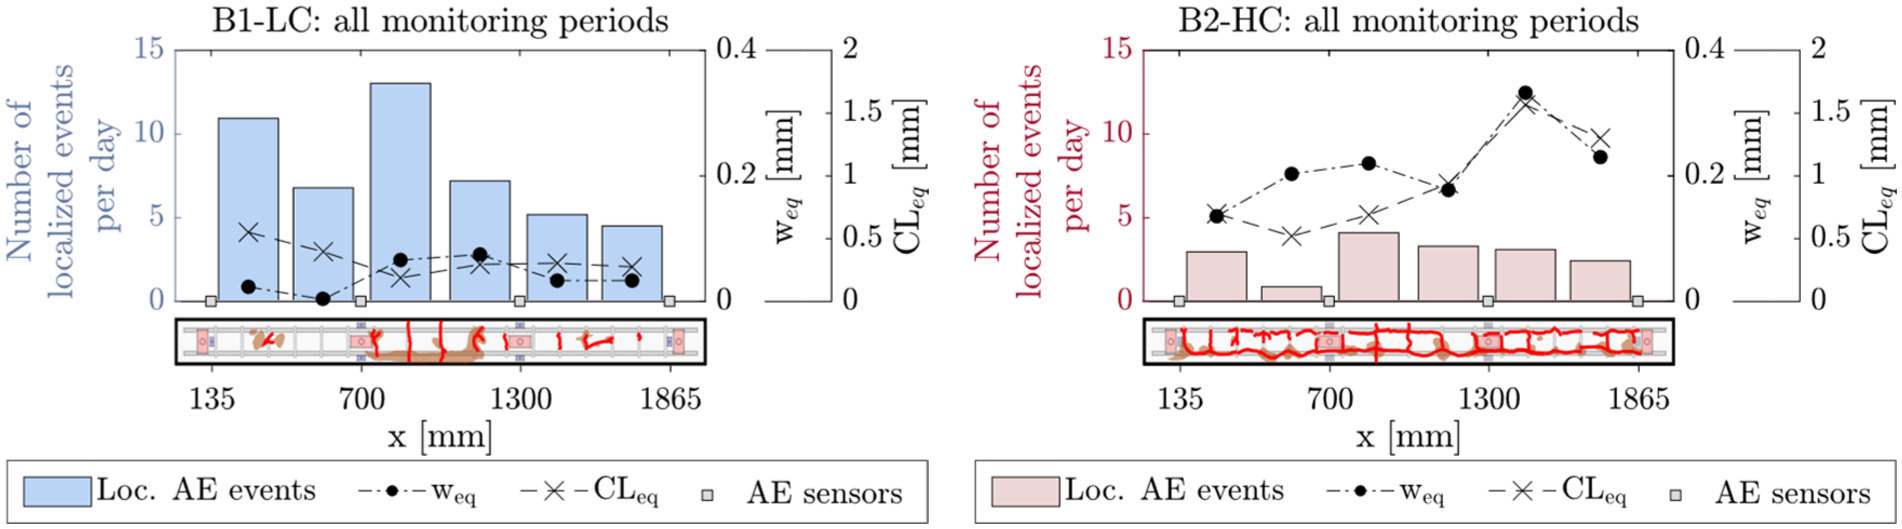
Unfiltered 1D localization result for beam B1-LC (left) and beam B2-HC (right) using sensor layout 1 (100–400 kHz, 2D), with indication of the final equivalent crack width and CL. CL: corrosion level; B1-LC: Beam 1-Low Corrosion; B2-HC: Beam 2-High Corrosion; 1D: one dimensional; 2D: two dimensional.
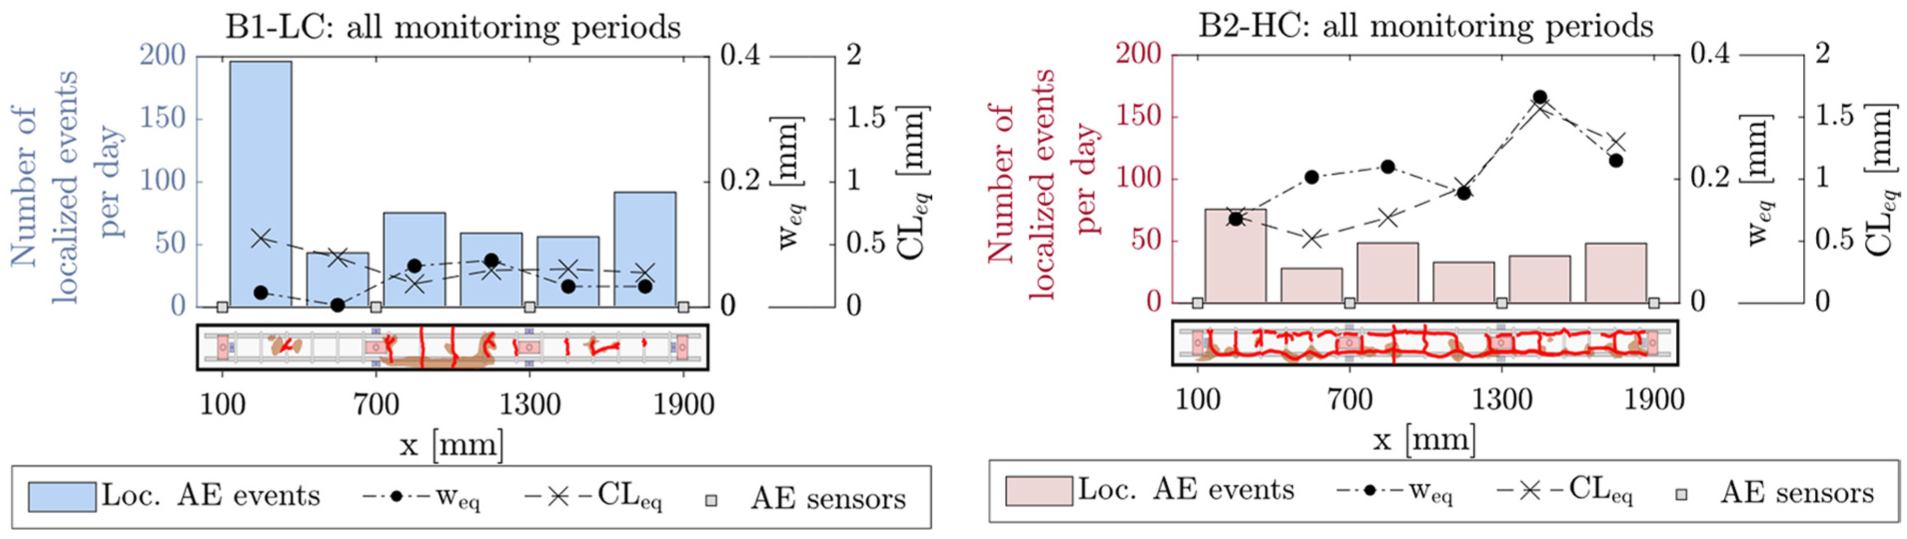
Unfiltered 1D localization for beam B1-LC (left) and beam B2-HC (right) using sensor layout 2 (75 kHz, 1D), with indication of the final equivalent crack width and CL. CL: corrosion level; B1-LC: Beam 1-Low Corrosion; B2-HC: Beam 2-High Corrosion; 1D: one dimensional.
To assess whether this activity was related to environmental factors rather than structural damage, several potential influences were investigated. This analysis is essential to set up a dedicated filtering protocol that allows reliable interpretation of AE data.
In the following subsections, the influence of environmental parameters and other noise sources on AE data is examined. Environmental parameters such as temperature, RH, rainfall, solar radiation, and wind speed were obtained from the VLIET test building, a nearby testing facility located on the same campus of KU Leuven as the beam setup. The discussion below focuses on AE data collected during monitoring with the 100–400 kHz sensors (layout 1), although similar observations were made using the 75 kHz sensors (layout 2).
Effect of environmental parameters on AE data
Changes in temperature and RH
It has been reported in the literature that the corrosion rate is influenced by the moisture content in the concrete pores, which is affected by both the environmental RH and temperature variations. 31 From investigating samples at a similar temperature, but varying wetting conditions, Käthler et al. 32 found that the corrosion rate may be influenced by the number and frequency of wetting events, the relative durations of wetting and drying phases, and the RH between the wetting events. Alternatively, when the effect of temperature is investigated while maintaining a constant RH, the corrosion propagation tends to increase with increasing temperature.33,34 However, under atmospheric conditions, temperature and RH interact in a complex manner and are typically inversely coupled. Both influence the corrosion rate. 35 As both temperature and RH have an effect on the progress of corrosion and thus the damage progress, which may be captured with the AE technique as shown by Lyons et al., 22 no filtering was applied to the AE data based on these parameters.
Figures 16 and 17 show the AE event rate per hour versus temperature and RH, respectively. A dataset was selected when low solar radiation and low wind speed were observed to isolate the effects of daily temperature and RH changes. A noticeable increase in AE event rate is observed during periods of larger temperature and RH variations. A time shift between the peak temperature and peak event rate is visible due to temperature inertia, which is consistent with the observations by Lyons et al. 22 This peak in AE rate is observed after a significant decrease in the RH. Increases in AE event rate are not always consistent across both beams, for example, an increase is observed for beam B1-LC around 100 h, but not in beam B2-HC.
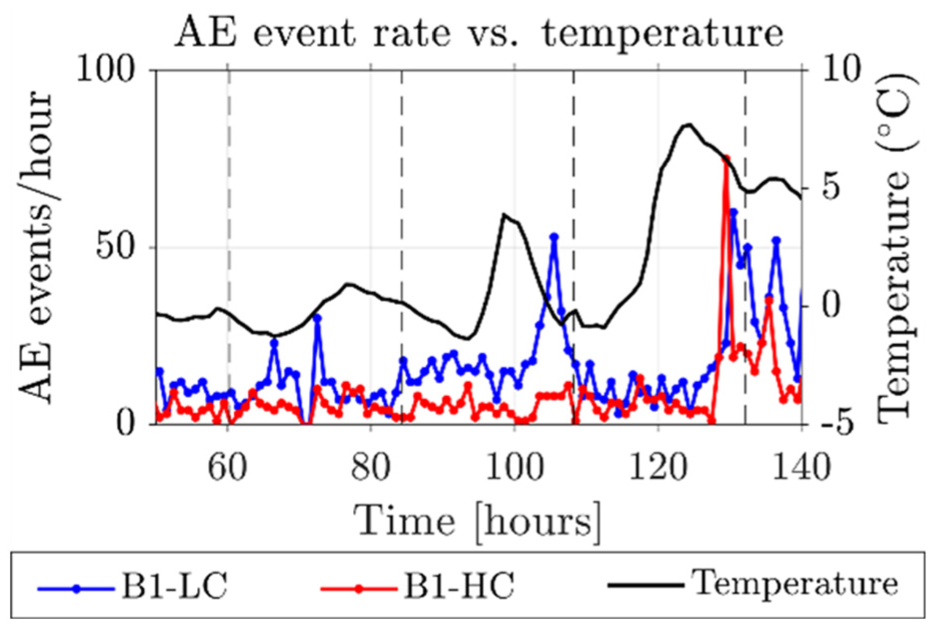
AE event rate per hour versus temperature during three consecutive days. AE: acoustic emission.
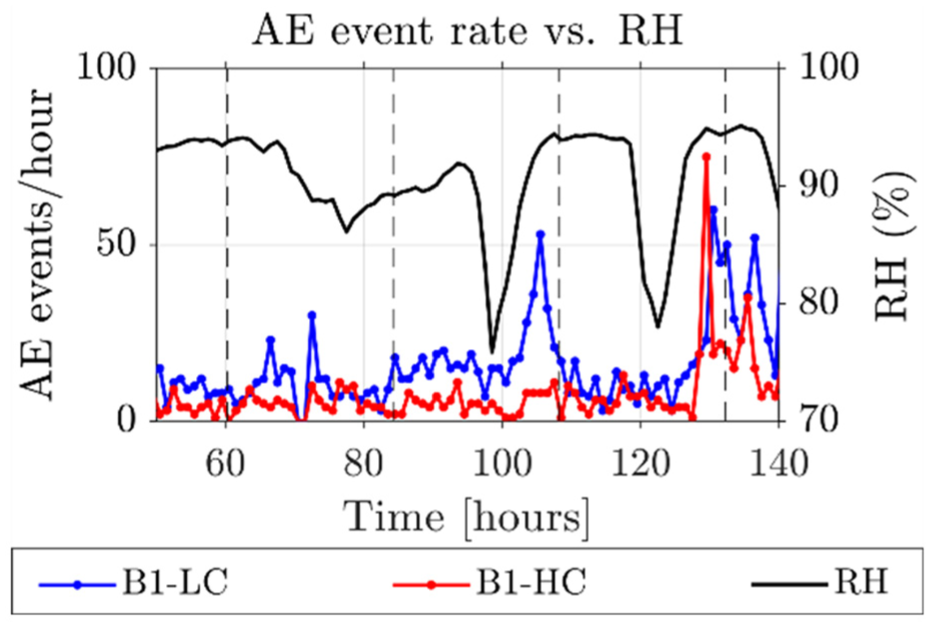
AE event rate per hour versus RH during three consecutive days. AE: acoustic emission; RH: relative humidity.
Solar exposure
At certain times of the year, particularly during summer, the beams were exposed to direct sunlight. Figure 18 shows the AE event rate per hour versus the global solar radiation during four consecutive summer days. A clear increase in AE activity is observed during periods of solar exposure, even when the beams were covered by a sheet. Similar to daily temperature fluctuations, solar radiation affects the temperature of the concrete surface, but at a higher rate. It is assumed that this leads to AE activity due to thermal expansion of the concrete. More AE events are typically detected in the more heavily corroded beam B2-HC compared to B1-LC likely due to friction in the existing surface cracks. Since these can be classified as secondary emissions, yet originating from existing corrosion damage, no filtering was applied to exclude periods of high solar radiation.
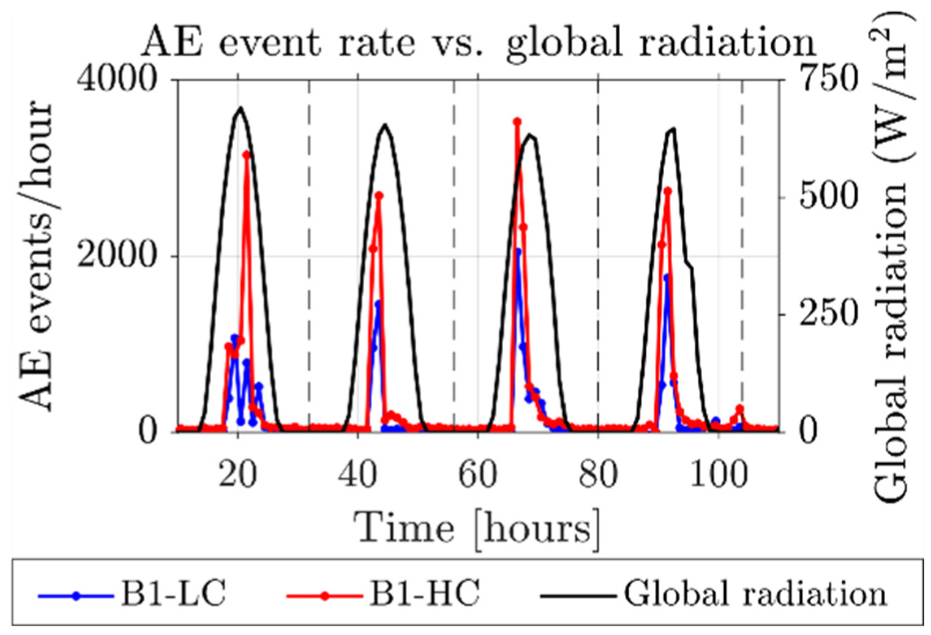
AE event rate per hour versus global radiation during 4 consecutive days. AE: acoustic emission.
Wind
Figure 19 shows the AE event rate per hour versus wind speed during two monitoring periods including episodes of strong wind gusts. A significant increase in AE activity is observed at higher wind speeds (higher than 3 m/s). Smaller increases are visible as well between 1.5 and 3 m/s (Figure 19 (left)). Wind speeds below 1.5 m/s showed no significant effect on the AE measurements, which corresponds to the upper limit of level 1 on the Beaufort scale (Figure 19 (right)). The AE equipment, especially the sensor-to-amplifier cable, was found to be sensitive to movement caused by wind. Moreover, high wind speeds lead to sand particles fretting along the sample surface. Since these AE signals are not related to active damage mechanisms, a filter is required to exclude periods of high wind speeds. Therefore, AE data recorded during such conditions will not be considered in the analysis.
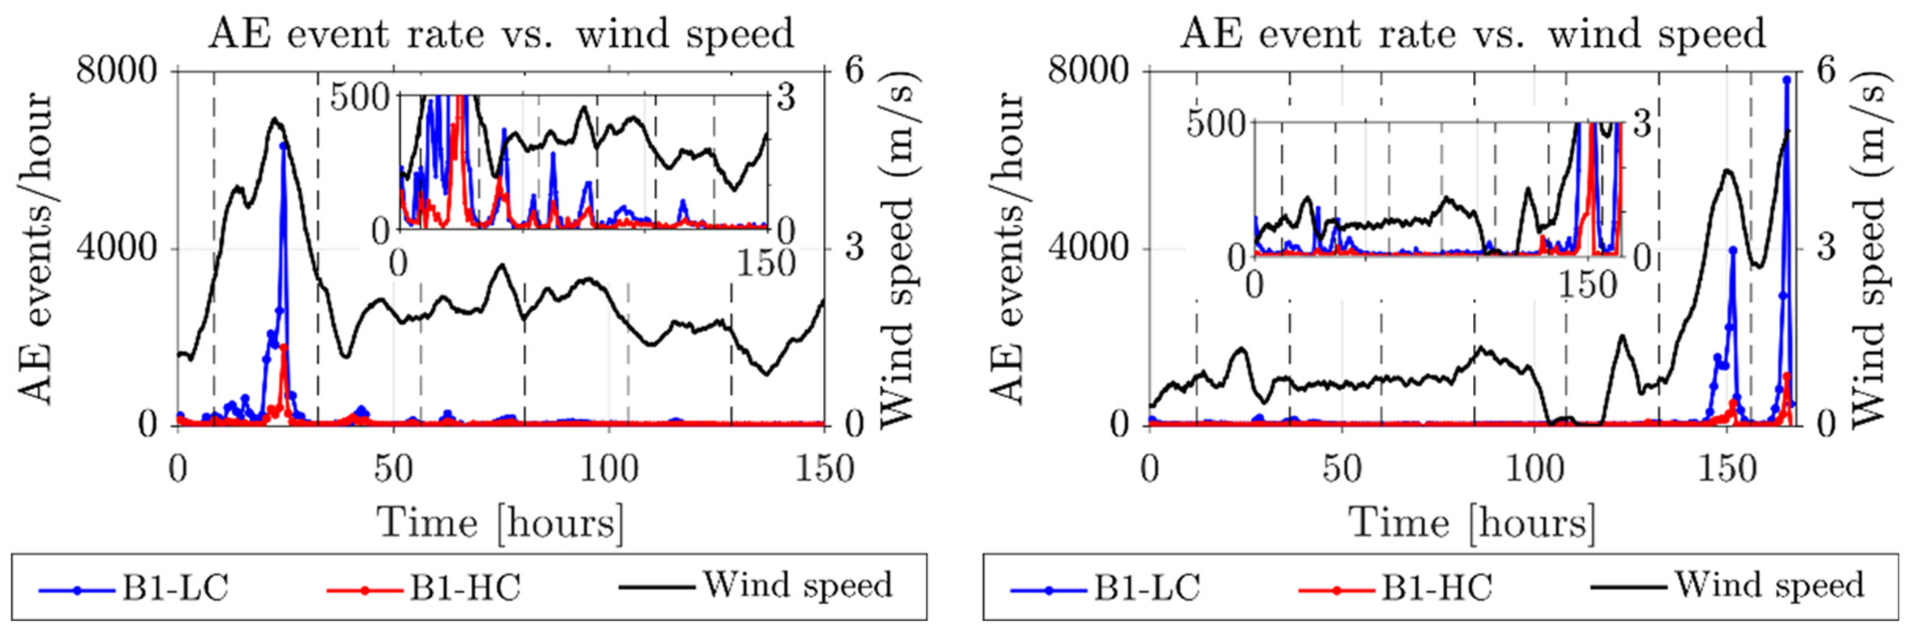
AE event rate versus wind speed during two periodic monitoring periods. AE: acoustic emission.
Rain
As the beams were sheltered from rain by using a protective sheet, noise due to direct rainfall was not present in the current AE dataset. However, it can be anticipated that direct rainfall will generate AE events as found in the literature. 36 If the beams were exposed to rain and corresponding rainfall data were available, a similar filtering approach as applied for wind could be used, that is, excluding periods of direct rainfall from the AE analysis. It should be noted that rainfall also affects the internal RH of the concrete, which may influence the corrosion process with some delay. This indirect effect is attributed to active damage mechanisms and can therefore be included in the analysis.
Sensor malfunction and electrical noise
Due to varying humidity levels, either from salt water spraying or varying outdoor humidity levels, short periods of sensor malfunction were observed. This is visible in the AE data as a sudden increase in the number of AE hits from a single sensor, as shown in Figure 20. To ensure reliable AE signals, only events detected by at least two sensors (i.e. containing a minimum of two hits) were considered valid.
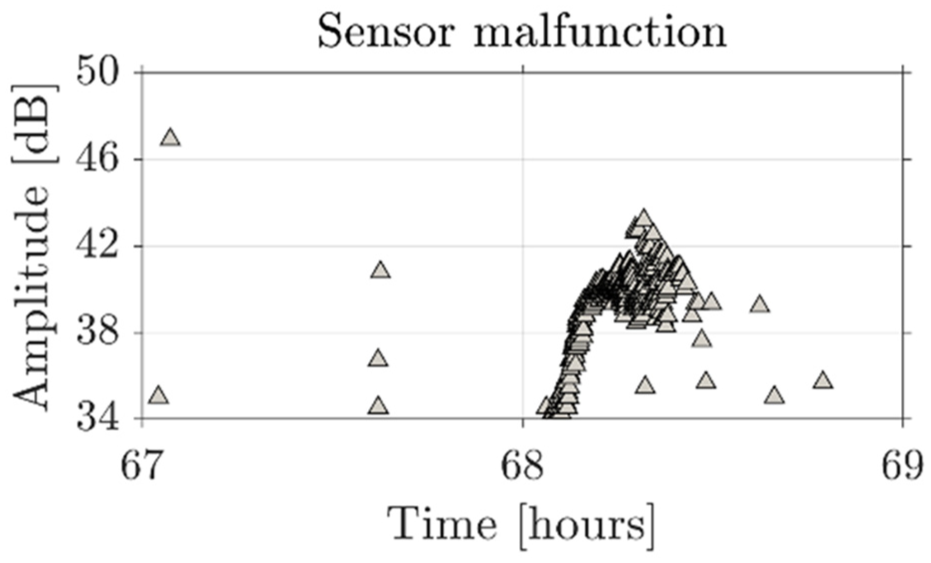
Amplitude versus time of AE hits detected by one sensor, indicating a malfunction of the sensor due to salt water spraying. AE: acoustic emission.
In addition, high-frequency signals are typically associated with electrical noise. 15 Moreover, the literature suggests that signals with a long rise-time and duration are also indicative of noise. 37 Therefore, damage-related AE signals should have relatively low peak and center frequencies, as well as short rise time and duration. Based on previous work and verification using PLBs on both beams, thresholds were established for low-pass filters: frequency below 300 kHz, rise time below 2000 μs, and duration below 10,000 μs.
Accidental hits from the environment
The beams were stored next to a passage way for pedestrians and bicycles. Sporadically, this passage way was used by a car or truck, causing low-frequency vibrations or movement of the cable ducts. This was picked up by the AE system and could clearly be observed by a significant jump in the AE hit rate (Figure 21). Therefore, if the hit rate per second is larger than 30 and hits were occurring in both beams, these hits were omitted.
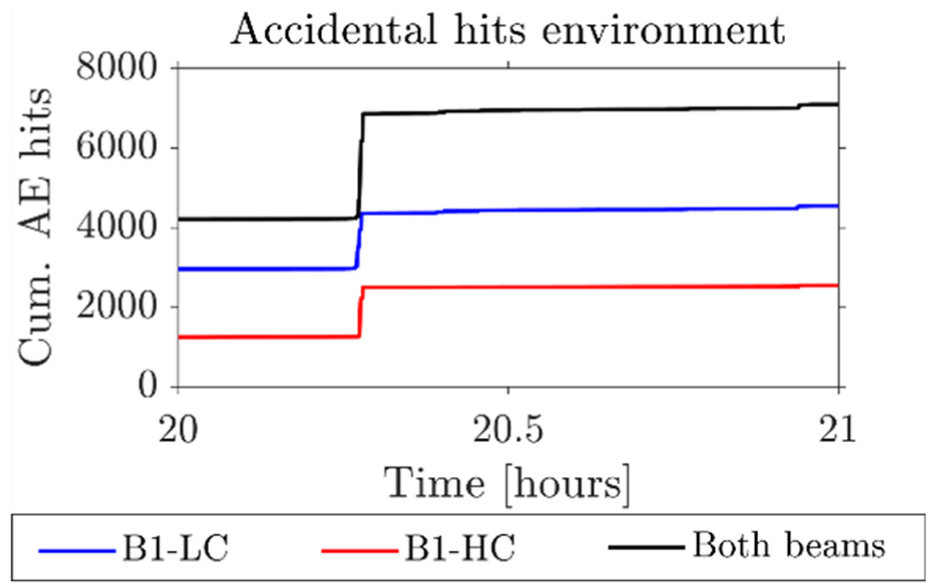
Cumulative AE hits of beams B1-LC and B2-HC and their summation, indicating a significant increase of AE hits after passing of a truck. AE: acoustic emission; B1-LC: Beam 1-Low Corrosion; B2-HC: Beam 2-High Corrosion.
Developed filtering protocol for AE data
Based on the insights obtained in “Effect of environmental parameters on AE data” section, a dedicated filtering protocol was developed to retain the most reliable AE data for analysis and localization. The following steps were subsequently applied:
1. Wind filtering: AE hits recorded during high wind conditions were excluded. If the moving average wind speed, calculated over 300 s, was higher than 1.5 m/s, the detected AE hits were removed.
2. Traffic-induced noise: If more than 30 hits per second were detected simultaneously in both beams, these were excluded, as they likely resulted from external vibrations (e.g. passing vehicles).
3. Cross-beam filtering: AE hits occurring within a time frame of 5 ms in both beams were removed as these are assumed to originate from environmental sources rather than structural damage.
4. Signal characteristics: To exclude electrical noise, thresholds were applied based on previous work and PLB tests: the frequency should be lower than 300 kHz, the rise time shorter than 2000 μs, and the duration shorter than 10,000 μs.
5. Minimum hit requirement: AE events were only considered valid when containing at least two hits, meaning that each event is detected by at least two sensors.
To further improve localization accuracy, additional filters were applied:
6. Signal-to-noise ratio: The signal-to-noise ratio was calculated and should be higher than 10 dB. 38
7. Initial noise level: The noise level of the first 50 μs of the recorded signals should be below 0.01 mV. This threshold was based on the typical baseline noise level observed during monitoring.
8. Localization validity: Only events localized within the physical boundaries of the beam were kept.
Steps 6 and 7 enhance the accuracy of arrival time picking, which is essential for reliable AE source localization. Arrival times were determined using a two-stage Akaike Information Criterion picker.39–41 Subsequently, 1D (layouts 1 and 2) and 2D localization (layout 1) were performed. A grid search localization algorithm was used for 1D localization. 42 Geiger’s algorithm was applied for 2D localization. 43 The wave velocity was determined using ultrasonic pulsing. The AE sensors acted as transmitters, emitting ultrasonic pulses that were detected by the remaining sensors. The wave velocity was calculated from the measured travel time and the known sensor spacing. Ultrasonic pulsing was performed during each monitoring period. Within the localization algorithm, the localization algorithm accounted for the temporal evolution of the wave velocity.
As shown in Figure 22 and in comparison with Figure 13, the filtering protocol significantly reduces the noise in the AE data. It can also be observed that after filtering, beam B2-HC with a higher corrosion damage level shows consistently higher AE event activity compared to beam B1-LC, which was not the case for the unfiltered data in Figure 13.
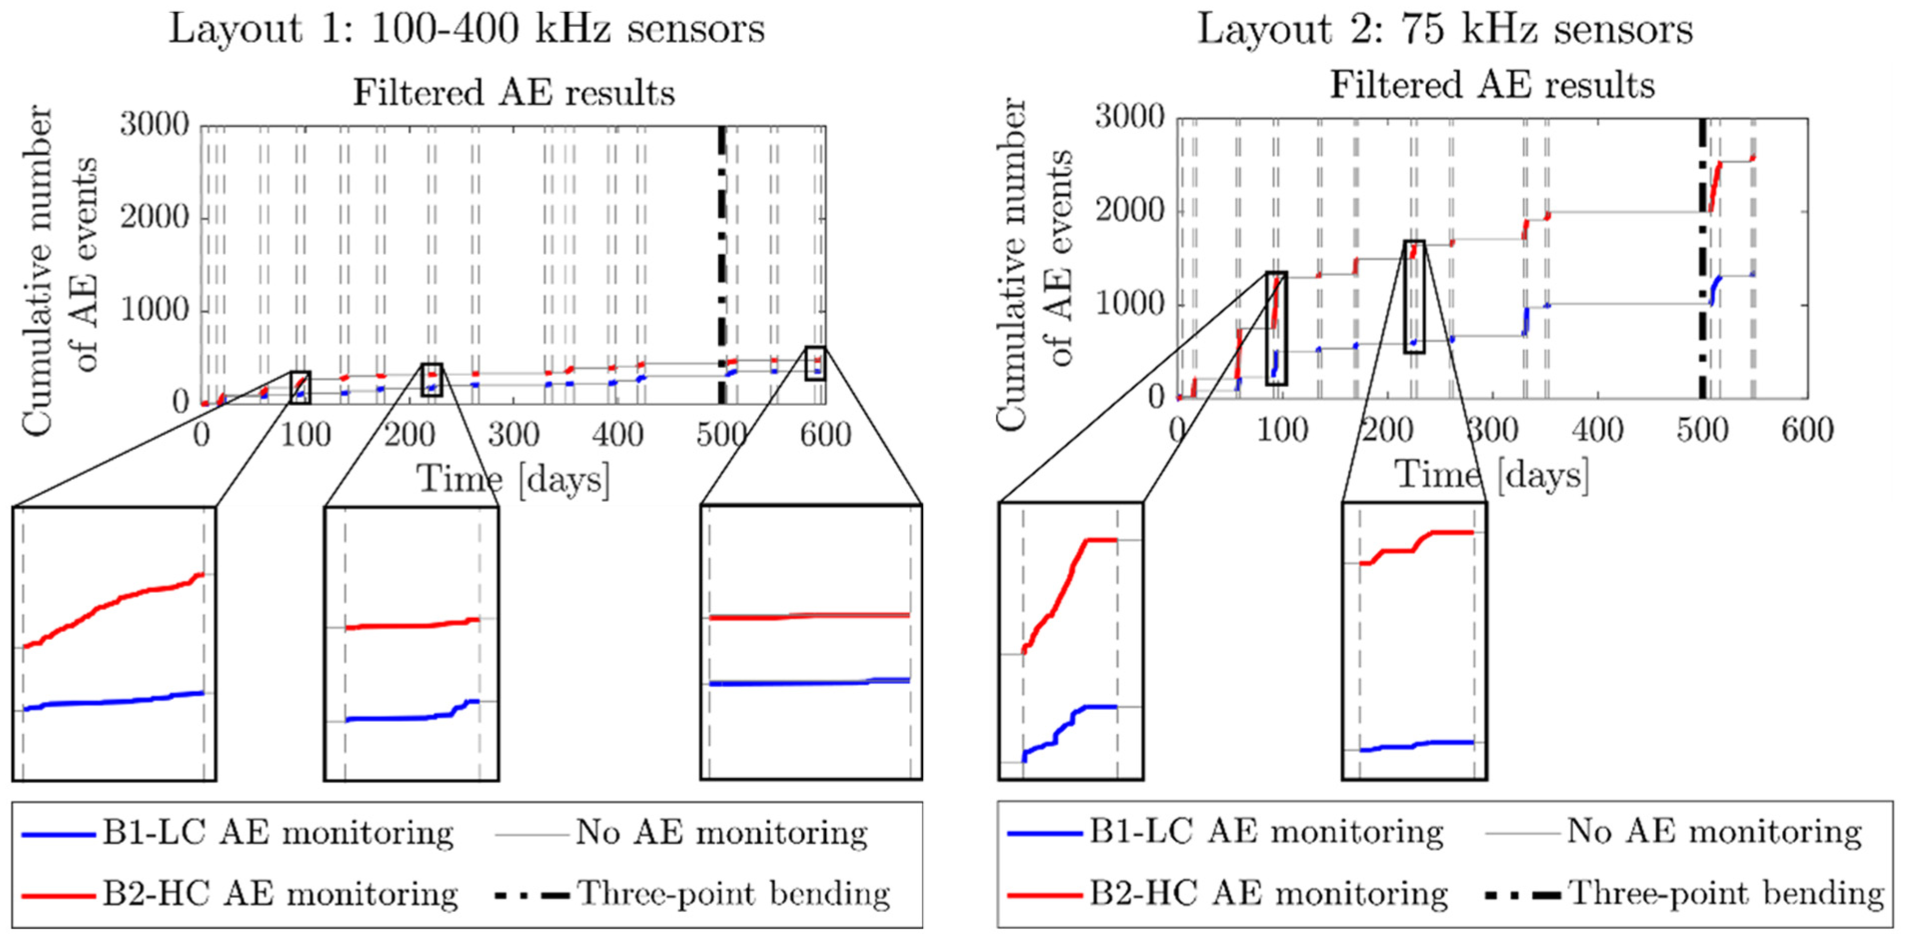
Filtered cumulative number of localized AE events versus time for sensor layout 1 (left) and layout 2 (right) for beams B1-LC (blue) and B2-HC (red), with indication of the monitoring periods and three-point bending test. AE: acoustic emission; B1-LC: Beam 1-Low Corrosion; B2-HC: Beam 2-High Corrosion.
In the further course of this paper, the analysis will be based on filtered, 1D localized AE events as these events are considered most reliable. For layout 1 with sensor type 100–400 kHz, the events were localized in 1D by using the upper (sensors 1, 2, 3, and 6) and lower (sensors 1, 4, 5, and 6) sensor row.
Results of periodic AE monitoring
This section presents the main results obtained using both AE sensor layouts. The filtered AE events, as obtained after application of the filtering protocol presented in the fourth section, will be compared with the visual observations and corrosion damage indicators as defined in the third section.
In the third section, it was observed that B1-LC had few surface cracks before the start of the natural corrosion process and periodic AE monitoring. Beam B2-HC already showed severe surface cracking, which worsened over time. Monitoring of both beams therefore started with a significant difference in damage level. The aim is to investigate whether the AE data shows differences between both beams as well as if it represents the observed damage progress correctly, even when periodic monitoring is applied.
AE event rate versus crack width rate
Due to the periodic monitoring approach, there is a mismatch in continuity between the AE data (recorded only during monitoring periods) and crack width data (which evolves continuously). To enable comparison, an AE event rate and crack width rate were defined. The AE event rate was calculated as the number of localized AE events normalized by monitoring duration. The crack width rate was defined as the change in equivalent crack width between successive crack measurements, normalized by the elapsed time between these measurements. This approach ensures comparability between datasets as both AE activity and crack growth are expressed as time-normalized rates. This is an important aspect to take into account as opposed to studies considering continuous AE monitoring.
Figures 23 and 24 show the AE event rate versus crack width rate for sensor layouts 1 and 2, respectively. A strong direct correlation is not observed. This can be attributed to the periodic monitoring scheme, which may not capture all AE activity associated with crack growth, as well as to the fact that crack growth is not the only source of AE signals. Despite the absence of a direct correlation, a qualitative distinction can be made between beams B1-LC and B2-HC. For beam B1-LC, the first five crack width rates were zero, while AE activity was already detected. Later, small increments in crack width appeared, suggesting that AE detected micro-cracking or corrosion-related processes before measurable surface crack growth occurred. In contrast, beam B2-HC showed consistently higher AE rates and nonzero crack width rates from the start. This indicates sustained AE activity and continuous crack growth, which is consistent with more advanced damage. These findings align with the visual observations and the documented difference in damage level between the beams. However, also on beam B2-HC, near-zero AE event rates are observed, indicating that the corrosion process is not always as active, or low-energy AE events are not recorded or filtered out.
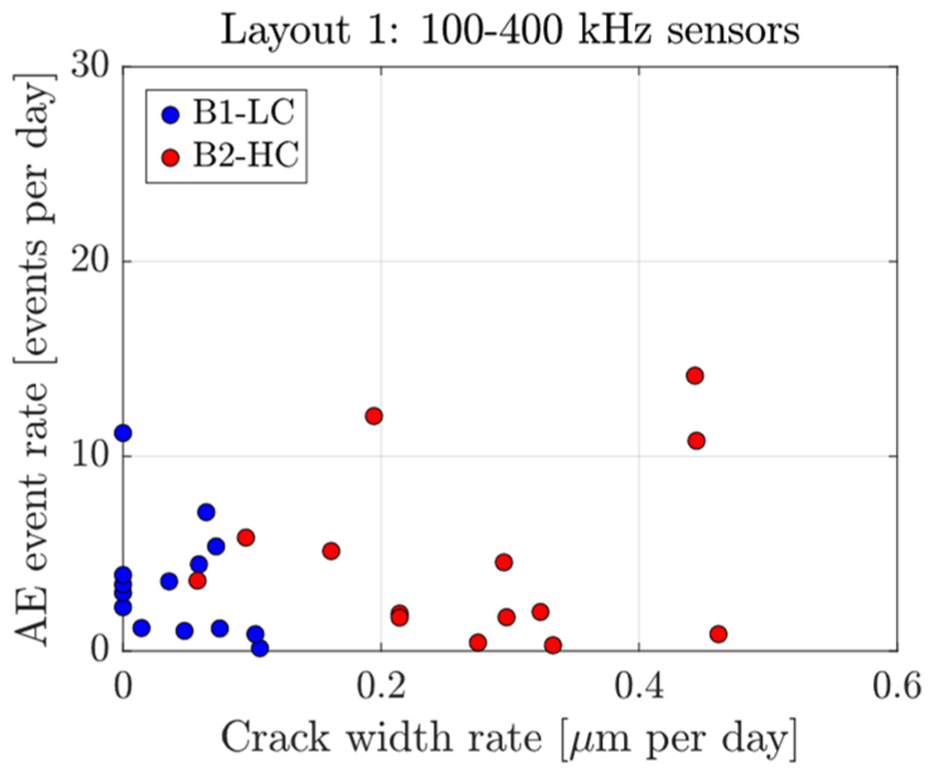
AE event rate versus crack width rate of both beams for sensor layout 1. AE: acoustic emission.
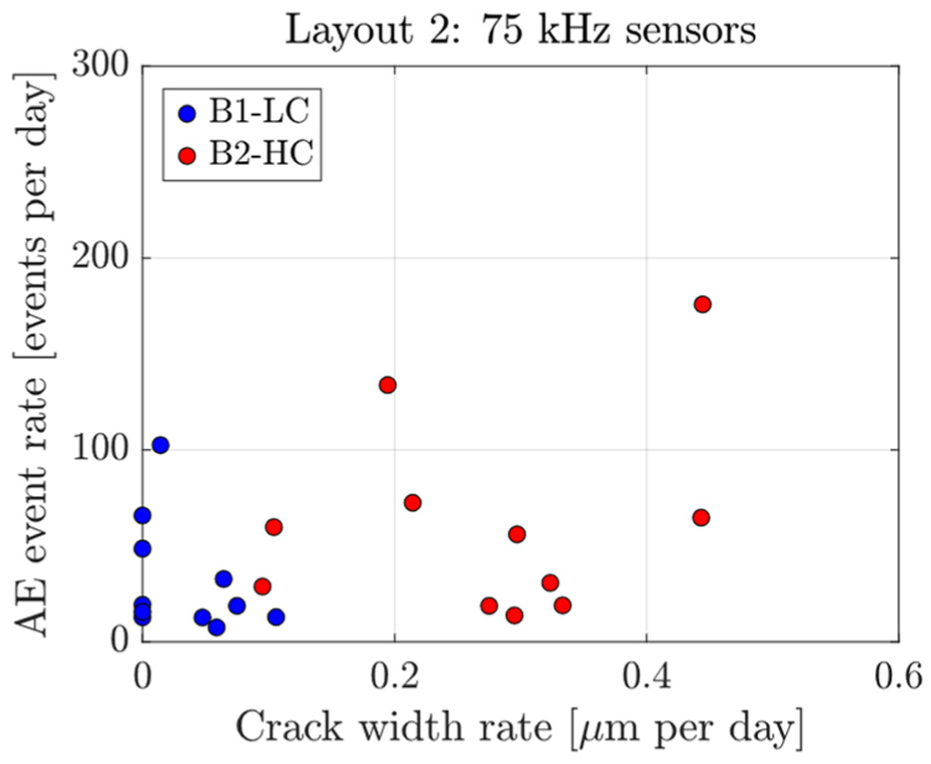
AE event rate versus crack width rate of both beams for sensor layout 2. AE: acoustic emission.
Frequency content
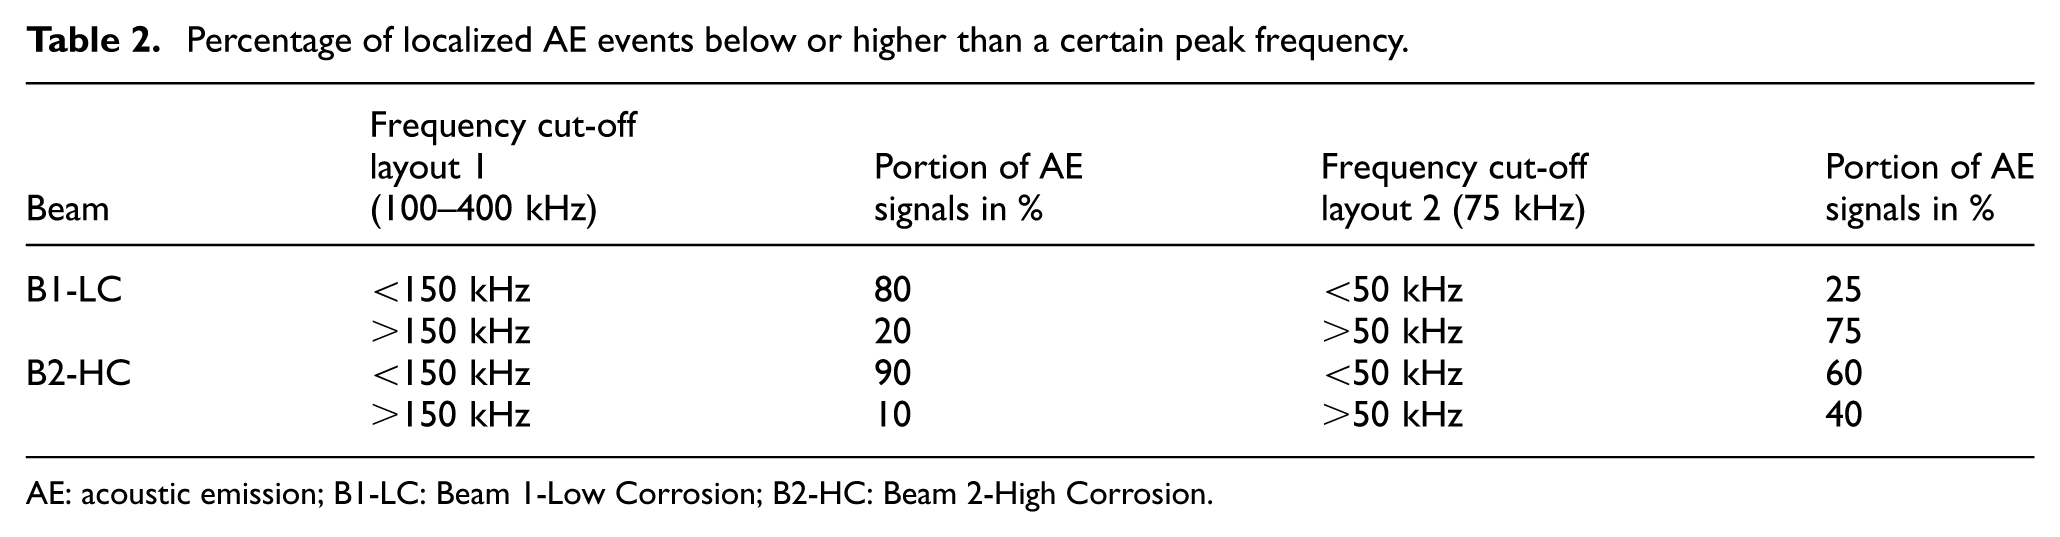
Previous studies have shown that early-stage damage mechanisms, such as friction from corrosion products and micro-cracking, typically generate higher-frequency AE signals, whereas more severe damage, such as macro-cracking, is associated with lower frequencies.14,15,26 The peak frequencies of the AE signals for both sensor layouts are summarized in Table 2. For each layout, two dominant frequency bands were observed. With sensor layout 1 (flat-response sensors), most events occurred around 50 and 200 kHz. For sensor layout 2, the dominant frequencies were lower, around 30 and 75 kHz. Typical signal waveforms in time and frequency domain are shown in Figures 25 and 26 for respectively sensor layout 1 (100–400 kHz) and layout 2 (75 kHz). Both a higher and lower frequency signal are presented. The signals were all detected in beam B1-LC and by sensor S4 although similar signals are obtained in beam B2-HC. The observed dominant frequency bands are attributed to different damage mechanisms.
Percentage of localized AE events below or higher than a certain peak frequency.
AE: acoustic emission; B1-LC: Beam 1-Low Corrosion; B2-HC: Beam 2-High Corrosion.
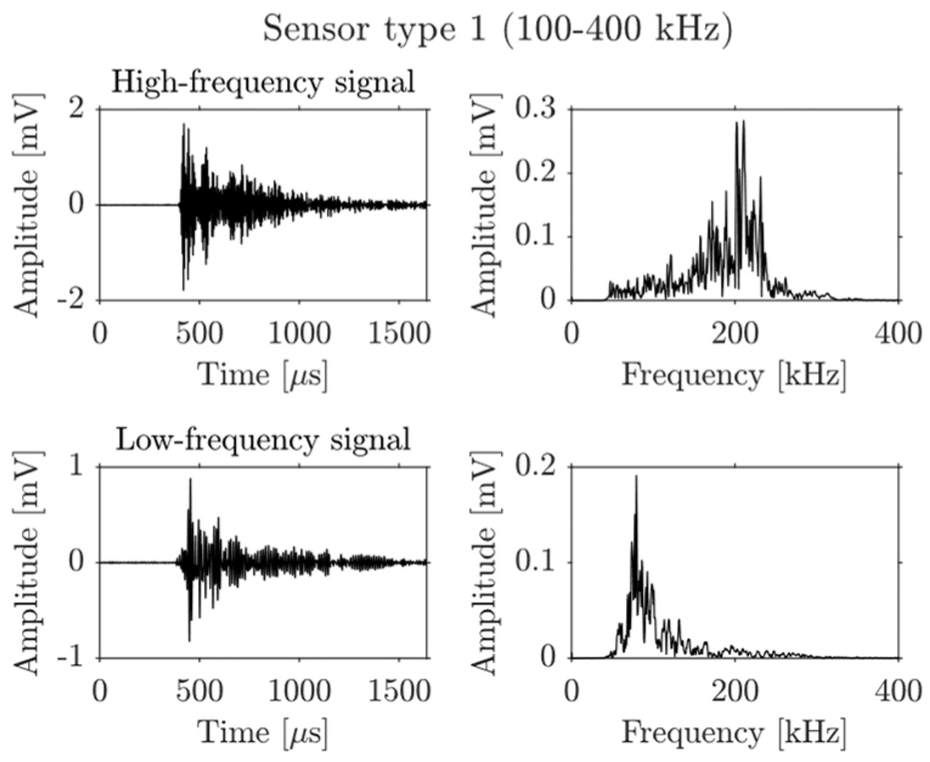
Typical signal waveforms in time domain (left) and frequency domain (right) for a high-frequency signal (top) and low-frequency signal (bottom), detected by sensor type 1 (100–400 kHz).
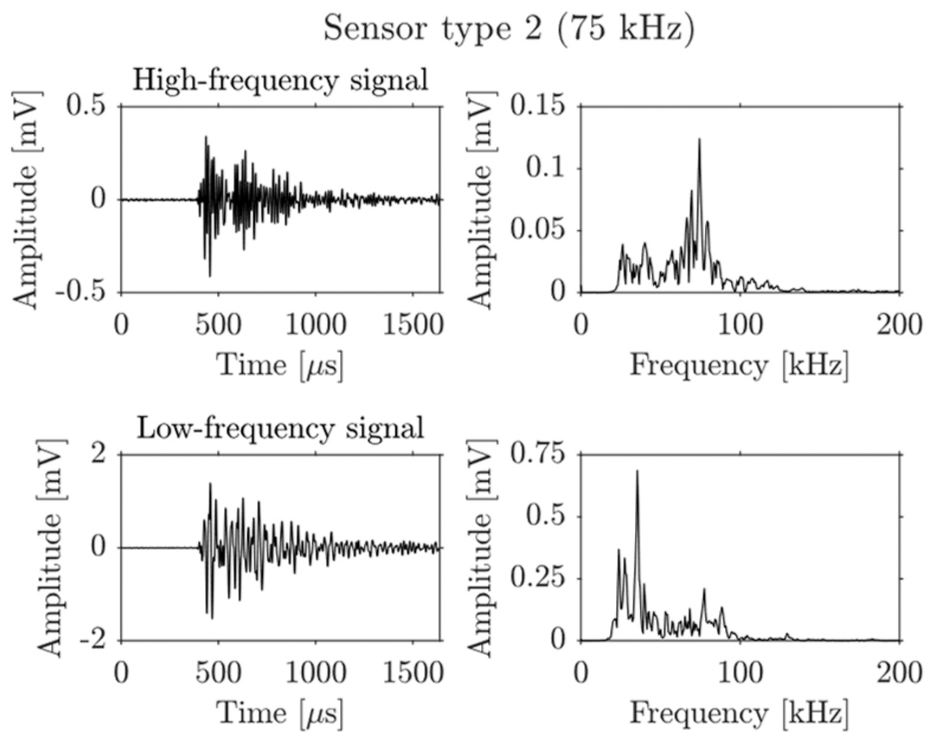
Typical signal waveforms in time domain (left) and frequency domain (right) for a high-frequency signal (top) and low-frequency signal (bottom), detected by sensor type 2 (75 kHz).
When comparing the two beams, beam B1-LC exhibited a larger proportion of high-frequency events than beam B2-HC, with the contrast being even more pronounced for sensor layout 2. This observation is consistent with previous findings. 14 The higher frequencies (200 kHz for sensor type 1 and 75 kHz for sensor type 2) are typically associated with early, small-scale damage processes such as micro-cracking, whereas the lower frequencies (50 and 30 kHz, respectively) are indicative of more advanced damage. It is acknowledged that the recorded frequency content reflects a combination of source characteristics and wave-propagation effects. In concrete, higher-frequency components are generally more susceptible to attenuation due to increased damage and scattering. It should be noted that for sensor layout 1 the difference between the beams is likely reduced due to the stronger attenuation of high-frequency signals.
1D AE localization
The filtered 1D AE localization results of both beams are shown in Figures 27 and 28. Figure 27 presents the results obtained with sensor layout 1 (100–400 kHz). Figure 28 presents the results of sensor layout 2 (75 kHz). In the same way of presenting the unfiltered results in Figures 14 and 15, each beam is divided into six elements, each having a width of 300 mm, further numbered from one to six from left to right along the length of the beams, as indicated in Figure 27. For each element, the total number of localized AE events per day is determined by summing all AE events localized within that element over the entire monitoring period and dividing this by the total monitoring time. These results are compared with the equivalent crack width and equivalent CL of each element, obtained at the end of the natural corrosion process.
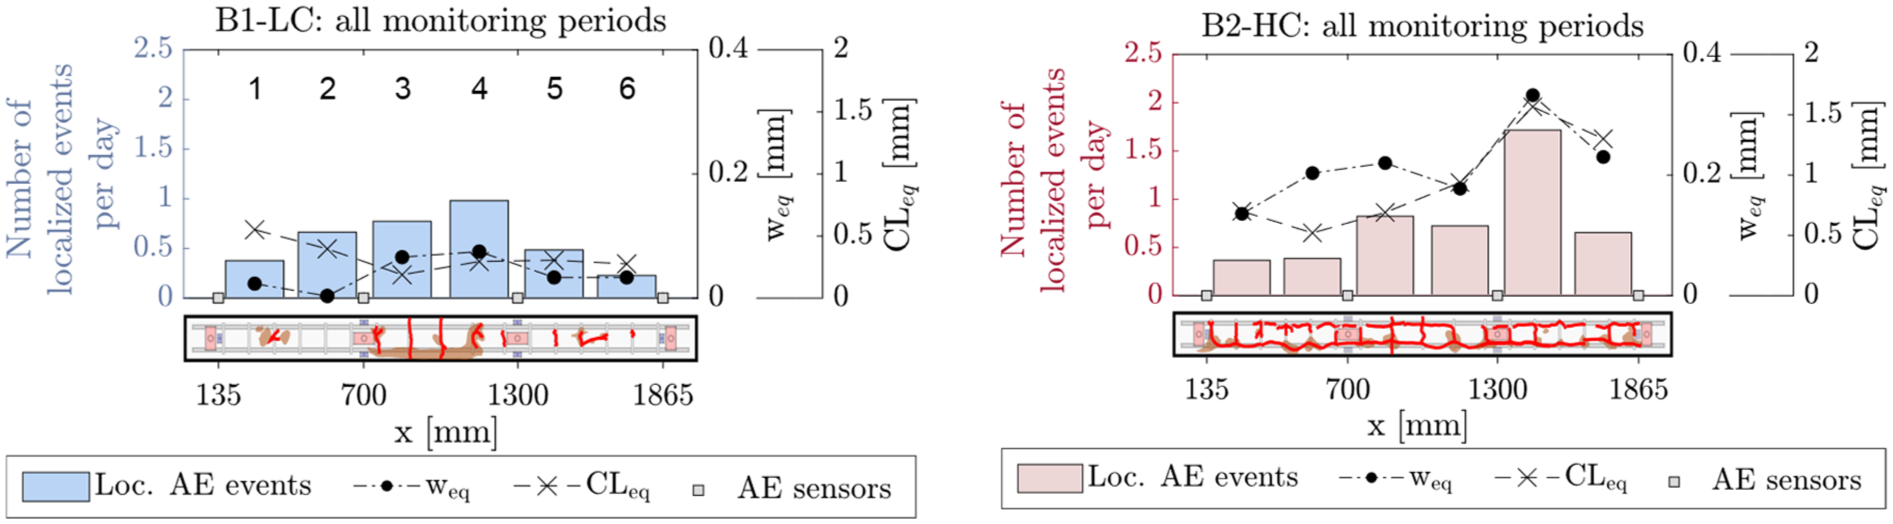
Filtered 1D localization result obtained with sensor layout 1 of beam B1-LC (left) and beam B2-HC (right) with indication of the equivalent crack width and CL. 1D: one dimensional; B1-LC: Beam 1-Low Corrosion; B2-HC: Beam 2-High Corrosion; CL: corrosion level.
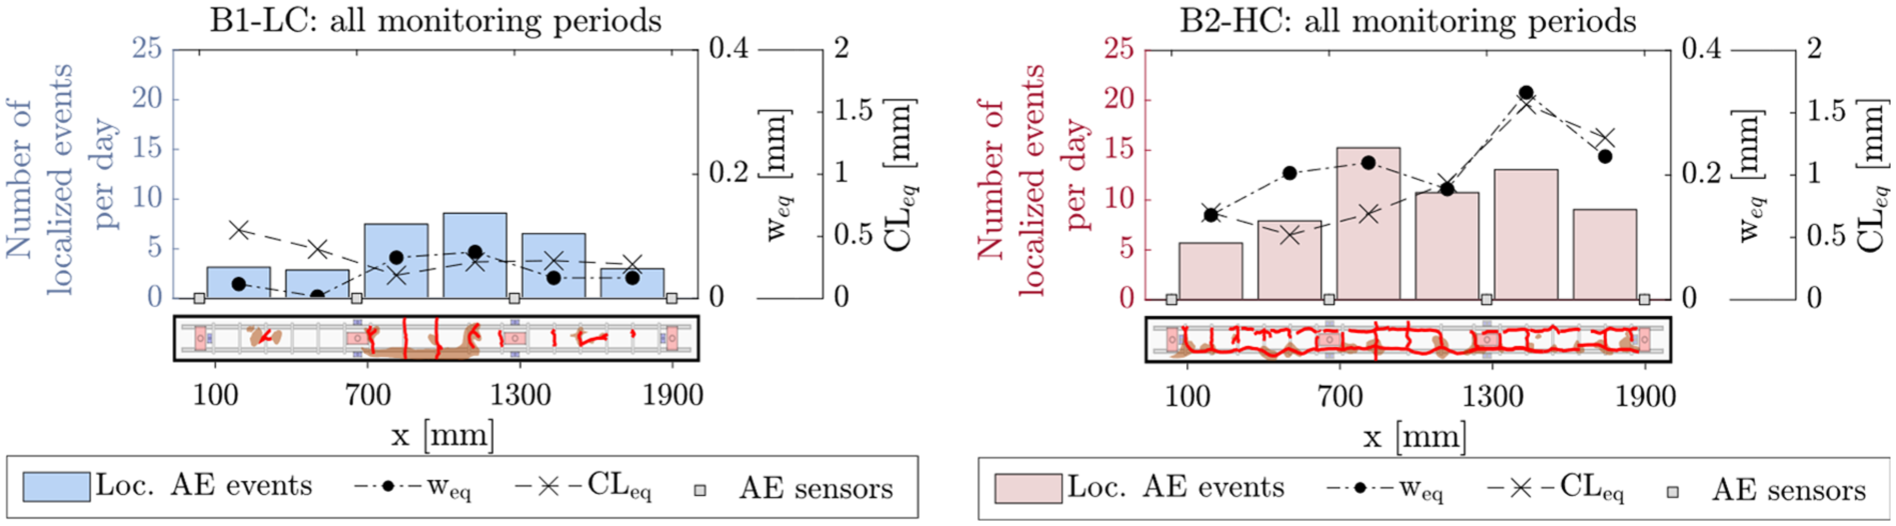
Filtered 1D localization results obtained with sensor layout 2 of beam B1-LC (left) and beam B2-HC (right) with indication of the equivalent crack width and CL. 1D: one dimensional; B1-LC: Beam 1-Low Corrosion; B2-HC: Beam 2-High Corrosion; CL: corrosion level.
In beam B1-LC, CLs are still small and seem not to correlate well with the surface crack width. It should be noted that the crack width contains information from the stirrups, whereas the CL is only determined by the mass loss of the longitudinal rebars. Moreover, corrosion damage is still mainly progressing near the rebar meaning that it remains invisible on the surface for the naked eye. Nevertheless, higher activity is observed at higher crack widths. This is valid for both sensor layouts. Sensor layout 1 seems more sensitive to early damage in elements 1 and 2 on the left (Figure 27), where the highest CLs were found, as more events were located in these elements compared to sensor layout 2 (Figure 28).
For beam B2-HC, the trends in equivalent crack width and CL align better: elements with lower CLs tend to show smaller crack widths, and vice versa. This is represented in the AE localization data. However, sensor layout 2 shows a rather high AE activity at element 3. This finding is further investigated.
The three-point bending test led to additional cracks in the middle region (elements 3 and 4) of beam B1-LC and an increase in crack width and minor spalling in beam B2-HC, especially in element 3 near the loading point. It was investigated whether the AE technique is influenced by this newly induced damage by comparing the AE localization results before and after the bending test. Figures 29 and 30 show the number of localized AE events per day for each element before (left) and after (right) the three-point bending test for B1-LC (top) and B2-HC (bottom). Figure 29 presents the results for sensor layout 1, whereas Figure 30 presents the results for sensor layout 2. The results are expressed per day to avoid unequal monitoring durations. Comparison is made with the difference in crack width. For the pre-test phase, the change in crack width measured between the start of monitoring and immediately before the load test is used. For the post-test phase, the change in crack width between measurements performed immediately after the load test and the end of the corrosion test is calculated.
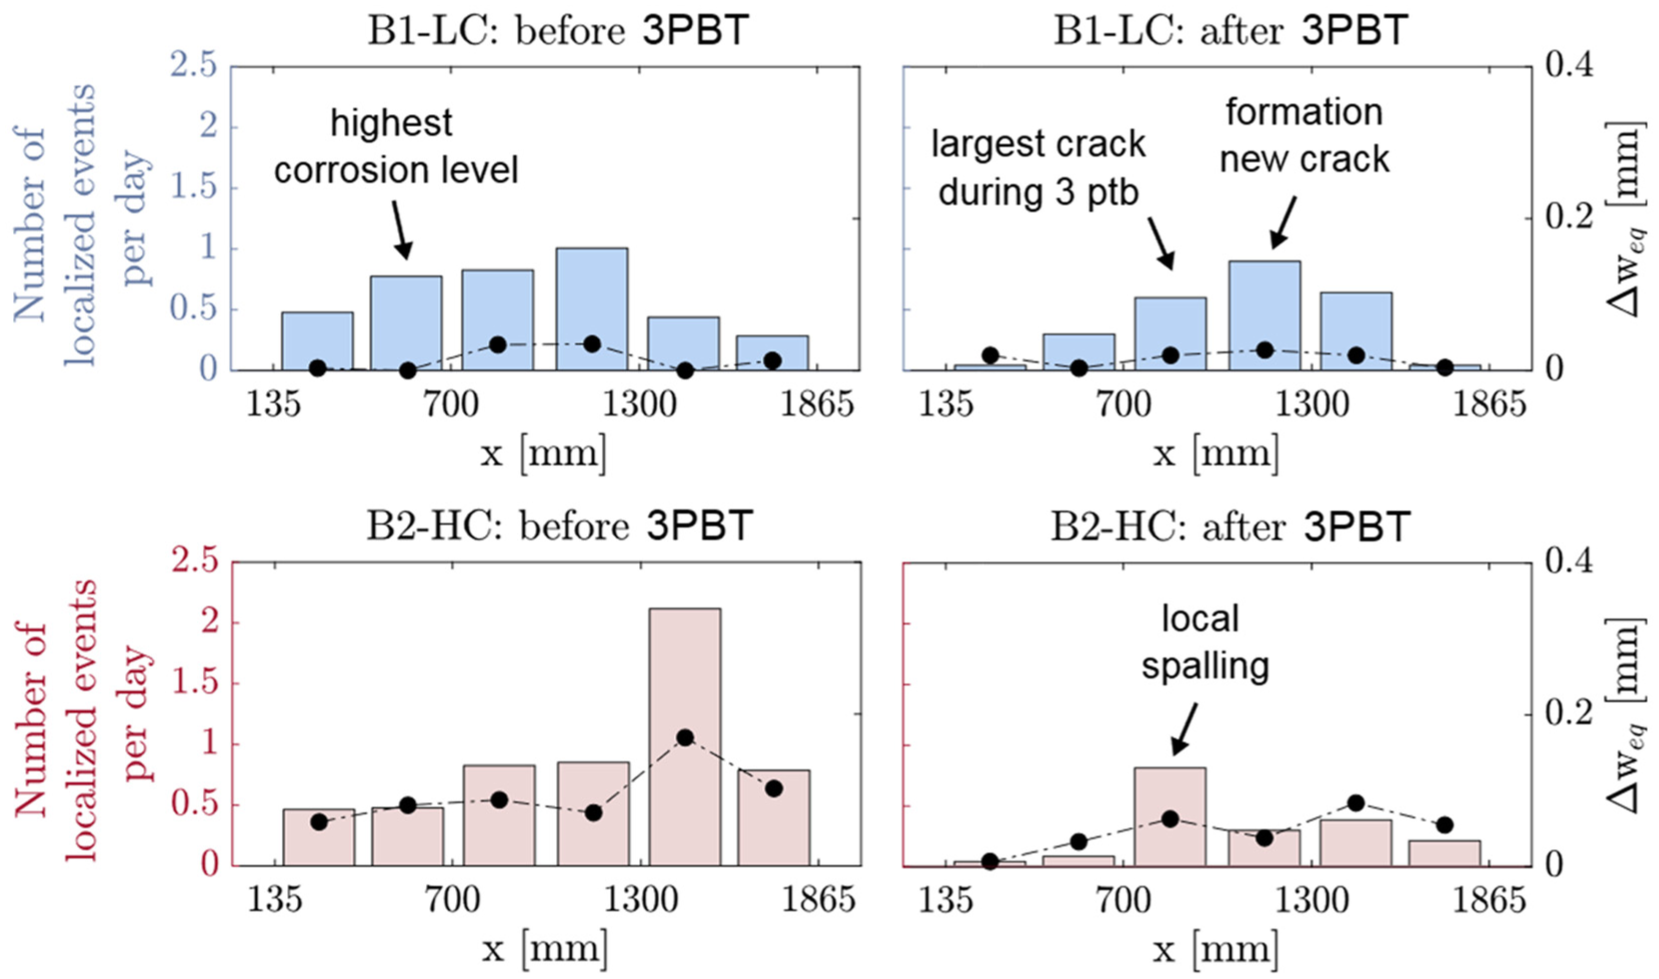
1D localization results before (left) and after (right) the three-point bending test for beams B1-LC (top) and B2-HC (bottom) obtained with sensor layout 1. 1D: one dimensional; B1-LC: Beam 1-Low Corrosion; B2-HC: Beam 2-High Corrosion.
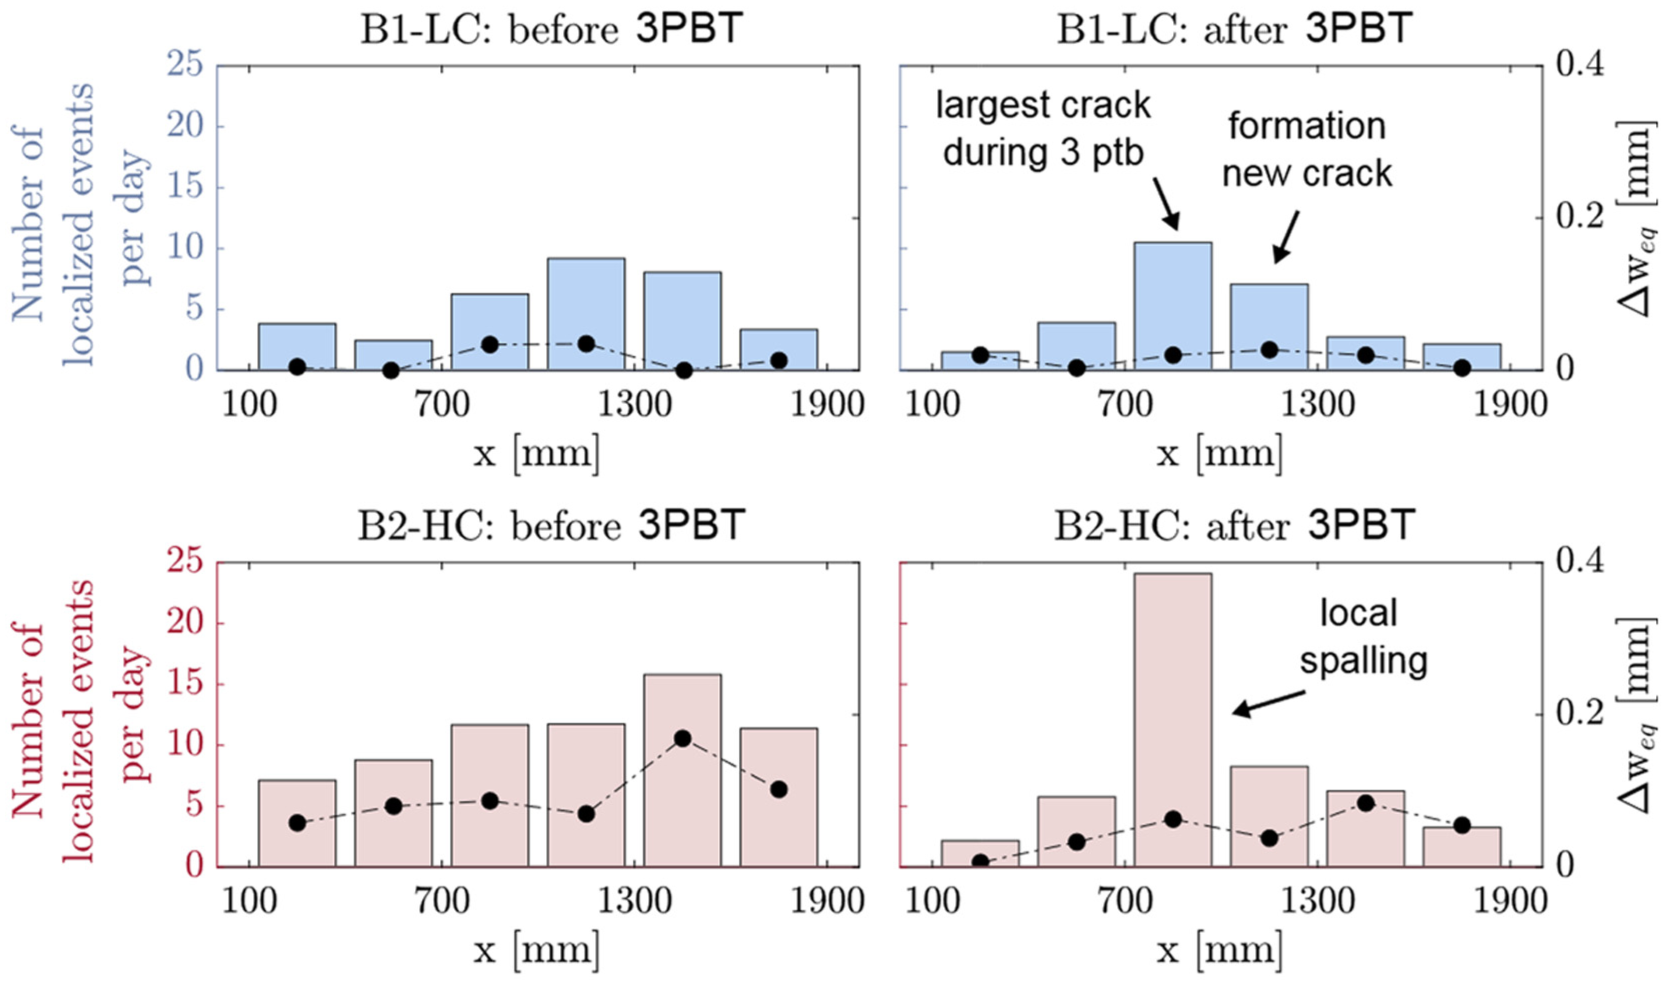
1D localization results before (left) and after (right) the three-point bending test for beams B1-LC (top) and B2-HC (bottom) obtained with sensor layout 2. 1D: one dimensional; B1-LC: Beam 1-Low Corrosion; B2-HC: Beam 2-High Corrosion.
For the results obtained for beam B1-LC with sensor layout 1 (Figure 29), most AE events are localized in elements 2, 3, and 4 before the load test. This is where more cracks or a high CL were observed. After the three-point bending test, a shift towards element 4 can be observed. This is the position where a new crack was formed. For sensor layout 2 (Figure 30), it can be seen that before the three-point bending test, most AE activity aligns with the largest crack width. These sensors seem less sensitive to sub-surface damage in element 2. After the test, most activity is detected in elements 3 and 4 where the largest cracks and new cracks were observed, respectively.
For B2-HC, both sensor types show similar trends before and after the three-point bending test. Before the test, most AE activity is located at the position of the largest crack width, obtained in element 5. After the test, element 3 shows significant AE activity. This is the position where small local spalling was observed due to the load test. Especially sensor layout 2 seems to be very sensitive to this.
2D AE localization
For sensor layout 1, 2D localization can be investigated as well. Figures 31 and 32 show the 2D localization results for respectively beam B1-LC and beam B2-HC. Most events are localized in the central region of both beams. This concentration can be attributed to the sensor layout. Four sensors fully cover the central region, increasing the likelihood of successful 2D localization in that area. In contrast, the outer zones are only covered by three sensors, which are less optimally positioned for accurate 2D localization. Consequently, the 2D localization results are considered most reliable in the central part of the beams. The analysis will therefore focus on this zone.
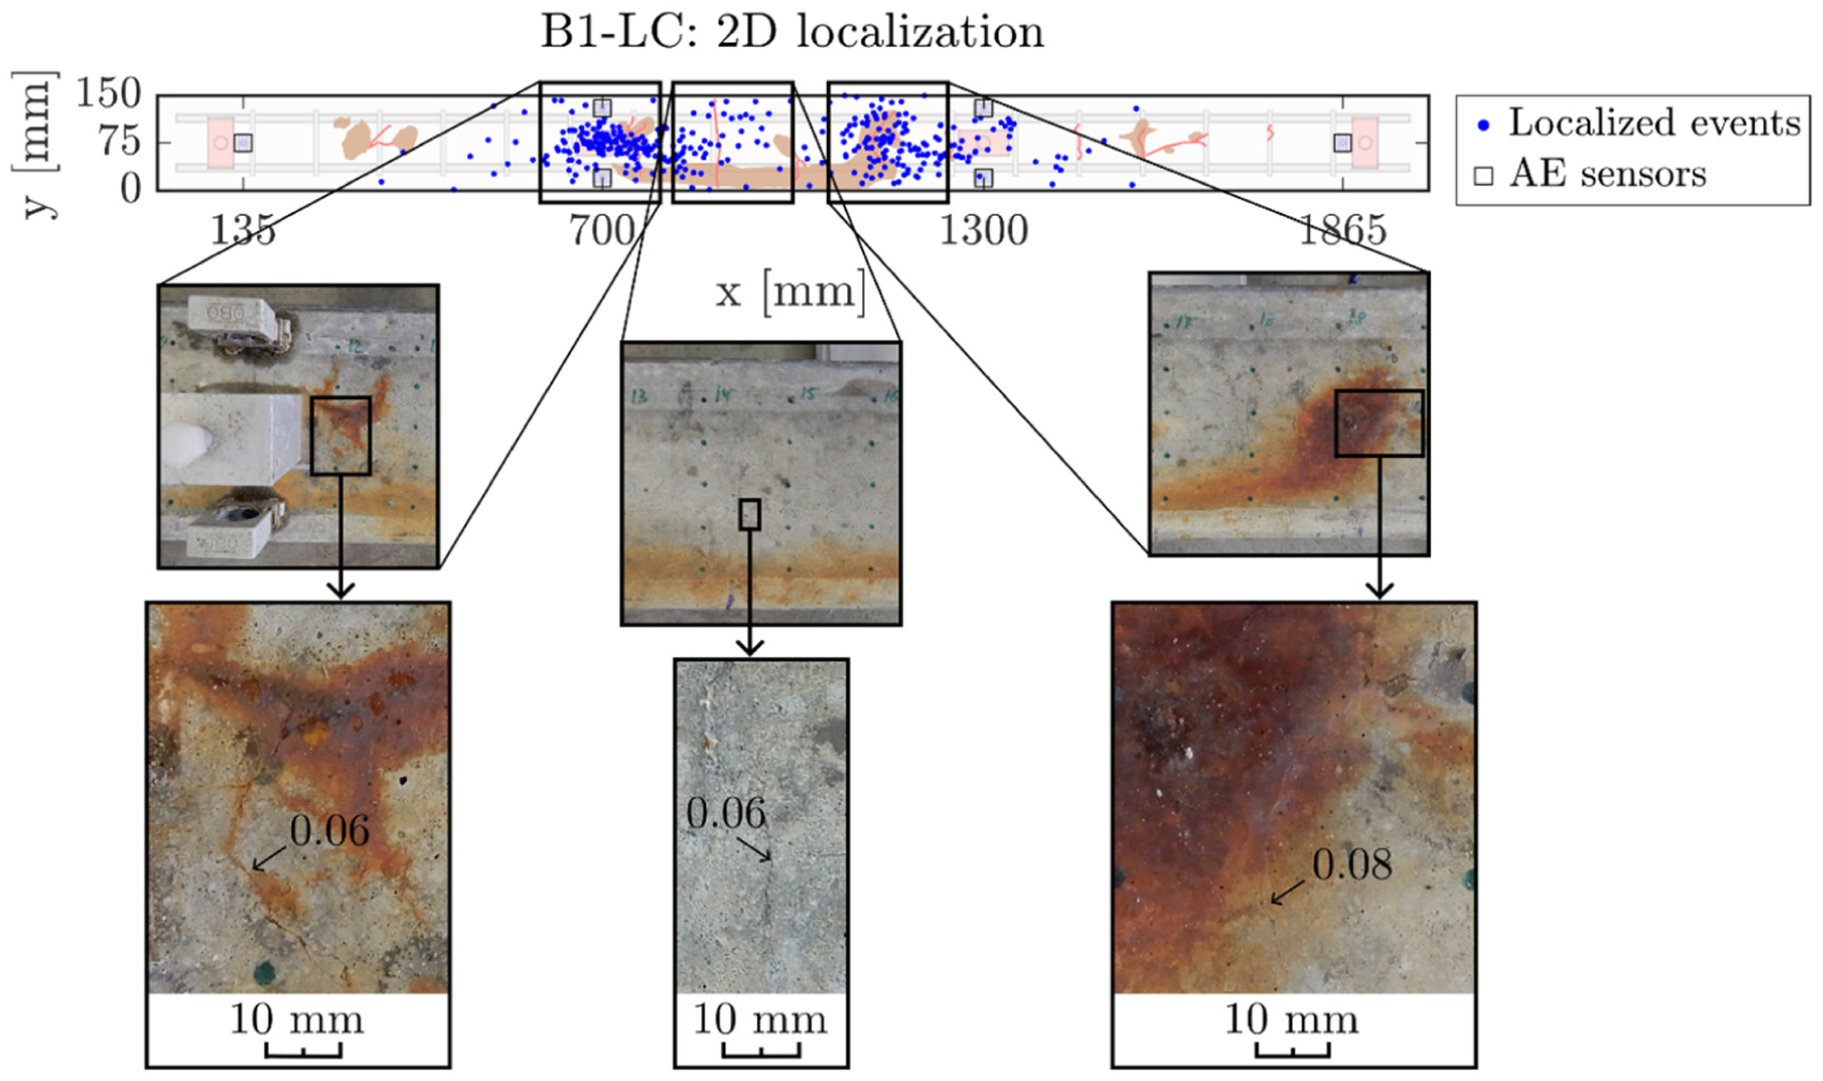
2D AE localization result of beam B1-LC with pictures of the concrete surface. 2D: two dimensional; AE: acoustic emission; B1-LC: Beam 1-Low Corrosion.
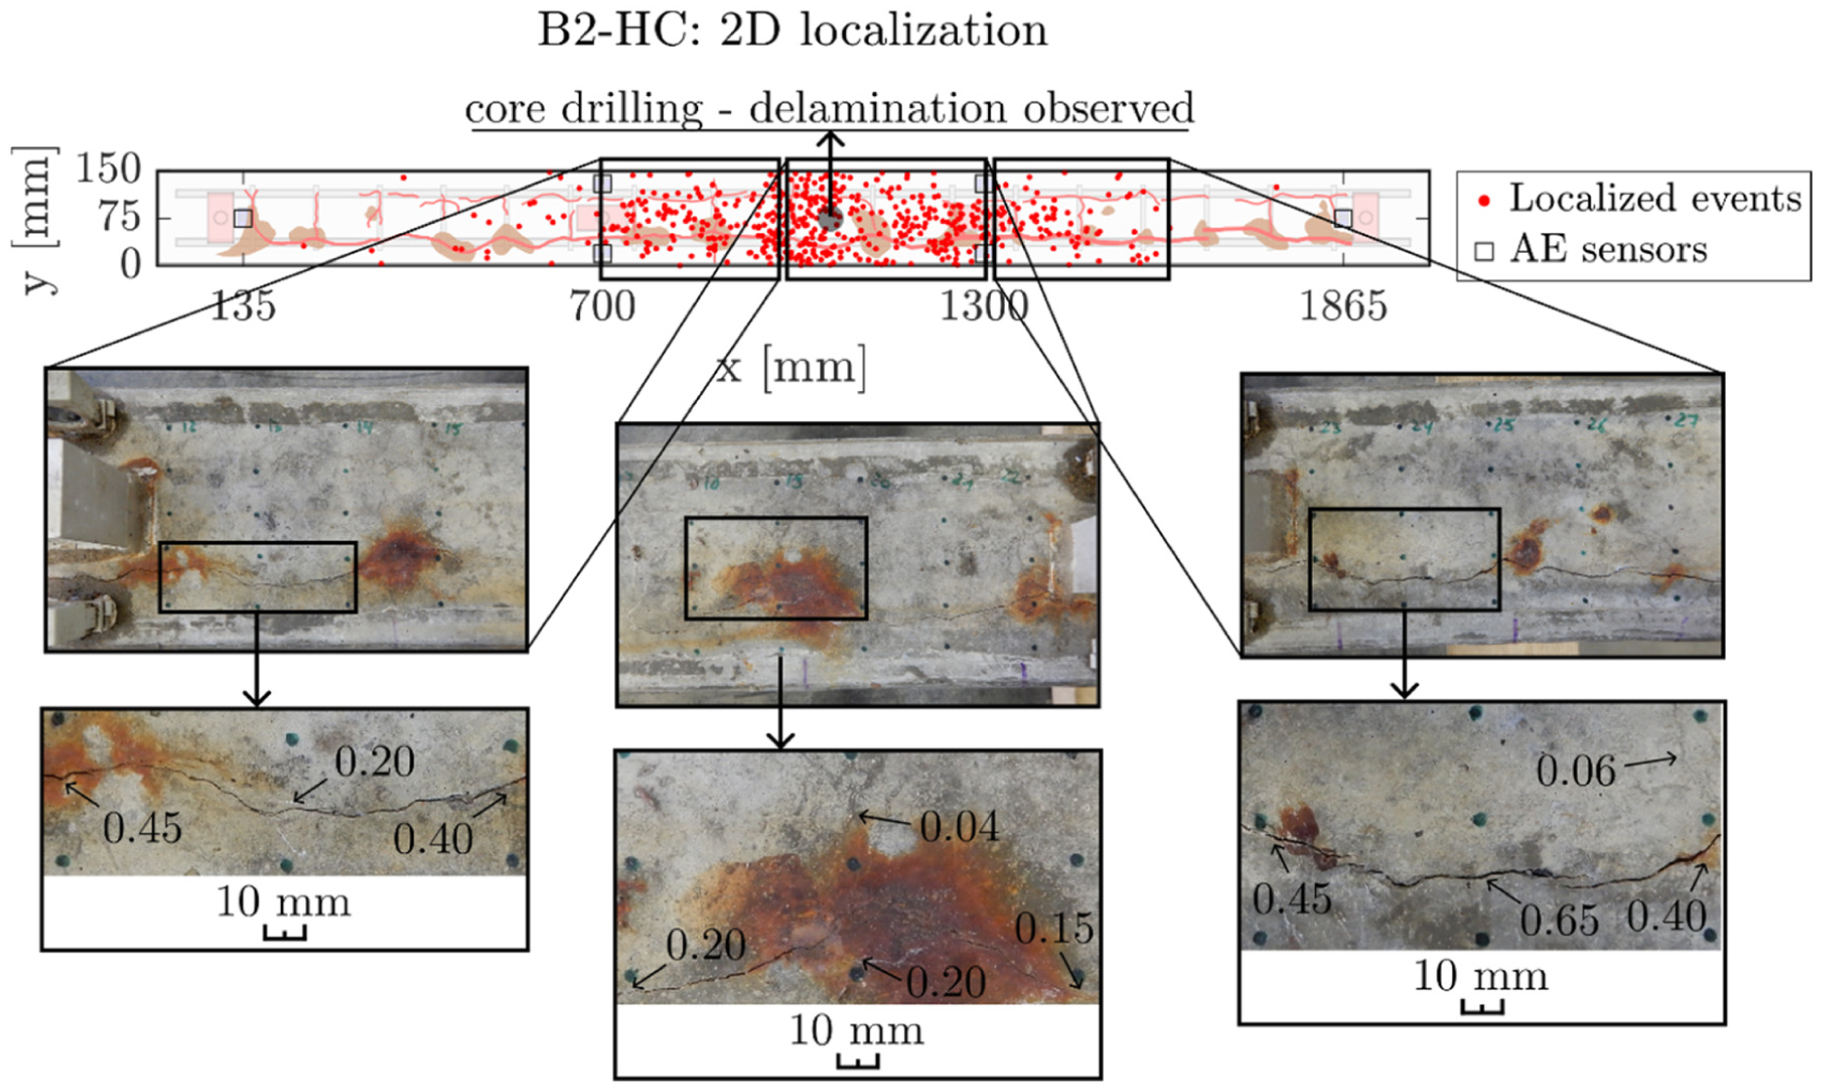
2D AE localization result of beam B2-HC with pictures of the concrete surface. 2D: two dimensional; AE: acoustic emission; B2-HC: Beam 2-High Corrosion.
For beam B1-LC, two distinct AE event clusters, one near sensors 2 and 3 and one on the left of sensors 4 and 5, are observed. These clusters correspond well with the visual inspection of the concrete surface where concrete cracking was observed at these locations. In beam B2-HC, AE events are more evenly distributed along the beam length, consistent with the presence of two longitudinal cracks observed during visual inspection. Especially in the middle of the beam, more AE events are located. At this position, a core was extracted between the two longitudinal rebars at the end of the test program. Subsurface delamination was observed at this location. The longitudinal cracks were found to have propagated underneath the concrete surface and had coalesced between the reinforcement layers.
AE-based CL estimation
Vandecruys et al. 23 developed a methodology to estimate the CL of longitudinal rebars in RC beams using AE sensing combined with selective crack measurements. The method was originally applied on RC beams with various dimensions, corrosion zones, and reinforcement layouts. The beams were all corroded in an accelerated manner, using a direct impressed current, while being continuously monitored with the AE technique. Promising results toward shorter monitoring periods were presented. A next step is to investigate whether this methodology can be extended to naturally corroded beams and periodic AE monitoring.
Description of the methodology
A schematic overview of the methodology is shown in Figure 33. The 1D localization results, where the beams were divided into six elements, are used for this purpose. A relative AE-based CL (AErel) is calculated by dividing the number of localized AE events in each element by the maximum number of AE events recorded in any element of the beam. In the element where the maximum relative AE-based CL (AErel = 1) is obtained, the corresponding crack measurements are used to calculate an equivalent crack width for this element.
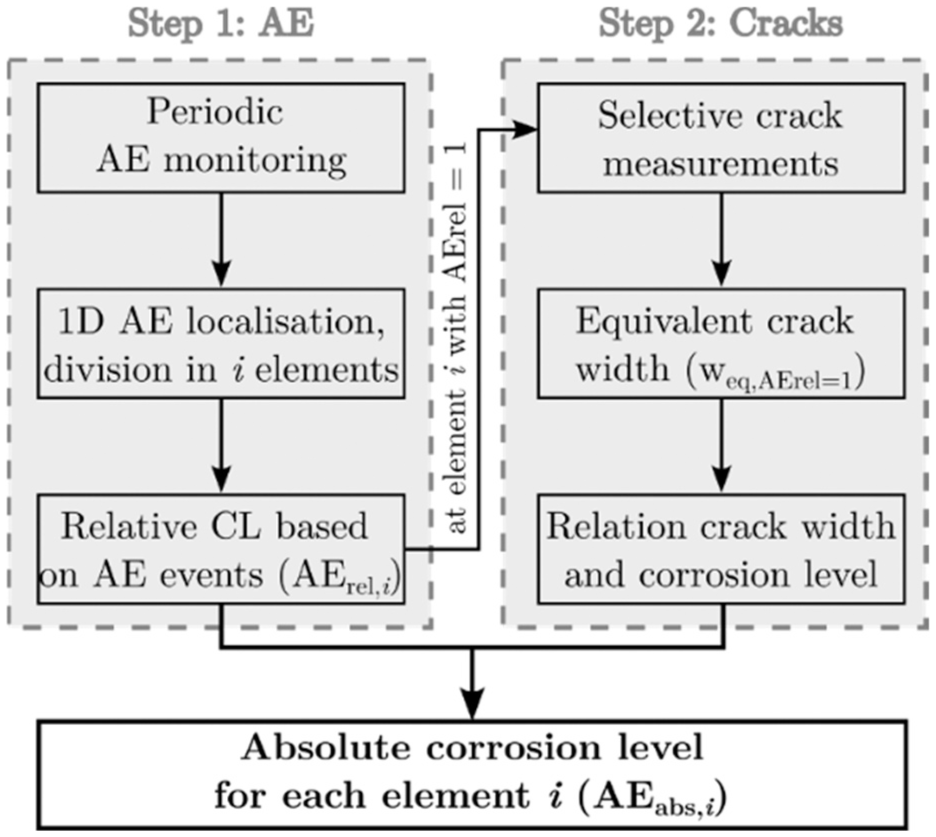
Schematic overview of the methodology for CL assessment based on AE measurements, adapted from the study by Vandecruys et al. 23 AE: acoustic emission; CL: corrosion level.
This equivalent crack width is then used in an empirical relation between crack width and CL to obtain the absolute CL for this element. Following relation is applied:

With
The above relation was originally proposed by Andrade et al. 44 It is based on regression analysis of a large experimental dataset obtained from accelerated corrosion tests with varying reinforcement layouts and material properties. The model captures the influence of geometric parameters, such as the cover-to-diameter ratio, and material properties, such as concrete tensile strength, on corrosion-induced crack development.
The constants in the equation (5.33, 1.205, 0.67, and 0.78) are empirical fitting parameters that describe the statistical relation between crack width and CL. In this study, the values proposed by Martens et al. 29 are adopted, which were obtained through Bayesian updating based on extensive experimental data. 45 This updating procedure refines the model parameters while preserving the original formulation proposed by Andrade et al. 44
It should be noted that this model is derived from accelerated corrosion tests as equivalent relations based on natural corrosion tests remain limited in the literature. However, the datasets include tests performed at relatively low current densities (below 100 μA/cm2), which are considered more representative of natural corrosion processes. Furthermore, as mentioned before, the model incorporates variations in reinforcement layout and concrete properties, which are known to influence corrosion-induced cracking, and are often simplified in other approaches. This provides additional justification for its use in the present study.
The absolute CL for the remaining elements is derived by scaling the relative AE-based CL with the maximum absolute CL:

Results AE-based CL estimation
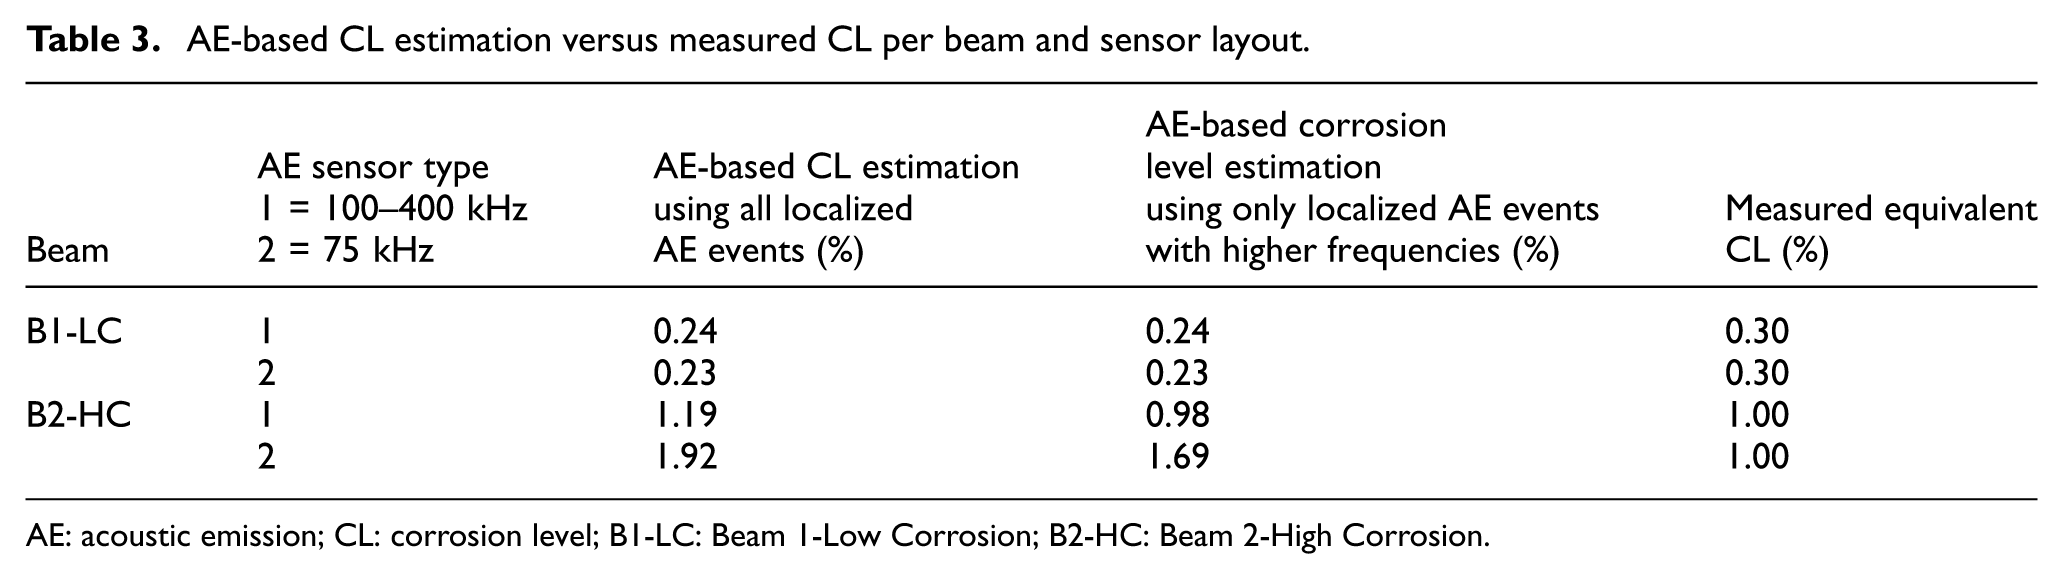
Figures 34 and 35 present the AE-based CL estimations for sensor types 1 and 2, respectively. The mean values per beam are summarized in Table 3. It should be noted that the AE data used for the CL estimation corresponds to the period before the three-point bending test. The subsequent monitoring period after mechanical loading was limited, and the additional corrosion occurring during this stage is therefore considered small relative to the total CL. As a result, the influence of mechanically-induced cracking on the presented CL estimations is expected to be limited.
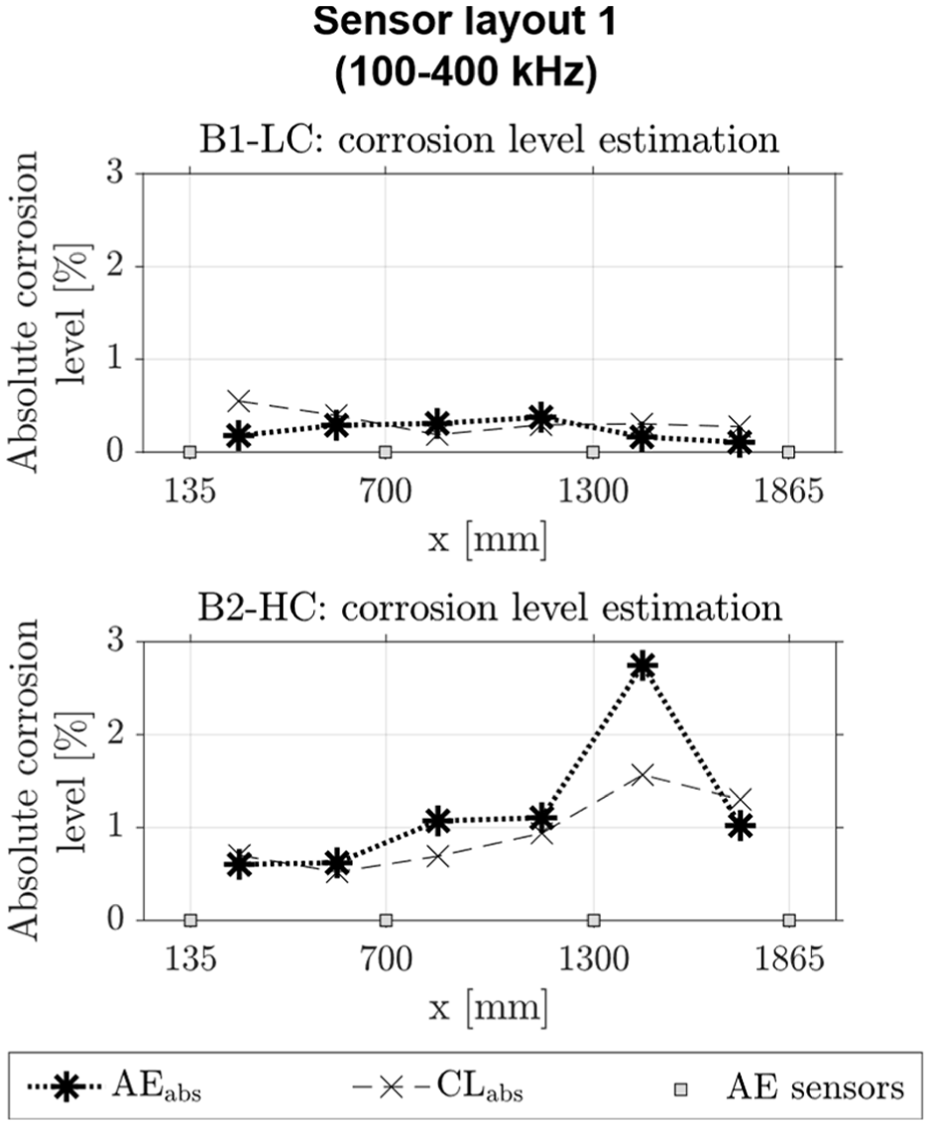
Comparison between the predicted AE-based absolute CL (AEabs) and the measured absolute CL (CLabs) for sensor set 1 (100–400 kHz). AE: acoustic emission; CL: corrosion level.
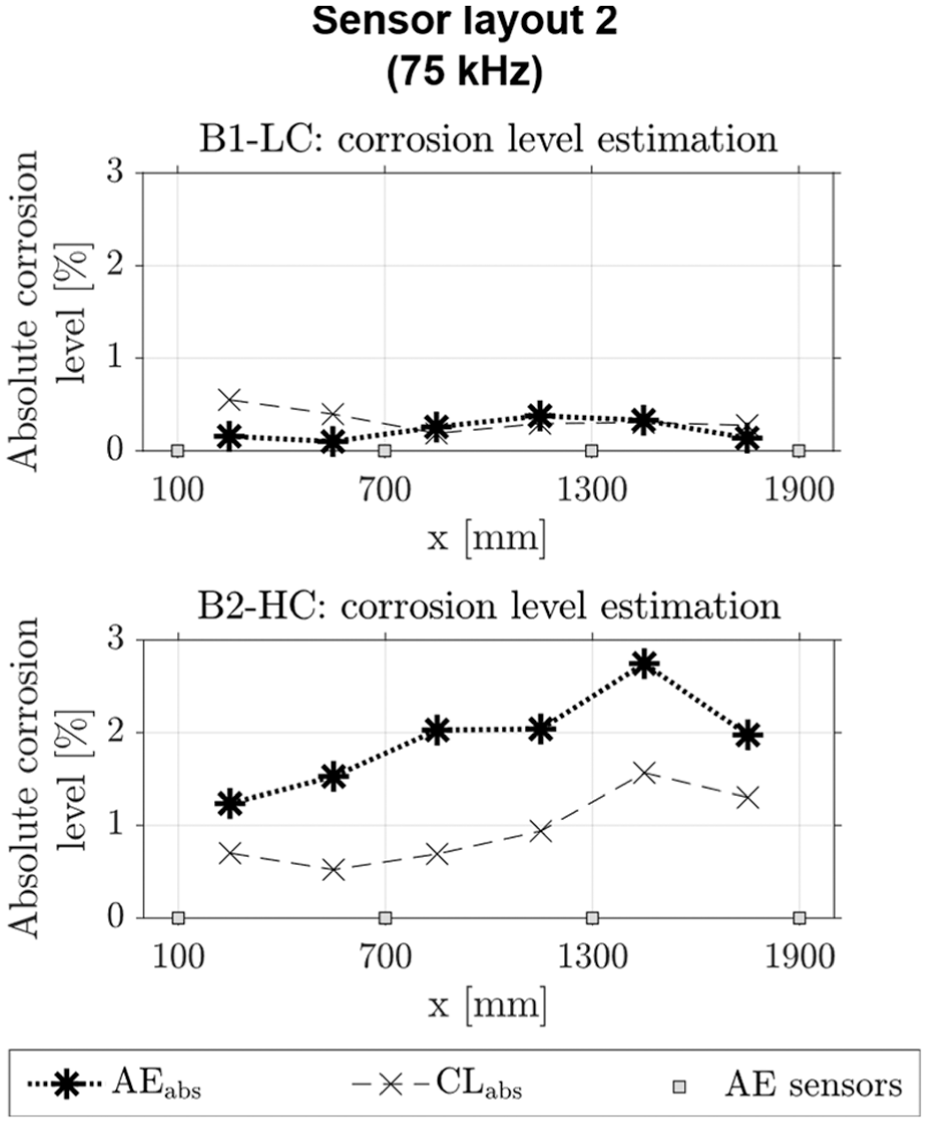
Comparison between the predicted AE-based absolute CL (AEabs) and the measured absolute CL (CLabs) for sensor set 2 (75 kHz). AE: acoustic emission; CL: corrosion level.
AE-based CL estimation versus measured CL per beam and sensor layout.
AE: acoustic emission; CL: corrosion level; B1-LC: Beam 1-Low Corrosion; B2-HC: Beam 2-High Corrosion.
For beam B1-LC, the AE-based CLs are in good agreement with the measured CLs of the longitudinal rebars. Note that the applied relation between crack width and CL from the literature was derived for longitudinal cracks associated with corrosion of the longitudinal reinforcement.29,44 When such relations are directly applied to beam B1-LC, the absence of longitudinal cracking would lead to an estimated CL close to zero, despite clear indication of ongoing corrosion activity. For early corrosion stages, surface cracking is mainly caused by corrosion of the stirrups, while corrosion of the longitudinal bars does not lead to visible damage yet. Therefore, for this beam, it is important to have included the crack width measurements at the location of the stirrups when defining the equivalent crack width, as presented in the third section. Restricting the damage index to longitudinal cracks alone would have largely underestimated the actual damage level of the beam.
For beam B2-HC, an overestimation is observed for element 5 with sensor type 1. For sensor type 2, a global overestimation can be observed for this beam. AE-based CLs are based on the equivalent crack width measured in element 5 where crack widths reached up to 0.7 mm.
As discussed before, two distinct peak frequencies were observed, both when using sensor types 1 and 2, with the higher frequencies being related to the corrosion process and lower frequencies to concrete macro-cracking. When only the higher frequencies are taken into account, the global estimation of the CL improves, for the more deteriorated beam B2-HC, as shown in Table 3. A larger portion of AE signals of B2-HC originates from concrete cracking. By only taking into account higher frequencies, corresponding to signals from corrosion and micro-cracking, a better estimation of the CL is obtained. Nevertheless, it should be noted that the applied crack width-CL relation is calibrated on accelerated corrosion test data. However, in the current test setup, the beams underwent a combination of accelerated and natural corrosion. Therefore, improvement of the results may be possible by using an alternative crack width-CL relation.
In general, it should be noted that the crack width-CL relation used in this study (Equation (4)) is empirical and derived from a specific set of experiments. As such, the model parameters are influenced by factors including concrete composition, reinforcement layout, and exposure conditions, and cannot be assumed to be universally applicable. Consequently, the estimated CLs should be interpreted as approximate values rather than exact predictions. Additional work is required focusing on defining such relations for natural corrosion tests, which may give an even more realistic estimation.
However, the proposed AE-based methodology is not dependent on this specific empirical relation. In the present study, the aim is not to validate or generalize existing crack width-CL relations, but to demonstrate the potential of the proposed AE-based methodology to estimate absolute CLs. Compared to AE localization alone, which mainly provides relative information on damage distribution, the applied methodology enables a quantitative interpretation of the CL. As mentioned before, the selected relation was adopted from the literature as it accounts for key influencing parameters such as reinforcement geometry and material properties, and therefore represents a more comprehensive formulation compared to simpler crack width-corrosion relations. Despite the limitations of the empirical model, the use of such relations provides a useful link between AE measurements and corrosion indicators, allowing the methodology to extend beyond qualitative or relative assessments.
Conclusions
This paper investigated the application of periodic AE monitoring during slow, natural corrosion of two pre-damaged RC beams. The beams were stored outside, meaning that higher noise levels, which are representative for on-site conditions, were present. Two sensor types were evaluated: one typically used in laboratory environments, and one more suitable for field application. The following key findings were observed:
- Consideration of environmental noise: Several noise sources are present in outdoor environments. Especially, the presence of wind influenced the AE detection within the current experimental program. To distinguish genuine damage-related activity from environmental artifacts, AE data were systematically compared with nearby and on-site weather station readings, providing insight into potential noise sources. Based on these observations, a dedicated filtering approach was developed to isolate reliable signals from ongoing damage while minimizing noise interference.
- Effectiveness of periodic monitoring: For the considered frequency and duration of periodic AE monitoring within this paper, valuable insights in damage level of the two beams were obtained. To compare periodic AE data and discrete crack width measurements, AE event rates and crack width rates were calculated, which allowed to differentiate the damage level of the beams. Localization results in 1D and 2D support the visually observed damage levels.
- Sensor type: Both sensor types allow detection and localization of corrosion-related damage. Sensor type 1 (100–400 kHz) seems to be more sensitive to earlier, non-visible corrosion damage, whereas sensor type 2 (75 kHz) seems more sensitive to macro-cracking. This is of course related to their frequency spectrum.
- Monitoring of natural corrosion processes: While the literature predominantly focuses on AE monitoring during accelerated corrosion, the presented results demonstrate the technique’s applicability to natural corrosion processes.
- Quantification of AE results: A methodology was applied to estimate the CL based on AE localization, which was developed on accelerated corroded beams during continuous AE monitoring. The CL can be determined based on AE data. When only higher frequencies are taken into account, the global estimation of the CL improves for the highly damaged beam with surface cracks.
The presented findings prove the effectiveness of periodic AE monitoring for reinforcement corrosion assessment in RC structures. However, questions remain on the frequency and duration of AE monitoring periods, which was not within the scope of the current paper. Future work will focus on further upscaling toward field application.
Footnotes

Funding
The author disclosed receipt of the following financial support for the research, authorship, and/or publication of this article: This study was financially supported by Research Foundation-Flanders (FWO) for the postdoctoral mandate of C. Van Steen (grant number 12ZD221N).
Declaration of conflicting interests
The authors declared no potential conflicts of interest with respect to the research, authorship, and/or publication of this article.