






Abstract
With the wide application of composite materials in critical load-bearing structures, various damages with complex distribution and forms are prone to occur in the service process. Because of the significant differences in signal characteristics of different damages and the limited number of samples, it is a severe challenge to realize high-precision damage location and quantification. To solve this problem, this article proposes a damage location and quantification method of composite stiffened plates based on conditional variational autoencoder (CVAE) together with hierarchical feature fusion and multi-domain adaptation. Specifically, CVAE is first used to perform structured data expansion on finite Lamb wave signals to construct a high-fidelity training dataset, which effectively relieves the constraint of data scarcity on the model performance. Secondly, a feature extraction network integrating the Inception module and the multi-head attention mechanism is designed to capture the hierarchical and multi-scale features of damage signals and fuse local-global information, and simultaneously predict the damage location and damage size under the multi-task learning framework, so as to promote information sharing and collaborative optimization among tasks. Finally, the unsupervised domain adversarial neural network mechanism is introduced, and the unsupervised adversarial optimization of cross-domain feature distribution is realized through the feature alignment between the source domain and the unlabeled target domain, so that the model still has excellent robustness and generalization performance under unseen location and cross-domain conditions. The results demonstrate the effectiveness and superiority of the proposed method in damage localization and quantification, which provides an efficient and reliable solution for intelligent health monitoring of composite stiffened plates.
Keywords
Introduction
Advanced structures in various engineering fields are increasingly moving toward lightweight and high performance. Owing to their high specific strength, stiffness, and strong design flexibility, composite materials have become a key material in modern structural applications. 1 However, these structures are often subjected to the coupled effects of multiple factors such as impact loads, fatigue cycles, and thermal environment during service, and it is easy to produce several internal damage modes such as debonding, delamination, cracking, and fiber breakage,2,3 which are difficult to detect visually and pose great challenges to structural health monitoring (SHM). 4
Among numerous SHM techniques, Lamb wave-based methods have attracted extensive attention due to their long propagation distance, high sensitivity to minor damage, and capability for large-area monitoring. 5 Damage encountered during Lamb wave propagation can lead to wave scattering, transmission and conversion between modes, 6 which will cause changes in propagation speed, phase and peak amplitude. 7 Therefore, damage identification can be achieved by extracting these features. 8 Existing Lamb wave-based damage detection methods can be broadly classified into two categories: (1) feature extraction methods grounded in physical modeling and signal analysis and (2) data-driven intelligent learning approaches. The former relies on solving wave propagation equations or analyzing features such as group velocity and time-of-flight for damage localization and quantification. Typical techniques include time delay 9 and time reversal 10 methods in the time domain, and wavelet transform, 11 Hilbert transform, 12 and MUSIC algorithm 13 in the frequency domain. These methods possess strong physical interpretability but require high computational cost and rely heavily on simplified assumptions, especially when facing multimodal interference and complex structural configurations. 14 In composite stiffened structures, the existence of stiffeners will lead to significant mode conversion and scattering during Lamb wave propagation, which makes the analysis of signal propagation characteristics more complicated and the damage response characteristics show obvious nonlinearity and regional differences, which significantly increases the applicability and scalability of traditional methods.
Motivated by the limitations of traditional methods based on physical modeling, such as strong dependence on prior models and poor scalability, data-driven intelligent machine learning (ML) methods have attracted considerable interest in SHM. 15 These methods establish a direct mapping model from the measured signal to the structural state, which can automatically extract the hidden features from the Lamb wave signal to realize the damage location and quantification. 16 Early ML methods, such as support vector machine,17,18 decision tree, 19 random forest, 20 and artificial neural network 21 achieved preliminary progress in damage identification. However, their shallow architectures limited their ability to extract high-level temporal features, resulting in weak adaptability to complex conditions. With the rise of deep learning (DL), researchers began to introduce a deeper network for feature learning, which enabled the model to fully mine the time-series dependence and feature evolution law in the signal, thus improving the accuracy of damage identification.22,23 Various network architectures have been used in damage classification and regression tasks: Azad et al. 24 compare the performance of adversarial neural network (ANN), convolutional neural network (CNN), and gated recurrent unit (GRU) models in damage localization of composite materials. Luo et al. 25 propose a Bayesian neural network-based end-to-end model for composite plate localization. Tong et al. 26 achieve high-precision damage localization of composite material plates through an long short-term memory (LSTM) model and an improved loss function. Xu et al. 27 use nonlinear Lamb wave signals combined with attentional convolutional networks to achieve precise localization of fatigue cracks. Sikdar et al. 28 convert Lamb wave signals into time-frequency scale images and input them into CNN to achieve automatic identification of breathing debonding in stiffened structures. In addition, some hybrid architectures have been proposed, where Rizvi et al. 29 combine bi-directional long short-term memory (BiLSTM) with autoencoder to achieve anomaly detection in composite structures. Li et al. 30 realize the unknown damage identification and classification of carbon fiber reinforced plastics (CFRP) based on time convolutional network and gated recurrent unit (TCN-GRU). Du et al. 31 fuse CNN and LSTM to discriminate damage levels under low-speed impact based on lead zirconate titanate (PZT) response signals.
Although DL has improved the ability of intelligent analysis of Lamb wave signals, its performance still depends on large-scale and high-quality data. However, practical data collection is constrained by cost, equipment complexity and sample imbalance, which leads to data scarcity and distribution deviations in model training. 32 To address this, some researchers have used finite element analysis simulations to generate synthetic sample simulations. For example, Wang and Qu 33 establish a dataset of debonding locations and lengths through 500 finite element simulations. Niu and Srivastava 34 train a CNN based on 2000 simulated ultrasonic signals. Kim et al. 35 construct 702 stiffened structure samples and implement debonding identification based on CNN. Although this method is feasible, it is time-consuming and may produce signals with statistical distributions different from real measurements, which still limits the generalization ability of the model.
Based on the existing research, although the DL methods show strong feature learning ability for Lamb wave-based damage identification, there are still three bottlenecks in the application of complex structures, especially composite stiffened structures:
(1) Sample scarcity and uneven spatial distribution
Lamb wave propagation is strongly influenced by structural heterogeneity, and experimental signal acquisition is difficult. As a result, the number of damage samples is limited and their spatial distribution is sparse. Insufficient training data prevents the model from learning complete damage characteristics, which leads to overfitting and a decline in prediction performance in unseen areas.
(2) Insufficient feature extraction and representation capabilities
The multi-mode interference and coupling effect of Lamb wave make the signal show strong nonlinear and multivariate characteristics. The single-scale convolution or traditional temporal networks struggle to capture both local details and global propagation patterns. The existing models have shortcomings in multi-scale and hierarchical feature expression and spatio-temporal feature correlation modeling, and it is difficult to achieve accurate location and quantification characterization of damage.
(3) Limitation of cross-domain generalization ability
There are significant differences in the distribution of Lamb wave signals between different spatial domains, which makes the identification performance of the model decline in unknown areas or unseen damage outside the source domain. How to realize the alignment of feature distribution between source domain and target domain and improve the robustness of cross-domain identification is a key problem that needs to be solved urgently.
In view of the above problems, three research ideas are put forward:
(1) Structured sample generation and expansion
Aiming at the issue of scarce experimental samples, the conditional variational autoencoder (CVAE) is used to model the damage signal in the latent space, which can generate high-fidelity samples that preserve the original signal feature distribution, thereby enhancing data diversity. This method effectively alleviates the constraints of small sample conditions while maintaining the physical consistency of the signal, thus improving the training stability and data diversity of the model in complex scenarios.
(2) Hierarchical and multi-scale feature fusion
To further strengthen the model’s capacity for feature extraction and representation of complex wave propagation modes, an Inception module is introduced to achieve parallel extraction of hierarchical and multi-scale convolutional features, and a multi-head attention (MHA) mechanism is combined to achieve dynamic fusion of local and global information. The spatial distribution characteristics and time evolution law of Lamb wave signal can be captured at the same time by constructing a multi-task feature extraction network, and the regression of damage location and size can be further realized.
(3) Domain adaptive cross-domain generalization
Aiming at the problem of inconsistent signal distribution between the source domain and the target domain, an unsupervised domain-ANN (DANN) based on gradient inversion layer is designed, and feature alignment is achieved through antagonistic learning, thus enhancing the robust identification and generalization ability of the model in different domains, different spatial locations and unseen damage conditions.
Therefore, this article proposes a multi-task damage identification method for situations with few samples, complex features, and cross-domain generalization requirements. First, CVAE is introduced to structured data expansion of Lamb wave signal for the composite stiffened plate, which solves the problems of difficulty in obtaining damage samples and uneven signal distribution. This method can effectively alleviate the limitation of limited samples on the performance of DL models while preserving the consistency of the physical characteristics of Lamb wave. Secondly, a multi-task regression network integrating hierarchical and multi-scale convolutional features and attention mechanisms is constructed to enhance the model’s feature learning ability. In the feature extraction stage, the Inception module is introduced, which extracts features from different receptive fields in parallel convolutional kernels to achieve hierarchical and multi-scale representation of Lamb wave signals. Subsequently, a MHA mechanism is used to further integrate local details and global information to enhance the feature capture of complex Lamb wave signals. The multi-task regression branch is designed at the output to simultaneously predict damage location (x and y coordinate values) and damage size to promote collaborative optimization among tasks and improve the overall consistency and accuracy of damage identification. Finally, an unsupervised domain adaptive module based on DANN is introduced to align features between the source and target domains, which enhances the model’s robustness and generalization performance in cross-domain and unseen damage scenarios. In summary, this article constructs an intelligent composite stiffened plate damage identification method with strong robustness and transferability, which provides a new technical path and theoretical reference for health monitoring of complex composite structures.
Data acquisition and processing of composite stiffened plates
Lamb wave is an elastic wave in thin plates, which has the characteristics of multi-mode, dispersion, and high sensitivity to minor damage. 36 In composite stiffened plates, its propagation is affected by anisotropy, local coupling, and boundary reflections. Stiffeners may cause its scattering, mode conversion, and multi-mode interference, so that the same damage will have different responses on different propagation paths. Therefore, how to effectively extract key damage features under such complex conditions is the core challenge in achieving high-precision damage localization and quantification.
Experimental design and data acquisition
The experimental setup is shown in the Figure 1. The specimen is a 500 × 500 × 2 mm composite stiffened plate made of T300-3K carbon fiber prepreg with [(0°/90°)5], and its parameters are shown in the Table 1. The plate consisted of a thin composite substrate and two T-shaped stiffeners: The horizontal flange (500 × 40 × 1 mm) is attached to the bottom surface and extends along the plate plane, while the vertical flange (500 × 1 × 40 mm) extends along the thickness direction, forming a T-shaped cross-section. T-shaped stiffeners and plate boundaries further induce reflection, scattering, and mode conversion, resulting in significant differences in time-of-flight, energy distribution, and local waveform characteristics for signals along different sensing paths, which increases signal complexity and makes damage identification more difficult.
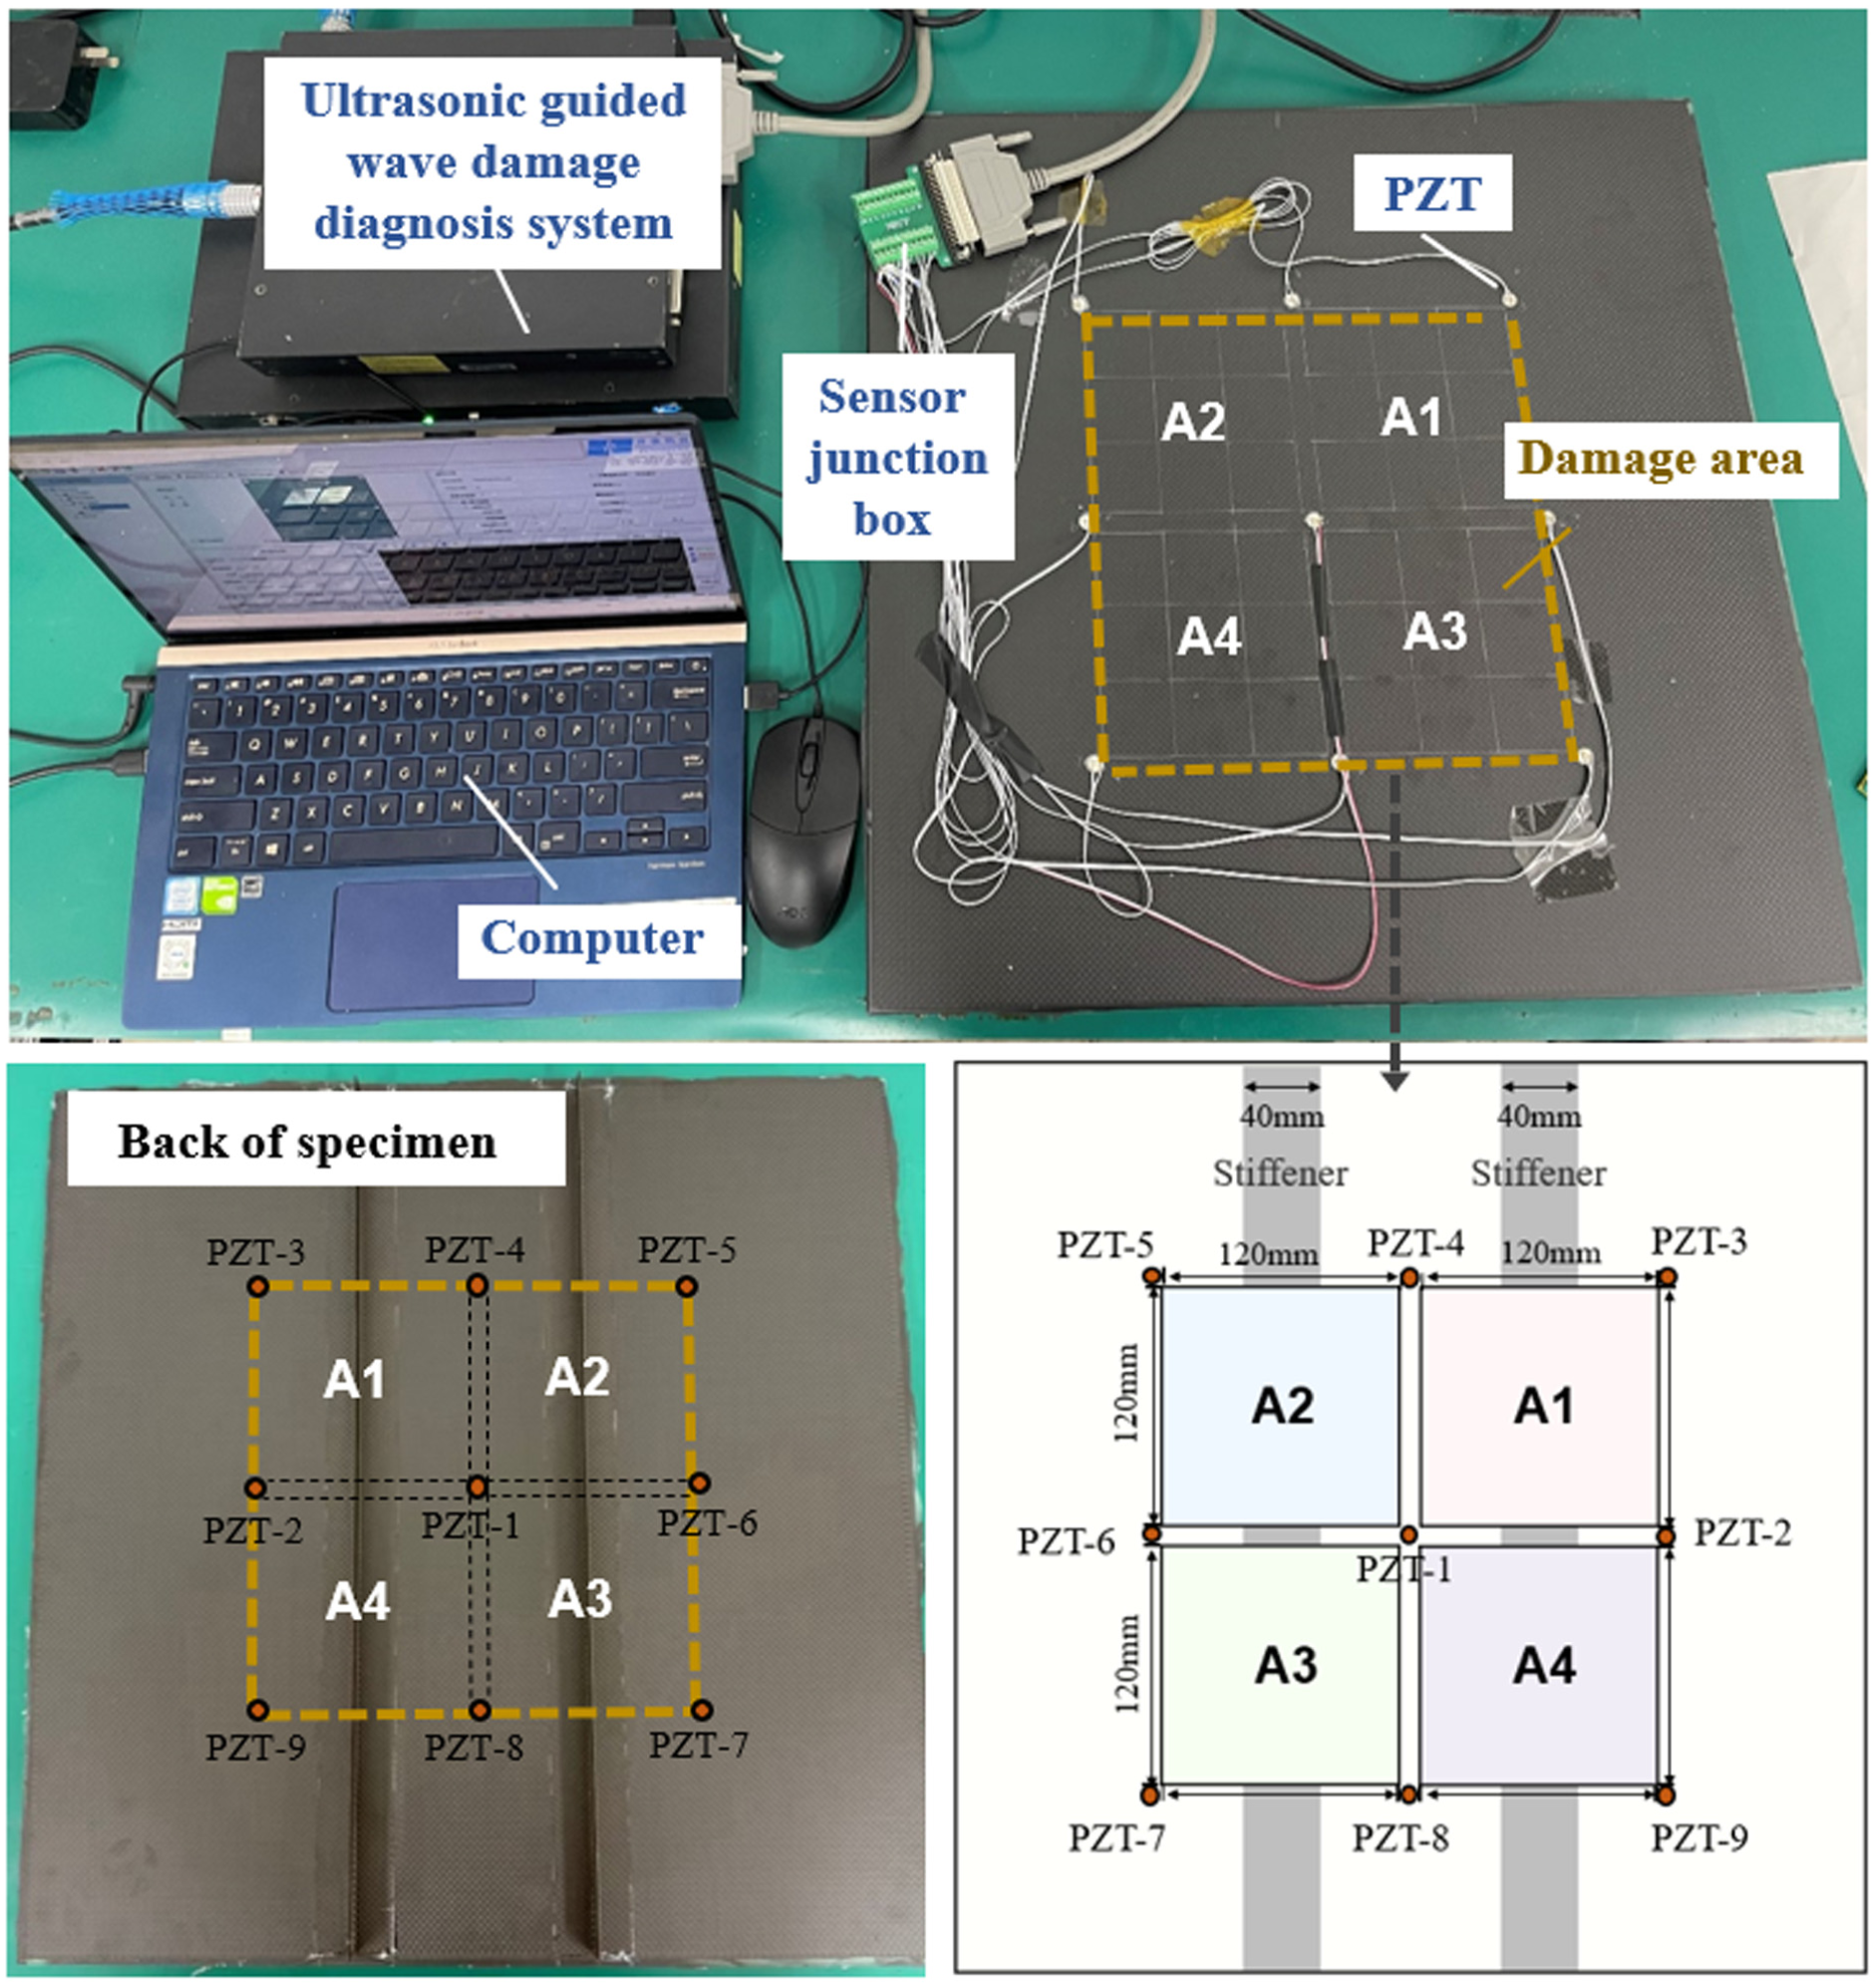
Experimental setup.
Typical material parameters of T300-3K.

The damage monitoring area is a 241 × 241 mm square, with nine lead zirconate titanate sensors (named PZT1-PZT9) arranged to form a planar array sensor network. This area is further divided into four sub-areas (A1-A4) to facilitate feature analysis and cross-domain modeling. Two T-shaped stiffeners along the vertical direction on the back of the plate correspond to the center boundaries of A1-A2 and A3-A4, that is, the stiffeners run through the geometric center of each sub-area.
Each sub-area contains four PZTs, which take turns acting as actuators and receivers to perform excitation-response measurements, forming 12 independent signal propagation paths. Twenty-four damage locations and six damage sizes are set (10, 15, 20, 25, 30, and 35 mm) in each sub-area. Among them, the damage is simulated by attaching aviation-grade sealing putty of different sizes on the surface of the structure. Data-driven methods need enough damage samples, but the introduction of real damage is usually irreversible. It is very expensive to construct real damage samples with different locations and sizes on the specimen. Therefore, in SHM based on Lamb wave, the method of adding additional materials (such as putty, tape, mass blocks, etc.) is commonly used to simulate damage states. This method changes the mechanical impedance and energy distribution in local areas, which leads to the scattering, attenuation, and phase change of Lamb waves. Its influence on Lamb wave propagation characteristics is somewhat similar to area-type damage, such as delamination and debonding.
Before the formal experiment, a frequency sweep experiment is conducted to compare and analyze the propagation stability, signal-to-noise ratio, and sensitivity to damage of Lamb wave signals at different excitation frequencies. Compared with other frequency conditions, 80 kHz achieved a good balance between damage sensitivity, propagation attenuation, and waveform stability. Therefore, a five-cycle sine pulse with a central frequency of 80 kHz is used as the excitation signal, while data are acquired at a sampling rate of 6 MHz with 2000 sampling points.
The dataset acquisition diagram is shown in Figure 2. The training set consists of data from 24 preset locations in A1 with six damage sizes for feature learning and model optimization. The test set is divided into test-A (seen locations) and test-B (unseen locations) to evaluate spatial generalization and cross-domain robustness.
(1) Test-A: Seen locations
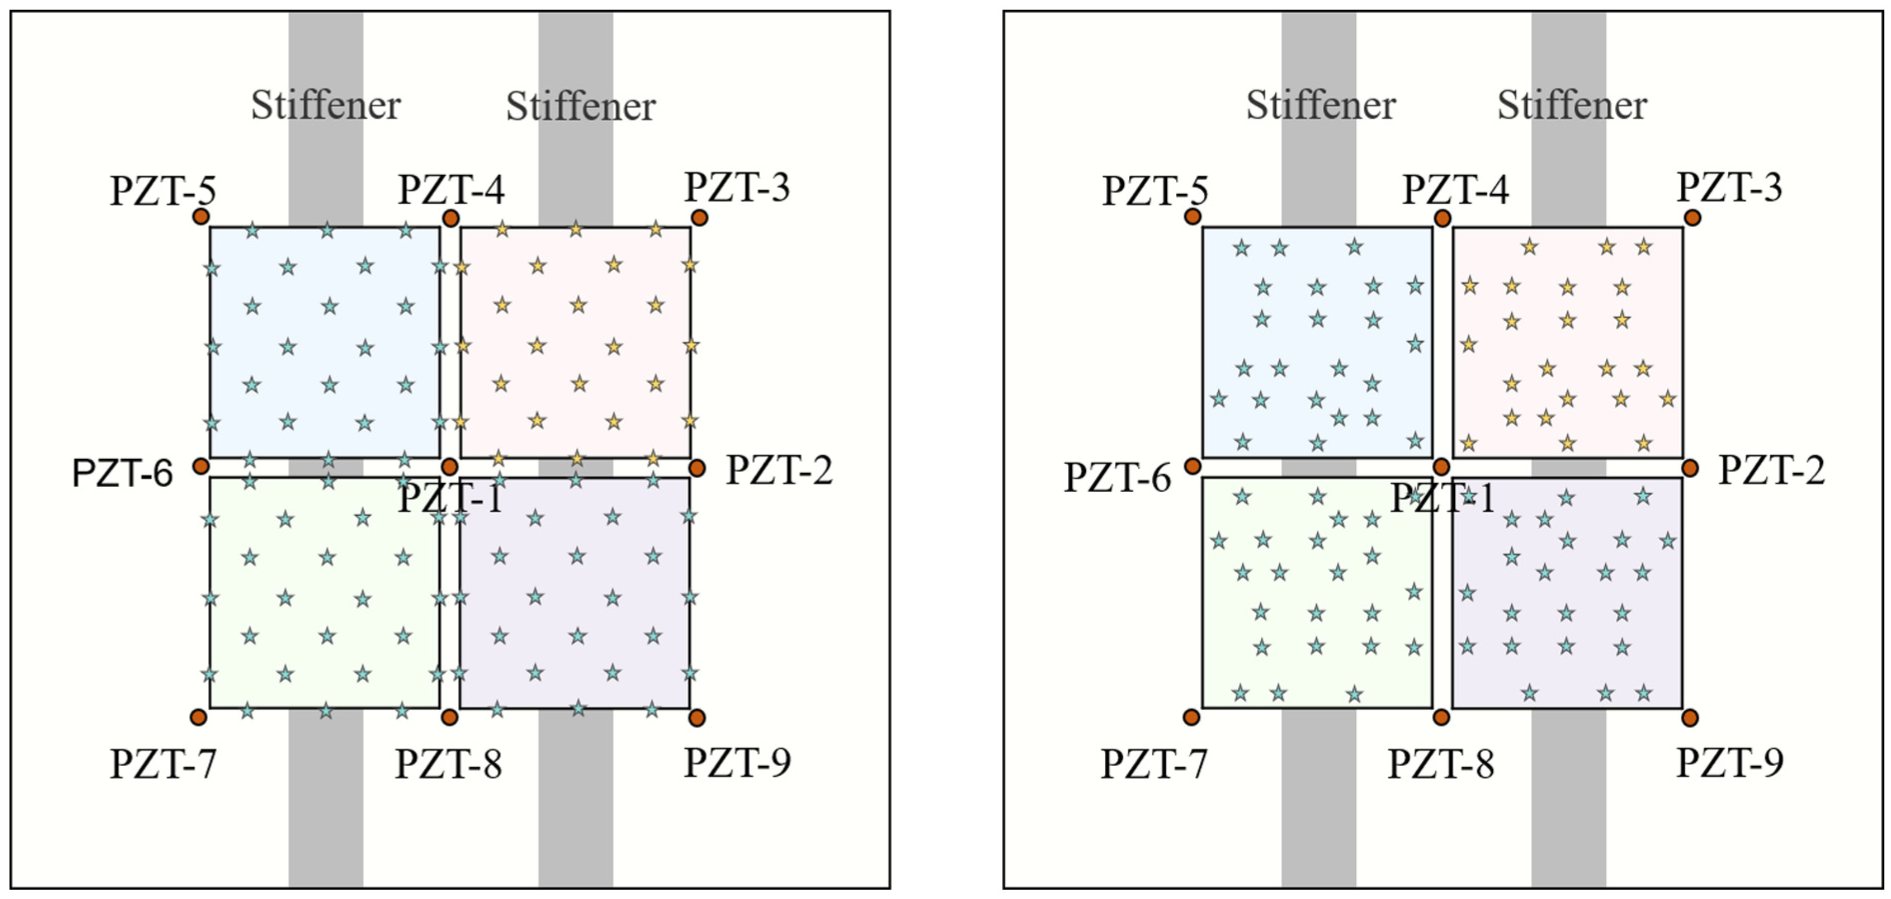
Dataset acquisition diagram.
Test-A contains 24 spatial locations distributed across A1–A4 that are identical to the training positions but measured with completely new signals, resulting in 144 test samples. The locations are seen, while the signals are unseen, which allows the evaluation of generalization to new measurements at already observed locations. Samples from A1 are used to verify whether the model can be generalized to the new measurement signal at the same location. Samples from A2 to A4 are used to assess the impact of stiffeners and spatial variations, reflecting cross-domain adaptability under seen locations.
(2) Test-B: Unseen locations
Test-B consists of 23 random locations that are entirely different from the training points within A1–A4, resulting in 138 samples. These locations are unseen, representing a more challenging evaluation scenario. Samples in A1 are used to evaluate the spatial extrapolation ability of the model, that is, whether damage at new locations can be accurately predicted. Samples of A2–A4 are used to further test the cross-domain robustness, including whether the performance is stable in a new space and different sensor configurations. Overall, test-B tests the spatial generalization and cross-domain adaptability of the model more comprehensively and rigorously.
Structured data expansion based on CVAE
CVAE is an extension of the classical VAE. It introduces a conditional variable
(1) CVAE principles
CVAE consists of an encoder and a decoder, where spatial constraints are introduced by adding position condition variables

The decoder gradually maps the fusion features of

Where
The model is trained by minimizing a joint loss:
Reconstruction loss: Ensures the generated signal accurately matches the real Lamb wave waveform.
Kullback-Leibler (KL) divergence loss: Constrains the latent space distribution to be close to the prior distribution
In this way, CVAE can not only generate high-fidelity Lamb wave signals, but also maintain the spatial consistency of signals, which can provide reliable data support for the training of subsequent DL models and damage identification.
(2) CVAE model establishment
Based on the above principles, this article constructs a spatially constrained Lamb wave signal generation model using CVAE, as shown in Figure 3. The signal input is a 24,000 × 1 one-dimensional Lamb wave response signal, and the conditional input is the x, y coordinate values (position, dimension 2), which guide the model to generate the corresponding signal at a specific spatial location. In the encoder, the signal component sequentially passes through three fully connected layers (512, 256, and 64 neurons) to extract nonlinear features. Its main purpose is progressive feature compression of high-dimensional Lamb wave time-domain signals. Because the size of the original input signal is 24,000 × 1, if it is directly compressed into a low-dimensional latent space, it will easily lead to obvious loss of local waveform information and time-series characteristics in Lamb wave propagation. Therefore, the fully connected structure with decreasing layer-by-layer can enable the network to gradually extract high-level feature representation in the process of feature compression, which improves the expression ability of complex Lamb wave propagation characteristics in the latent space. Location variables undergo low-dimensional semantic mapping through two 32-neuron fully connected layers. Subsequently, the two types of features are concatenated and fused in the feature space, and their mean and log-variance parameters in the latent space are mapped to be obtained respectively.

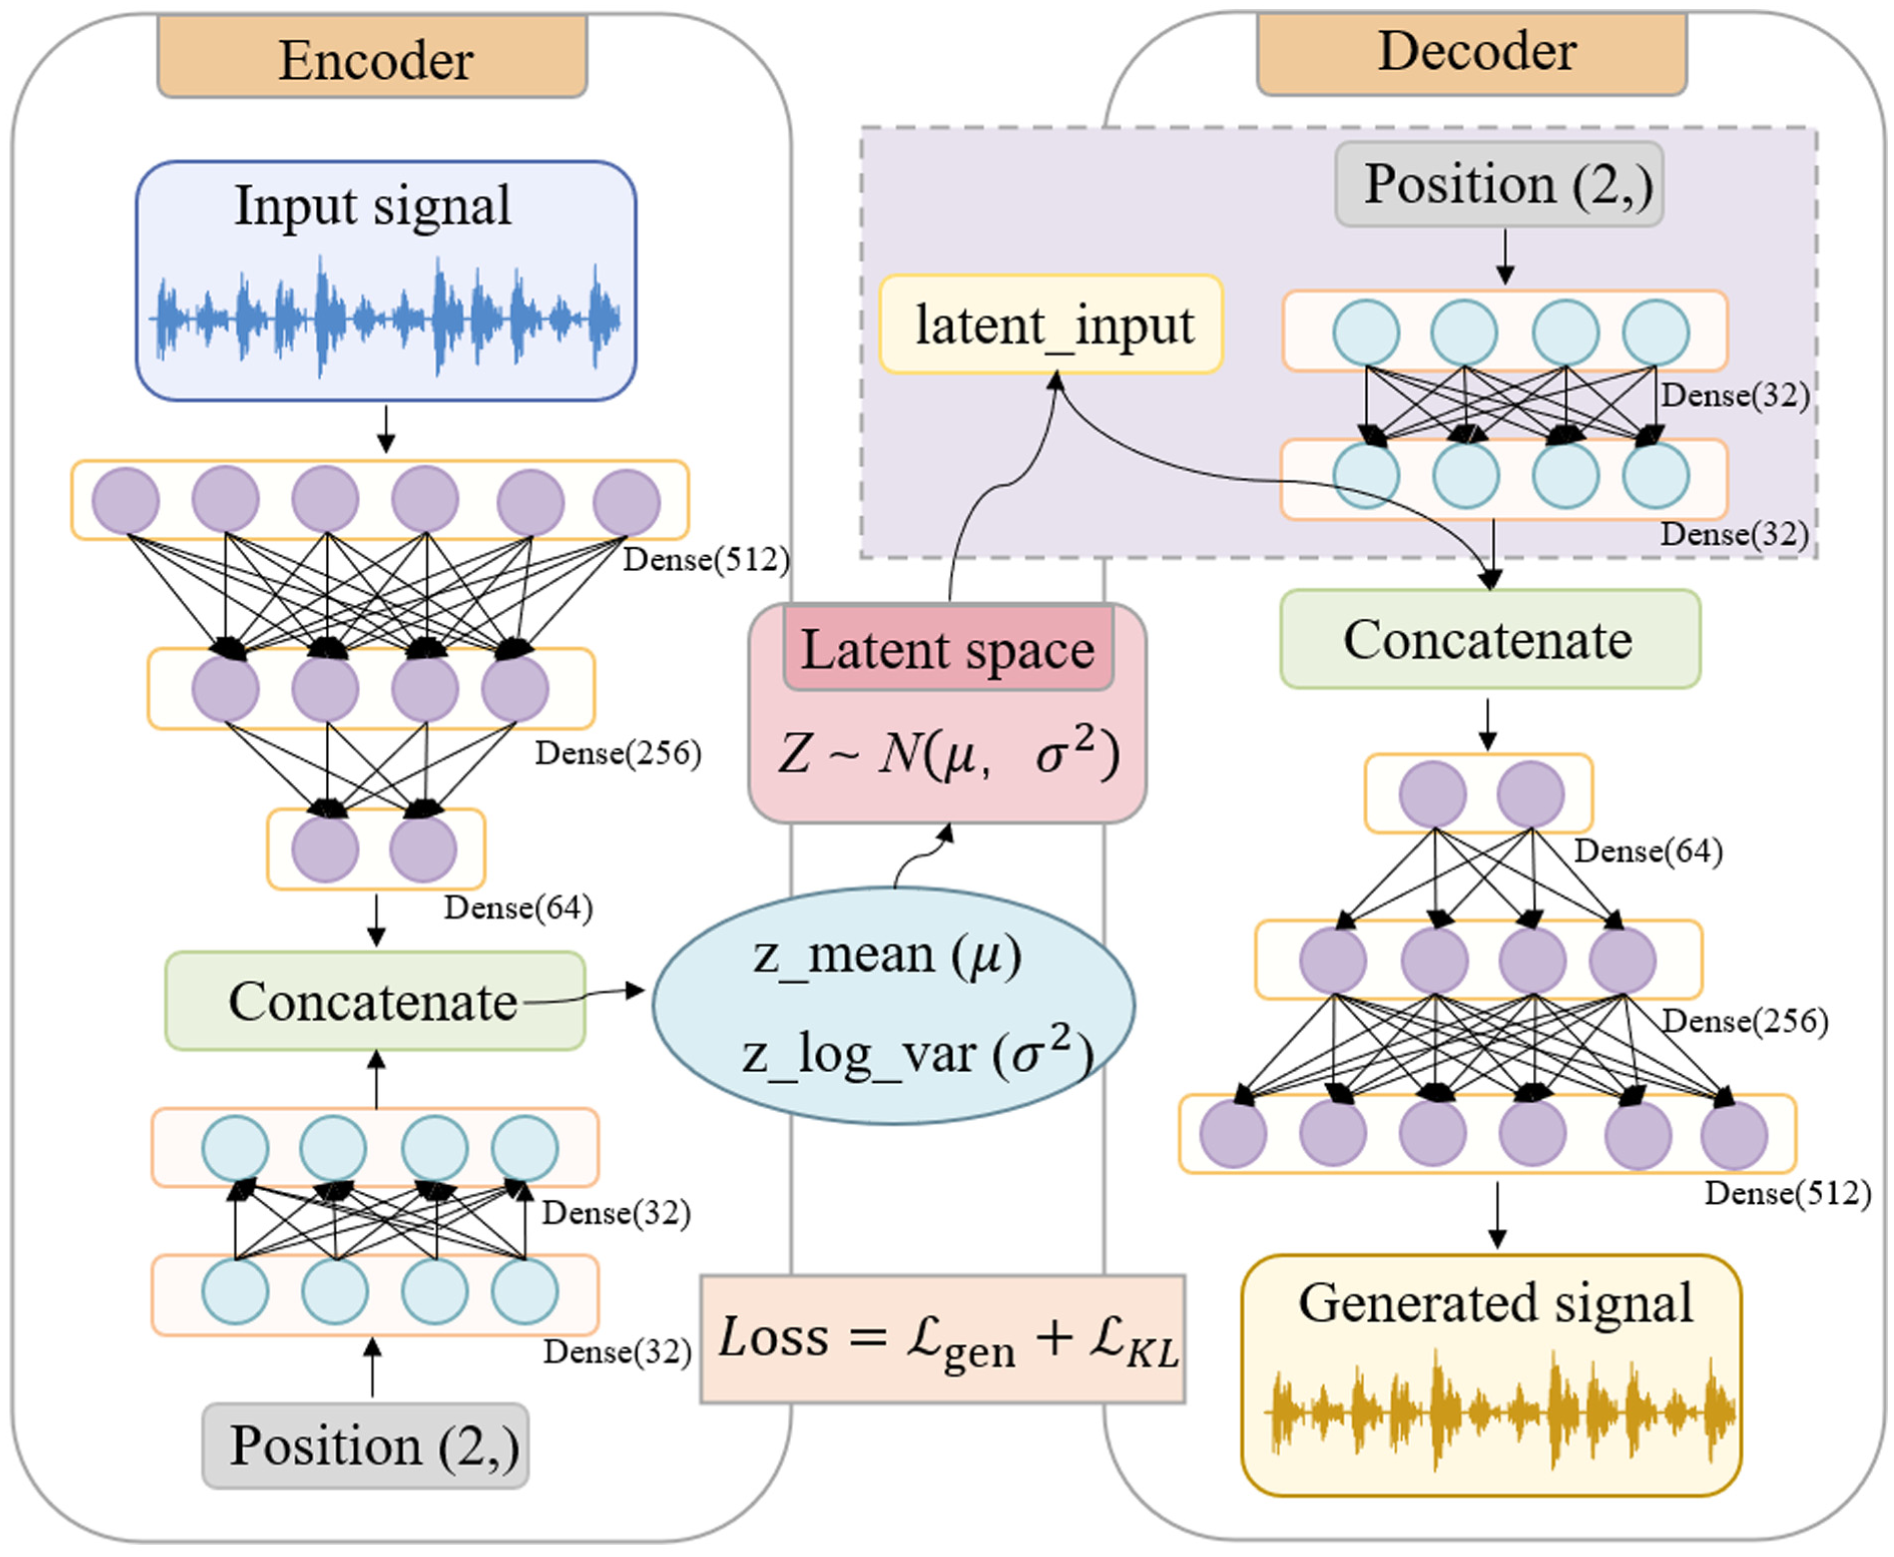
CVAE schematic diagram. CVAE: conditional variational autoencoder.
Continuously differentiable hidden variables are obtained and sampled by re-parameterization technique:

The decoder receives the sampled latent variable
In addition, the latent space dimension can be used to control the compressive expression ability of the latent space to the propagation characteristics of Lamb waves. Too small potential dimension may lead to the loss of key signal features, while too large potential dimension will easily increase the complexity of the model and reduce the consistency and stability of the generated samples. In this article, combined with the signal generation effect and training stability, the latent space dimension is finally selected as 50 to strike a reasonable balance between expressive ability and distribution constraints.
After 5000 training epochs, the model converged and stabilized, and is able to generate virtual Lamb wave signals that conformed to the distribution of physical characteristics at different spatial locations. This effectively compensated for the sample scarcity problem under limited measurement point conditions, which provides structured data support for subsequent damage identification models.
(3) Structured data expansion and damage feature extraction
In damage monitoring of composite stiffened plates, the number of effective samples for different damage states is often restricted by sensor layout, experimental cost, and the time-consuming signal acquisition process. Consequently, the data distribution becomes spatially imbalanced and sparse. Such data scarcity not only undermines the generalization capability of DL models but also hinders their accurate representation of the nonlinear evolution of damage propagation within the structure. Especially when the spatial sampling points are sparse and local areas are missing, it is often difficult for the model to learn the stable spatial-signal mapping relationship, which shows great deviation in the damage prediction of unseen locations.
To solve the above problems, this article proposes a structured data expansion strategy based on CVAE. Here, structured data expansion refers to the use of a generative model to expansion samples in spatially sparse or missing regions of the dataset under the constraints of physical consistency and spatio-temporal structure. By doing so, the training samples become more balanced and continuous in the feature space, enabling the model to better capture the underlying structural response patterns and improving both completeness of learning and generalization capability.
In this article, the CVAE is primarily employed to generate Lamb wave signals at spatial locations that are not sampled in the training dataset, thereby achieving structured data expansion. To validate the model’s learning capability and generation accuracy under limited data conditions, a reconstruction comparison is first conducted on the sampled training locations. Taking the case of a 20 mm damage located at (40, 60) as an example, Figure 4 illustrates the waveform comparison across different propagation paths between the original signal and the generated signal. The results show a high degree of consistency in amplitude characteristics, waveform morphology, and temporal patterns, demonstrating that the proposed CVAE can effectively capture the key distributional features of Lamb wave signals.
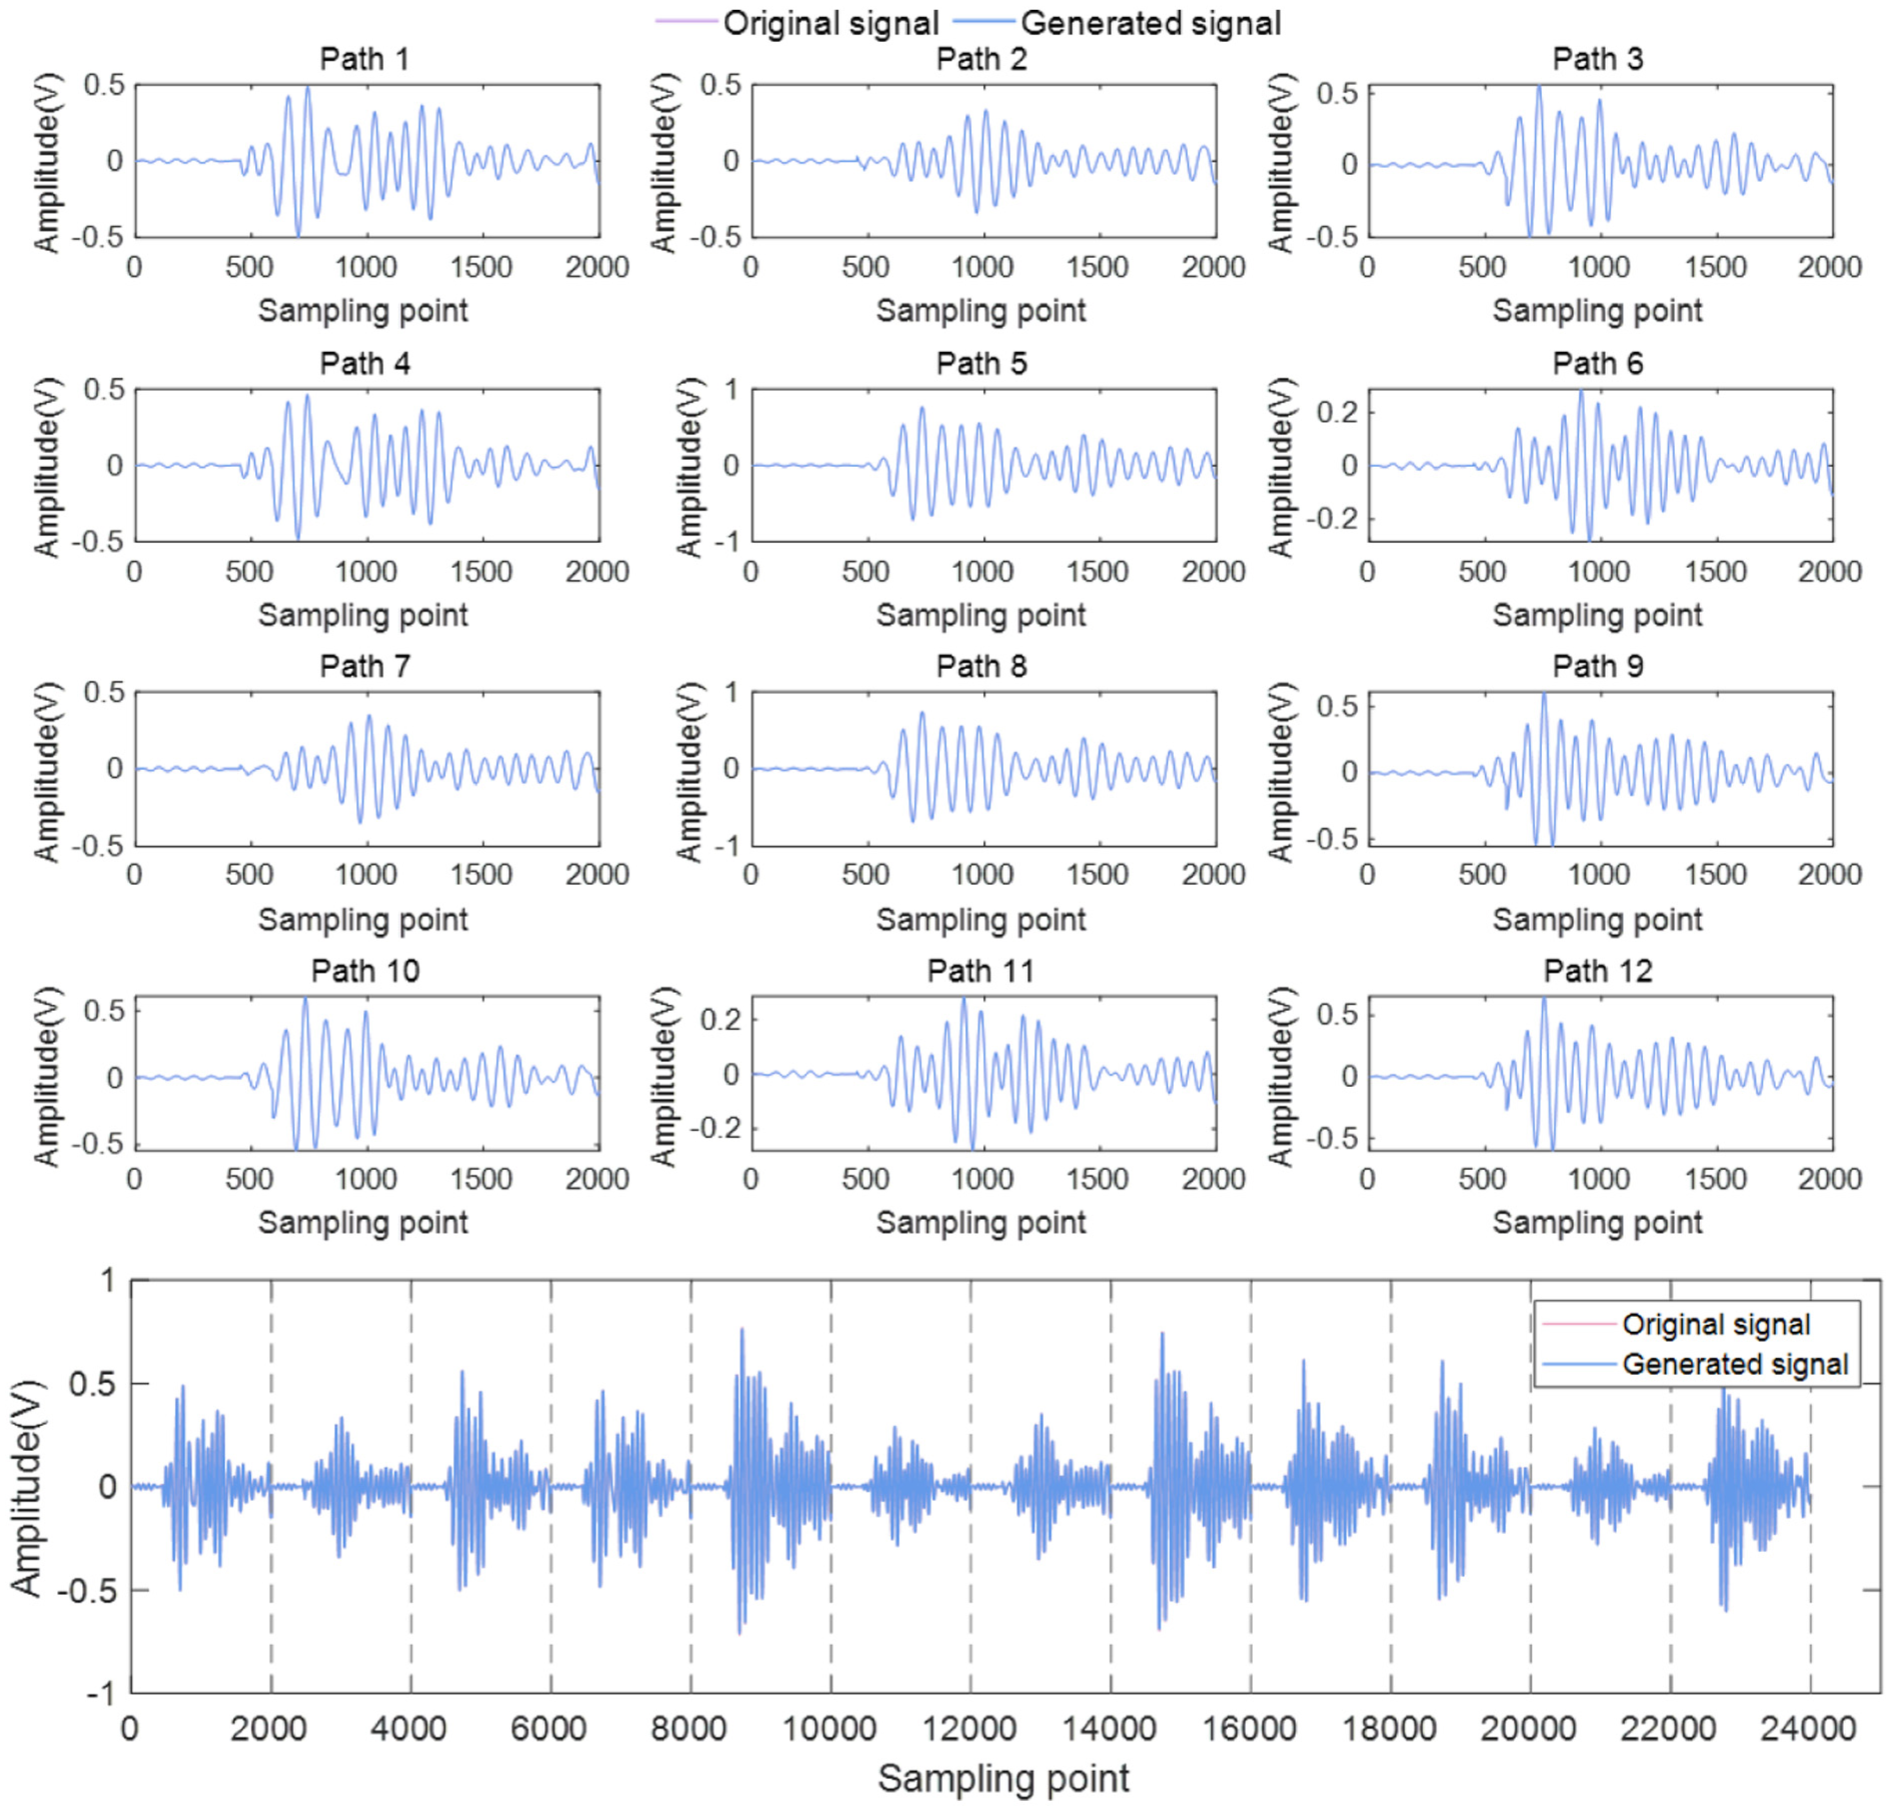
Signal comparison of 20 mm damage at location (40, 60).
Building on this basis, the CVAE is used to conditionally generate Lamb wave signals at unsampled spatial locations in the training set, thereby improving the spatial density and completeness of the data distribution. Taking the case of a 20 mm damage located at (80, 80) as an example, Figure 5 presents the waveform comparison between the original signal and the generated signal. The results indicate that although slight deviations occur in local amplitude characteristics, the overall waveform shape, dominant propagation modes, and temporal patterns remain consistent. This demonstrates that the proposed model effectively captures the key distributional characteristics of damage responses and achieves high-fidelity generation and reasonable expansion of signals in unsampled regions.
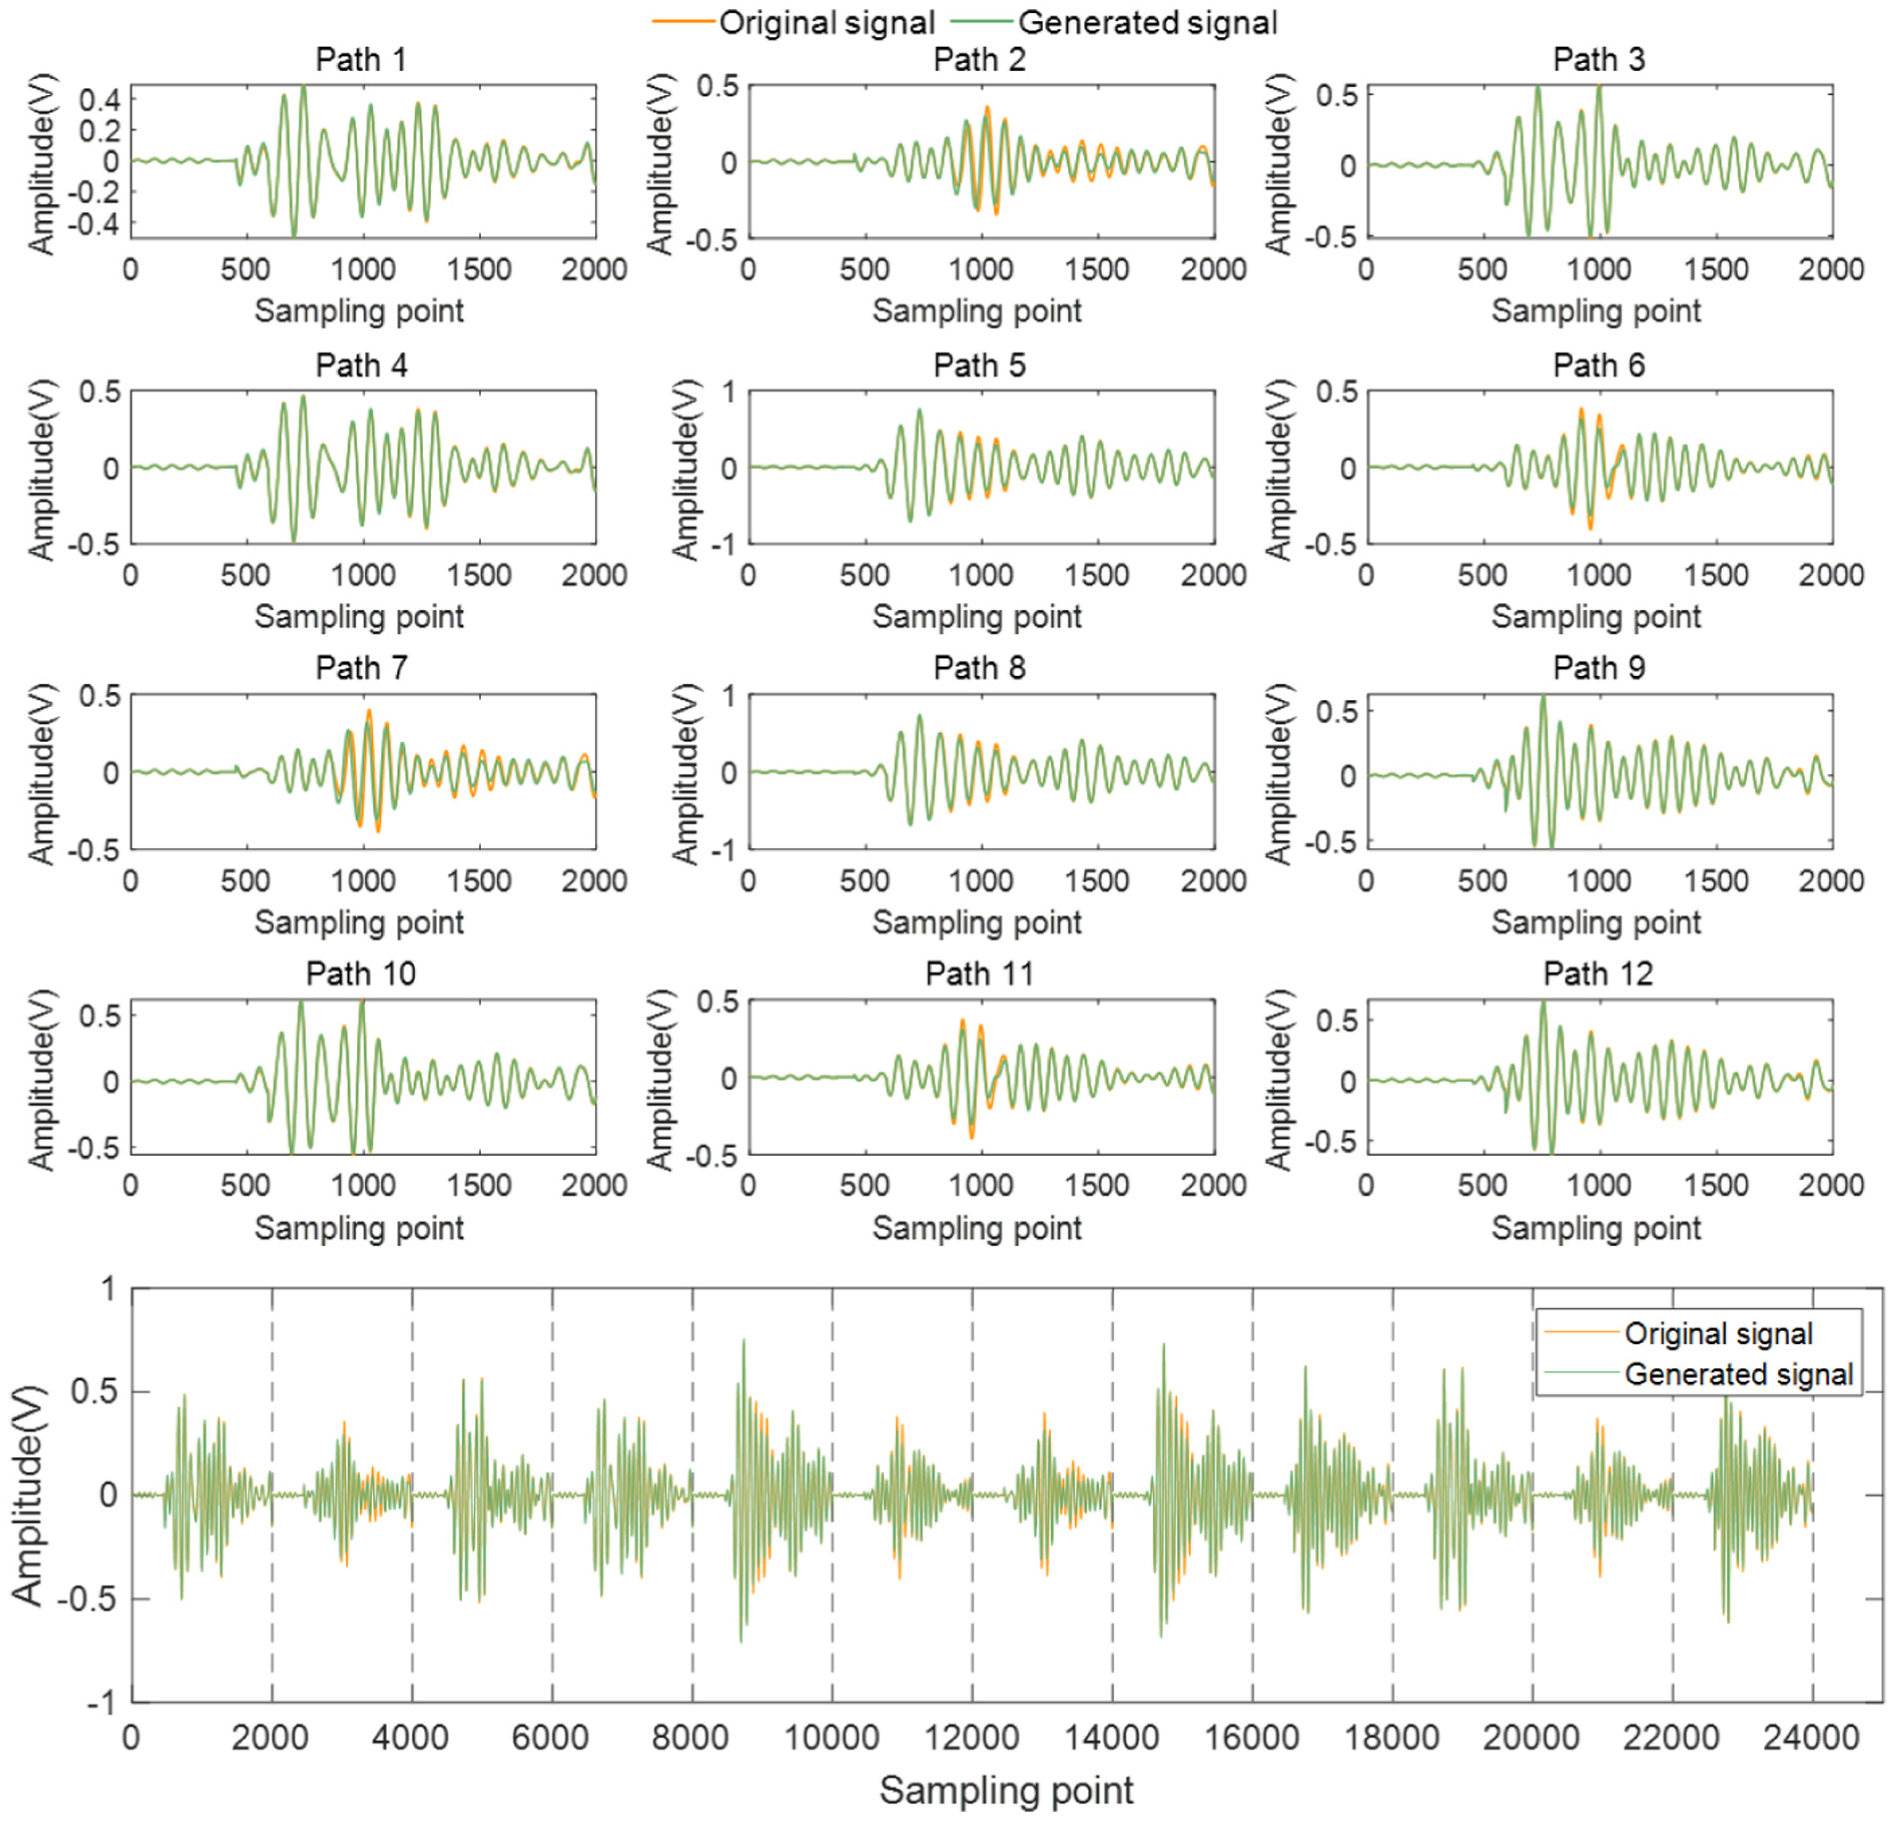
Signal comparison of 20 mm damage at location (80, 80).
To further evaluate the fidelity of the signal generated by CVAE, quantitative evaluation metrics between the generated signal and the original signal are added, including mean square error (MSE), root MSE (RMSE), and Pearson correlation coefficient (CC) to characterize the waveform consistency between the generated signal and the original signal.
MSE is defined as:

Where
RMSE is defined as:

RMSE can more intuitively reflect the average deviation level between the generated signal and the original signal. The smaller the value, the smaller the overall difference between the generated signal and the original signal.
CC is defined as:
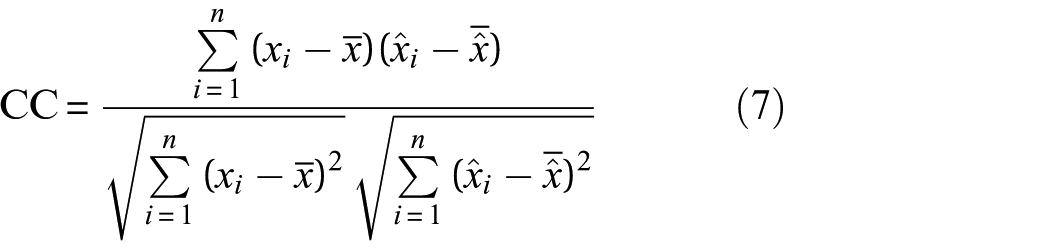
Where
After calculation, for the seen spatial locations, the MSE, RMSE, and CC between the generated signal and the original signal are 0.000002, 0.001233, and 0.999970, respectively, which shows that CVAE can highly preserve the waveform characteristics and amplitude information of Lamb wave signals and has high reconstruction accuracy. For the unknown spatial location, the MSE, RMSE, and CC between the generated signal and the original signal are 0.000754, 0.027462, and 0.94242, respectively. Although the error is slightly increased compared with the sample that has been seen, the similarity remains at a high level. This shows that the signal generated by CVAE and the original signal still show good consistency in the main waveform characteristics at the unknown spatial location. Therefore, CVAE can not only learn the signal distribution characteristics of the seen locations, but also learn the variation law of Lamb wave signals between different unseen spatial locations to some extent, which provides support for spatial expansion modeling based on limited sampling data.
In summary, to mitigate the issue of sparse and insufficient spatial coverage of training samples, a CVAE-based structured data expansion strategy is established using the coordinate features of the training domain, as shown in the Figure 6. For sub-area A1, the yellow pentagons represent the original training sampling points, and the green pentagons represent virtual samples generated by the trained CVAE model. Through this method, the number of training locations increased from 24 to 45, which significantly enhances the spatial coverage density and distribution regularity of the dataset. This augmentation process effectively alleviates spatial data bias caused by sparse sampling and enables the model to learn more continuous and informative structural response features within the training domain A1, thereby providing a more representative and robust foundation for damage identification and localization in other test domains.
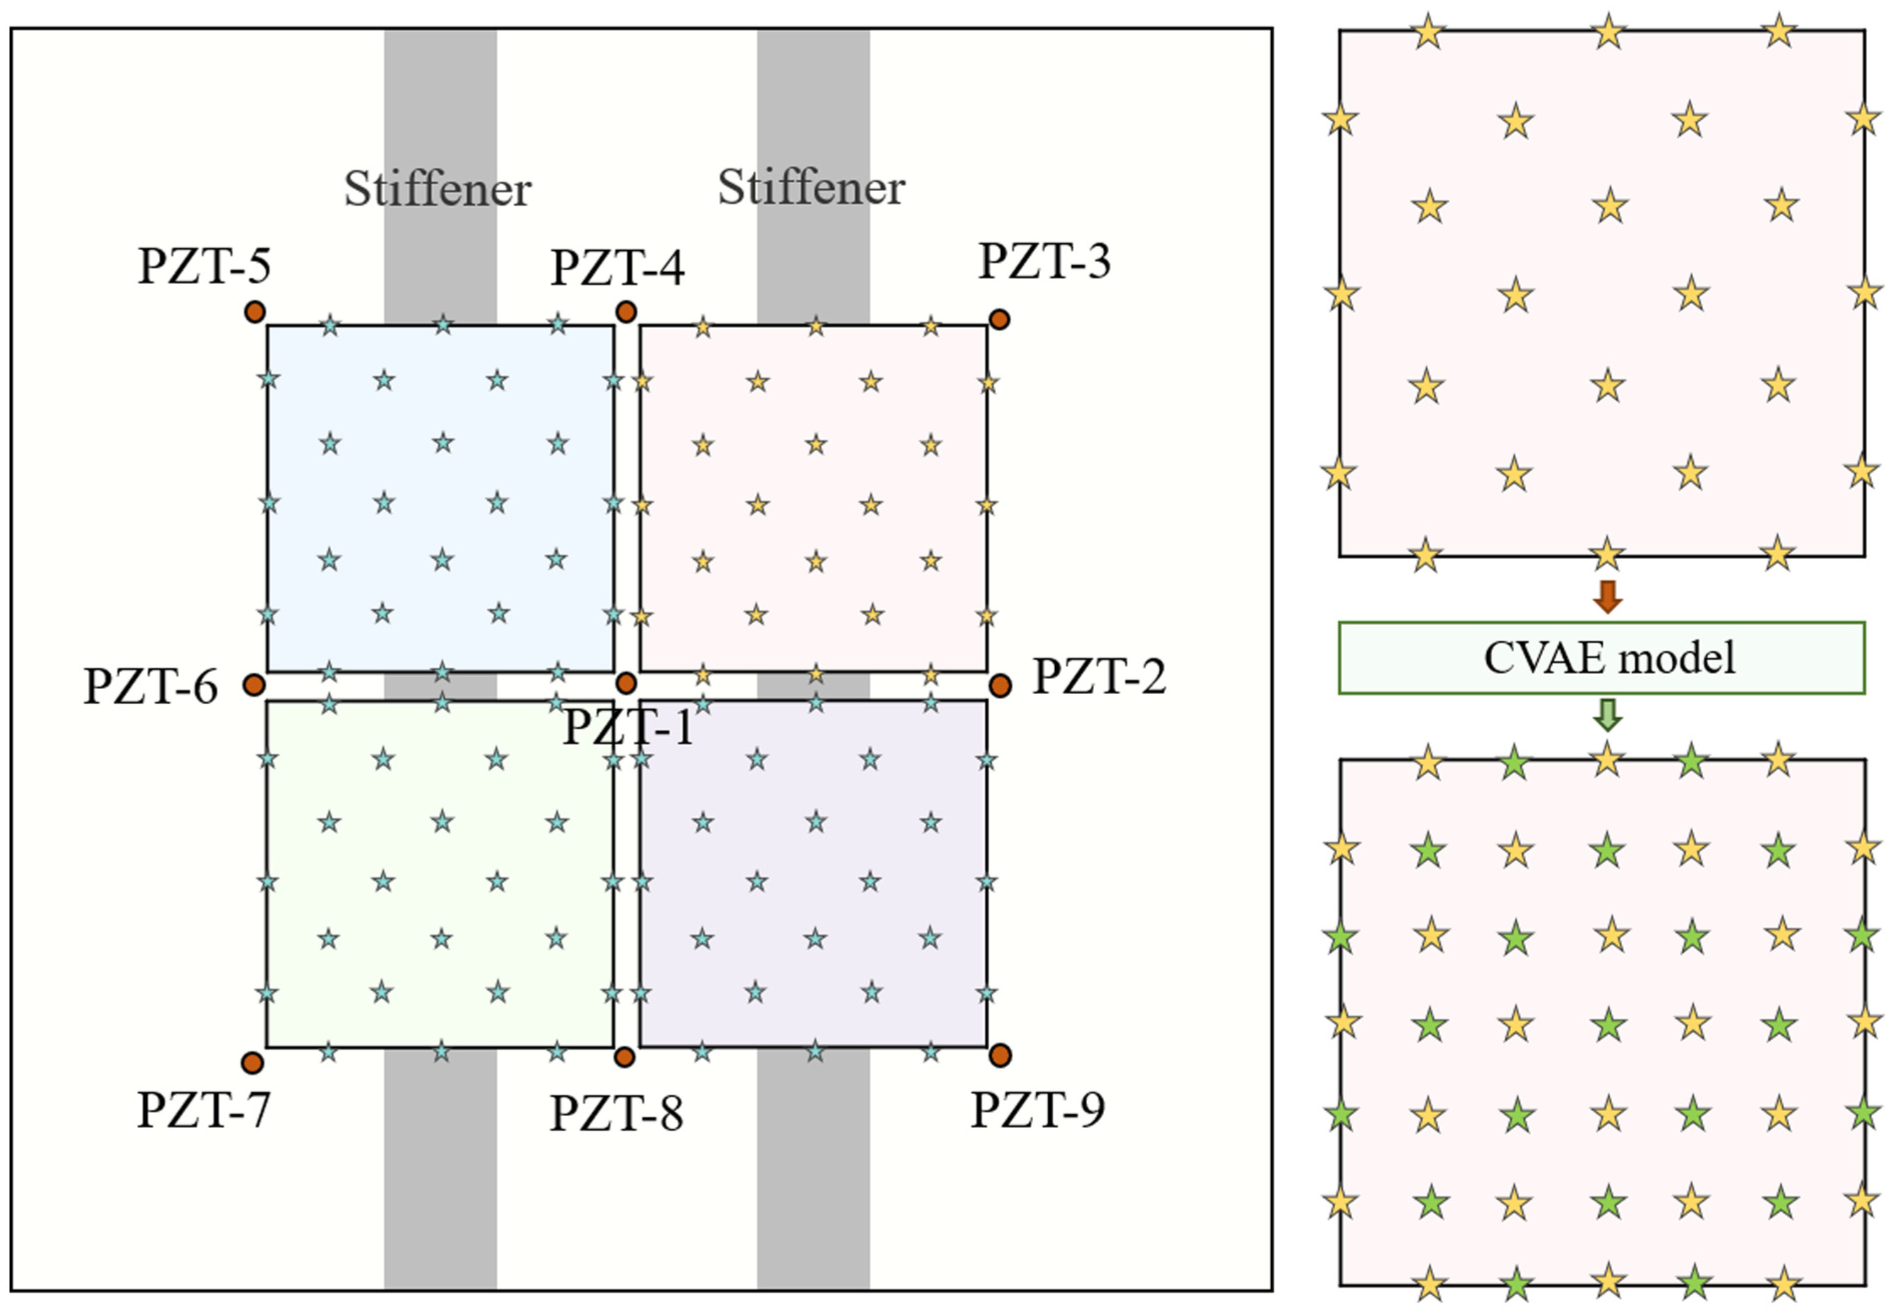
Structured data expansion based on CVAE. CVAE: conditional variational autoencoder.
Lamb wave damage feature extraction
Lamb wave signals contain abundant information about structural states, but their raw time-domain waveforms are high-dimensional and contain a lot of redundant information. If the original signal is directly used as input, it will reduce the efficiency of model training. Therefore, the collected Lamb wave signal is preliminarily extracted and processed to quantify the influence of damage on the signal and extract more representative input features. Specifically, this article defines the damage index (DI), which is used to represent the amplitude difference between the damage status signal

Where
Each path signal is first expanded from 2000 sampling points to 6000 sampling points by interpolation to improve the time resolution of the subsequent sliding window analysis. Then, for each path, a sliding window with a length of 300 and a step size of 50 is used to extract local features, and the DI is calculated in each window. One hundred fifteen DIs are finally extracted from each path, and 12 path features are combined to form a DI sequence with a length of 1380, which is used as the input of the subsequent hierarchical feature fusion network.
Damage samples with a damage size of 20 mm at the same damage location (60, 40) in both training domain A1 and test domain A2 are selected for DI comparison. As shown in the Figure 7, the overall trend of the orange curve (sample 1, from A1) and the green curve (sample 2, from A2) is basically consistent, indicating that the influence of damage on signal amplitude distribution in different spatial domains is similar. However, due to the differences in the actual measurement conditions between A1 and A2, such as the difference in sensor response sensitivity and frequency characteristics, the difference in bonding/coupling quality, the nuance of damage pasting and the influence of environmental noise, the amplitude and phase of some paths shift or fluctuate, resulting in some differences in the extracted DI. This shows that cross-domain signals are consistent in the overall response trend, but there are differences in local details, which provides an important reference for subsequent feature extraction and model training.
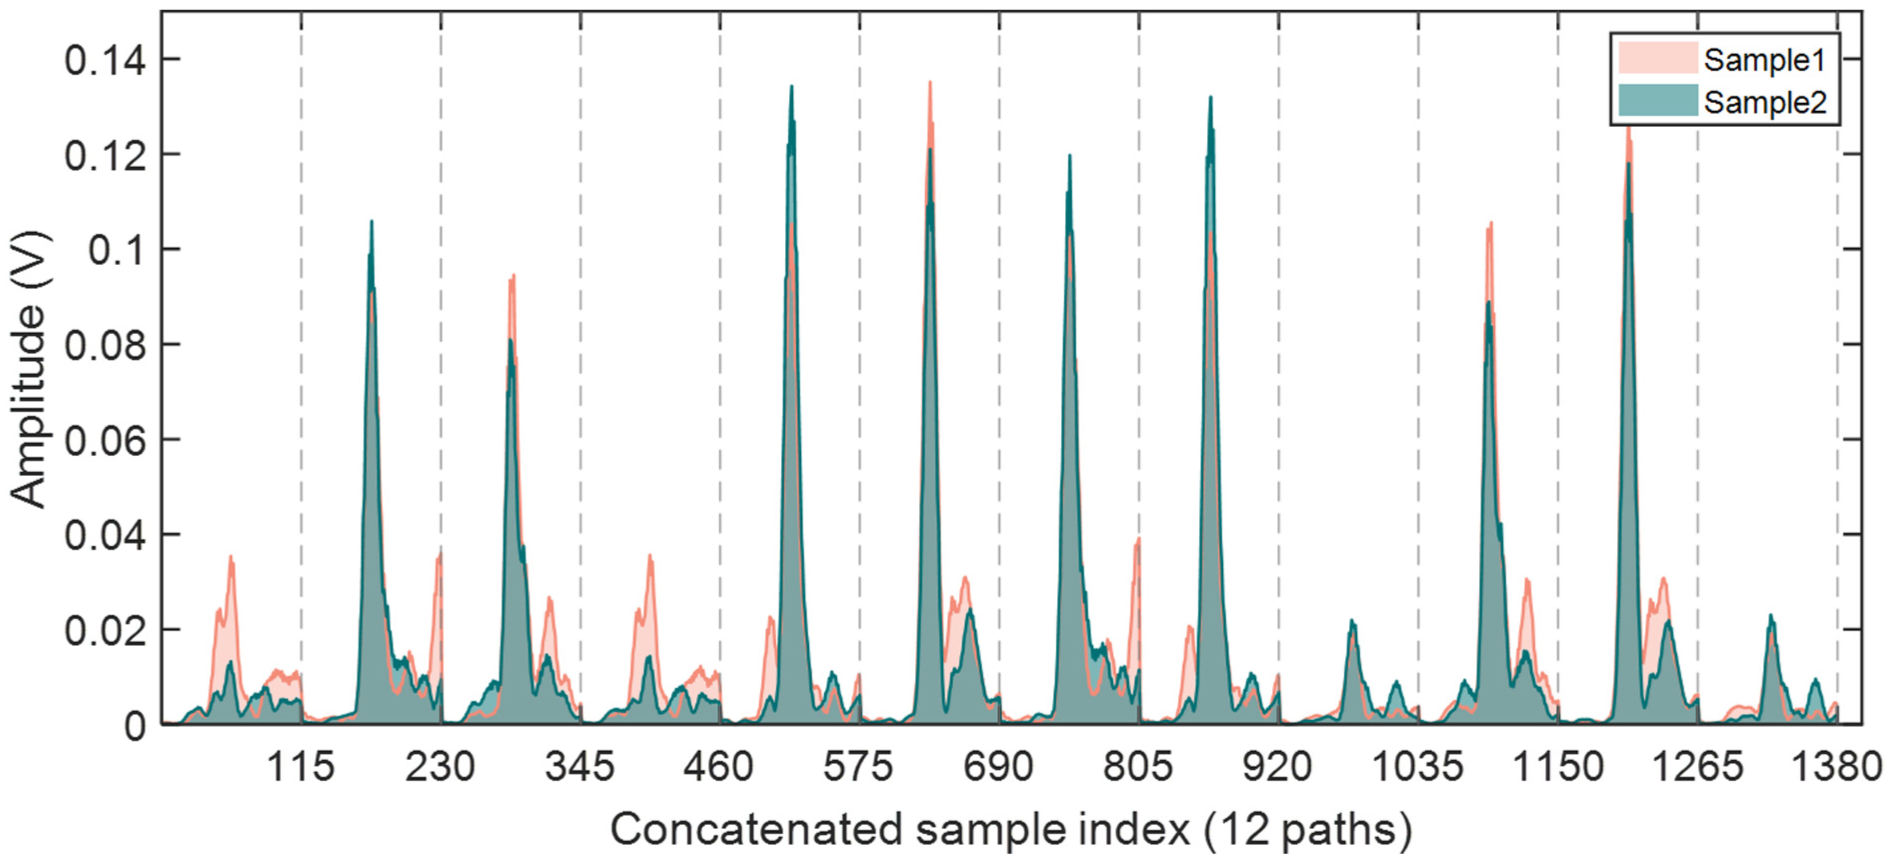
DI comparison of 20 mm damage in training field A1 and test field A2 at the same location (60, 40). DI: damage index.
Multi-parameter damage identification of composite stiffened plate
Damage identification based on hierarchical feature fusion
Theory
In Lamb wave-based damage monitoring, damage will cause amplitude attenuation and phase shift of multipath signals. 39 For one-dimensional sequence, CNN can automatically extract local variation patterns and abnormal fluctuation features from continuous signals through the sliding operation of a local convolution kernel.40,41 However, the signal often contains the change information of different scales at the same time: some paths change sharply with concentrated features, while others change gently and widely. Single-scale convolution is difficult to take into account both local mutation and global trend, thus limiting the model’s perception of complex spatial response patterns.
Therefore, a hierarchical feature fusion mechanism with an Inception module is introduced, which enables the network to extract multi-scale information in parallel under different receptive fields, thus more comprehensively representing the spatial distribution characteristics and propagation laws of damage. The Inception module performs parallel computation using convolutional kernels with different receptive fields of 1 × 1, 3 × 3, and 5 × 5. Small-scale convolution kernels are effective in capturing local amplitude variations and abnormal peaks, while large-scale convolution kernels are able to perceive energy distribution and global trend changes across different paths. 42 This hierarchical structure can extract features synchronously at different scales and realize the collaborative modeling of local and global information during feature fusion, thus improving the feature perception ability and discrimination accuracy of complex damage signals.
On the basis of multi-scale feature extraction, considering the potential correlation and interaction between features of different paths, it is difficult to effectively model this global dependency only by convolution operation. The MHA mechanism is further introduced to realize the weighted fusion of hierarchical features and global dependency compensation in this article. This mechanism calculates the attention weights in multiple feature subspaces in parallel, and adaptively recalibrates the features output by different convolution layers, so that the network can capture the correlation between paths and the complementary information between multi-scales from multiple angles. In this way, the model can not only pay attention to the damage-sensitive path, but also establish inter-layer collaboration at the multi-scale feature level, thus achieving higher-level feature integration and improving the robustness of damage identification. 43
Model building
Based on the above principles, a hierarchical feature fusion network integrating the Inception module and MHA is constructed to predict the damage location and size of composite stiffened plates, as shown in Figure 8. The model takes the DI sequence (length 1380 × 1) obtained by connecting 12 sensing paths in series as input, and outputs the x, y coordinate values and damage size, respectively, after feature extraction and fusion.
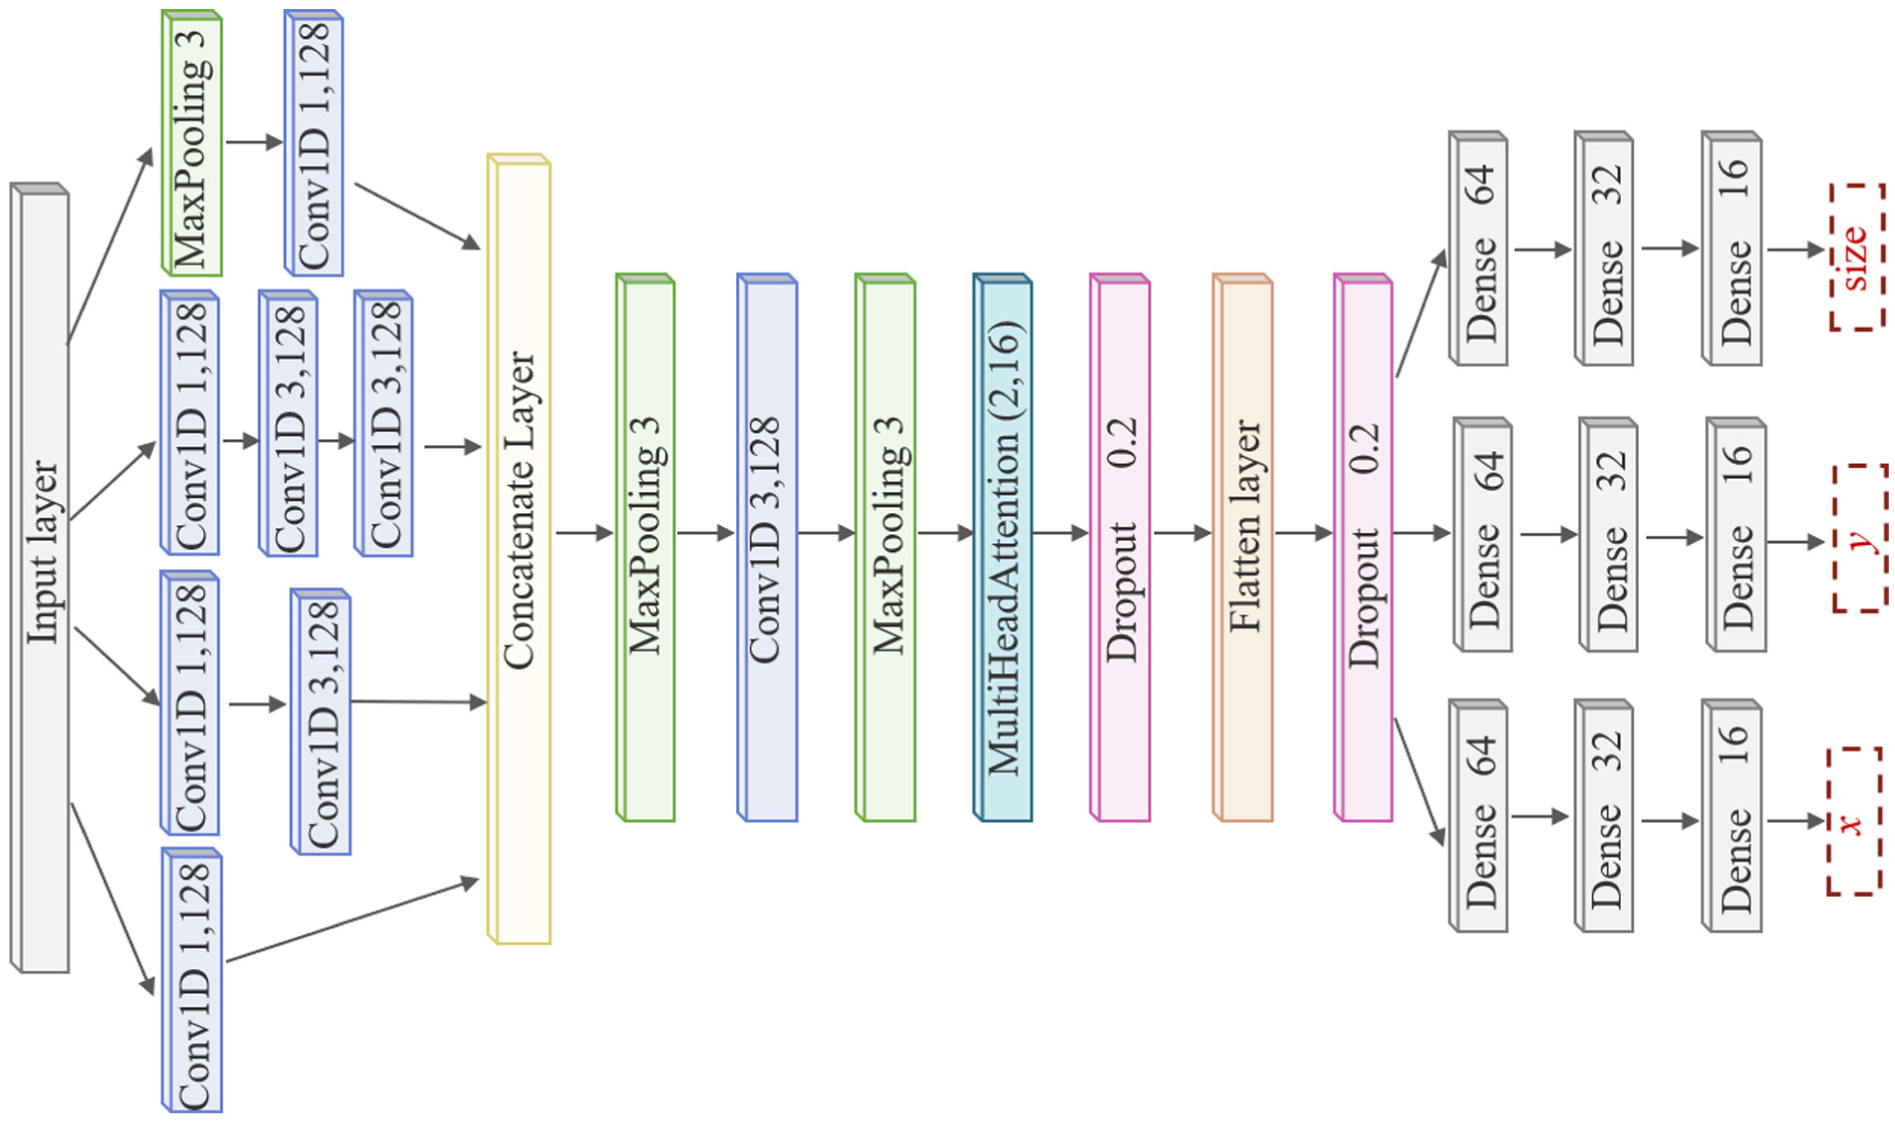
Schematic diagram of hierarchical feature fusion network.
Firstly, the input signal enters the Inception module to realize multi-scale feature extraction. This module contains four parallel branches:
1 × 1 convolution branch, which is used to compress the channel information and extract the fundamental response features;
1 × 1 convolution and 3 × 3 convolution branch, which is used to extract local response change under medium receptive field;
1 × 1 convolution and two layers of 3 × 3 convolution branch, which is used to capture the energy distribution and trend change under large receptive field;
maxpooling and 1 × 1 convolution branch, which is used to perform feature compression while enhancing robustness to local abnormal signals.
The multi-branch structure enables the network to extract multi-scale features in parallel under different receptive fields, and realize the collaborative integration of hierarchical information at the concatenate layer. Subsequently, it goes through a maxpooling layer to reduce the redundant information and improve the computational efficiency. Then, a convolution layer is used to further extract the high-dimensional time-series features, and then the dimension of the features is reduced by maxpooling. Among them, the number of convolution channels is increased step by step (from 64 to 256) to gradually enhance the ability of feature abstraction, and at the same time, avoid unstable training caused by too high model complexity in the initial stage.
Then, MHA is introduced to enhance the model’s capability for global dependency modeling. Unlike local convolutions, MHA can capture long-range dependencies and cross-path interactions by computing the relevance between any two time steps in the sequence, enabling a more comprehensive understanding of global spatial-temporal correlations. In this article, two attention heads are used, the query and key dimension of each attention head is 16, and multiple dependencies are learned from different feature subspaces in parallel. This mechanism aggregates the characteristic information of each time step or path by weight, so that the model can establish the relationship between multipath signals in the global scope, thus improving the modeling ability of damage propagation law and signal interaction characteristics.
After the MHA, the dropout layer and the flatten layer are added to prevent overfitting and integration of features. Then the damage parameters are output through three groups of parallel fully connected branch networks, respectively. Each branch contains three layers of fully connected networks (64, 32, and 16 neurons), which correspond to the x, y coordinate values and damage size.
Cross-domain damage identification
Domain adaptation principle
Even if each damage monitoring sub-area has the same sensor layout and data acquisition process, the Lamb wave signals collected in different areas will still show certain distribution differences. This difference mainly stems from the combined effects of factors such as sensor coupling state, local heterogeneity of composite materials, and the difficulty in maintaining perfect consistency in the reflection, scattering, and propagation responses of Lamb waves in different domains. When the model is trained only in a single domain (A1), the learned feature distribution is often difficult to be directly applied to other domains (A2–A4), which leads to performance degradation when the model is applied across domains. If data acquisition, neural network model building and model training are carried out separately for each sub-area, a lot of labor and time costs will be generated. 44 Therefore, the unsupervised DANN is introduced to align feature distributions and enable damage prediction when only the source domain is labeled.
DANN is inspired by the adversarial learning strategy of generative adversarial networks and aims to learn domain-invariant features between source and target domains, thereby allowing the model to remain robust under different data distributions. It mainly includes three modules:
Feature extractor: Extracts high-dimensional feature representations from source and target domain signals and provides a shared feature space for downstream tasks;
Task predictor: Performs the main task based on the extracted features, such as regression prediction of damage location and size;
Domain discriminator: Distinguishes whether a sample originates from the source or target domain.
During training, a gradient reversal layer (GRL) is introduced to achieve adversarial optimization between the feature extractor and the domain discriminator. When the domain discriminator attempts to distinguish between samples from the source and target domains, the GRL reverses the gradient direction during backpropagation, which can enable the feature extractor to continuously generate domain-invariant features that can “confuse” the discriminator. Therefore, through this unsupervised adversarial learning mechanism, the model gradually learns feature representations that can effectively complete the damage prediction task while being insensitive to differences in domain distribution, thereby alleviating the performance degradation problem caused by domain shift and providing a feasible solution for damage identification in cross-domain situations.
Model design
Based on the above principles, this article constructs a cross-domain damage identification network (Inception-MHA-DANN) as shown in Figure 9. The model takes a sequence of length 1380 × 1 as input. The Inception module and the MHA module have the same structure as described above, used for hierarchical and multi-scale feature extraction and global dependency modeling, respectively. However, after processing through the flatten and dropout layers, the extracted shared features are sent to four parallel branches at the same time:
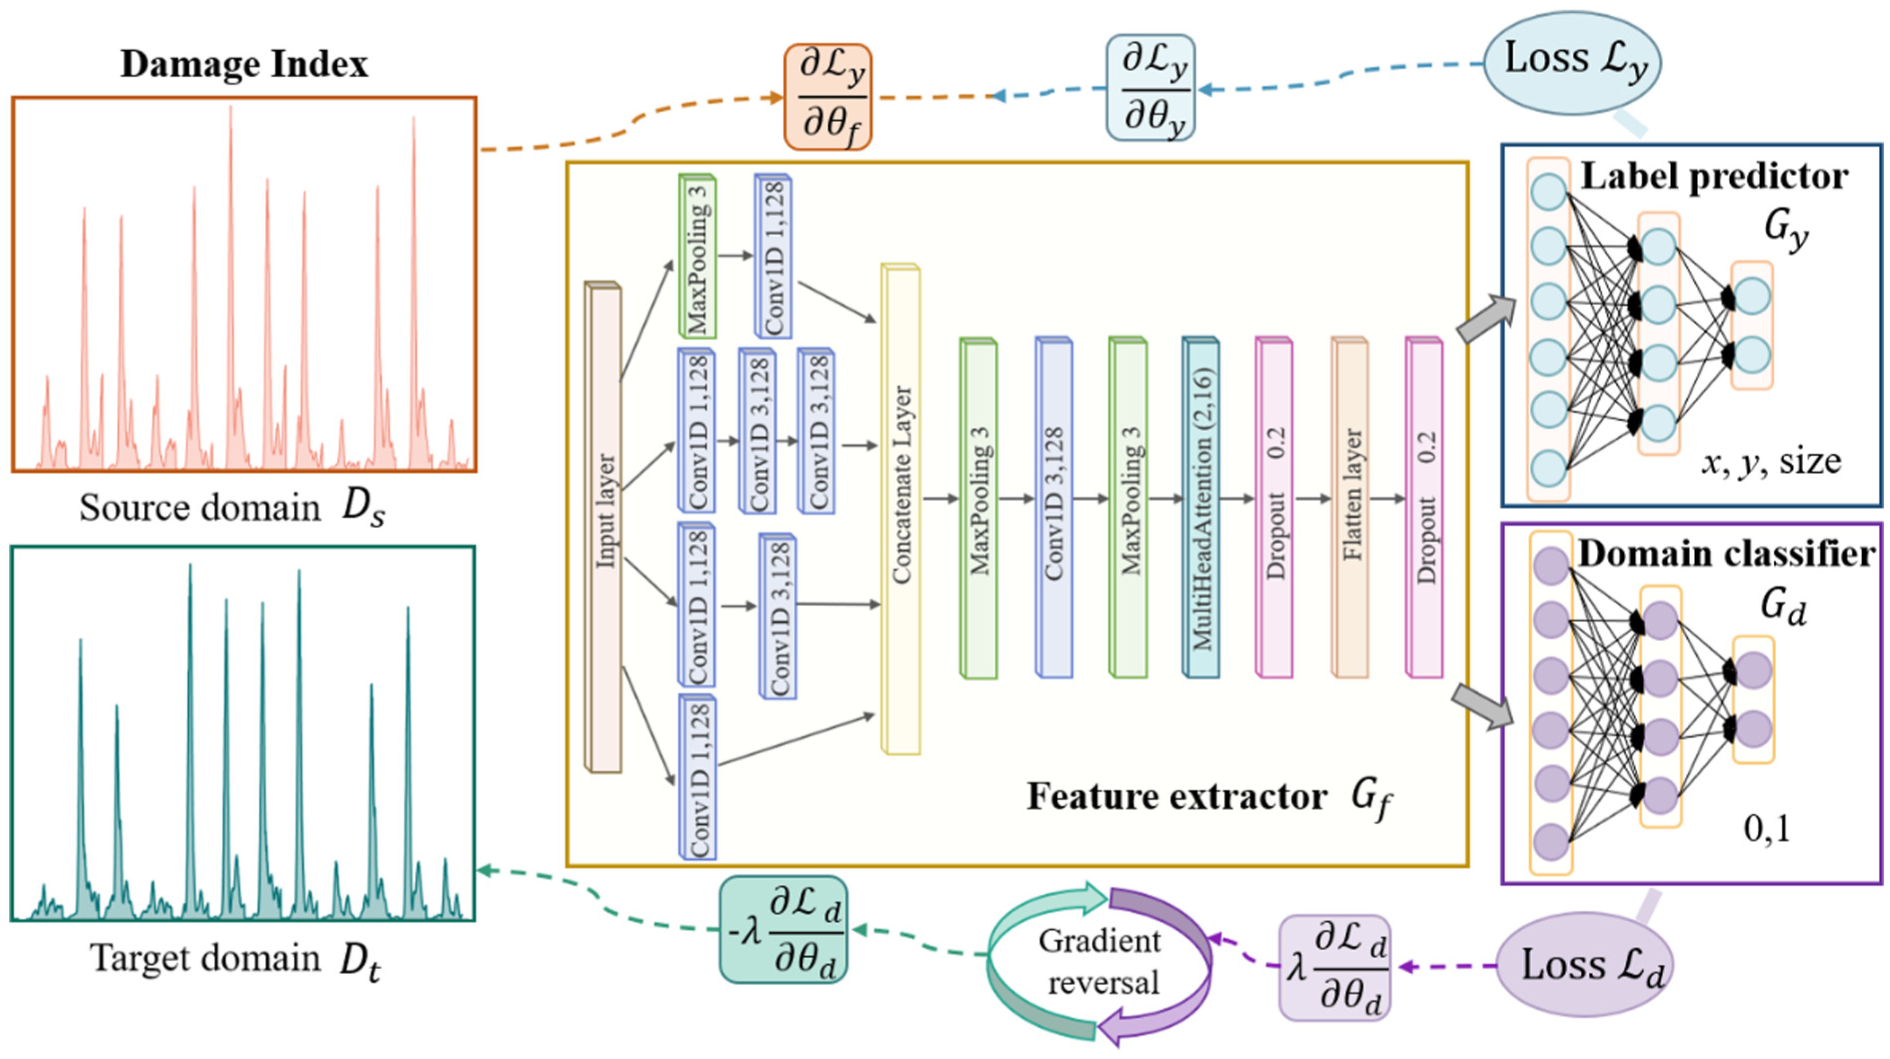
Schematic diagram of cross-domain damage identification network.
The model consists of three multi-task branches (for predicting the x, y, and size, respectively) and a domain discrimination branch. The multi-task branch is the same as in “Damage identification based on hierarchical feature fusion” section, while the domain discrimination branch accesses the shared feature output through a GRL to build an adversarial mechanism with the feature extractor. This branch contains two fully connected network layers (64 and 32 neurons), and finally outputs a Sigmoid node to determine whether the input sample comes from the source domain (label = 0) or the target domain (label = 1).
The overall loss function of the model is composed of the task regression loss and the domain classification loss, and is defined as follows:

Where
During training, source domain samples participate in both damage prediction and domain classification tasks, while target domain samples only participate in domain discrimination. Through this adversarial mechanism, the model gradually learns domain-invariant features to achieve implicit alignment of feature distributions. Ultimately, this model can achieve cross-domain prediction of damage location and size even when signal distributions differ across domains.
Results and discussion
The model is developed using Python 3.6.13 in a Keras 2.6.0 environment, with a training hardware configuration of Intel i5-12490F (12 cores) CPU + 32 GB RAM. To minimize randomness in the results, five independent training runs are conducted for the model, and their averaged output is reported as the final prediction.
Test results of hierarchical feature fusion model
To verify the generalization performance of the model in different domains, the damage location and size are predicted in A2–A4 test domains. Taking A2 domain as an example, Figure 10 shows the prediction error distribution of hierarchical feature fusion model in test-A and test-B, respectively. As can be seen from the figure, for both test-A and test-B, the errors in x and y are approximately normally distributed with 0 as the center, generally showing a trend of “high in the middle and low on both sides.” Among them, the size prediction error distribution is relatively more dispersed in test-B, which indicates that the model still has some fluctuation in the prediction of damage size under unknown damage, but most of the errors are concentrated in a small range. The results show that the hierarchical feature fusion network combining the Inception module with the MHA mechanism can effectively extract local changes and path association features of the signal, and achieve accurate prediction of the damage location. For size prediction, the model can still maintain the overall trend under unknown damage, but the error distribution is slightly wider. Therefore, the model has certain difficulties in predicting size information under cross-domain conditions.
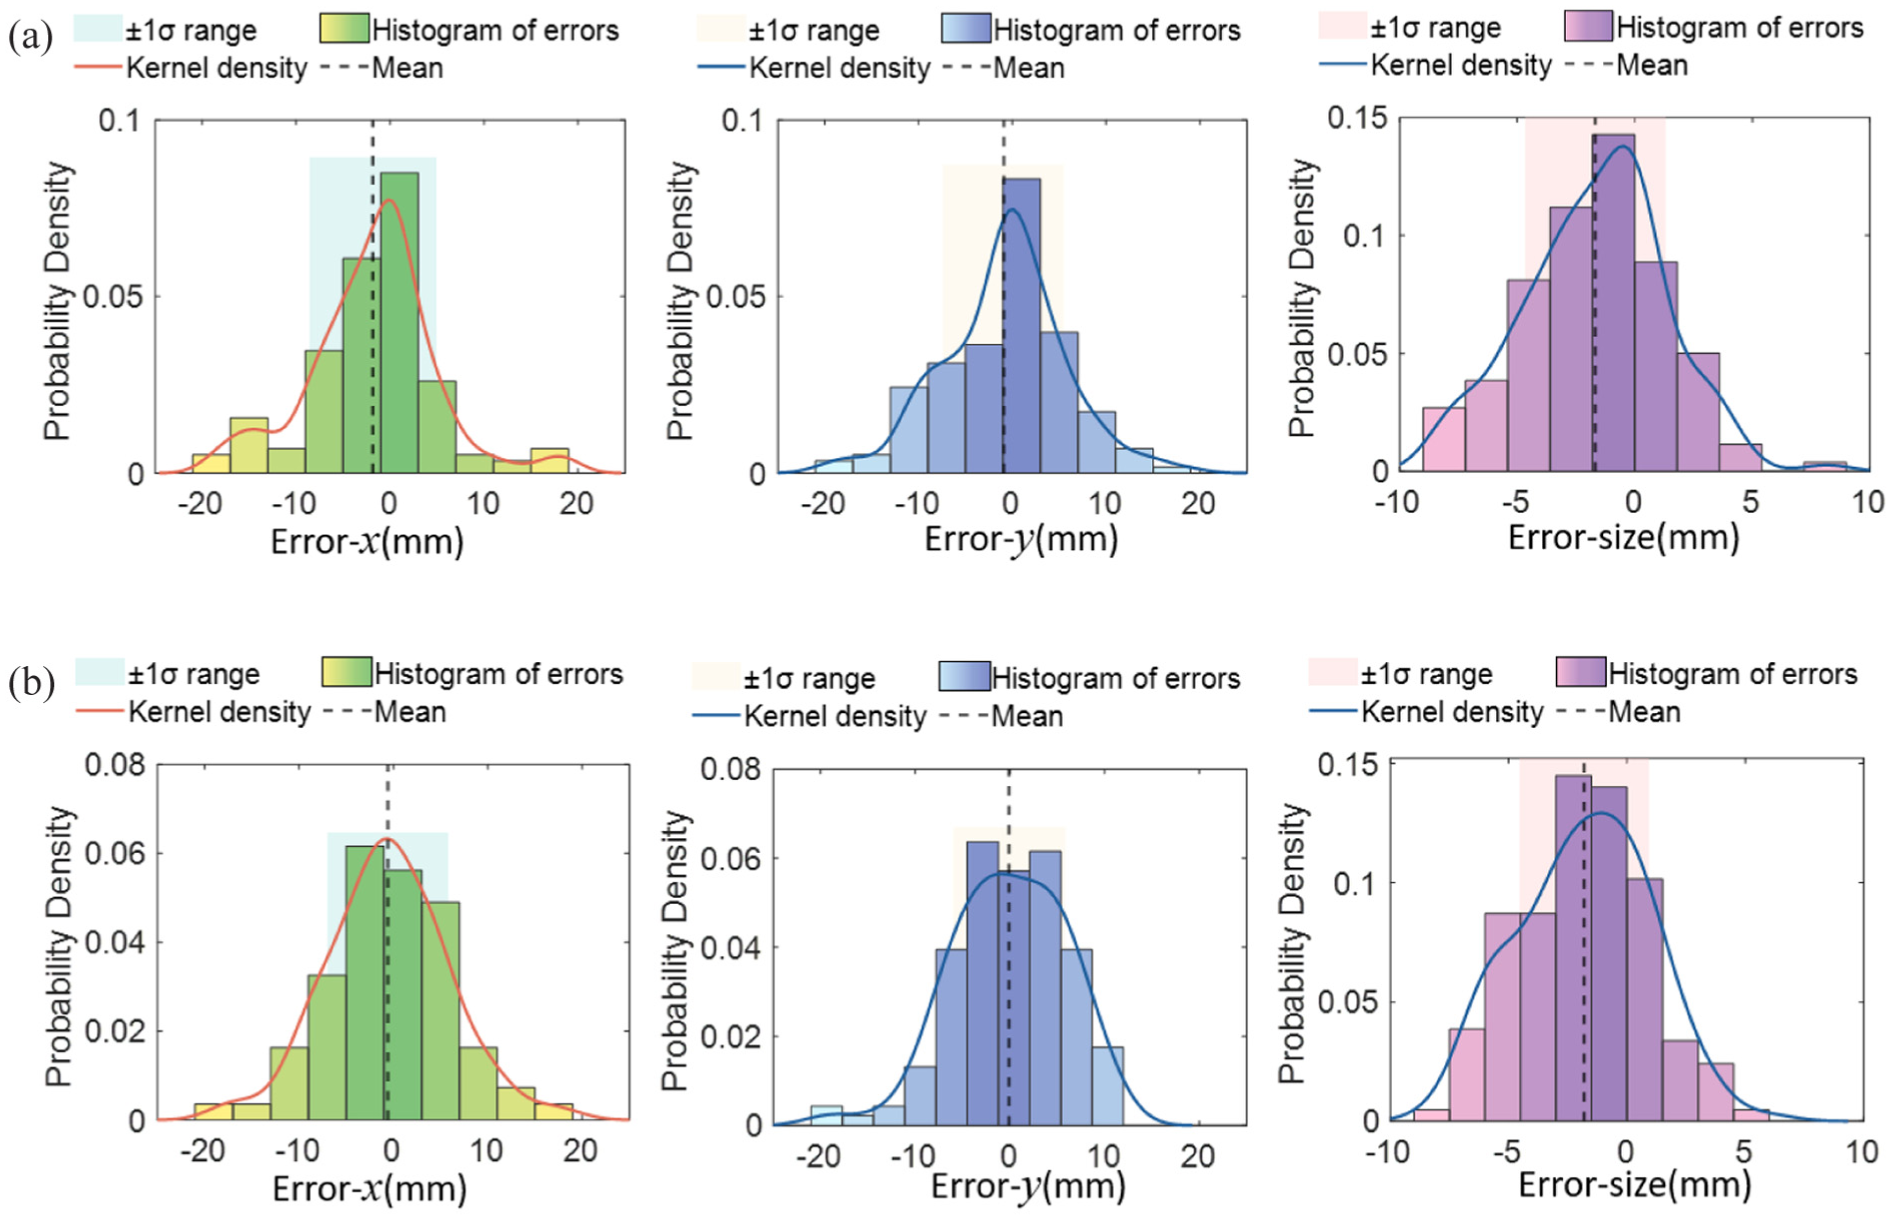
The prediction error distribution of hierarchical feature fusion model in test-A and test-B: (a) test-A and (b) test-B.
To verify the improvement of damage identification performance by structured data expansion, three training methods are designed and compared:
Method 1: Only the data of 24 training points are used for training, the number of training samples is small, and the spatial pattern and amplitude distribution of the damage covered are limited.
Method 2: Forty-five real collected training points are used for training, and the number of samples and space coverage are sufficient, which can be used as a reference for the upper limit of performance.
Method 3: Based on the 24 training points of method 1, new samples of 23 virtual points are generated through CVAE, and the number of training points is expanded to 45.
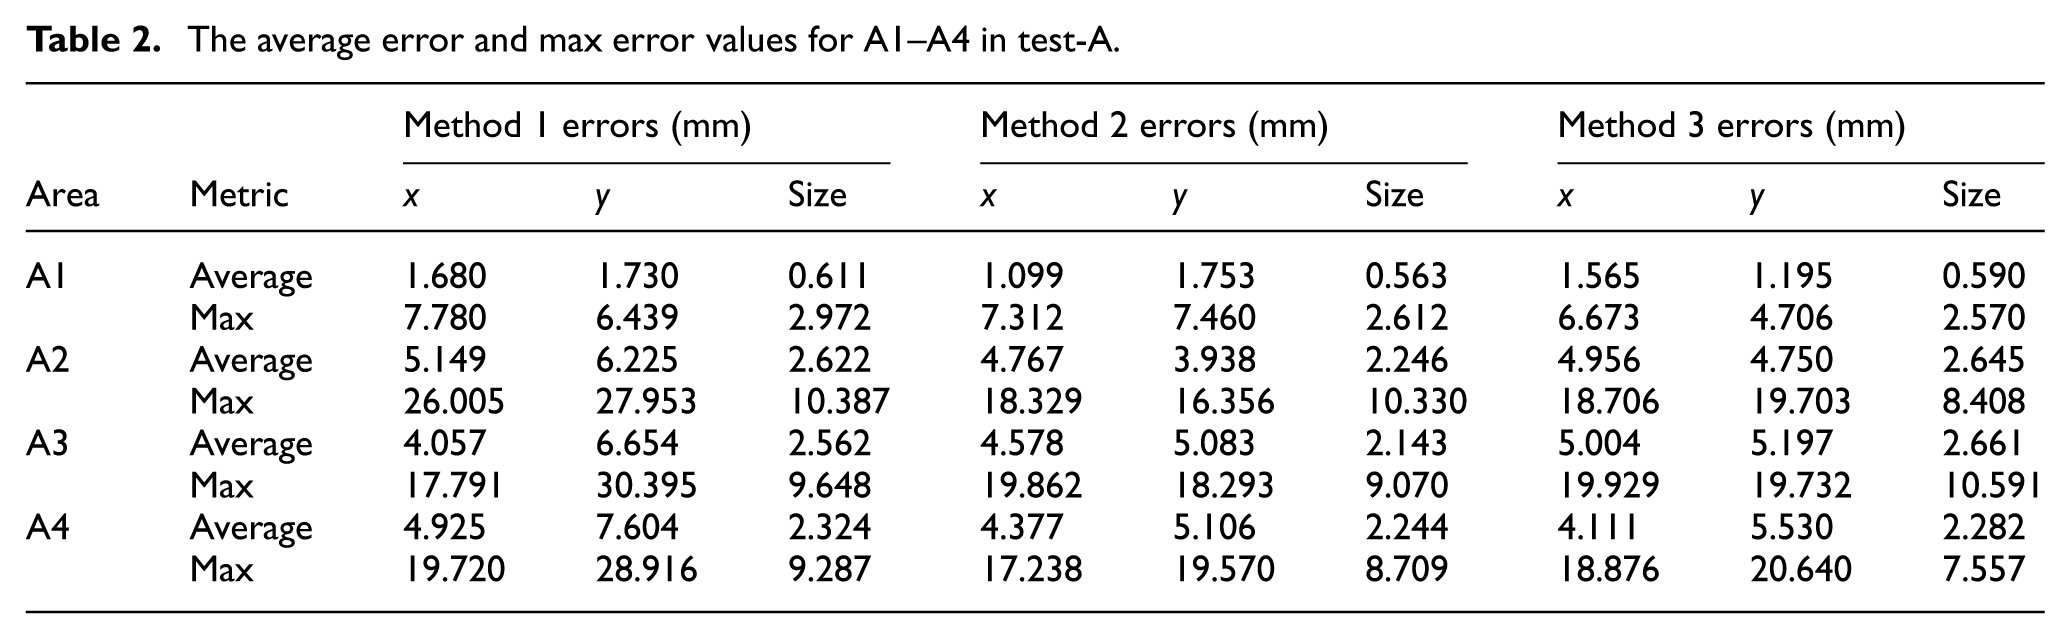
The prediction performance of the three methods on two test sets is used to evaluate the effect of CVAE. Table 2 lists the average error and max error values for A1–A4 in test-A, and Figure 11 shows the average error and max error histograms.
The average error and max error values for A1–A4 in test-A.
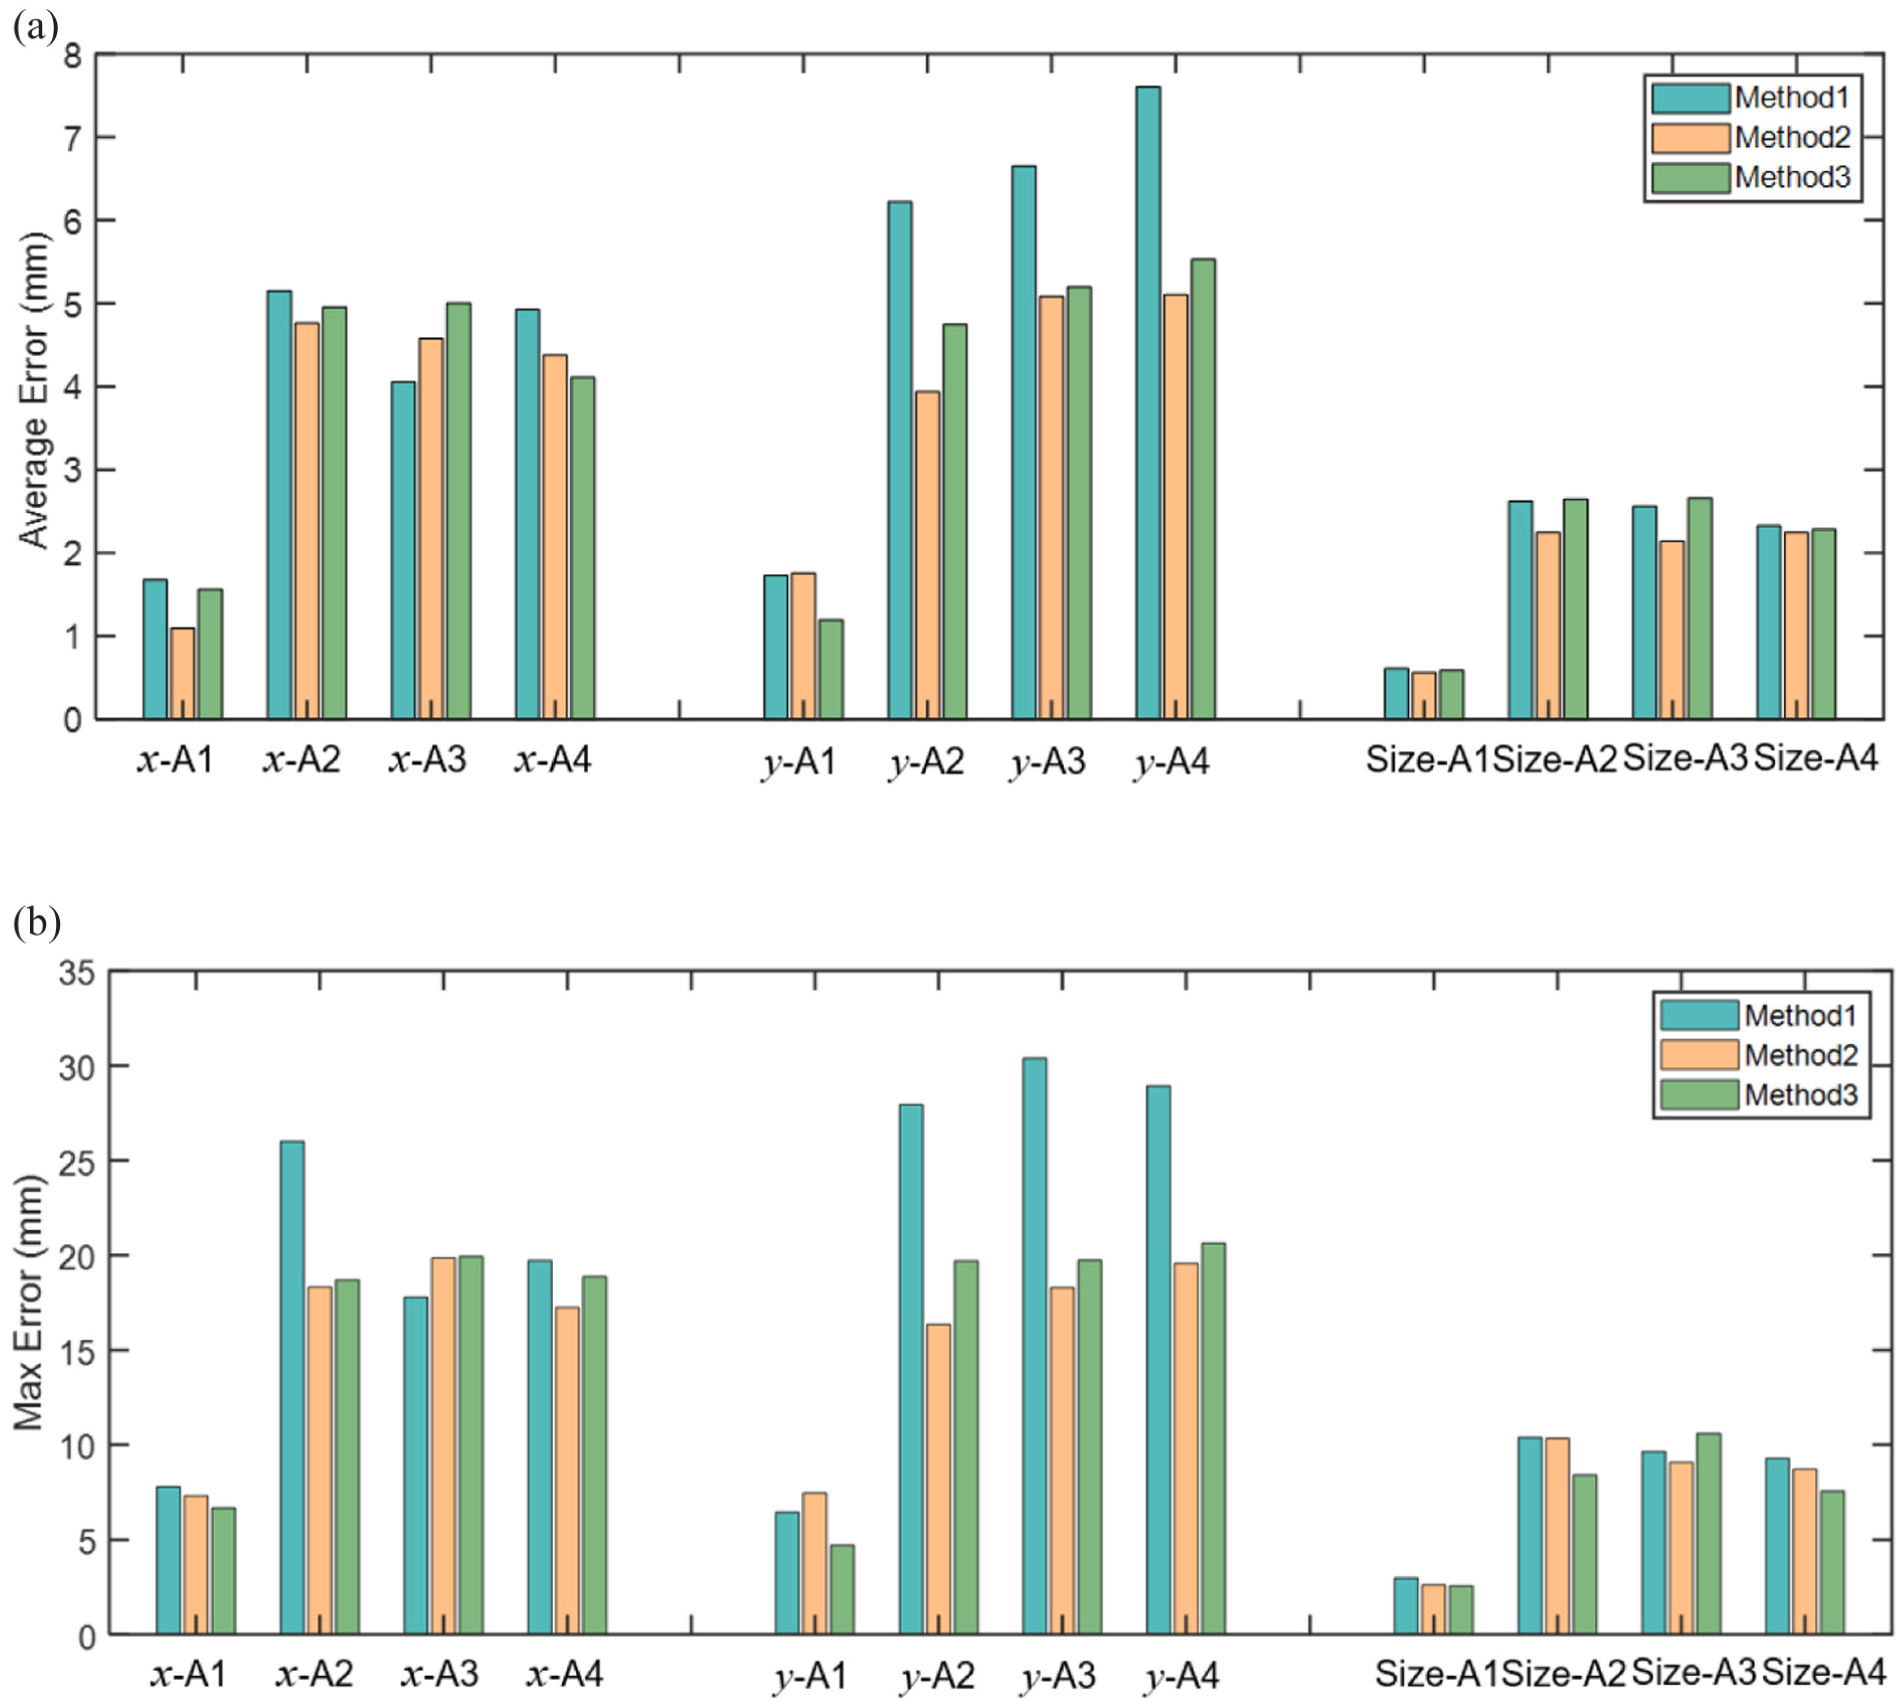
The average error and max error histograms in test-A: (a) average error and (b) max error.
In test-A, all three methods show stable performance in the training domain A1, indicating that the model can accurately learn damage patterns when the spatial location is seen. However, clear performance differences emerge in the unseen areas A2–A4. Method 1 suffers from notable errors due to the limited training data, with average errors of 4.057–5.149 mm (x), 6.225–7.604 mm (y), and 2.324–2.622 mm (size), and maximum errors reaching 17.791–26.005, 27.953–30.395, and 9.287–10.387 mm. Method 2 reduces these errors considerably by increasing the number of real training samples, yielding average errors of 4.377–4.767, 3.938–5.106, and 2.143–2.246 mm, with maximum errors decreased to 17.238–19.862, 16.356–19.570, and 8.709–10.330 mm. Method 3 further integrates CVAE-generated samples and achieves performance comparable to method 2. Its average errors are 4.111–5.004, 4.750–5.530, and 2.282–2.661 mm, while the maximum errors are controlled within 18.706–19.929, 19.703–20.640, and 7.557–10.591 mm. These results demonstrate that structured data augmentation can effectively enhance model robustness under location-unseen conditions, keeping the error range close to that of real-sample training.
Figures 12 and 13 show the scatter plot of location predictions for method 3 and the size prediction box plots of all three methods in test-A. The reason why position prediction only shows method 3 is because it has the best performance and the scatter plot of multiple methods is easy to cause visual redundancy. For location prediction, the results indicate that method 3 accurately captures the spatial distribution of damage, with predicted locations well aligned with true positions in both the training domain (A1) and cross-domain scenarios (A2–A4), which demonstrates strong modeling capability and generalization. For size prediction, all methods achieve high accuracy in the training domain A1. Although methods 2 and 3 improve the overall error distribution in cross-domain scenarios (A2–A4), the enhancement in size prediction remains relatively limited. This suggests that the variation of size-related features is less significant than location-related features, which leads to the relatively limited improvement of prediction accuracy and the learning ability of the model still needs to be improved.
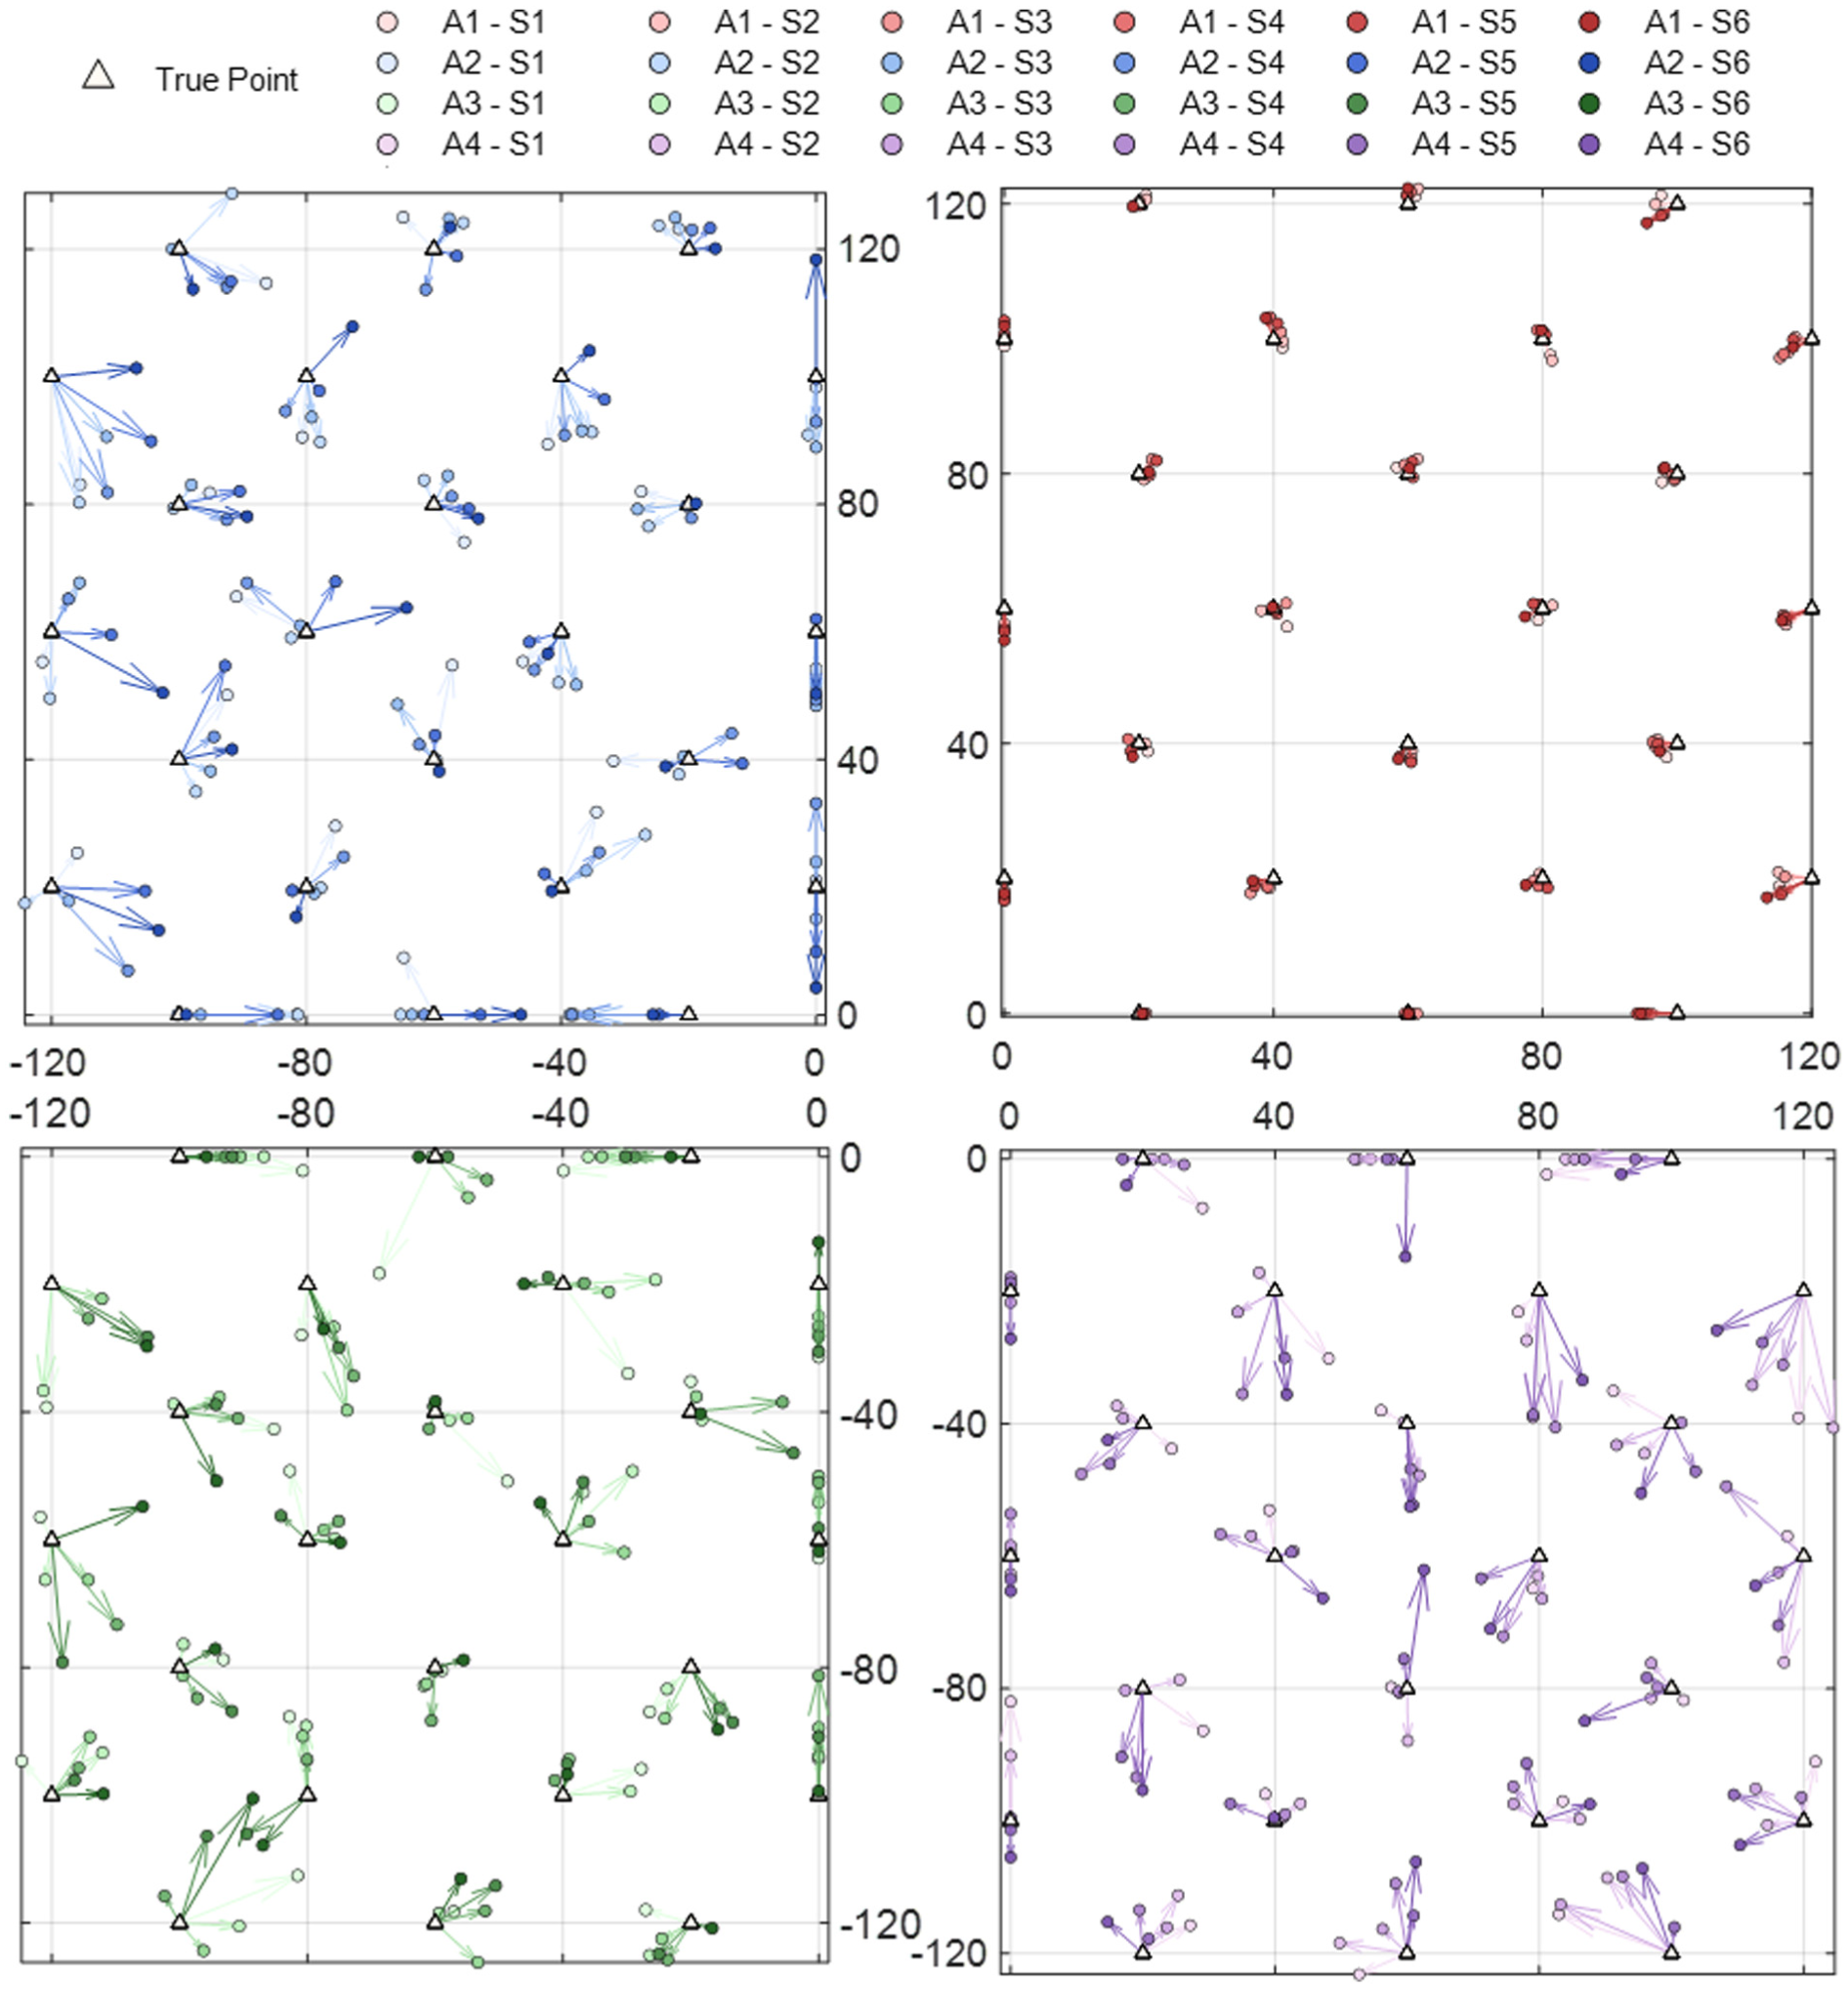
The scatter plots of location predictions for the method 3 in test-A.
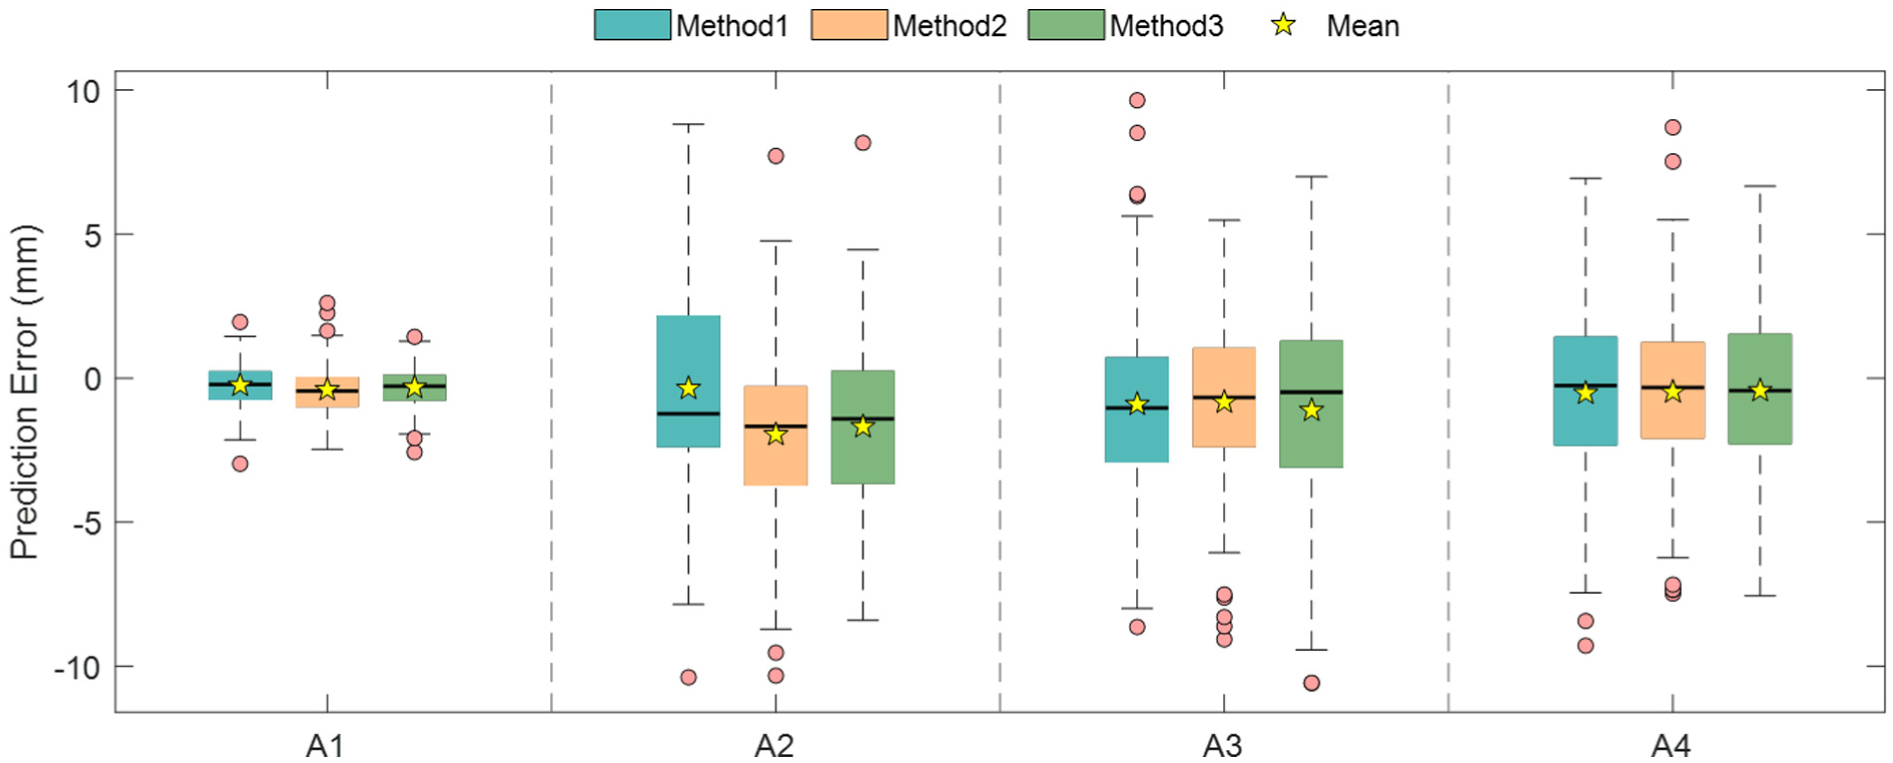
The box plots of size predictions for the three methods in test-A.
Table 3 lists the average error and max error values for A1–A4 in test-B, and Figure 14 show the average error and max error histograms.
The average error and max error values for A1–A4 in test-B.
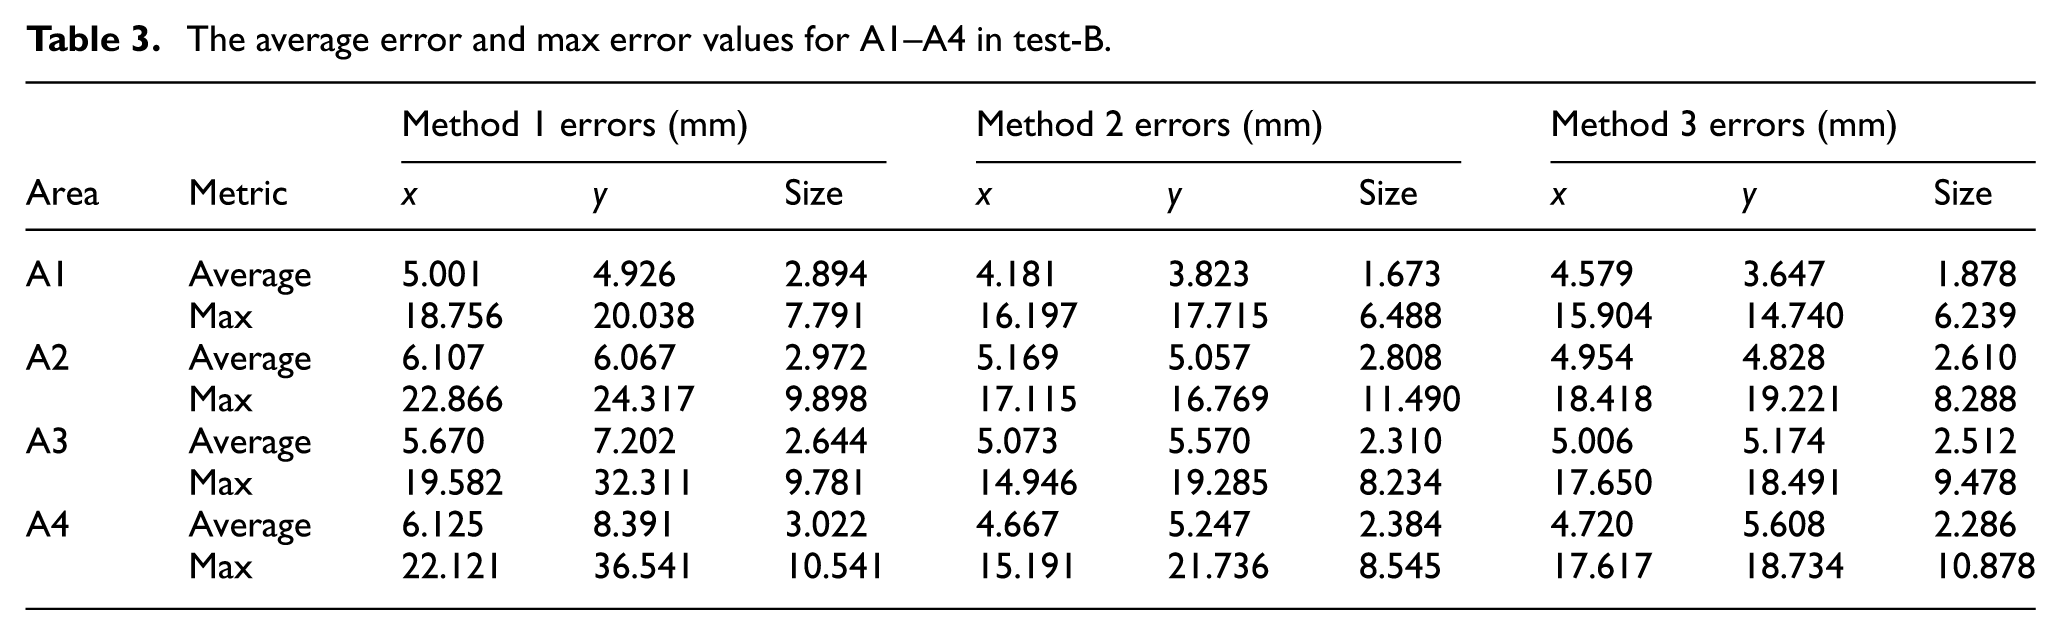
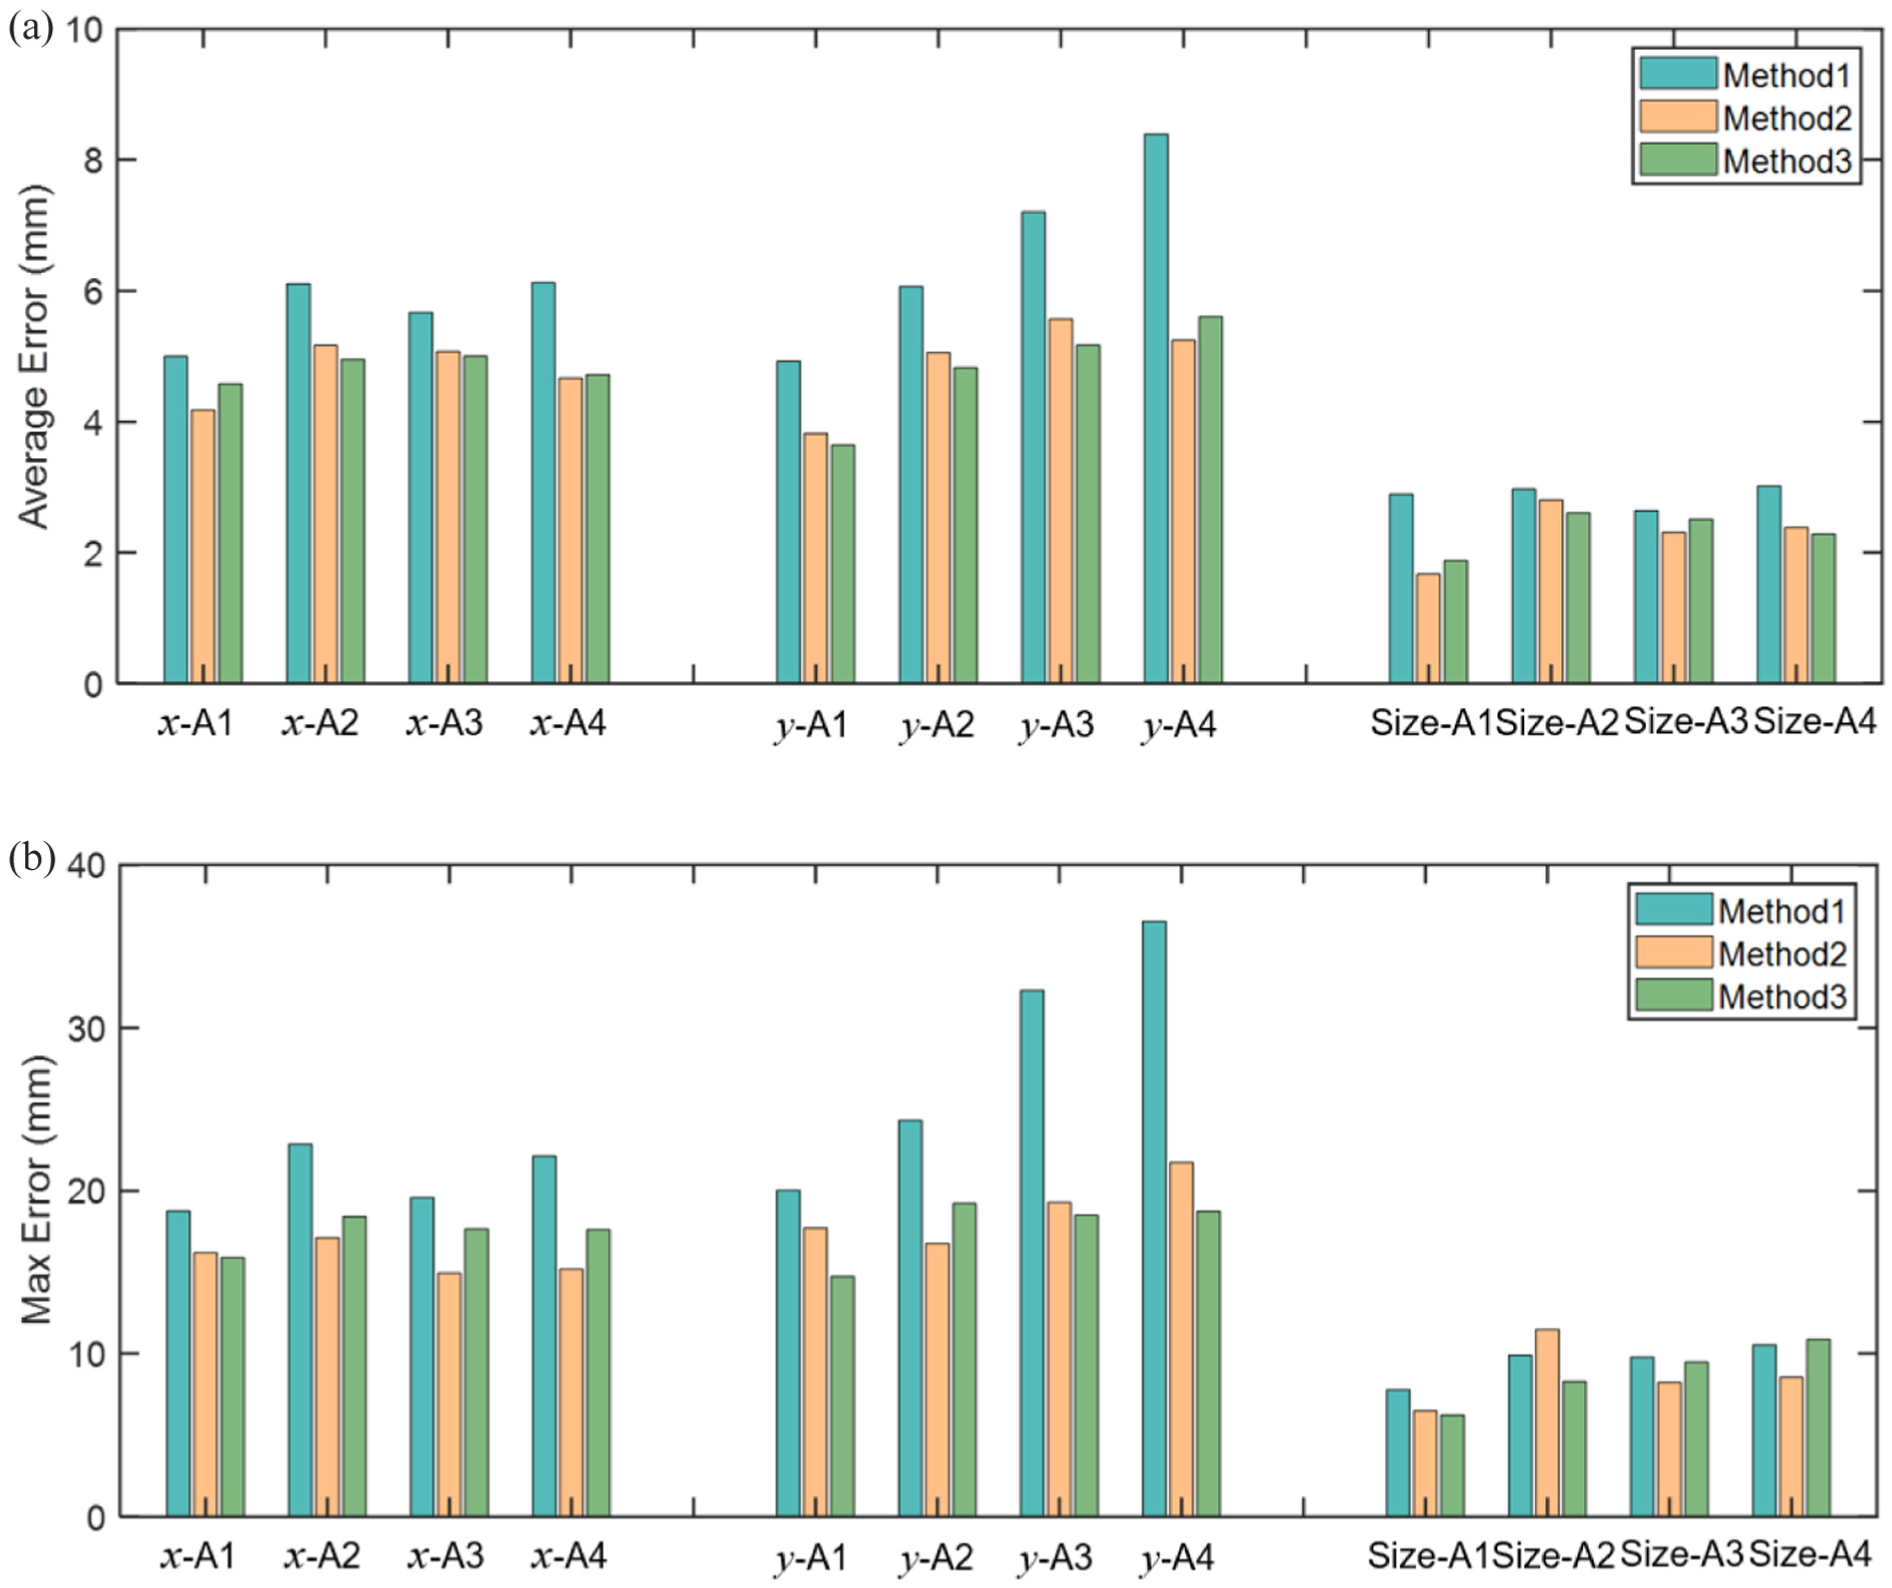
The average error and max error histograms in test-B: (a) average error and (b) max error.
In test-B, all three methods show slightly higher errors than in test-A, reflecting the increased challenge of predicting damage at unknown spatial locations. Method 1 exhibits notable errors due to limited training data, with average errors of 5.001–6.125 mm (x), 4.926–8.391 mm (y), and 2.644–3.022 mm (size), and maximum errors of 18.756–22.866, 20.038–36.541, and 7.791–10.541 mm. Method 2 reduces these errors by increasing the number of real training samples, achieving average errors of 4.181–5.169, 3.823–5.570, and 1.673–2.808 mm, and maximum errors of 14.946–17.115, 16.769–21.736, and 6.488–11.490 mm. Method 3 further incorporates CVAE-generated samples and achieves performance comparable to method 2, with average errors of 4.579–5.006, 3.647–5.608, and 1.878–2.610 mm, and maximum errors of 15.904–18.418, 14.740–19.221, and 6.239–10.878 mm. These results indicate that structured data augmentation effectively improves the robustness and generalization of the model under location-unseen conditions, while maintaining stable and consistent predictions.
Figures 15 and 16 show the scatter plot of location predictions for method 3 and the size prediction box plots of all three methods in test-B. Similar to test-A, method 3 accurately captures the spatial damage patterns, with predicted locations generally aligned with the true locations, although prediction errors are slightly more dispersed due to the unseen locations. For size prediction, methods 2 and 3 outperform method 1, but the improvement is less pronounced than for location, indicating that learning size-related features under extrapolation remains challenging. Overall, the results of test-B verify that the structured data expansion can still maintain high prediction consistency in unknown locations, but at the same time, it also shows that higher requirements are put forward for the spatial generalization ability of the model in extrapolation scenarios.
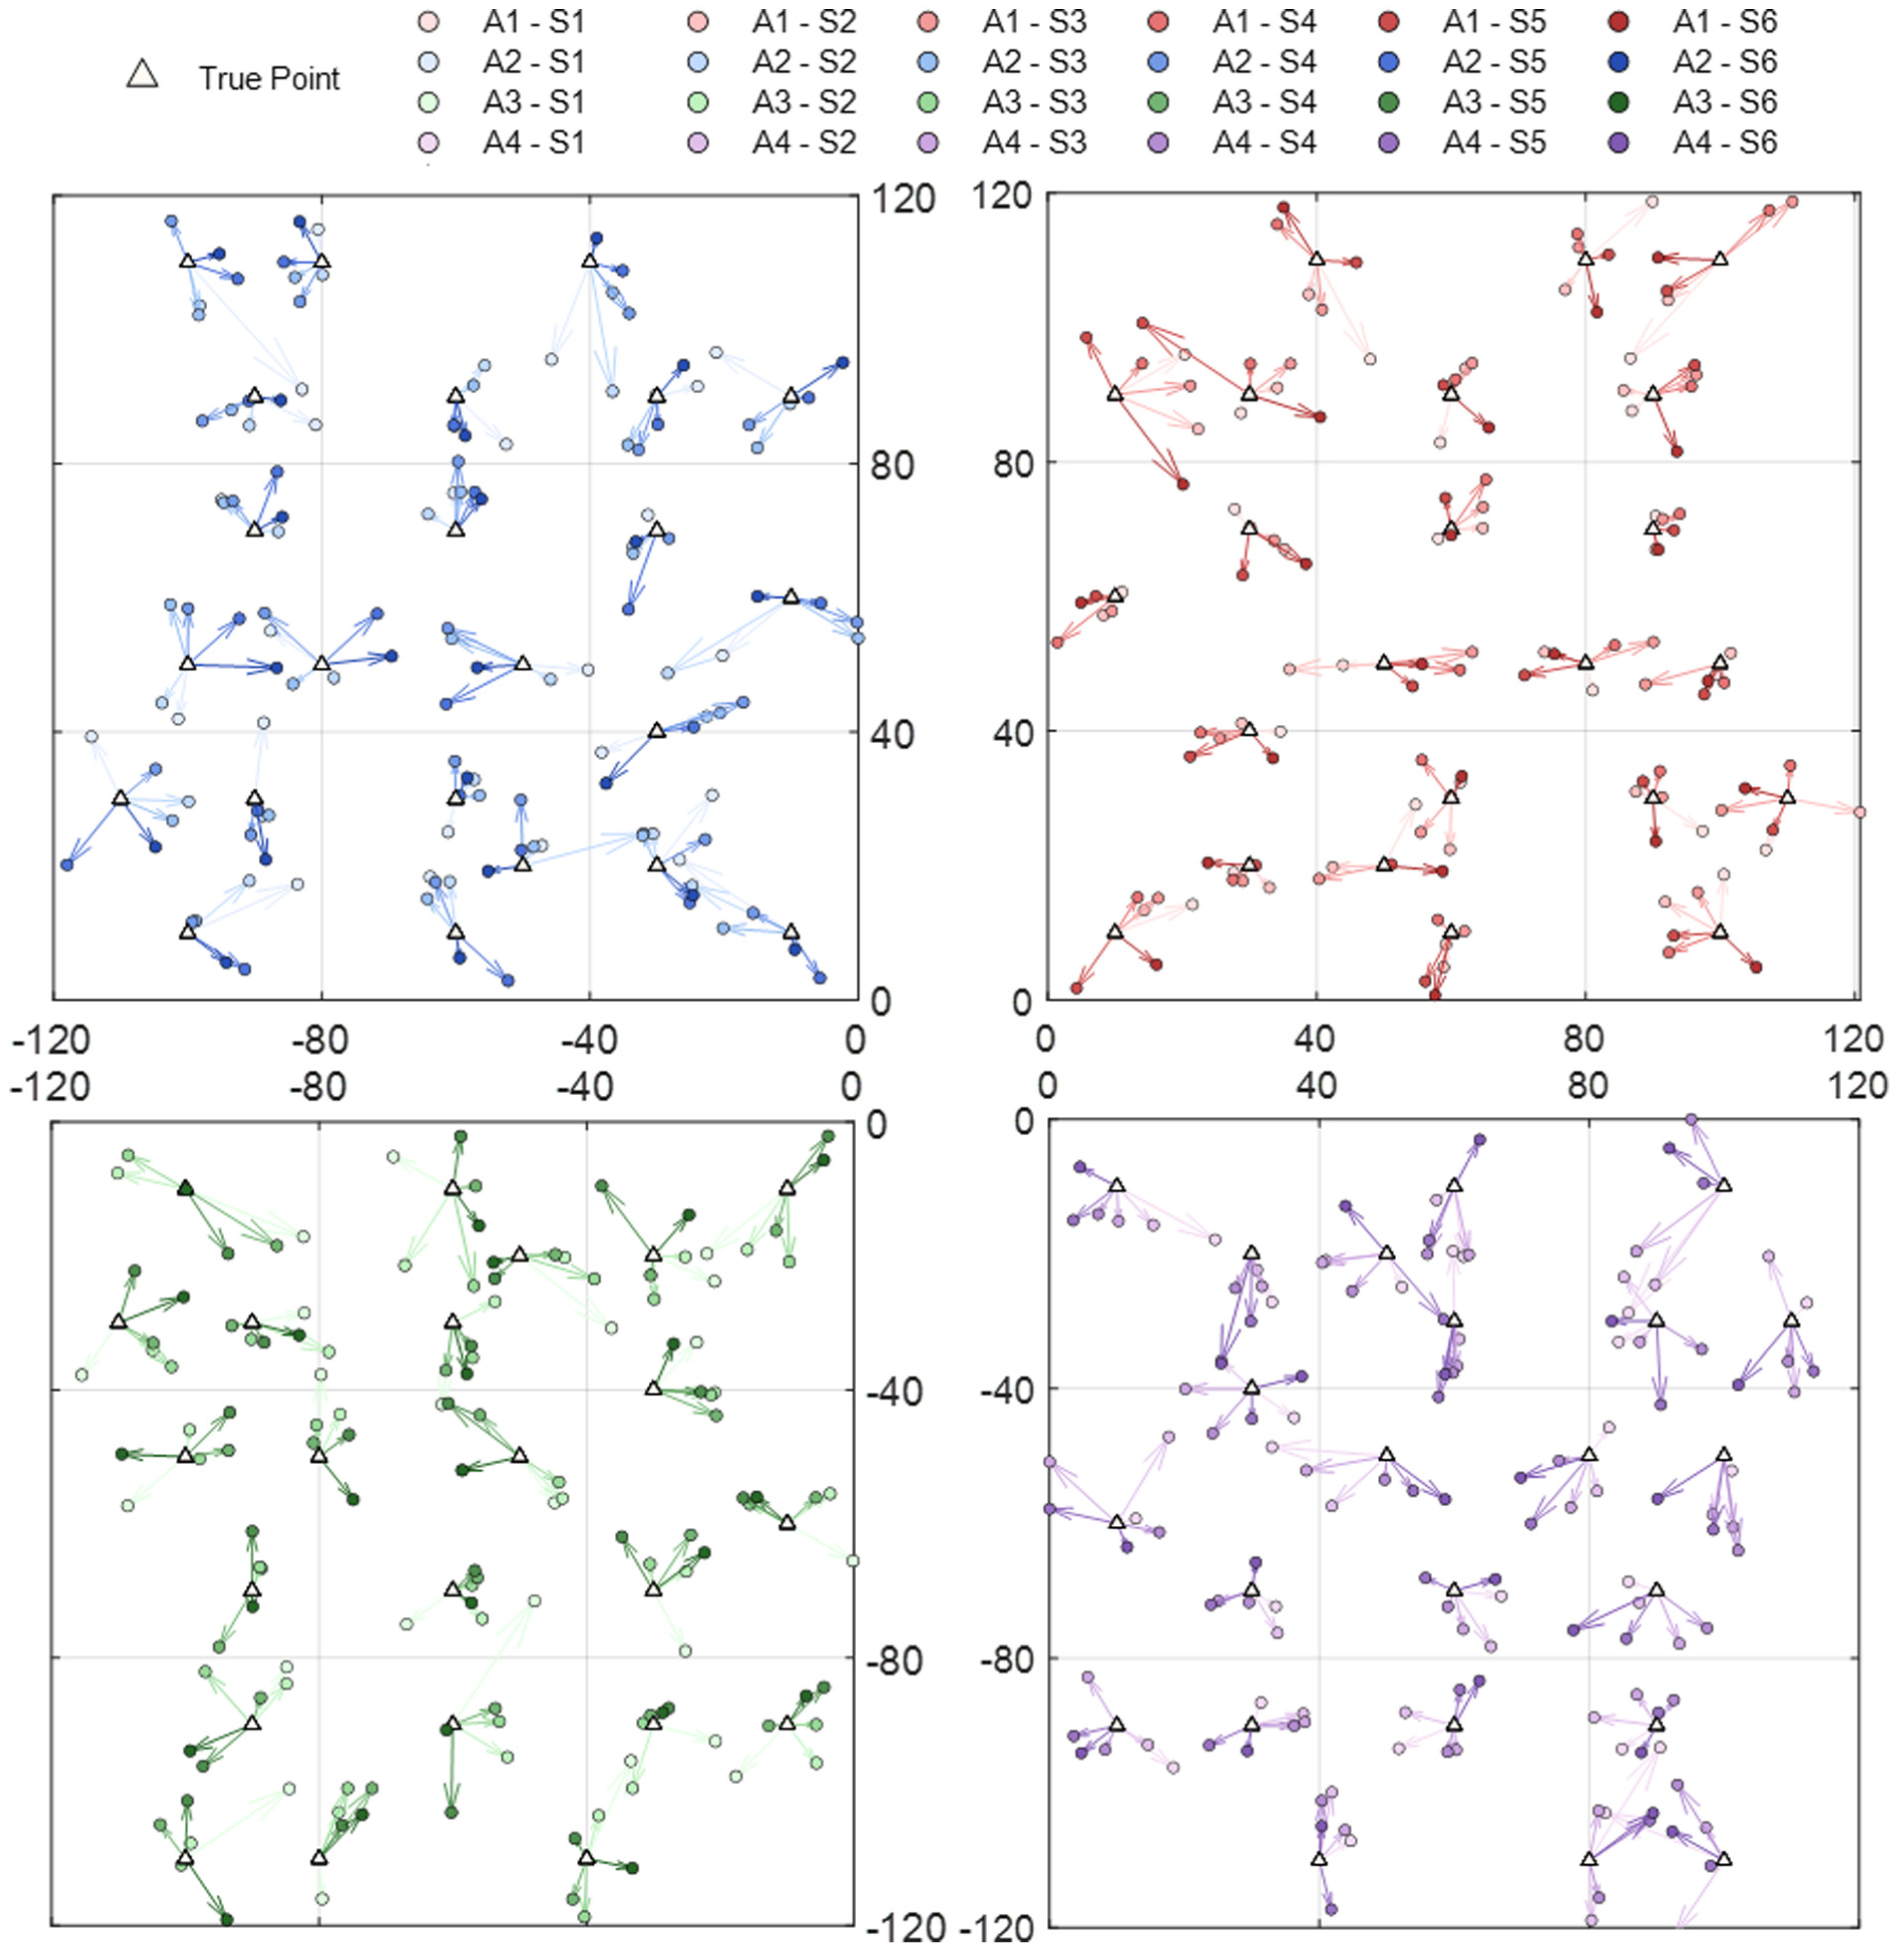
The scatter plots of location predictions for the method 3 in test-B.
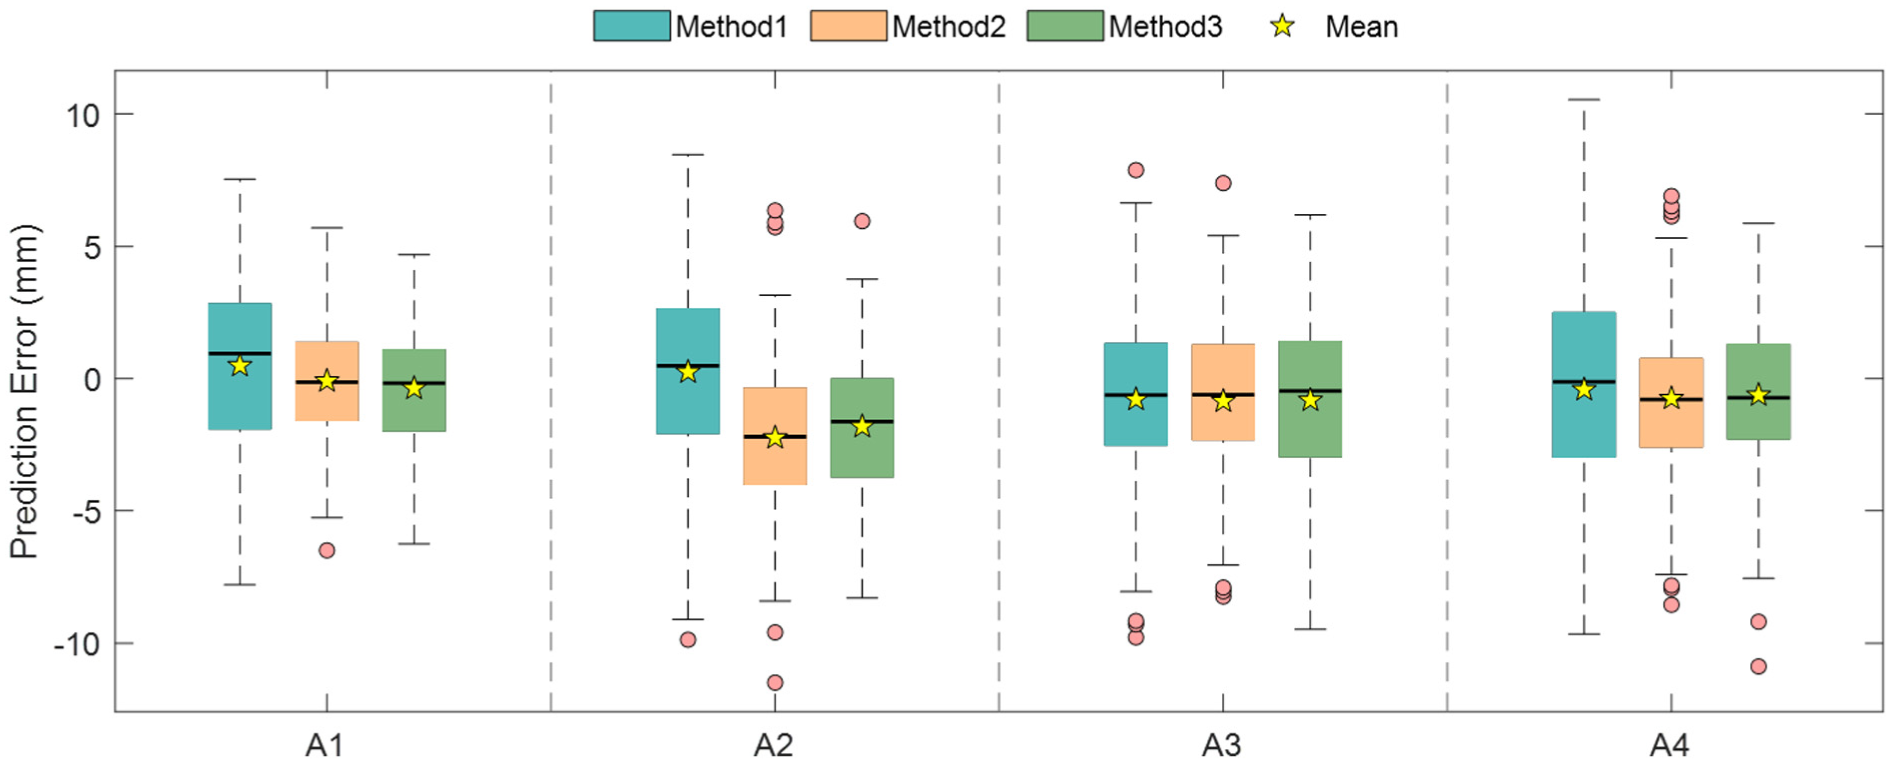
The box plots of size predictions for the three methods in test-B.
DANN cross-domain test results
Based on the preceding analysis, while CVAE-based structured data expansion improves the location prediction stability, damage size prediction remains limited, with error reduction notably smaller than that of location prediction. This is mainly due to domain shifts between test sets, including changes in sensing paths, energy attenuation patterns, and local waveform inconsistencies, which challenge consistent feature mapping across domains. To address this, DANN is introduced on top of method 3 to form method 4, aligning feature distributions between source and target domains to reduce feature transfer deviation and enhance cross-domain generalization.
To verify the cross-domain generalization of DANN, tests are conducted in A2–A4 domains. Taking A2 as an example, Figure 17 shows the prediction error distributions of method 4 in test-A and test-B. Errors in x, y, and size are approximately normally distributed around zero, with sharper peaks indicating reduced dispersion and fewer extreme errors. Especially, compared with method 3, method 4 achieves smaller errors in both location and size, demonstrating that aligning source and target feature distributions via DANN effectively improves cross-domain prediction accuracy and robustness.
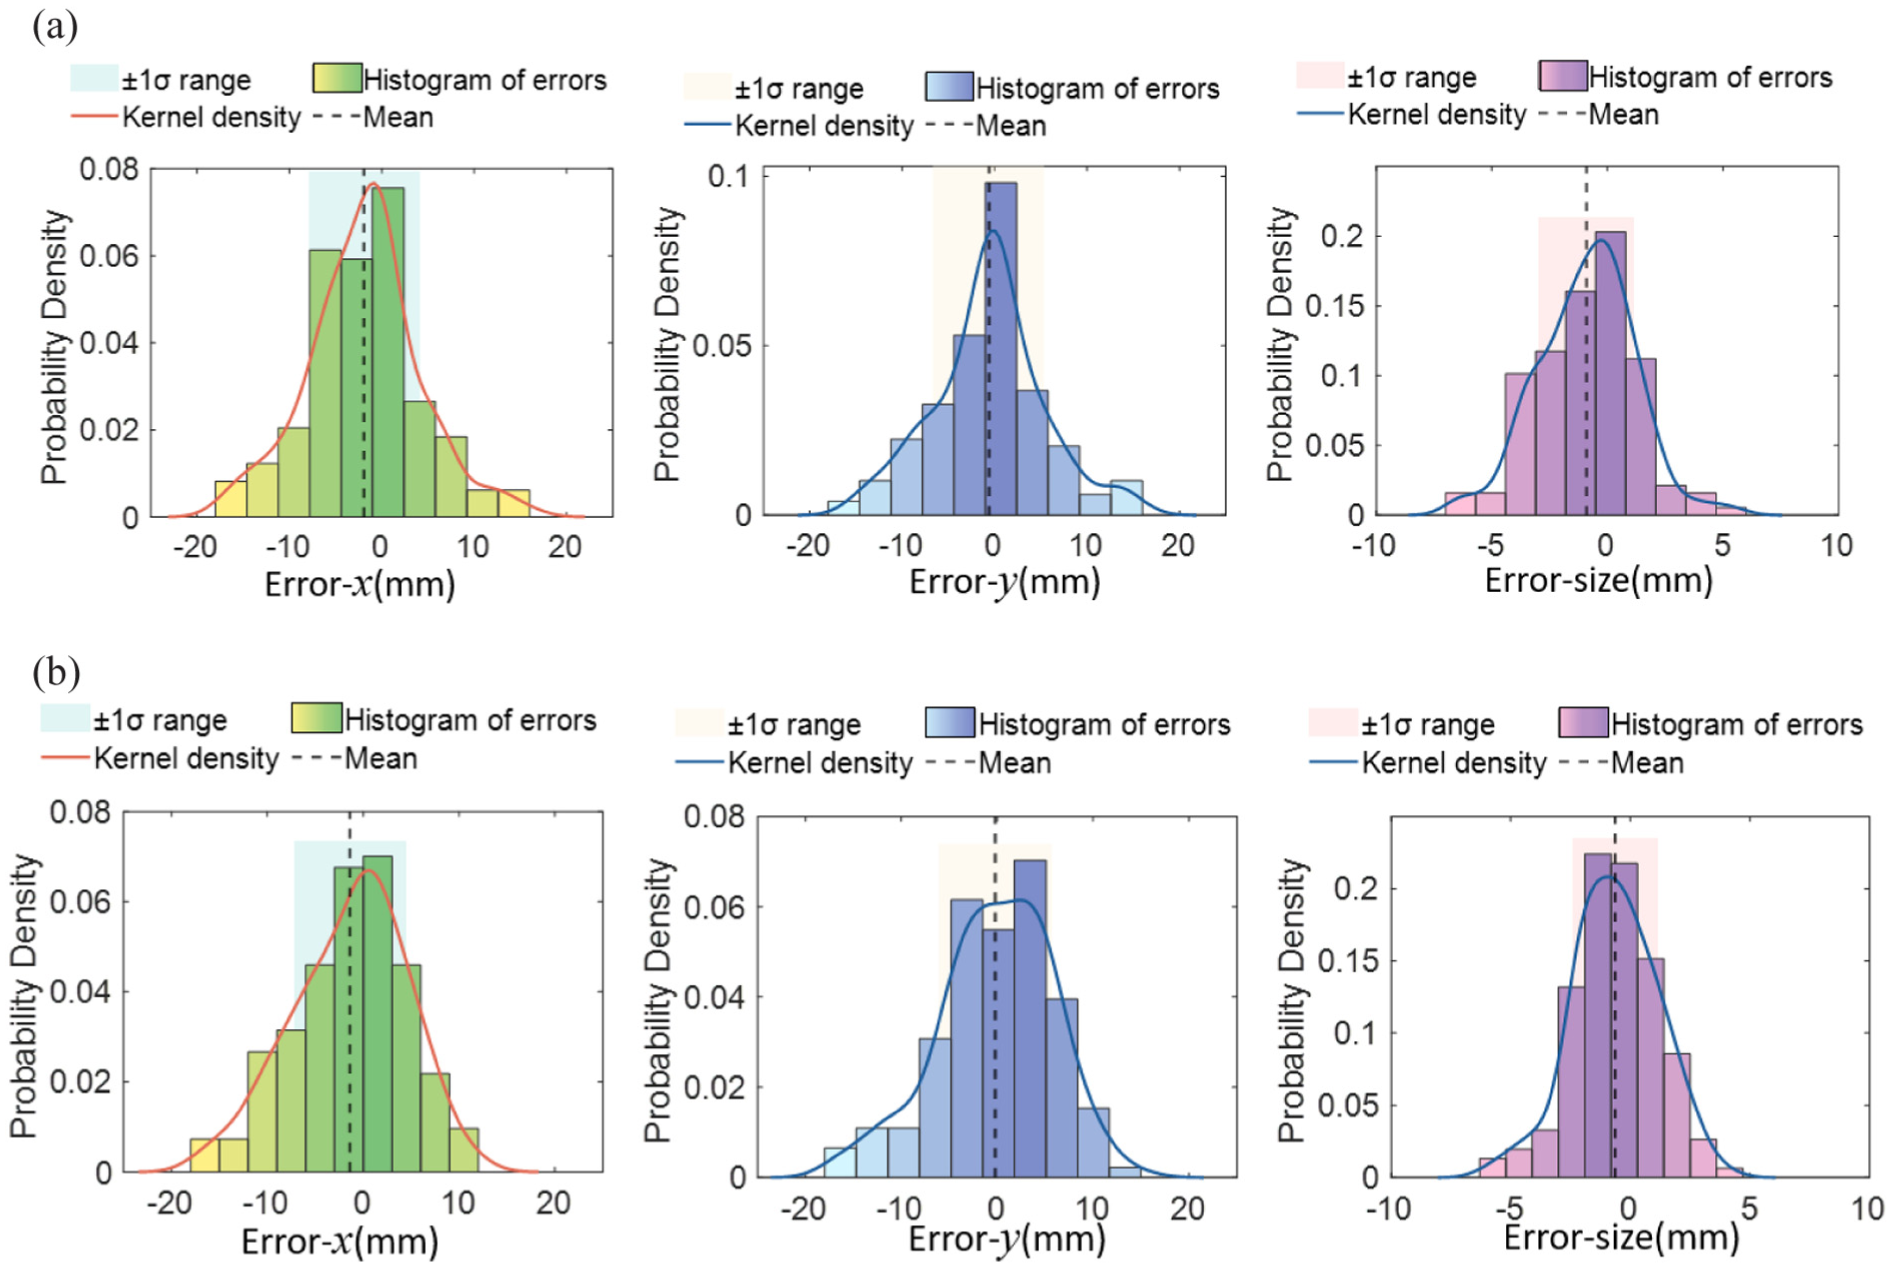
The prediction error distribution of method 4 in (a) test-A and (b) test-B.
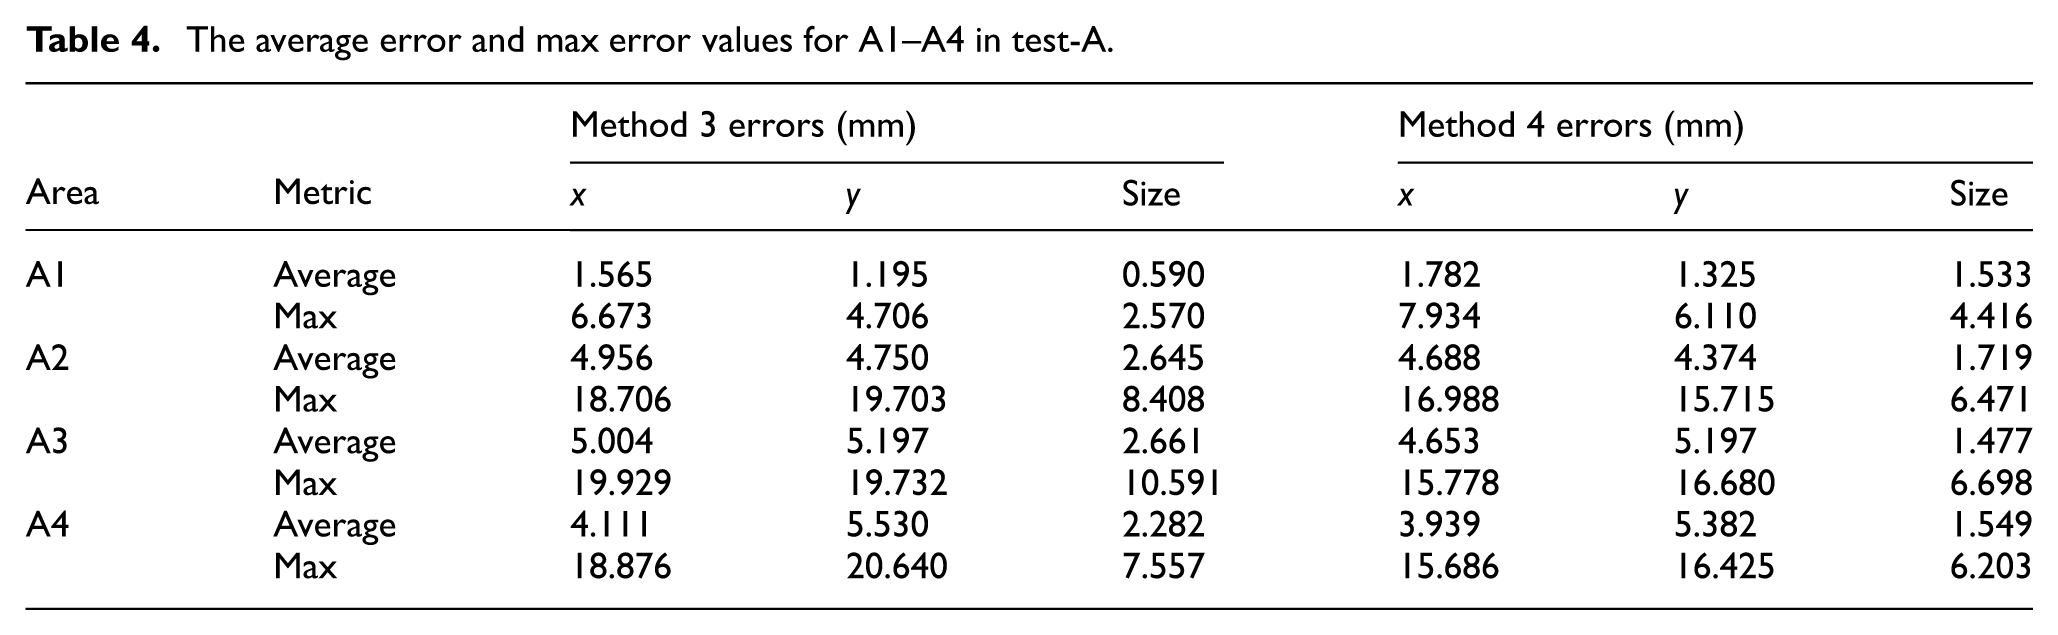
To prove the role of DANN in cross-domain prediction, the prediction results of method 3 without DANN and method 4 with DANN are compared. Table 4 lists the average error and max error values for A1–A4 in test-A, and Figure 18 show the average error and max error histograms.
The average error and max error values for A1–A4 in test-A.
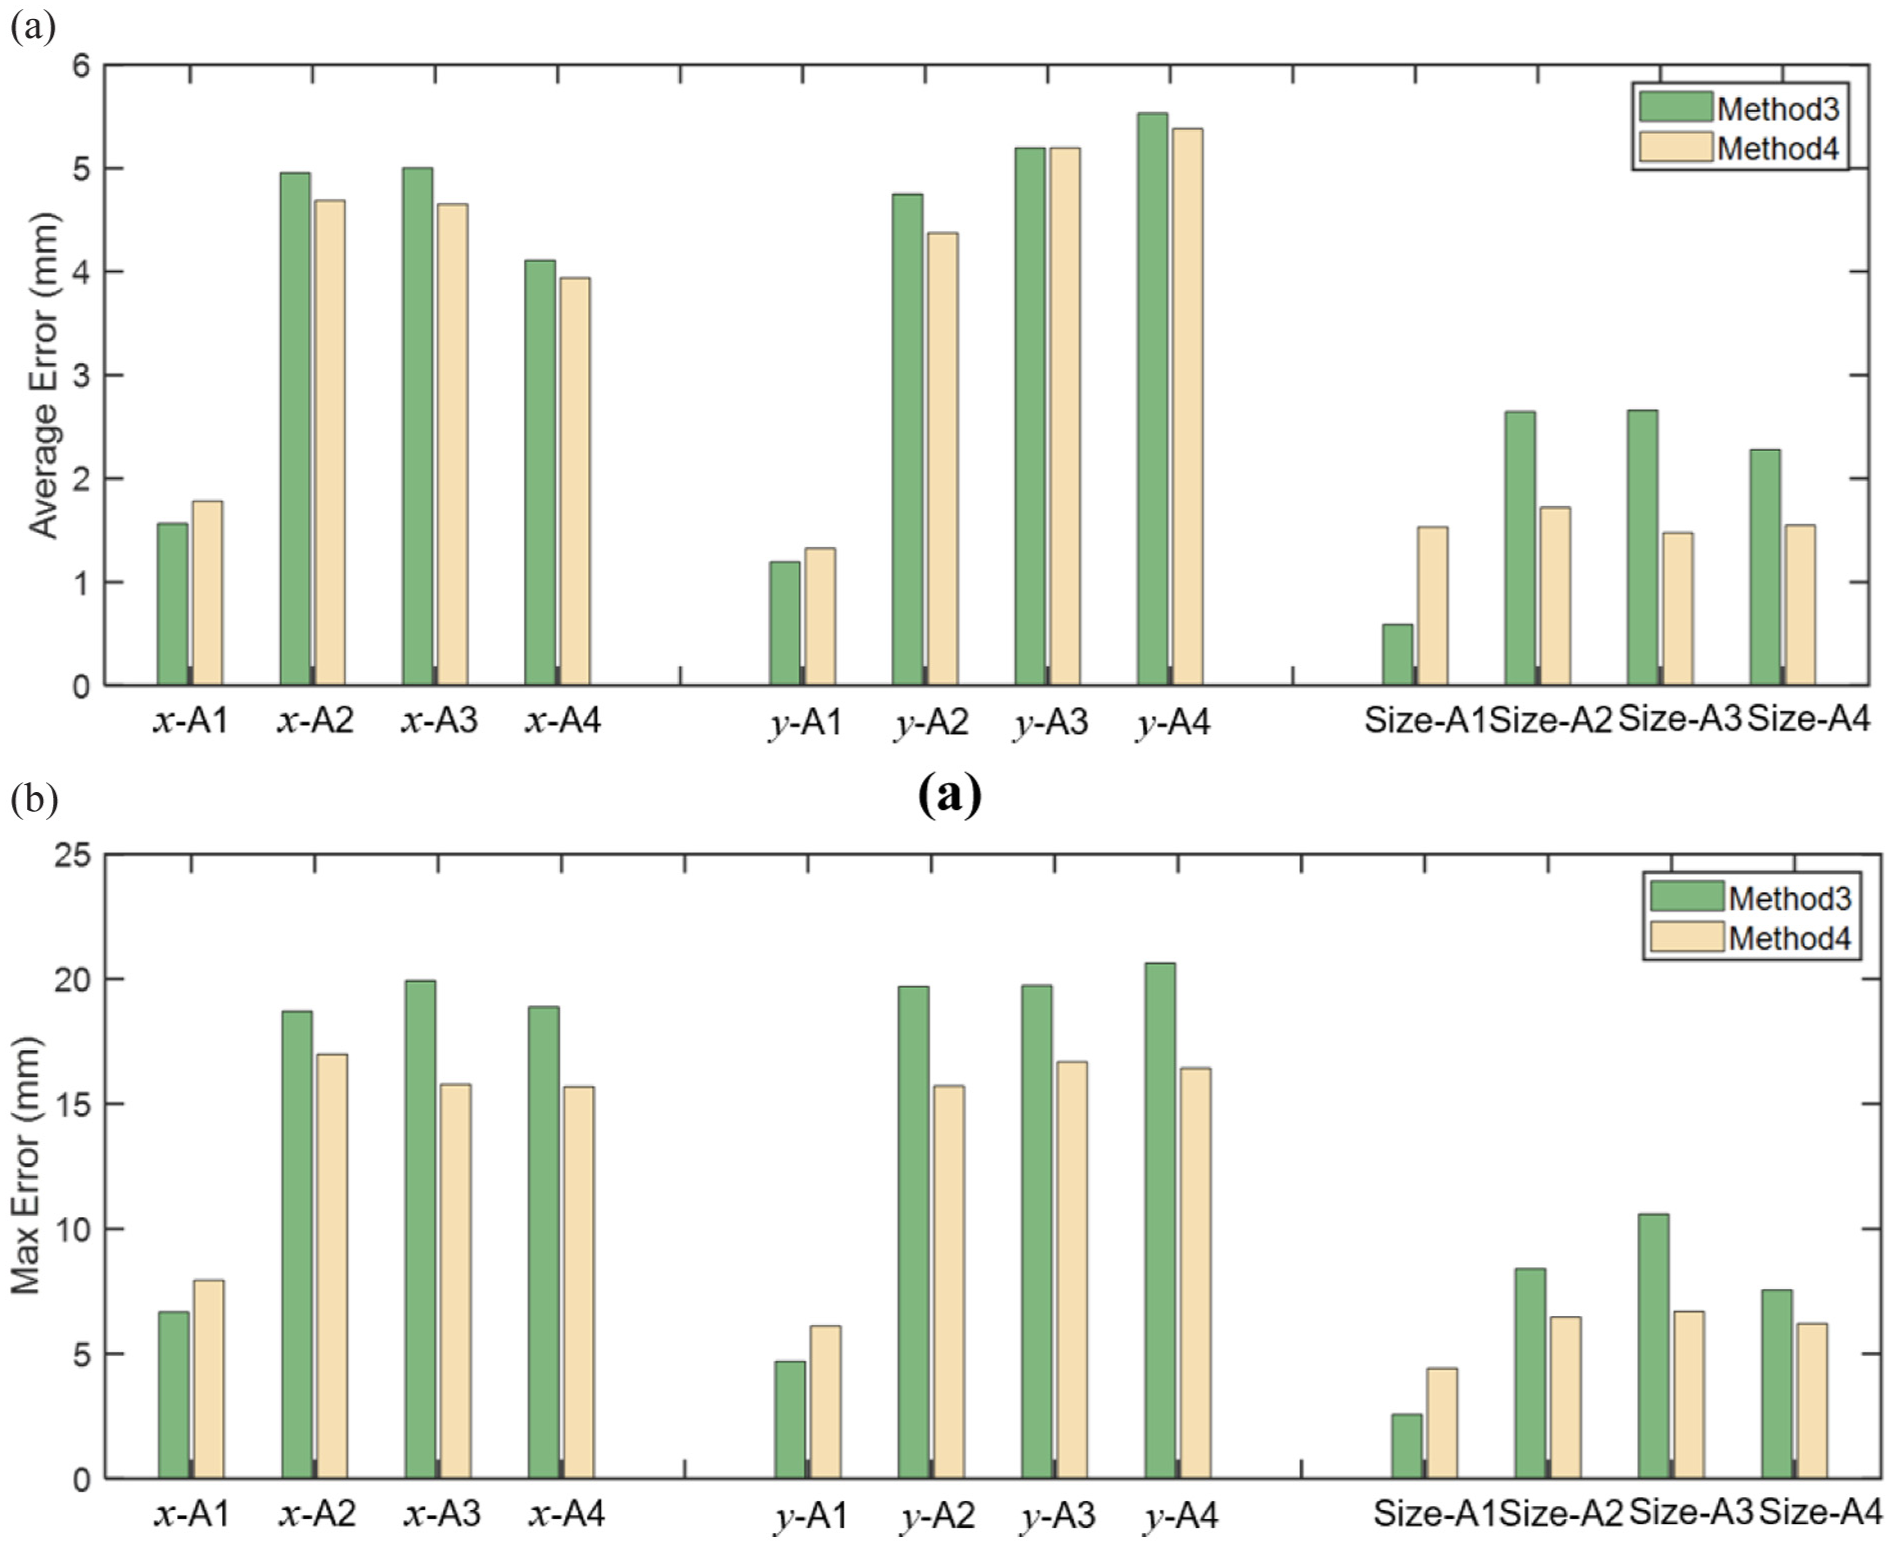
The average error and max error histograms in test-A: (a) average error and (b) max error.
From the test-A results, the introduction of DANN significantly improves the prediction accuracy of method 4 across all test domains, with low overall errors and good stability. In the cross-domain A2–A4, average errors of x, y, and size are 3.939–4.688, 4.374–5.382, and 1.477–1.719 mm, respectively, with maximum errors of 15.686–16.988, 15.715–16.680, and 6.203–6.698 mm. Compared with method 3, method 4 reduces error fluctuation, stabilizes location prediction, concentrates spatial distribution, and improves consistency between predicted locations and true locations. Specifically, x average and max errors decrease by 5–7 and 15–20%, y errors by 3–8 and 10–25%, and size errors by 35–45 and 20–37%, which demonstrates that DANN effectively aligns feature distributions across domains and enhances the model’s stability in capturing features.
Figures 19 and 20 show the scatter plots of location predictions for method 3 and the size prediction box plots of methods 3 and 4 in test-A. For location prediction, the predicted locations across the four sub-areas (A1–A4) exhibit good concentration around the true damage locations, and most of the prediction errors are within ±10 mm, which shows that this method has high locating accuracy and stability under the seen locations. For size prediction, method 4 consistently shows lower box heights, fewer outliers, and more concentrated results compared with method 3, which shows that DANN can effectively improve the accuracy and robustness of size prediction under seen locations.
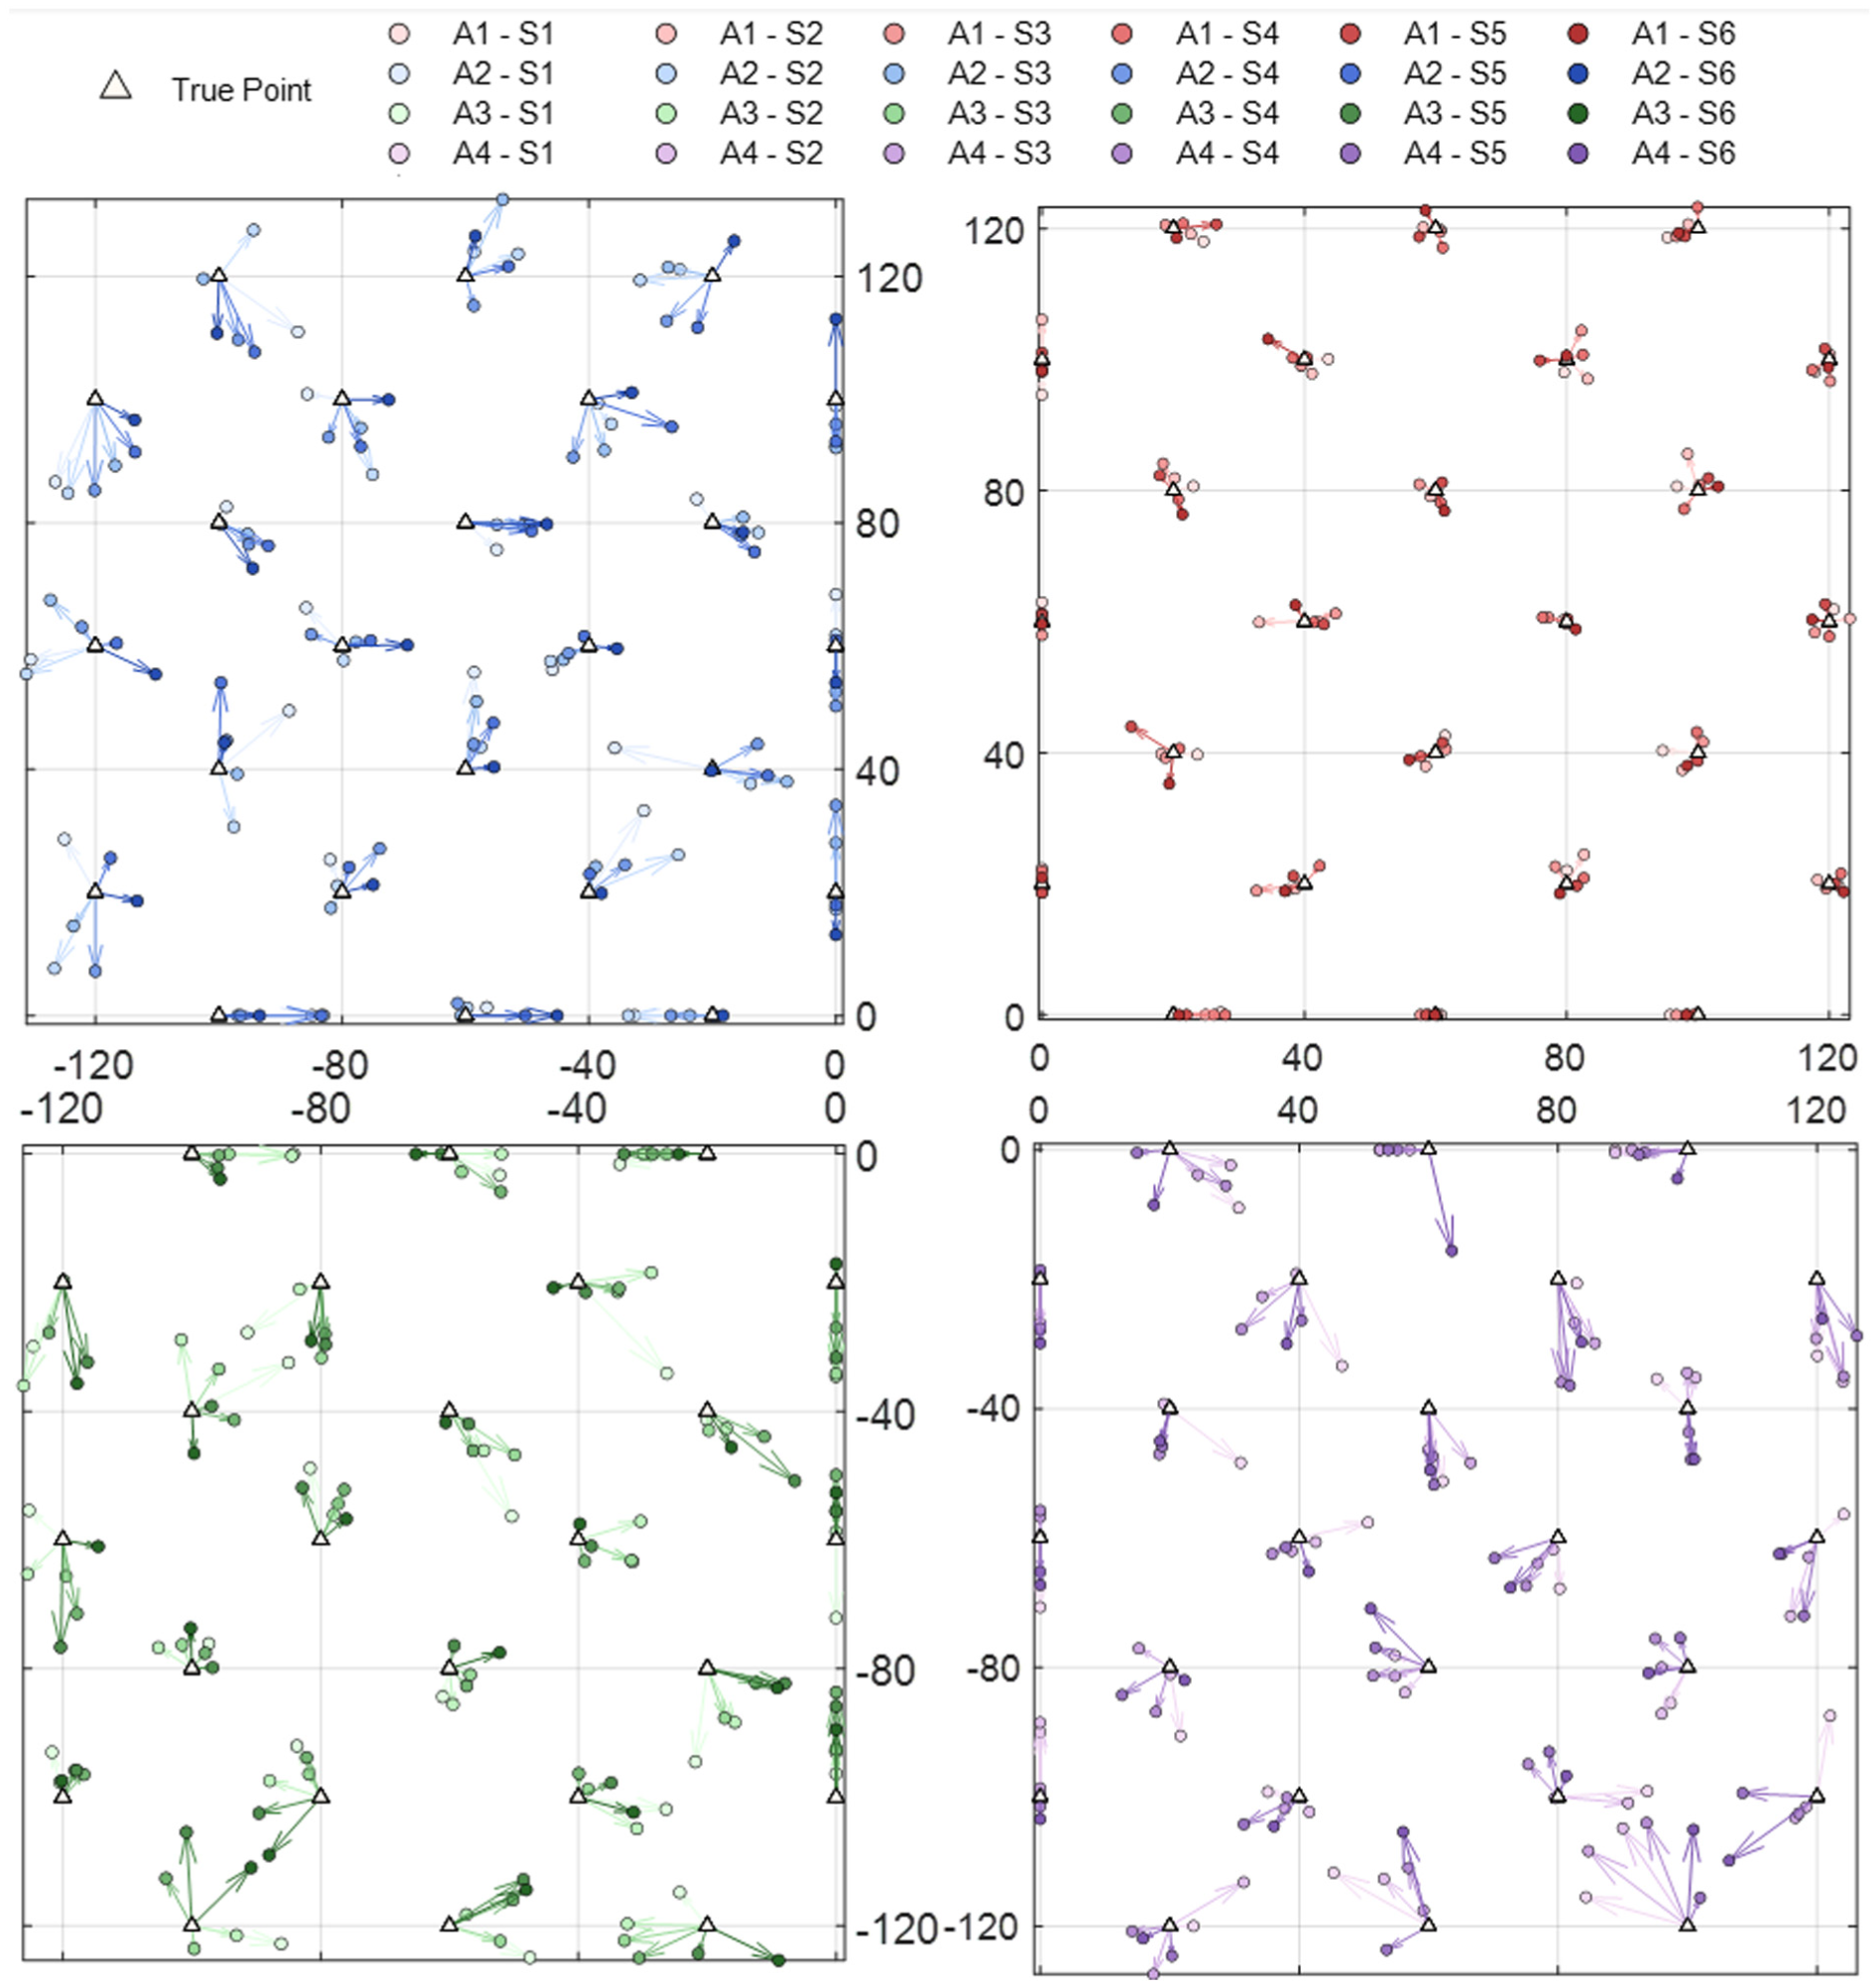
The scatter plots of location predictions for the method 4 in test-A.
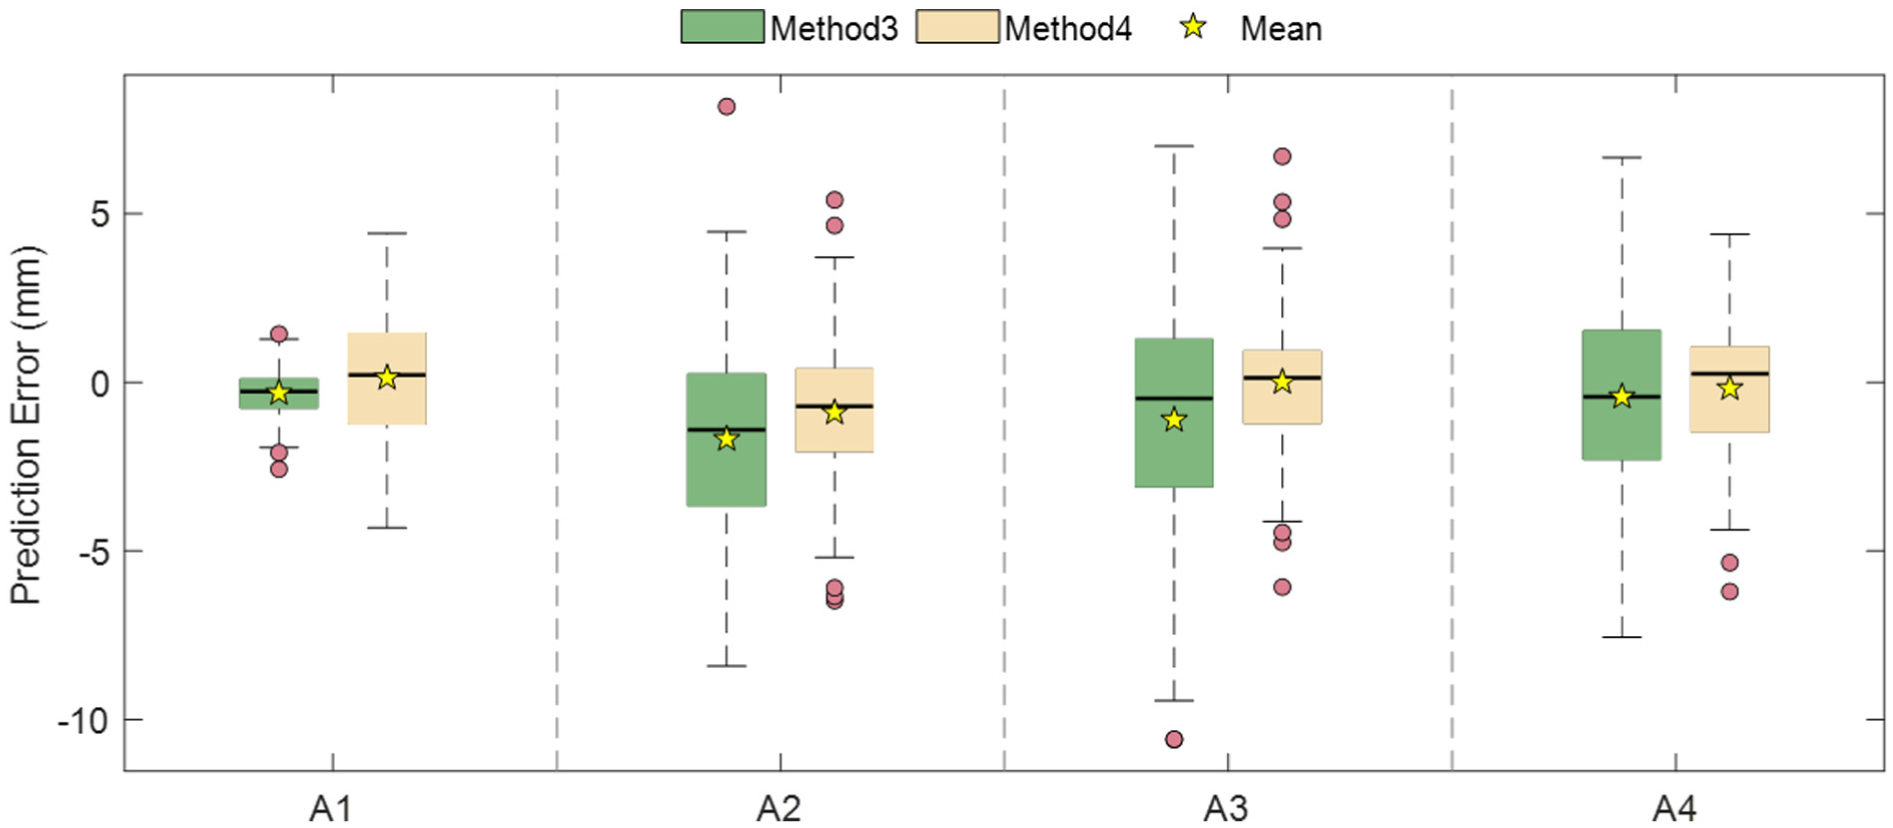
The box plots of size predictions for methods 3 and 4 in test-A.
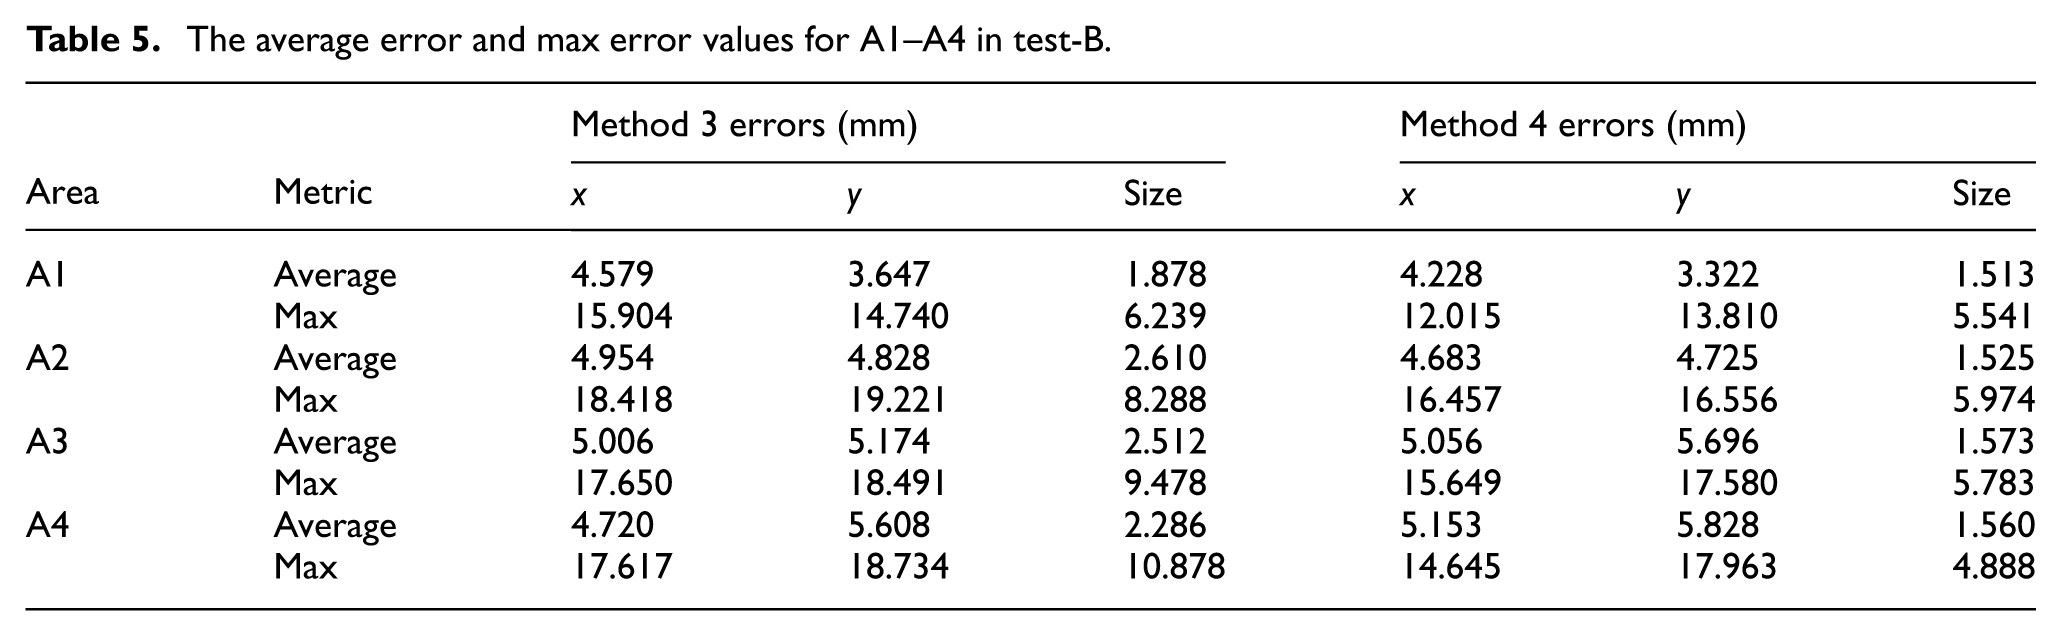
Table 5 lists the average error and max error values for A1–A4 in test-B, and Figure 21 show the average error and max error histograms. After introducing DANN, method 4 also exhibits higher stability and accuracy in cross-domain prediction. Overall, the average errors for x and y coordinate values and damage size are 4.228–5.153, 3.322–5.828, and 1.513–1.573 mm, respectively, with max errors of 12.015–16.457, 13.810–17.963, and 4.888–5.974 mm, respectively. Compared with method 3, method 4 reduces the average and max errors of x coordinate values by 2.8–13.5 and 11.4–16.6%, those of y coordinate values by 8.8–8.9 and 5–12%, and the damage size errors by 17.8–37.4 and 10.7–38.8%, respectively.
The average error and max error values for A1–A4 in test-B.
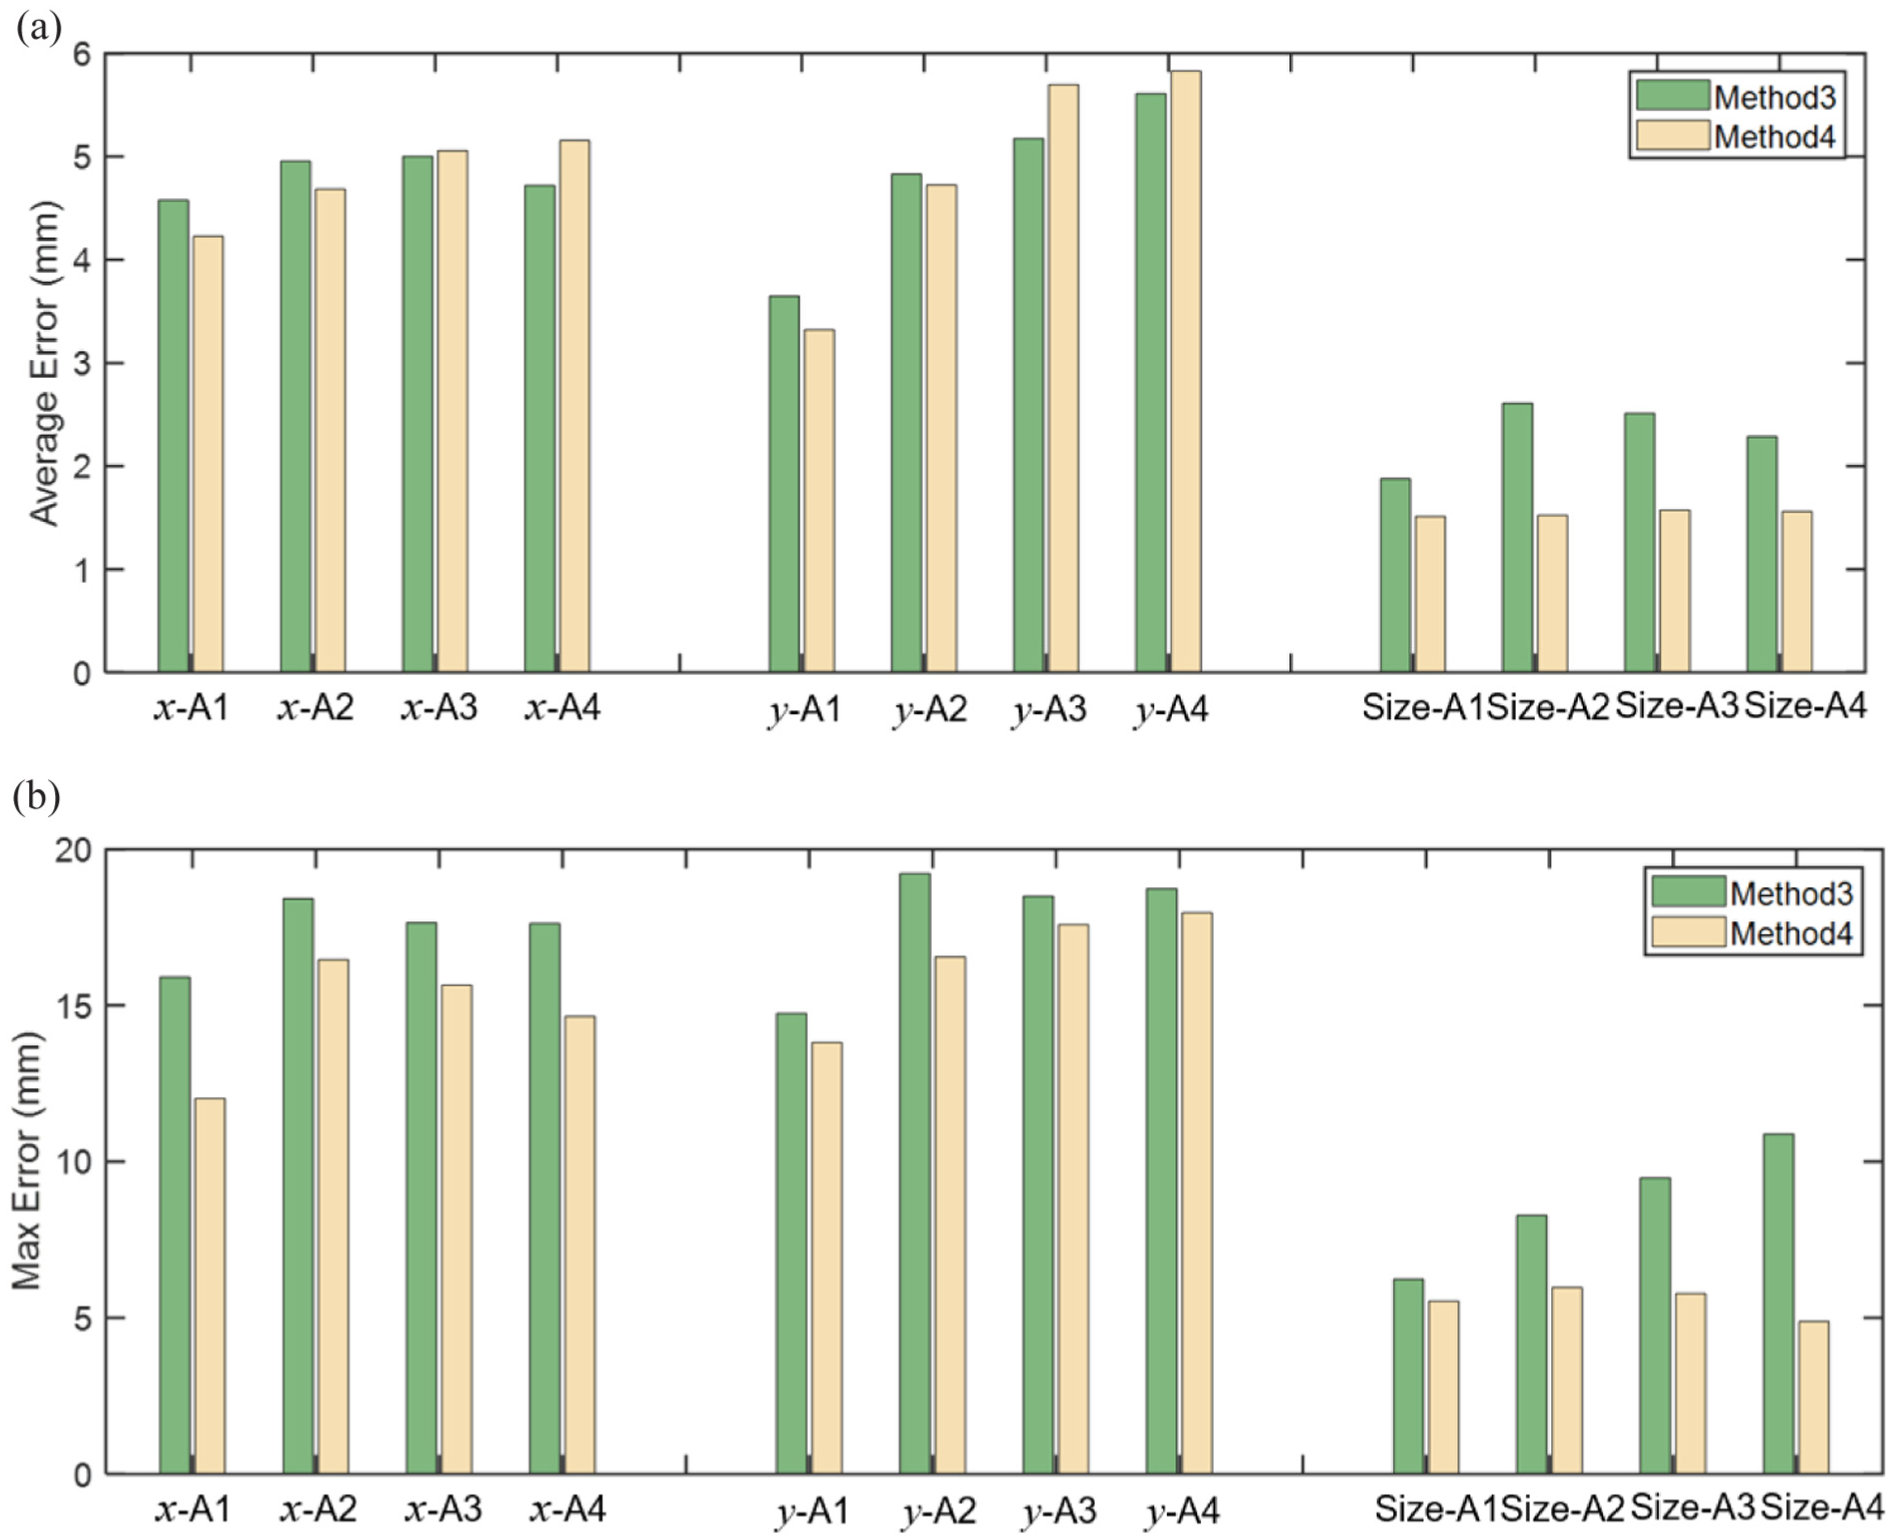
The average error and max error histograms in test-B: (a) average error and (b) max error.
Figures 22 and 23 show the location prediction scatter plots and size prediction box plots of method 4 in test-B. For location prediction, although the test locations are completely unseen, the predicted points remain concentrated near the true damage locations, with most errors controlled within ±15 mm. Compared with method 3, method 4 achieves a more compact distribution, fewer outliers, and higher spatial correspondence. For size prediction, method 4 exhibits narrower box intervals, shorter whiskers, and significantly fewer outliers, indicating that prediction fluctuations are effectively suppressed. These results demonstrate that the DANN-based domain adversarial mechanism effectively mitigates feature misalignment across spatial domains, enhancing both the accuracy and robustness of damage identification under completely unseen locations.
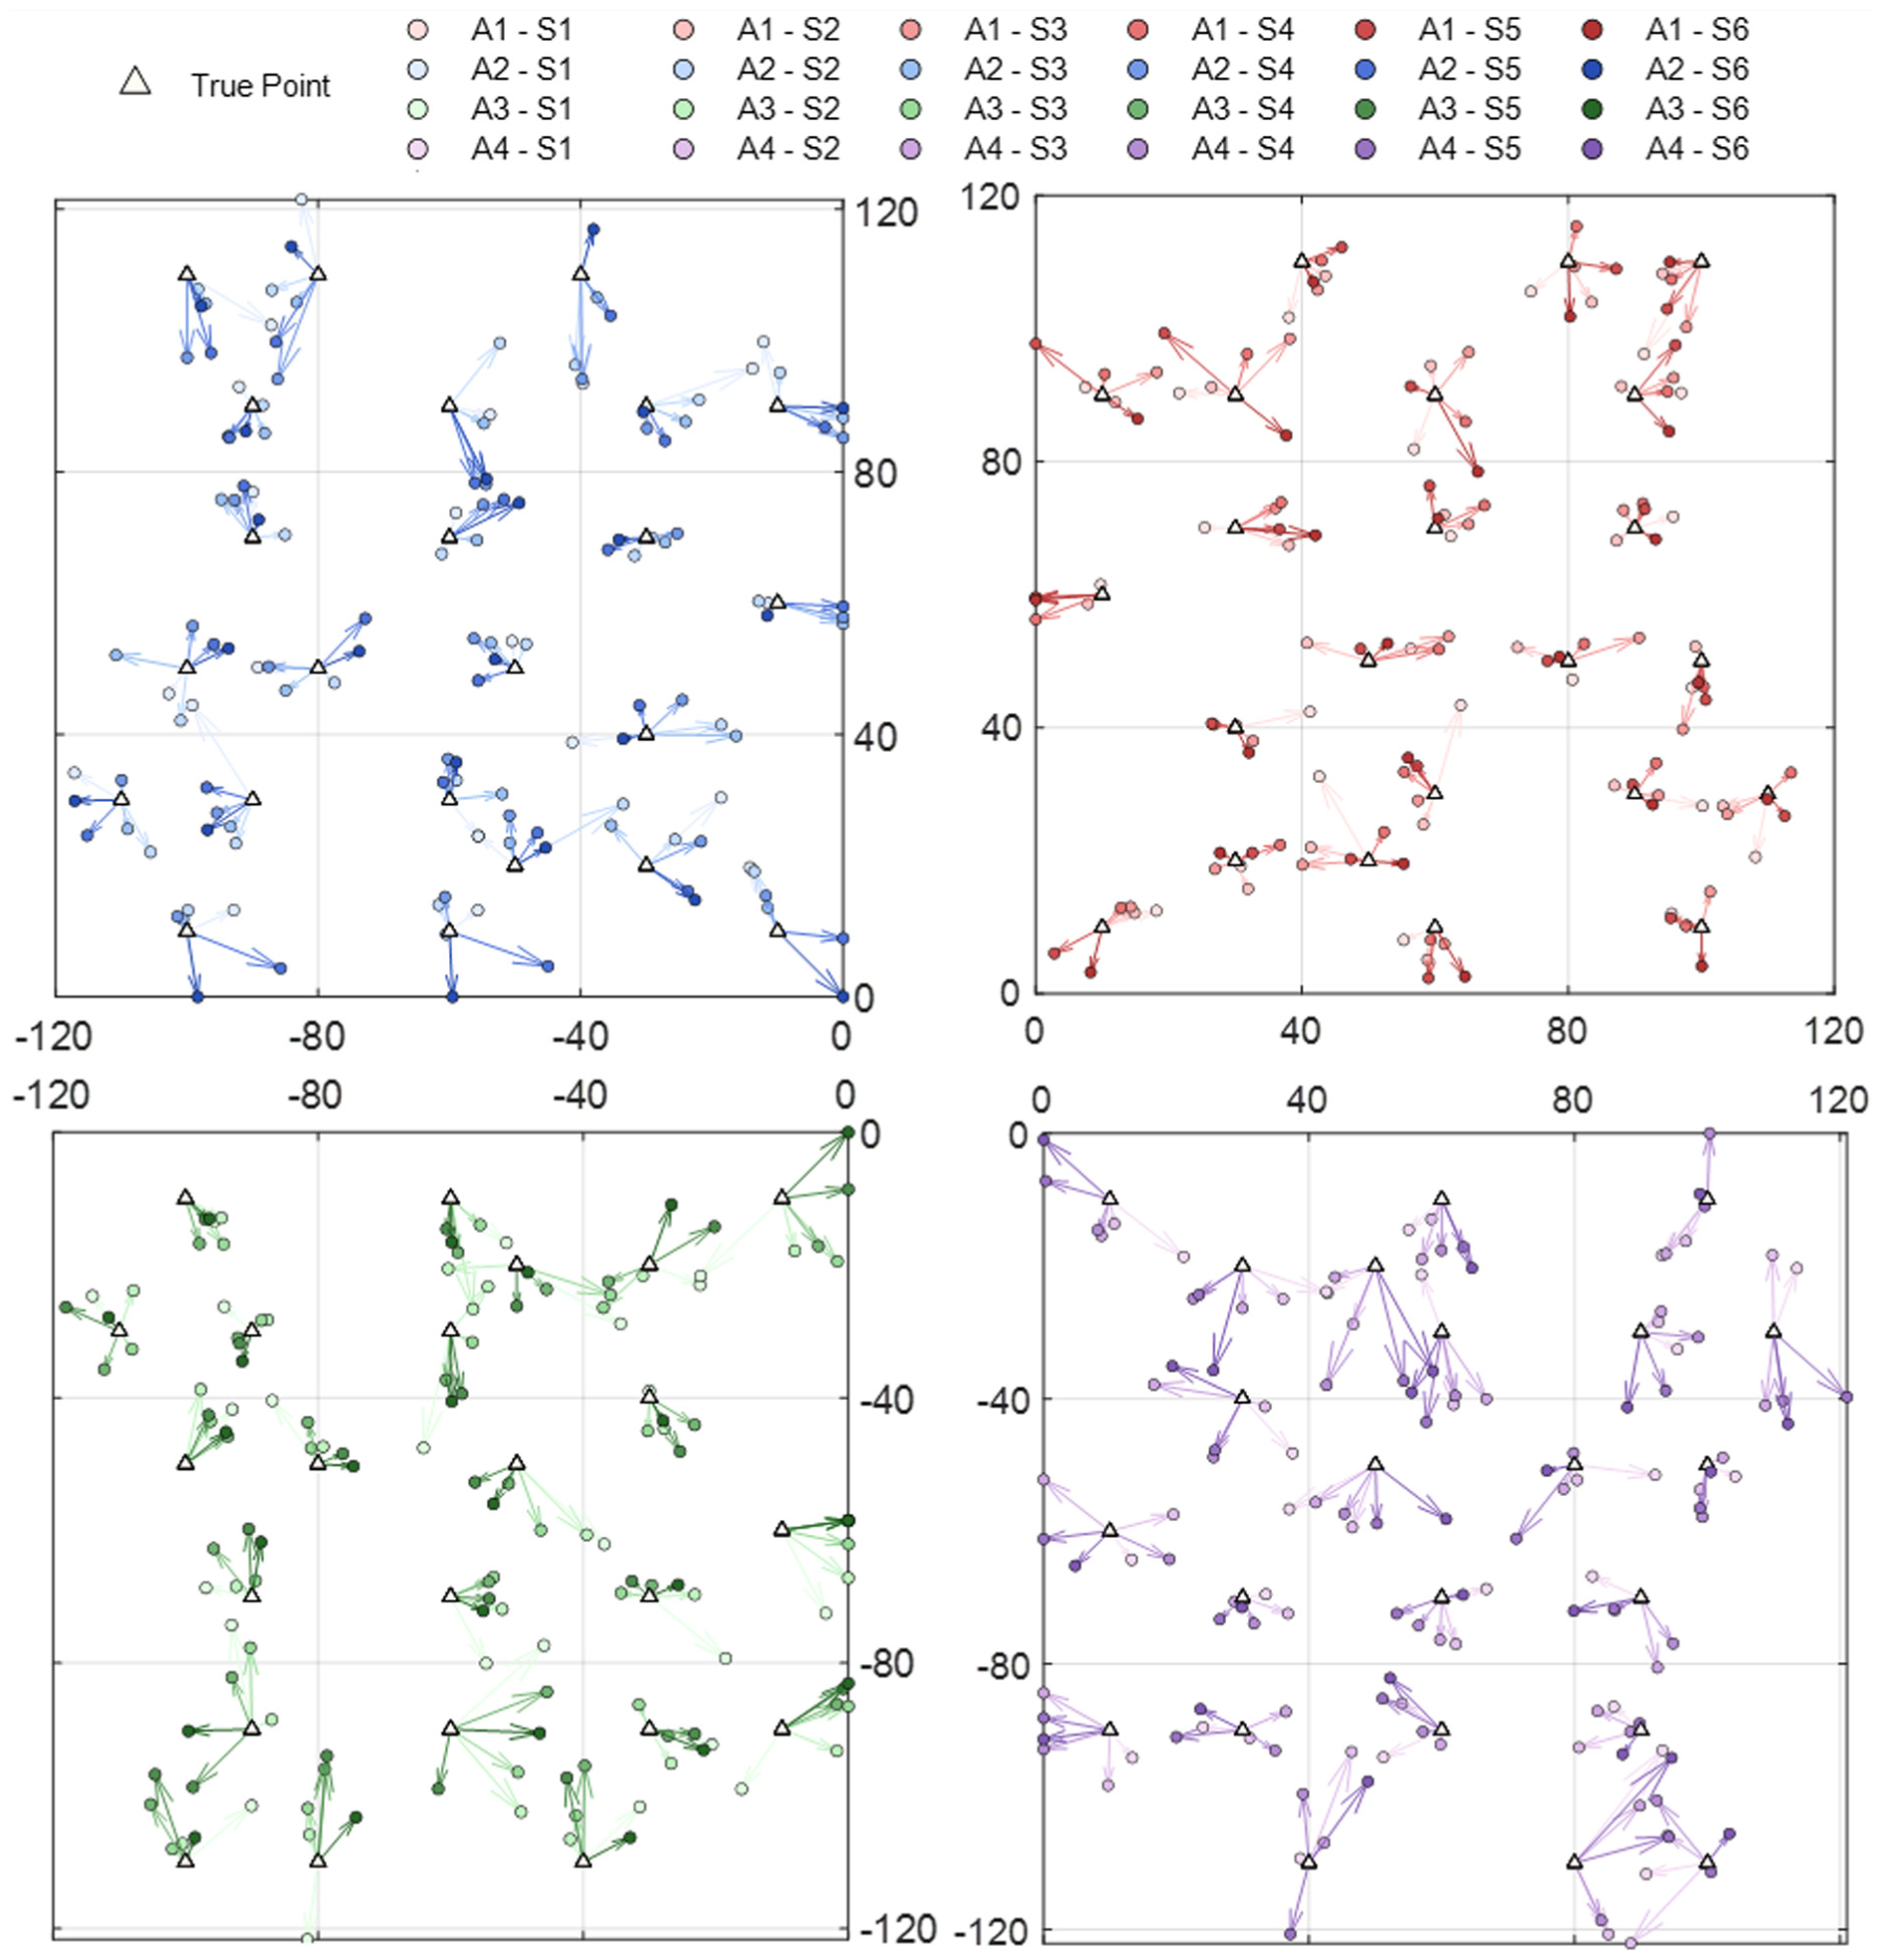
The scatter plots of location predictions for the method 4 in test-B.
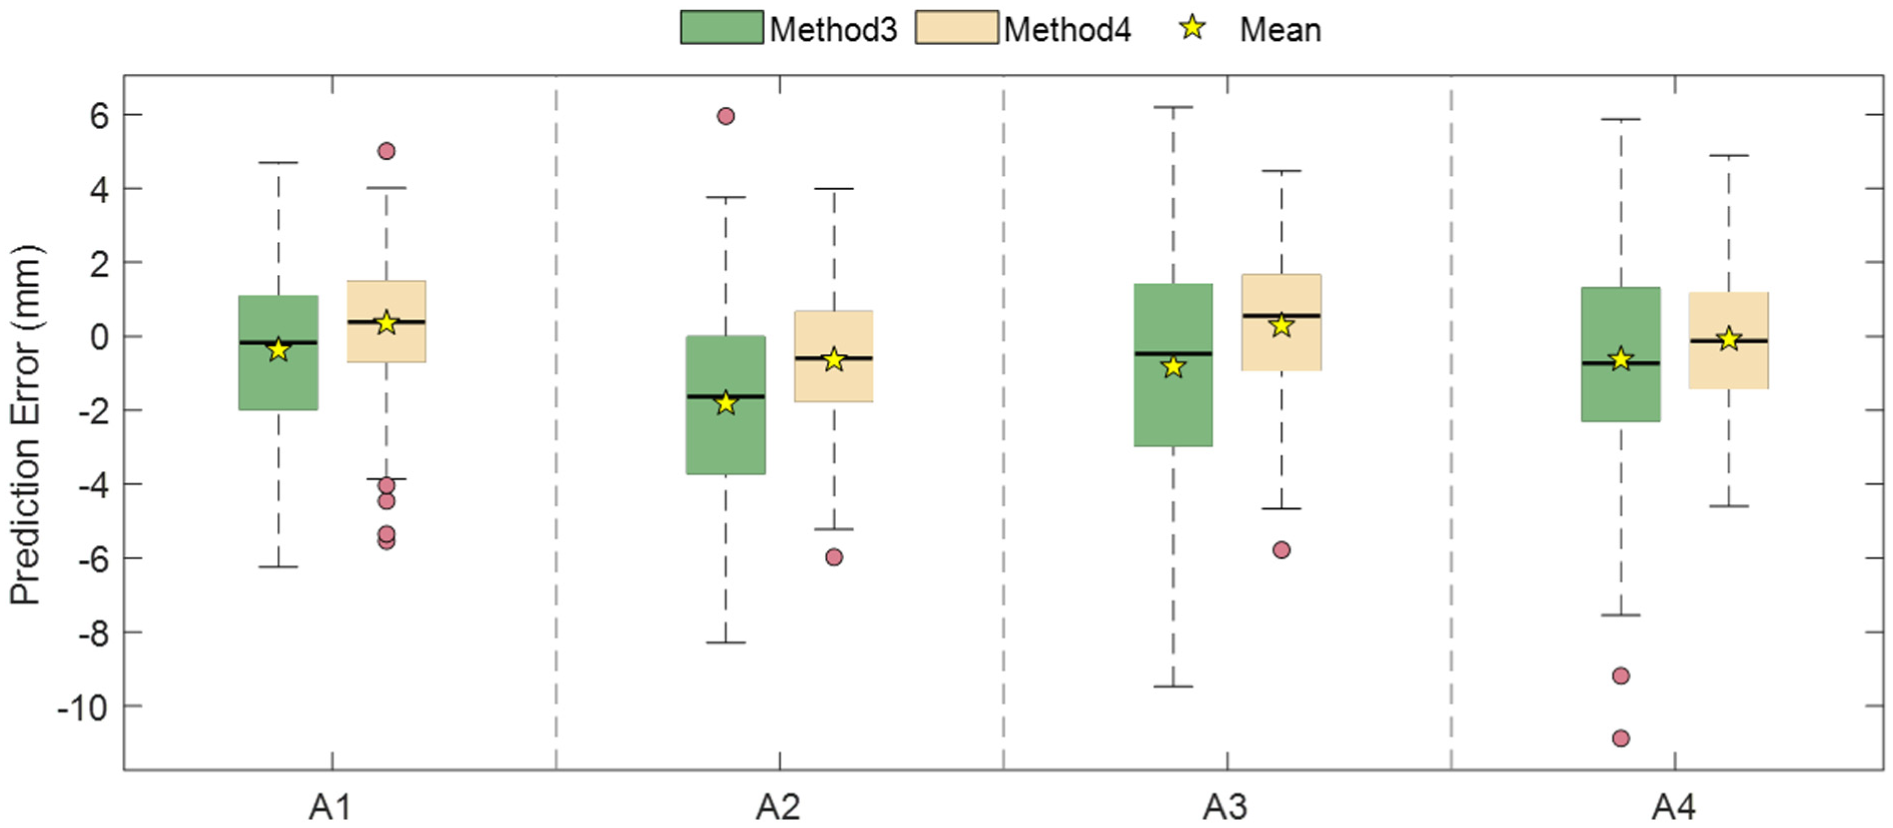
The box plots of size predictions for methods 3 and 4 in test-B.
Conclusions
Aiming at the problems of data scarcity, insufficient cross-domain generalization ability and limited location and size prediction accuracy in multi-task damage identification of composite stiffened plates, this article proposes a damage localization and quantification of composite stiffened panels via CVAE together with hierarchical feature fusion and multi-domain adaptation. The main contributions include:
CVAE is used to structured data expansion to alleviate the problem of data scarcity. This method can generate training samples on the premise of maintaining the physical characteristics and spatial consistency of signals, and effectively improve the generalization ability of the model to the seen and unseen test fields of training points. The experimental results show that the data expansion significantly reduces the average error of damage location and size, at the same time, reduces the max error fluctuation, which improves the stability and cross-domain generalization ability of the model in the seen and unseen test fields of training points.
A hierarchical feature fusion DL model combining Inception and MHA is established. Through the combination of Inception module and MHA, hierarchical and multi-scale signal feature extraction is realized, and the local amplitude change and spatial pattern characteristics in the damage waveform are fully captured. It provides more comprehensive and accurate feature representation for location and size prediction, and improves the identification ability of the model for complex damage information.
An unsupervised DANN is introduced to align features with different spatial distributions, effectively mitigating feature-shift caused by structural state differences in cross-domain prediction. Results show that on the test set at unseen locations, the spatial distribution of predicted points is more concentrated, the fluctuation range of location errors converges significantly, and both the average and max errors of location and size predictions decrease. This verifies the effectiveness of the domain confrontation mechanism in improving the cross-domain robustness and prediction accuracy of the model.
In the future, further efforts can be devoted to the following aspects:
The quality of data generated by CVAE depends on the distribution of original samples. When the coverage of original data is limited, the representativeness of generated data will also be limited. Future research could consider introducing richer physical constraint information to enhance the representation ability of the latent space to real signal distribution.
There may be insufficient domain alignment under different sensor configurations and different structures, so a stronger cross-domain learning mechanism can be introduced to further explore the generalization of more cross-domain tasks.
Environmental disturbance, such as temperature, may cause signal amplitude drift or phase change, which leads to further deviation of data distribution, so it is still necessary to study environmental compensation methods.
The physical mechanisms governing Lamb wave interaction with simulated damage and real composite damage are not fully equivalent. It is necessary to further introduce real damage scenarios to verify and optimize the proposed method.
Footnotes

Funding
The authors disclosed receipt of the following financial support for the research, authorship, and/or publication of this article: This work is supported by the Science and Technology Innovation Key R&D Program of Chongqing (grant no. CSTB2025TIAD-STX0025) and the National Natural Science Foundation of China (grant no. U2141245).
Declaration of conflicting interests
The authors declared no potential conflicts of interest with respect to the research, authorship, and/or publication of this article.