
Abstract
This article explores the theoretical and empirical implications of incorporating forgone opportunities in strategic management research. Drawing on the well-studied literature examining whether firms should reinvest in focused businesses or pursue alternatives of diversifying and/or paying out excess cash to shareholders, hypotheses are developed for when diversification and payout policy, as the opportunity costs of reinvesting in the firm’s original businesses, will present firms with higher and lower opportunity costs. Empirical results suggest that the value of reinvestment in existing businesses is higher for firms facing lower opportunity costs of forgoing other alternatives (e.g. diversification and paying out) than for firms that have much higher opportunity costs of forgoing these same alternatives. Implications for incorporating opportunity costs into the diversification literature and the broader strategic management literature are also explored.
Much strategy research focuses on the impact of a firm’s strategic choices on its performance. The typical empirical structure of this work is straightforward: Scholars apply some measure of the extent to which a firm is implementing a particular strategy, some measure of firm performance, and then—controlling for environmental and organizational contingencies identified by relevant theory—examine the empirical relationship between a strategy and performance.
While widely adopted, this approach to strategic management research often fails to consider the strategic options forgone when a firm chooses a particular strategy. Of course, to some degree, one counterfactual strategy is implicit in every one of these models—the alternative of not choosing the strategy being studied. In some research settings, this simple way of thinking about the strategy not chosen is sufficient.
However, in other research settings, assuming that the only alternative to choosing and implementing a particular strategy is to not choose and implement that strategy is not sufficiently meaningful. This is especially the case when there are several viable alternatives to a particular strategy. In these settings, lumping together all the alternative strategies into a single alternative implicit counterfactual strategy is not sufficient. Knowing the value of the alternatives forgone can have a significant impact on how one interprets the relationship between the strategy chosen and firm performance. For example, if, say, a strategy of cost leadership creates, on average, a 20% positive return for firms, then research that only examines the relationship between cost leadership and firm performance will suggest that cost leadership creates value most of the time. However, what if a different strategy—not just the absence of the first strategy, but an economically viable alternative—generates a 50% positive return for firms? In this case, this alternative strategy might be product differentiation. Relative to product differentiation, a cost leadership strategy sacrifices a great deal of firm value, even though cost leadership does create value. Put differently, it is difficult to fully understand the value created by a firm’s strategy unless we also understand the value of strategies not chosen by a firm. The value of strategic opportunities forgone is, of course, the opportunity costs associated with the strategy actually chosen by a firm.
A growing number of strategy scholars have begun to recognize the importance, in principle, of incorporating opportunity costs in strategic management research (Levinthal and Wu, 2010). However, one of the challenges associated with incorporating opportunity costs into this research is that it can be quite difficult to identify the opportunities forgone when a firm chooses to implement a particular strategy. It can be even more difficult to estimate the value of these opportunities forgone.
These challenges are one reason why this article examines the value of opportunities forgone in a very well-studied part of the literature—decisions about whether to reinvest in a focused business, on the one hand, or pursue alternatives of diversifying and/or paying out excess cash to shareholders (through a stock repurchase and/or dividend program), on the other hand. While there are multiple decades of work in strategic management studying the corporate diversification—firm performance linkage—and while much is known about the value of related and unrelated diversification (Bettis, 1981; Grant, 1988; Hill et al., 1992; Markides and Williamson, 1994; Miller, 2004; Palich et al., 2000; Rumelt, 1982), less is known about the value of forgone opportunities—such as reinvestment in existing businesses—when firms diversify.
This article shows that the value of reinvestment in existing businesses is higher for firms facing lower opportunity costs of forgoing other alternatives (e.g. diversification and paying out) than for firms that have much higher opportunity costs of forgoing these same alternatives. The results suggest that overlooking the value of alternatives to reinvestment—in particular, the value of diversifying into new businesses and of paying out a firm’s free cash flow to its shareholders through dividends or stock repurchases—leaves out an important component in our understanding of the returns to reinvestment.
The opportunity costs of reinvestment
The opportunity costs associated with reinvesting in a firm’s current businesses depend upon how economically attractive those businesses are, relative to the firm’s other alternatives (i.e. diversification and paying out to shareholders). Each of these alternatives will be explored in turn.
Diversification as an alternative to reinvestment
If a firm’s core businesses are growing rapidly or if a firm has a sustained competitive advantage in those businesses, then the opportunity cost of not investing in these businesses can be quite high, often higher than returns that a firm might expect from diversification. However, if a firm’s core businesses are not growing or if a firm has no sustained advantages in its core businesses, then the opportunity costs of not investing in these businesses can be quite low, especially relative to diversification. Indeed, prior work has suggested that one of the main reasons firms begin to pursue a diversification strategy is that returns in their current business activities are diminishing (Rumelt, 1982; Stimpert and Duhaime, 1997). Faced with these realities, firms may seek new profit opportunities in new businesses. This is especially likely for firms that are generating free cash flow in industries with limited prospects for growth (Gomes and Livdan, 2004; Jensen, 1986; Maksimovic and Phillips, 2002; Montgomery and Wernerfelt, 1988; Rumelt, 1977).
Empirical support for this view of diversification has been mixed. Although there is strong support in the literature to suggest that diversification that builds upon economies of scope (e.g. resource sharing) that outside equity holders cannot duplicate on their own (e.g. through markets or contractual means) can create value for a firm’s shareholders (Barney, 1988; Bettis, 1981; Hill et al., 1992; Hoskisson, 1987; Markides and Williamson, 1994; Palich et al., 2000; Rumelt, 1982; Teece, 1980, 1982), there is other research suggesting that diversification strategies, on average, destroy economic value (Montgomery and Wernerfelt, 1988), and that in fact, diversified firms, on average, trade at a discount compared to a portfolio of focused firms operating in the same industries (Berger and Ofek, 1995; Comment and Jarrell, 1995; Lang and Stulz, 1994).
However, several scholars have questioned this diversification discount result, arguing that despite the fact that diversification is associated with lower firm values, it is not the act of diversification that destroys value but rather the circumstances (such as increasing firm maturity) that led the firm to need an escape from poorly performing businesses (or industries) that lower the firm’s value (Campa and Kedia, 2002; Gomes and Livdan, 2004; Villalonga, 2004). This research finds that prior diversification “discount” research suffers from a variety of estimation problems—especially endogeneity problems—and that when these problems are addressed, the diversification discount disappears, sometimes replaced by a modest diversification premium (Campa and Kedia, 2002; Miller, 2004; Villalonga, 2004).
These endogeneity correction models add some indirect support for the idea that when the opportunity cost of reinvestment in existing businesses is lower than the opportunity costs of diversification, diversification becomes a more attractive choice; however, prior work has not directly tested this idea since this was not their research question of interest. Rather, prior work has focused on developing and testing theory for the various situations in which diversification may or may not create value and not on how the value of forgone alternatives may change the appeal of diversification for firms.
This article directly tests the idea that when firms are facing diminishing returns in their current business, the opportunity costs of reinvestment are lower, and the returns to diversification increase. This is summarized with the following hypothesis:
Hypothesis 1. The returns to diversification increase when reinvestment in existing businesses is less attractive.
Payout as an alternative to reinvestment
Of course, diversification is not the only alternative for firms facing diminishing performance in their ongoing businesses. These firms may instead elect to initiate a payout to shareholders, either in the form of dividends or stock repurchases. Thus, if opportunity costs are the value of the best alternative forgone by a firm, then initiating payout might also be another potential opportunity cost of either reinvestment or diversification.
Indeed, prior research also suggests that diversification and payout often have similar antecedent conditions. One of the most widely cited determinants of a firm’s decision to payout is firm maturity—firms with limited growth potential in their current business are more likely to payout than those in high growth industries (Grullon et al., 2002).
In such a setting, returning cash to shareholders is often a firm’s best option for many reasons. First, prior research shows that initiating a payout strategy is consistently, and positively, correlated with firm value (Allen and Michaely, 2005; Ikenberry et al., 1995; Easterbrook, 1984). Second, paying out cash to shareholders signals to shareholders expected future profitability as well as the reduced risk that comes with a maturing firm (Grullon et al., 2002). Finally, paying out is valuable to shareholders both in terms of the value of money that they receive by virtue of the payout but also because dividend payments, in particular, may indicate that managers are not squandering the firm’s free cash flow through overinvestment (Allen and Michaely, 2005). Therefore, although payout conveys potentially negative information about growth opportunities in the firm’s core businesses (Grullon et al., 2002), it is still thought to be associated with higher firm values because paying out also signals reduced risk, future profitability, and reduced agency concerns. Comparing the value created by payout to the value created by reinvestment suggests the following hypothesis:
Hypothesis 2. The returns to initiating payout increase when reinvestment in existing businesses is less attractive.
Diversification versus payout as alternatives to reinvestment
Diversification has been critiqued in the past as evidence of agency concerns (Denis et al., 1997; Jensen, 1986), and some have said that it would be better if the cash used for diversification were returned to shareholders (Jensen, 1986). These critiques imply that in addition to being opportunity costs of reinvestment, diversification and payout are opportunity costs of each other as well, and both must be considered in this study. Reasonable arguments can be made for why either diversification or payout might be the optimal alternative to reinvestment.
Diversification has some advantages relative to payout as an alternative to reinvestment. For example, diversification can create value by leveraging resources that are not fully deployed. In general, diversification can create value through economies of scope that cannot be replicated by returning cash to shareholders. Additionally, while firms can often seek external funding for diversification, it rarely makes sense for firms to do so for payout, so firms with limited cash will be constrained in their opportunities for initiating payout.
However, while diversification has the potential for greater value creation than initiating payout, it also carries greater risks than dividends or stock repurchases. For example, expected economies of scope may fail to materialize or the new business entered into through diversification may be less valuable than expected. The extent to which firms will actually be able to realize economies of scope will often depend on the degree of cooperation and coordination among business units as well as the firm’s ability to minimize other forms of diseconomies of organizational scale (Goold and Campbell, 1998; Jones and Hill, 1988; Nayyar, 1992). Inefficient internal capital markets (Hoskisson and Turk, 1990; Scharfstein and Stein, 2000; Shin and Stulz, 1998; Stein, 1997) and agency conflicts (Jensen, 1986; Stulz, 1990; Rajan, Servaes, and Zingales, 2000) can also limit a firm’s ability to create value through diversification.
These arguments lead to two competing hypotheses:
Hypothesis 3a. The returns to diversification will be greater than the returns to initiating payout when reinvestment in existing businesses is less attractive
Hypothesis 3b. The returns to initiating payout will be greater than the returns to diversification when reinvestment in existing businesses is less attractive.
Methods
Data and sample
As stated at the outset, the purpose of this article is to incorporate opportunity costs into the strategic management research model in the setting of a firm’s decision to reinvest in a focused business or pursue its strategic alternatives of either diversifying or initiating payout. At least one way to do this is to compare the returns to reinvestment, diversification, and payout across samples of firms with varying levels of opportunity costs to reinvestment. This is the approach of this article.
Two samples were created. The first, a baseline sample, represents a broad cross section of firms growing at various rates. The second, a restricted sample, represents a subset of the baseline sample restricted to firms facing less attractive growth opportunities. This is operationalized as firms experiencing slowing growth prior to the decision to diversify or payout was constructed. The returns to reinvestment, diversification, and payout for firms in the baseline sample are compared to the returns to firms in the restricted sample experiencing slowing growth to test our hypotheses. More details on the construction of these samples follow.
First, the baseline sample was constructed from the Compustat Industry Segment file using all the typical sample construction conventions used in the literature comparing diversified firms with reinvesting (single-segment) firms. 1 Beyond these typical conventions, firms are only included in the sample if there are observations for which the firm was neither diversified nor paying out so that the effects of initiating diversification from the effects of choosing to reinvest in existing businesses can be statistically isolated. This restriction also makes it possible to isolate the effects of initiating diversification from the effects of initiating payout. Hence, firms in the sample fit one of two profiles: (1) firms that never choose to initiate diversification or payout or (2) firms that at some point were not engaged in diversification or payout but chose to engage in one or both of those activities. For this latter group, observations past the first year that the firm chose to diversify or payout were not included.
This baseline sample includes 23,804 observations in 5671 firms that matched all these sample selection criteria. These observations can be broken down descriptively into four categories: diversifying (708 observations), initiating a payout (695 observations), diversifying and initiating a payout in the same year (20 observations), or reinvest—continue undiversified and nonpayout status (22,381 observations). It is interesting to note that only 20 undiversified firms in the Compustat file chose to both initiate diversification and initiate a payout in the same year. This suggests that while firms are not constrained from becoming diversified and initiating payout in the same year, in practice, firms very rarely choose to do so. The fact that these two choices are essentially mutually exclusive enhances our ability to isolate the effects of initiating diversification from the effects of initiating payout.
Second, the restricted sample is constructed by only including firms from the baseline sample experiencing slowing growth, defined as the condition in which the growth rate (change in assets) from time period t-2 to t-1 is less than the growth rate from time period t-3 to t-2. As noted previously, this restricted sample represents a set of firms in which reinvestment has become relatively less attractive, and the returns to reinvestment, diversification, and payout for these firms will be compared to the respective returns for the baseline sample. This restricted sample includes 7892 observations in 3194 firms. The observations in the restricted sample can be broken down descriptively into four categories: diversifying (211 observations), initiating a payout (219 observations), diversifying and initiating a payout in the same year (8 observations), or reinvest—continue undiversified and nonpayout status (7454 observations).
Dependent variable
Previous research comparing multisegment and focused firms has used a variety of accounting measures (such as return on assets (ROA)) or market measures (such as Tobin’s q) of firm value as a dependent variable (Hoskisson et al., 1993; Lang and Stulz, 1994). However, the limitations of these measures of firm value are now becoming more widely understood (Berger and Ofek, 1995; Palich et al., 2000). Accounting measures are subject to managerial manipulations (Palich et al., 2000), do not account for risk (Hoskisson et al., 1993), and are not forward looking. Market measures such as Tobin’s q are an improvement over accounting measures, as they incorporate forward-looking market valuations; however, Tobin’s q has its limitations as well. For example, an increase in dividends will almost always increase Tobin’s q since reducing the cash in the firm will decrease the book value of the firm—the denominator of Tobin’s q. Additionally, and perhaps more importantly, for the current context, it is difficult to adjust Tobin’s q for industry because data are not available for segment-level market values or replacement values (Berger and Ofek, 1995). In the current context, this is particularly critical because the value of each segment within a firm is heavily dependent on the industry in which it competes.
To avoid these measurement problems, this article adopts an approach to measure firm value developed specifically in the context of diversification: excess value (Berger and Ofek, 1995; LeBaron and Speidell, 1987; Zuckerman, 2000). Conceptually, excess value is defined as the degree to which a diversified firm’s value exceeds that of a portfolio of single-segment firms competing in the same industries as the diversified firm.
Excess value is measured by the log of the ratio of the firm’s value (total firm capital) and the sum of the imputed values of its segments as single-segment firms. Total firm capital is measured as the sum of a firm’s market value of equity, long-term and short-term debt, and preferred stock. A segment’s imputed value is calculated by multiplying its sales by the median value for single-segment firms in the segment’s industry (the most restrictive Standard Industrial Classification (SIC) grouping—four digit, three digit, or two digit—that includes at least five firms 2 ). Using the imputed values of each segment, the imputed value of the corporation is calculated as the sum of each of its segments’ imputed values.
Since this dependent variable is in log form, a negative excess value indicates that the firm has a lower value than its imputed value, that is, a diversified firm is trading at a discount relative to a portfolio of focused firms in the same industries. A positive excess value indicates that the firm has a higher value than its imputed value, that is, a diversified firm is trading at a premium relative to the portfolio of focused firms. Extreme excess values of more than 1.386 or less than −1.386 (i.e. the ratio of actual value to imputed value is greater than 4 or less than 0.25) are eliminated from the sample.
Independent variables
Initiating diversification
Firms are identified as diversifying if Compustat reports multiple segments for the firm in a given year. This variable is an indicator variable set equal to one if the firm is diversified and zero otherwise. Thus, for firms in the sample, this variable is equal to zero for all the years the firm is undiversified, leading up to the firm’s choice to diversify, in which the variable would then be set equal to one.
Initiating payout
Firms are identified as initiating paying out if Compustat reports positive values for dividends or stock repurchases. This variable is an indicator variable set equal to one if the firm is paying out either dividends or stock repurchases and zero otherwise. Most firms that pay a dividend also repurchase stock; therefore, it is not essential in this study to differentiate between the two forms of payout.
Discrete measures of diversification and payout are used instead of continuous measures to be in line with the focus of this article—to compare the effects of the initial diversification choice to the alternative choice of initiating payout. Continuous measures such as entropy, in the case of diversification, or the actual dollar amount spent on payout (or the dollar amount as a percentage of sales, assets, etc.) would be more appropriate in an examination of the relationship between the level of diversification or level of payout and the firm’s value.
Control variables
Firm characteristics
Consistent with the empirical literature comparing reinvesting and diversifying firms (e.g. Miller, 2004, 2006), several firm-level control variables are used in the analysis: firm size is measured by the log of assets and its square, profitability is measured as return on sales (ROS), investment is measured as capital expenditure divided by sales, leverage (measured as the debt to asset ratio), research intensity is measured as the ratio of R&D expenditure to sales, 3 and a firm-level fixed effect. Year dummies are also included but not reported in the results.
Selection terms
This article also controls for both the firm’s propensity to diversify and its propensity to initiate payout, generating sample selection terms to control for the endogeneity of both the diversification and payout decisions (Hamilton and Nickerson, 2003). Recent empirical work estimating the value of diversification has taken the approach of correcting for the endogeneity of the diversification decision (Campa and Kedia, 2002; Miller, 2006) using Heckman’s two-step model (1979) with treatment effects. This article adopts a similar approach to previous works, extending the model to account for both of the free cash flow allocation decisions that a firm faces: the decision to diversify and the decision to initiate payout. Thus, instead of correcting for the endogeneity of one firm decision (i.e. the decision to diversify), this article corrects for the endogeneity of two firm decisions (i.e. the decision to diversify and the decision to initiate payout).
Typically, in the treatment effects model, an initial univariate probit model generates the Inverse Mills ratio to use in the second-stage regression model. In this study, with two endogenous choice variables, two Inverse Mills ratios are generated from a bivariate probit model in which one equation estimates the firm’s decision to diversify and another equation estimates the firm’s decision to initiate payout. Analogous to the seemingly unrelated regression with respect to ordinary least squares (OLS), the bivariate probit model allows two separate probit models to be correlated in their error terms. Since theory suggests that the same factors that make a single-business firm more likely to become diversified also make it simultaneously more likely to initiate payout, bivariate probit estimation can account for unobserved heterogeneity that influences both the decision to diversify and the decision to initiate payout.
In any model correcting for self-selection, it is important to use two sets of controls or instrumental variables. The first set of controls is similar to that in the second-stage model predicting firm value (i.e. excess value—that is, firm size measured as the log of total assets), profitability measured as ROS, investment measured as capital expenditures divided by sales, and research intensity measured as the ratio of R&D expenditure to sales. The second set of controls, or instruments, is correlated with the selection variables (i.e. diversifying and initiating payout) but not with the second-stage dependent variable (i.e. excess value). These controls (described in the following paragraphs) include firm-, industry-, and macroeconomic-level variables and are consistent with the prior literature (e.g. Campa and Kedia, 2002).
At the firm level, a control is used to indicate whether the firm is traded on a major exchange (New York Stock Exchange (NYSE), American Stock Exchange (AMEX), or National Association of Securities Dealers Automated Quotations (NASDAQ)), and another control is used to indicate whether the firm is listed as part of the Standard & Poor’s (S&P) industrial or transportation indices since these firms are more likely to diversify. Another control indicates whether the firm is an international firm as these firms are likely listed on a US exchange prior to major financing, corporate restructuring, or diversifying. Differences in the availability of free cash flow across firms are accounted for by including both the current and lagged values of the ratio of cash and short-term investments to assets. Time-invariant firm characteristics are captured by including controls for the average values of firm size, profitability, and investment for the years that the firm is in the sample.
Industry heterogeneity is controlled for by including measures of the percent of industry sales that take place in diversified firms, as well as the percent of industry participants that pay a dividend or buyback stock. The selection model also includes industry dummy variables at the two-digit SIC level to account for time-invariant industry-level heterogeneity.
Macroeconomic trends are accounted for by the present and lagged values in the growth rate of real gross domestic product (GDP). It is worth noting that for identification purposes, the macroeconomic variables and industry-level variables are especially important for ensuring that the selection model is identified by more than just the nonlinearity of the Inverse Mills ratio. The reason for this is because, by construction, the dependent variable, excess value, is divided by an industry median for each year, so that these instruments are almost certain, by construction, to be uncorrelated with the dependent variable. Descriptive statistics and a correlation table for the variables used in the main analysis as well as the selection equations are provided in Table 1.
Descriptive statistics and correlations.
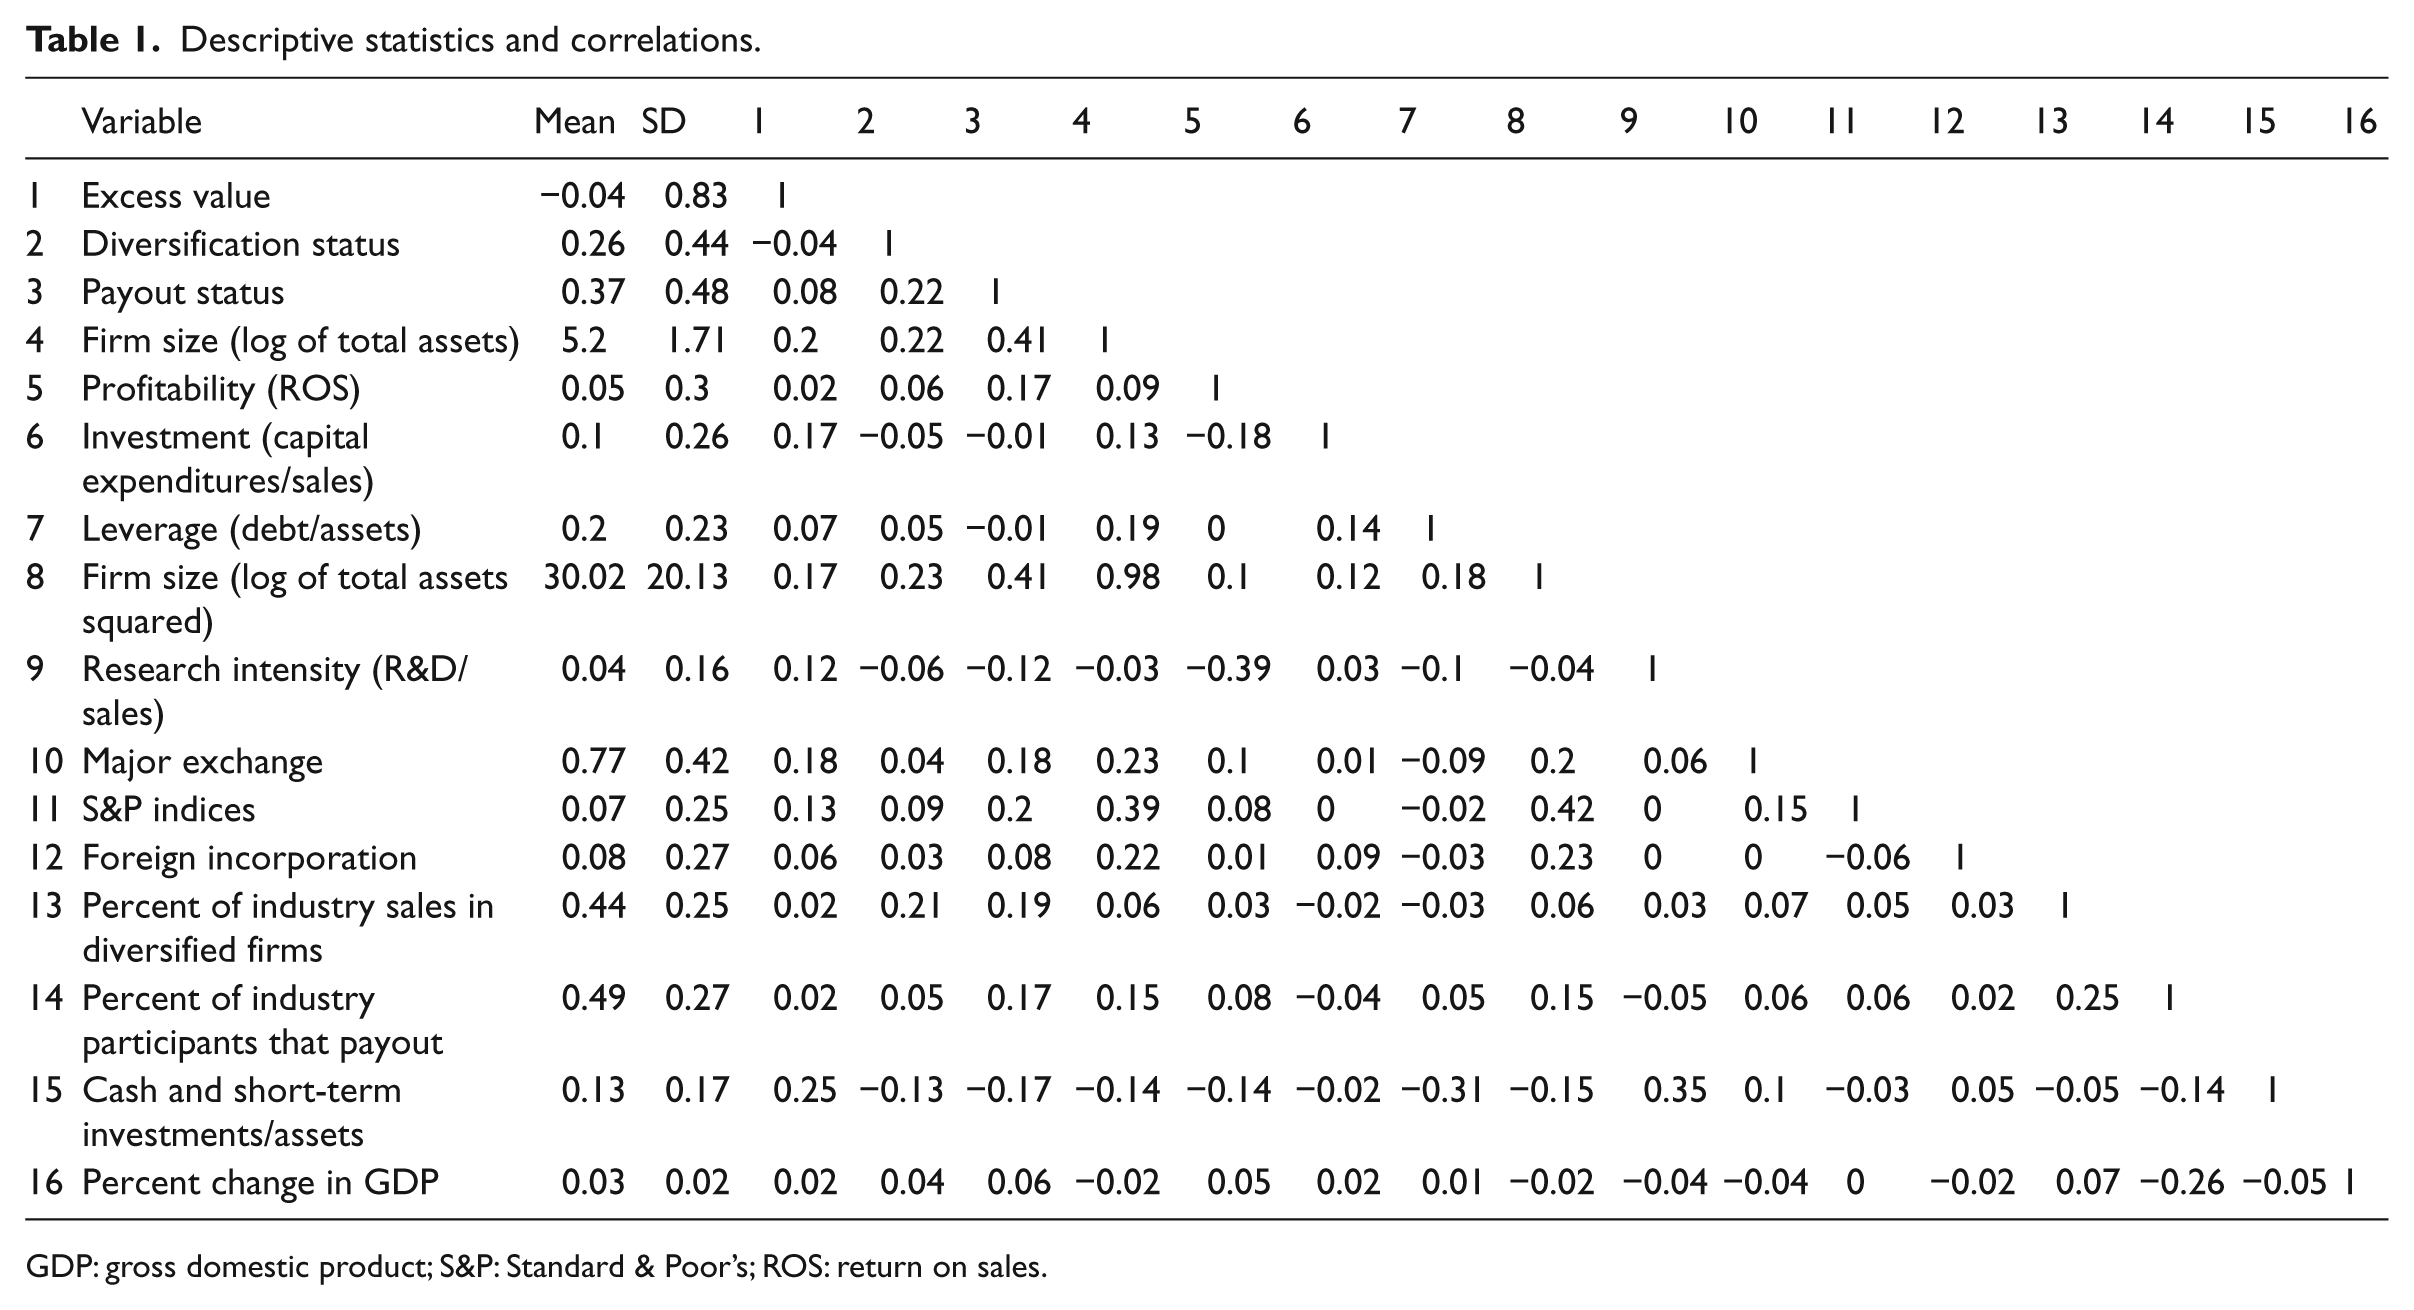
GDP: gross domestic product; S&P: Standard & Poor’s; ROS: return on sales.
Analysis
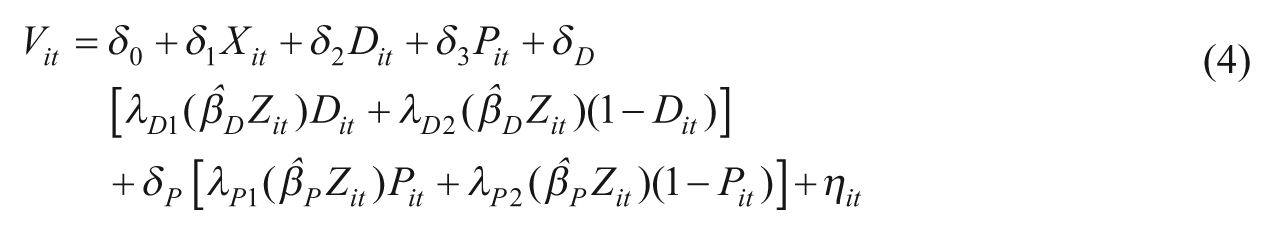
As noted previously, the analysis for this article relies on a two-stage treatment effects model in which excess value (V it ) is modeled as a function of control variables (X it ), the decision to diversify (D it ), the decision to initiate payout (P it ), and endogeneity correction terms as shown in the following equation

The treatment effects model hypothesizes that the decisions to diversify or initiate payout are based on unobserved latent variables
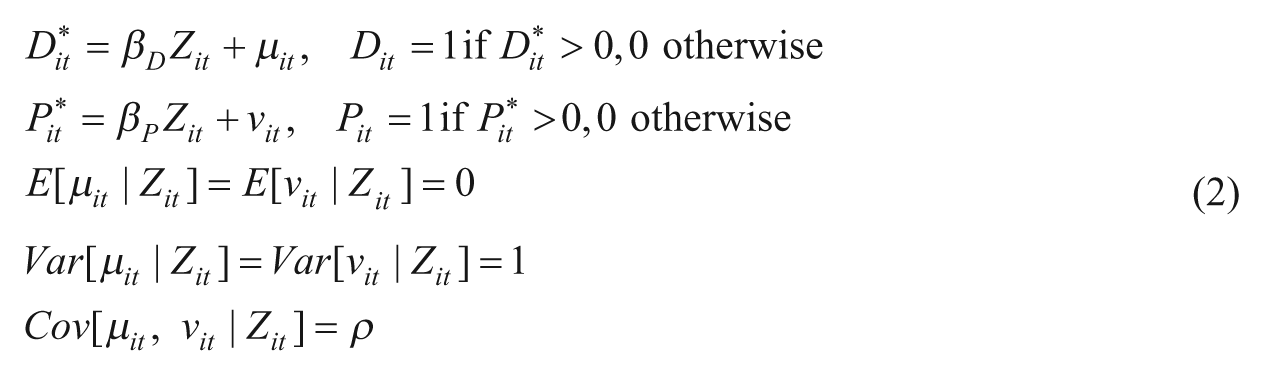
The bivariate probit model in equation (2) generates two self-selection corrections, λ D for the diversification decision and λ P for the payout decision, to control for the two decisions a firm faces
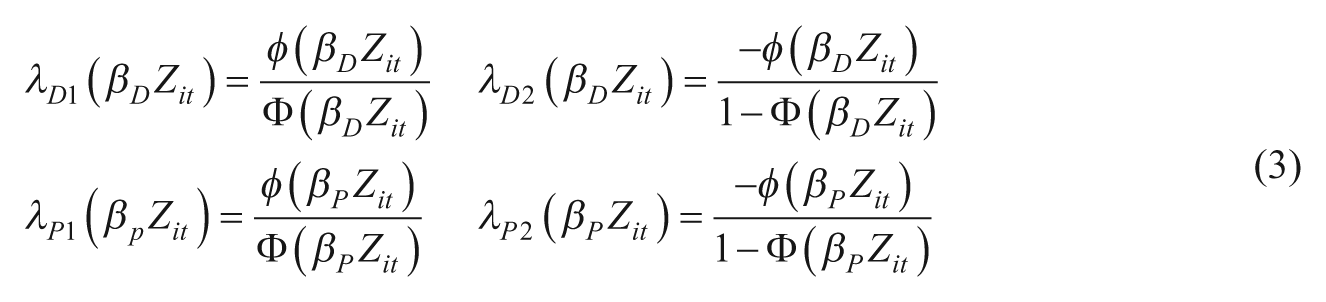
where ϕ(.) and Φ(.) are the density and the cumulative distribution functions, respectively, of the standard normal distribution. The correction terms (λ D ) and (λ P ) are then added to equation (1) as additional regressors
The results of the selection equations for both samples are given in Table 2.
Bivariate probit selection for baseline and restricted samples.
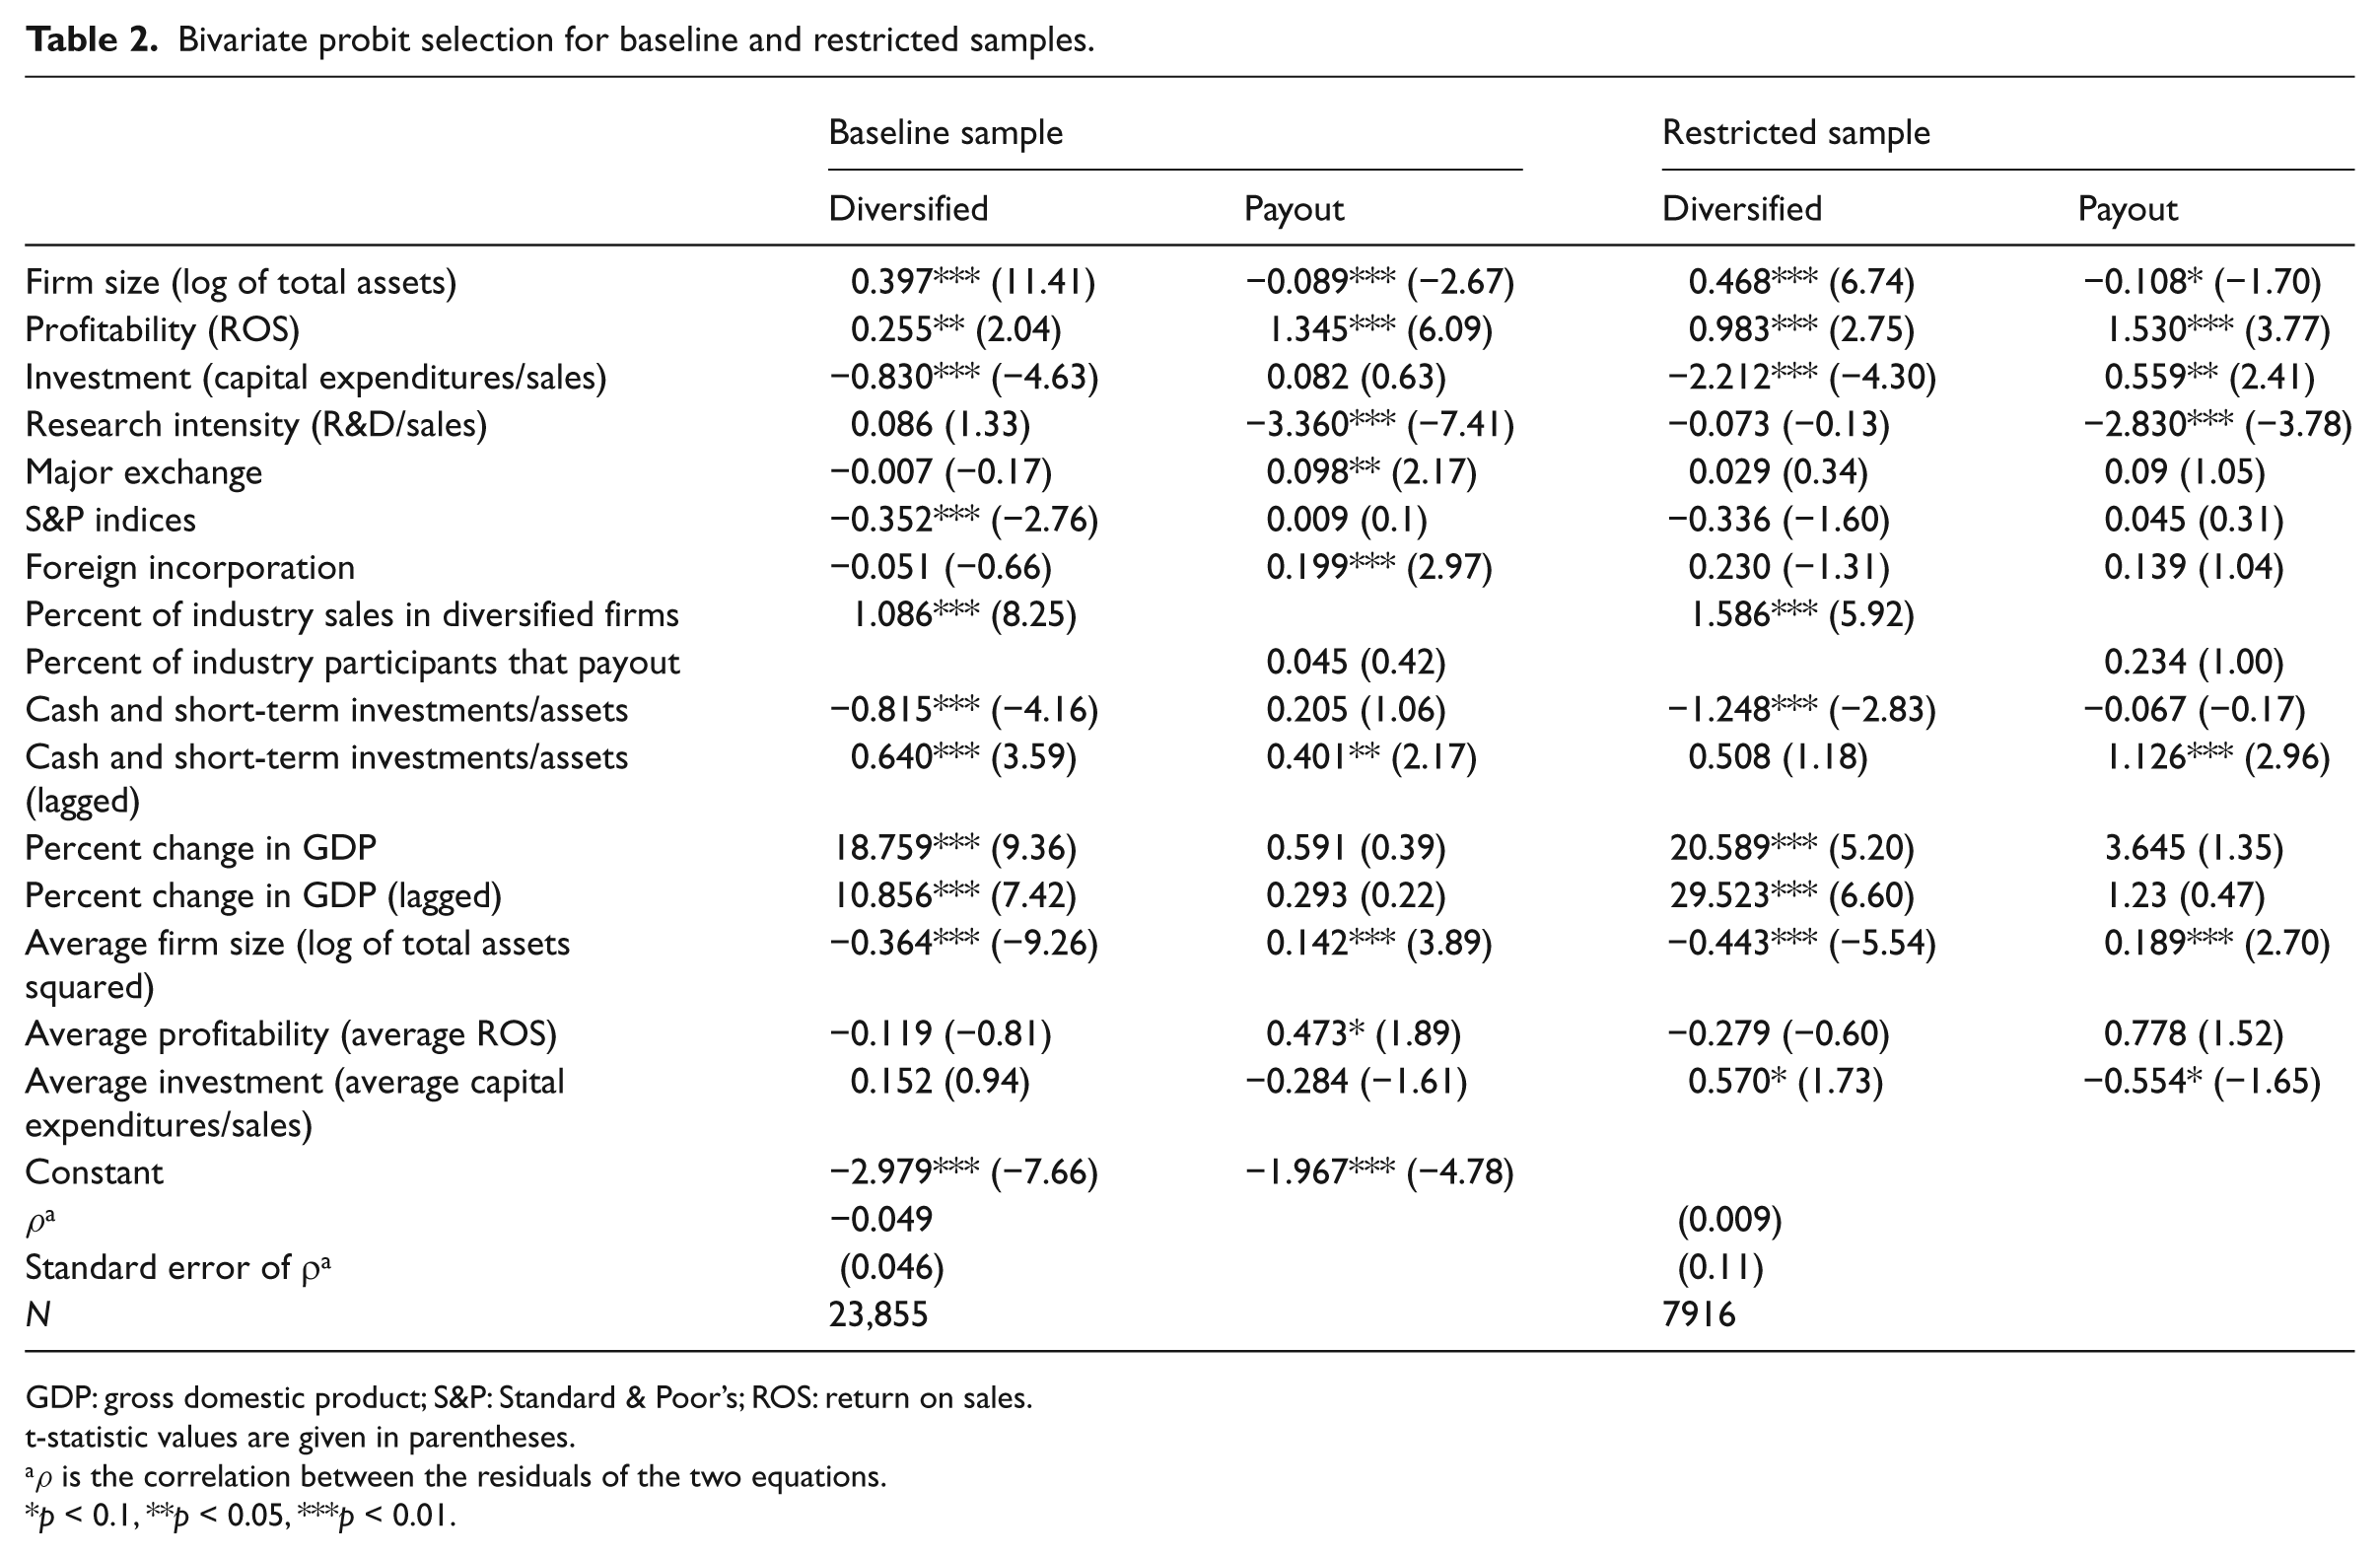
GDP: gross domestic product; S&P: Standard & Poor’s; ROS: return on sales.
t-statistic values are given in parentheses.
ρ is the correlation between the residuals of the two equations.
p < 0.1, **p < 0.05, ***p < 0.01.
Results
The returns to diversification are hypothesized to be higher for firms facing less attractive reinvestment options in existing businesses (Hypothesis 1). Two samples of firms were used to test this hypothesis—one with higher opportunity costs of reinvestment (baseline sample) and the other with lower opportunity costs of reinvestment (the sample restricted to firms experiencing slowing growth). Results for these samples are shown in Table 3, columns 2 and 3, respectively. For the baseline sample, there is a negative coefficient associated with diversification (−0.234). This means that relative to reinvestment, there is a 23.4% discount in excess value associated with diversifying. Turning to the restricted sample in which firms face a lower opportunity cost of reinvestment (i.e. slowing growth), there is a positive coefficient associated with diversifying (0.402). This means that relative to reinvestment, for these firms experiencing slowing growth (not slow growth or no growth), there is a 40.2% premium in excess value associated with diversifying. These results are consistent with Hypothesis 1—that is, the returns to diversification increase when reinvestment in existing businesses is less attractive.
Regressions predicting the effect of diversifying and initiating payout on excess value.
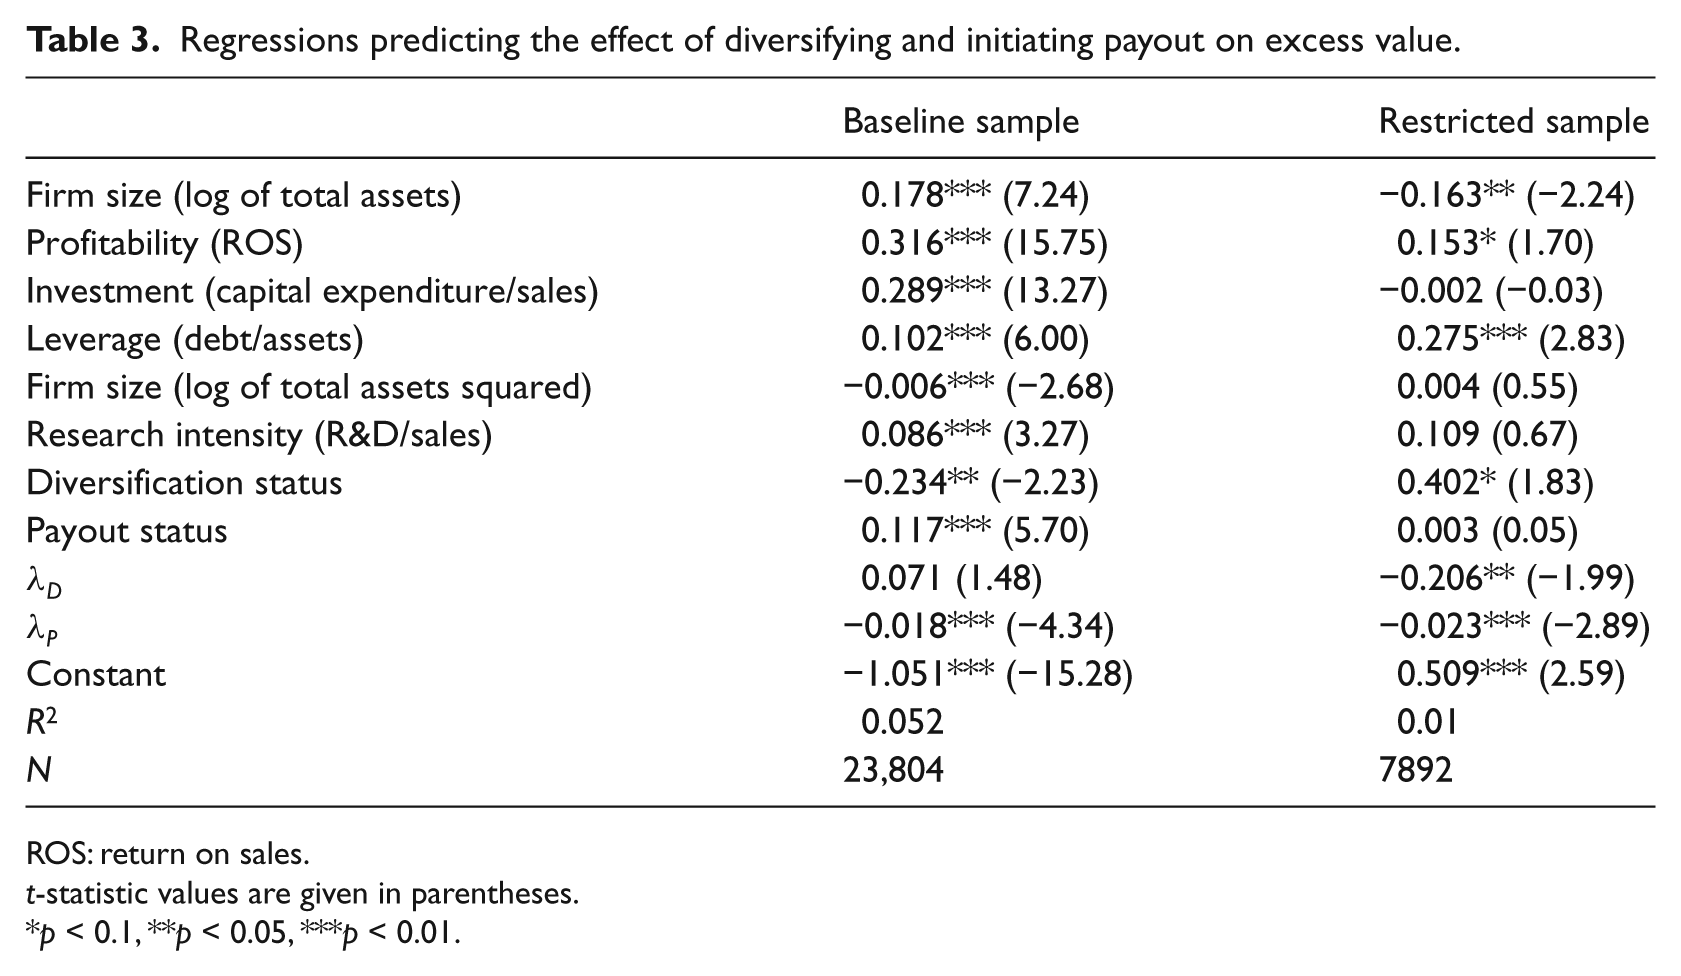
ROS: return on sales.
t-statistic values are given in parentheses.
p < 0.1, **p < 0.05, ***p < 0.01.
The returns to payout are hypothesized to be higher for firms facing less attractive reinvestment options in existing businesses (Hypothesis 2). Again, two samples of firms were used to test this hypothesis: one with higher opportunity costs of reinvestment (baseline sample) and the other with lower opportunity costs of reinvestment (the sample restricted to firms experiencing slowing growth). Results for these samples are shown in Table 3, columns 2 and 3, respectively. For the baseline sample, there is a statistically significant positive coefficient of 0.117 associated with initiating payout. In the restricted sample, this coefficient reduces to a statistically insignificant level of 0.003. Thus, Hypothesis 2 is not supported.
Hypothesis 3a predicts that diversification will be better than payout when reinvestment opportunities are declining; Hypothesis 3b predicts the opposite. Hypothesis 3a is supported over 3b; the coefficient for diversification is much larger (0.402) than it is for payout (0.003) in the restricted sample.
Across both the baseline and restricted models in Table 3, three out of the four endogeneity correction terms are significant and negative, indicating that the factors that lead firms to choose to diversify or payout also reduce the firm’s value.
Discussion and conclusion
There is a growing recognition of the importance of incorporating opportunity costs into strategic management research (e.g. Levinthal and Wu, 2010). This article demonstrates the value of such efforts in the literature comparing the effects of reinvestment versus diversification on firm performance—an area of considerable debate (Palich et al., 2000; Prahalad and Bettis, 1986; Rumelt, 1982). Indeed, there is still little consensus on this relationship, despite a vast quantity of articles on this subject spanning at least half a century. Articles showing a positive relationship are as common as those showing a negative relationship, and many show no relationship at all. Indeed, powerful theoretical arguments can be made for all three of these results.
This article suggests that a failure to understand the opportunity costs associated with reinvestment may partially explain this lack of consensus. The central argument of this article is that the impact of reinvestment, corporate diversification, and payout policy on firm performance may in part depend on the opportunity costs that the firm faces—that is, when the opportunity cost of reinvestment is higher, the returns to diversification will be lower and when the opportunity cost of reinvestment is lower, the returns to diversification will be higher.
The results offer support for this view. When firms are growing, the opportunity cost of diversifying is higher, and the value of diversifying is negative; but for firms experiencing slowing growth, diversification can be a value-enhancing strategy. These results suggest that returns to reinvestment and diversification depend critically on the relative value that each of these alternatives create and not just on the value of reinvestment separately and the value of diversification separately.
This research also included payout as an opportunity forgone relative to reinvestment (and diversification). Payout—through stock repurchases or dividend policy—is not an action routinely considered in the strategic management literature. After all, payout is not likely to be a source of competitive advantage for a firm. However, payout was important to include in this research because it represents a well-established alternative to both reinvestment and diversification. Failure to include payout in the research design would be to ignore one of the most important opportunities forgone in this particular strategic context.
This said, the results regarding payout are quite interesting and not entirely consistent with research in finance that shows a consistently positive relationship between payout and firm value. For firms with slowing growth in particular, relative to reinvestment and diversification, payout does not have a significant positive relationship with firm value. This suggests that the large literature in finance that examines the relationship between payout and firm value suffers from the same limitation as the literature in strategic management on reinvestment and diversification. That is, the payout literature may fail to control for both of the opportunities forgone—namely, reinvestment and diversification. The research reported here suggests that when the values of these alternatives to payout are considered, reinvestment or diversification look relatively better.
The importance of controlling for a firm’s other alternatives in the study of the strategy–performance relationship generalizes beyond the present area of study. The traditional research approach in strategic management does not account for how the impact of strategies on a firm’s performance depends not only on the value such strategies create but also on the value that different strategies could have created for a firm if those strategies had been chosen. It is quite possible that accounting for these roads not taken—both theoretically and empirically—will increase our understanding of the impact of a firm’s strategic choices on that firm’s performance.
At least one other example is found in the corporate social responsibility literature. Within this literature, hundreds of empirical studies have been published following the typical empirical approach for strategy research described in this article. That is, most articles in this literature apply some measure of the extent to which a firm is implementing a strategy of socially responsible activities and some measure of firm performance and then—controlling for environmental and organizational contingencies identified by relevant theory—examine the empirical relationship between socially responsible activities and firm performance. As Margolis and Walsh (2001) note, there seems to be a slight positive relationship between corporate social responsibility and firm performance. However, this work has yet to consider the opportunity cost of these firms’ socially responsible investments. There are clearly alternatives available to firms that might return to the firm far greater financial rewards than investments in corporate social performance. This then suggests inquiry into what those alternatives might be and why it is that firms choose to engage in corporate social performance when other more lucrative alternatives could be pursued.
These are fundamental questions about the opportunity costs associated with pursuing a particular strategy, that is, the value of the opportunities forgone when a firm pursues a particular strategy, and how this value forgone is critical to consider when choosing a particular strategy.
At a more fundamental level, all this research—on reinvestment, diversification, and payout separately and on reinvestment, diversification, and payout that sees each as opportunities forgone for each other—seek to examine the average relationship between a particular firm action—reinvestment, diversification, and/or payout—and firm value. However, most of the theory that explains when firms will generate value from their strategic efforts suggests that it is how firms use their individual resources and capabilities to conceive and implement their individual strategies that determine the extent of the competitive advantage that will be generated (Barney, 1991). A firm with certain kinds of resources and capabilities may be able to generate more value through reinvesting than through diversification or payout, a firm with different resources and capabilities may be able to generate more value through diversification than reinvesting or payout, and so forth. The fact that, on average, slow growth firms create more value through diversification than reinvestment says nothing about a particular firm in a slow growth setting that, say, might happen to have the resources and capabilities that lead to more value being created by reinvestment or payout.
In the end, engaging in research that examines the relationship between strategy and performance for individual firms may be a valuable opportunity forgone of research that examines the determinants of the average relationship between a strategy and the performance of a sample of firms.