
Abstract
This article examines how two fundamental features of many intermediaries—that intermediaries provide ratings across a set of candidates (their portfolio), and that intermediaries wish to look credible to their audiences—may create the potential for bias in evaluation outcomes. I examine how having too many positive ratings, which risks intermediary credibility, may bias an intermediary in favor of giving a subsequent negative rating, which I term strategic balancing. My setting is the ratings given by equity analysts on publicly traded firms. I find evidence consistent with a strategic balancing effect, such that having a greater allocation of high ratings in an analyst’s portfolio is associated with a subsequent negative rating, particularly when such ratings can be justified. My findings suggest that lower ratings may not be the result of poor firm performance, but instead may occur because such a rating allows an intermediary to maintain credibility. That is, the very features that define the role of the intermediary—one who interprets many market offerings for a particular audience—can create the conditions in which its evaluations may be subjective.
Keywords
Evaluations of firms by others have been an important though not always explicit influence on firms’ behavior, in particular the ratings of third-party market intermediaries. These “market critics” work on behalf of would-be transaction partners to provide market guidance that facilitates exchange. Intermediaries are common in information technology (where buyers of switches, servers, and infrastructure rely on third parties such as Gartner to evaluate products and providers), in consumer goods (where guides provide expert analysis of product offerings), and in finance (where bond and equity analysts create ratings to guide investors). Although these intermediaries do not participate in exchanges themselves, their evaluations have been linked to firms’ ability to attract suppliers, partners, and customers; they also impact revenues and survival (Askin and Bothner, 2016; Gioia and Corley, 2002; Shrum, 1991; Wiersema and Zhang, 2011; Womack, 1996).
Because the implications of both positive and negative ratings can be significant for the firms that receive them and the audiences who use them, research on intermediary behavior has attempted to understand the conditions in which intermediaries are not objective. One important area of consideration has been the existence of dependency relationships between the intermediary and the firms it rates. Conflicts of interest arise if intermediaries are paid, directly or indirectly, by the firms they rate. Rated firms prefer positive ratings, but audiences generally prefer objective ratings, whether they are positive or negative (Blank, 2007; Hayward and Boeker, 1998; Lounsbury and Rao, 2004). When an intermediary depends on remuneration from firms it rates, it may be inclined to give those firms positive ratings even if they do not deserve them, thus creating ratings that are not objective (Fleischer, 2009; Hayward and Boeker, 1998; Michaely and Womack, 2005; Westphal and Clement, 2008).
Dependency relations between the intermediary and the firms it rates are not the only dependency relation impacting an intermediary, however. Less attention has been paid to the dependency relation between the audience for the ratings and the intermediary, and whether this affects the objectivity of ratings. The mere existence of dependence introduces the possibility that ratings may be influenced by a desire to maintain this relationship in ways that do not result in purely objective information (Firth et al., 2013). Yet typically, researchers assume that the interests of audiences and intermediaries are aligned: audiences wish to have objective information on firms while intermediaries wish to provide this information in exchange for remuneration. Firms and audiences change their behavior based on whether ratings are positive or negative (Askin and Bothner, 2016; Harrison et al., 2017); if ratings result from unexpected sources of bias, both may respond inappropriately.
To examine whether the audience–intermediary relationship can result in subjective ratings, I build on recent research showing that much of the action of intermediaries occurs via a comparative approach. Intermediaries develop ratings based on a set of multiple companies that comprise their portfolio, such that they evaluate them in a relative fashion (Bowers, 2015; Smith and Chae, 2017). Audiences value the increased information provided by the portfolio of reviews and therefore tend to engage repeatedly with the same intermediary (Blank, 2007). I also draw on two related literatures concerned with the process of third-party intermediaries. The first suggests that the intermediary–audience relationship is characterized by credibility, such that the continued value of an intermediary depends on its ability to remain credible (Barton, 2005; Blank, 2007; Frazier and Dixon, 2008; Wakefield and Whitten, 2006). Losing credibility threatens intermediary survival; the intermediaries therefore take steps to avoid such situations (Blank, 2007; Frazier and Dixon, 2008; Peyrache and Quesada, 2011). The second literature observes that intermediaries are self-interested actors who seek to improve their position in a market (Fleischer, 2009; Hayward and Boeker, 1998; Peyrache and Quesada, 2011; Bowers and Prato, 2018). Taken together, these literatures yield both the trigger for a lack of objectivity and a way in which intermediaries might deal with it.
I frame my analysis around a simple question: how does an intermediary’s prior set of ratings impact its subsequent ratings? The literature in comparative processes suggests that comparison across attributes (such as performance) may influence subsequent ratings, but implies that the specific ratings of other firms themselves are not influential. However, the literature on credibility suggests that audiences are often aware of prior ratings given by an intermediary and can determine whether the analyst tends toward positive or negative evaluations. Too many positive ratings risk an intermediary’s credibility, while negative ratings can improve it (Brown et al., 2015). I hypothesize that when faced with credibility challenges from an overly positive set of prior ratings, an intermediary may be likely to issue a negative rating. I term this strategic balancing, since a lower rating helps balance previously positive ones. I suggest that strategic balancing will be particularly likely when it can be justified.
My setting is the ratings that equity analysts make on publicly traded firms. The ratings of equity analysts have been shown to materially impact the stock performance of publicly traded firms as well as their strategies (e.g. Barber et al., 2001; Boni and Womack, 2004). This suggests that all parties involved in the stock market—publicly traded firms, individual investors, and institutional investors—respond to the work of analysts. My analytical approach is one of triangulation: because the main effect for strategic balancing is consistent with several alternative explanations, I include a series of further analyses. If confirmed, these findings would be consistent with a strategic balancing hypothesis while less consistent with alternative explanations.
This study contributes to knowledge on the determinants of ratings. It goes beyond the well-known studies of conflict of interest between intermediaries and the firms they cover to look at ways the ratings of firms may lack objectivity. Strategic behavior may also occur. Importantly, bias from strategic balancing may artificially decrease the ratings of a given firm, which has the opposite effect of bias via intermediary conflicts of interest. The study also contributes to an understanding of how social comparison in evaluation can result in outcomes that do not coincide with actual firm behavior. Prior literature has focused firm-specific attributes rather than on those related to the rater itself as sources of comparison (e.g. Boivie et al., 2015; De Vaan, Elbers and DiPrete, 2018), but I provide evidence that comparison can also be based on subjective outcomes specific to the actor doing the comparisons.
Theory and hypotheses
In the abstract, the process of exchange is simple: an array of firms or products exists, and buyers choose the one that best meets their needs. Underlying even a simple transaction between buyer and seller, however, is a host of informational requirements. Buyers must have knowledge of at least some if not all of the producers in a market, as well as their offerings, and must evaluate those offerings based on a set of meaningful criteria. In many markets, such information is difficult to obtain on its own. This may occur because of the sheer size of the market, as in consumer goods, the complicated nature of the objects being exchanged, as in the stock market or real estate, or because the objects themselves are experience or credence goods, such as wine or movies, whose value can be understood only after consumption (Hsu et al., 2009; Waguespack and Sorenson, 2011). In these settings, professional intermediaries often assume the work of compiling a set of firms and evaluating their offerings, thus interpreting the market for their audiences, which include buyers and suppliers (Kennedy, 2008). They then sell their evaluations of multiple candidates 1 to audiences in the form of ratings and reports.
Intermediaries’ ability to sell ratings depends in large part on their credibility. Audiences value the intermediaries’ objective information, as it safely allows them to supplement or supplant their own search (Blank, 2007; Lee et al., 2017; Leyens, 2011). Since evaluating the information itself is by definition difficult, audiences tend to depend on the credibility of the intermediary as a proxy for the objectivity of their information. If the intermediary cannot be trusted because of ethical or informational concerns, its information is less valuable to audiences (Blank, 2007; Lounsbury and Rao, 2004). Thus, most research assumes that intermediaries have a clear incentive to be credible, because they depend on their audience for remuneration. This then translates into specific ratings for individual firms: an intermediary that depends on its audience for remuneration will seek to be credible and will therefore generate objective ratings on each firm it covers to satisfy its audience.
A focus on single ratings in isolation, however, ignores an important feature of the audience–intermediary relationship: the fact that it typically involves coverage of multiple candidates. Audiences value individual ratings, but they also appreciate the greater understanding that comes from the coverage of multiple candidates (Blank, 2007; Reingold, 2006). For example, Smith and Chae (2017) examine how comparisons with particular performance benchmarks impact hedge fund evaluation. Bowers (2015) suggests that ratings may be impacted by performance comparison within a portfolio. Audiences can examine the set of candidates an intermediary covers and see how they differ from each other in attributes or performance.
Over time, as an intermediary rates multiple candidates, the allocation of the ratings themselves can also be examined. For example, an intermediary may have a portfolio that contains firm-specific features of Lafitte, Mumm, and Taittinger (all Champagne producers), but it also has a portfolio of 95, 95, and 98 (ratings it has given). An analyst may cover Microsoft, Oracle, and Facebook but may rate them all a “strong buy.” Although obviously connected to portfolio candidates, since the performance of each portfolio candidate is correlated with the rating it is given, the portfolio of ratings (when taken as a set) is importantly distinct from rated candidates. The portfolio of ratings provides unique information even without considering the unique candidate attributes which may merit individual ratings. In the prior two examples, one champagne producer stands out from the rest, which are all the same, while no stock is distinct in the case of the analyst.
This portfolio of ratings is visible to the audience and can be interpreted in its own right. When the allocation of an intermediary’s portfolio has little variation (either no high ratings or all high ratings), it provides less information for an intermediary’s audience. Lack of variation does not allow an audience to distinguish differences among various candidates in the intermediary’s portfolio, since the intermediary has similar summary opinions about all of the candidates it has evaluated. Conversely, having some variation in the ratings an intermediary has given provides a way of differentiating among the candidates that the intermediary covers, providing a nuanced picture of an industry. Audiences expect intermediaries to help them distinguish among the candidates in their portfolio, since decision-making is more difficult if all candidates are excellent. For example, the critic Roger Ebert was chastised for giving so many positive reviews, with some suggesting his reviews were less valuable because they did not distinguish among films (Ebert, 2008). Similarly, when it was noticed that Robert Parker and his publication, The Wine Advocate, were giving an increasing number of wines perfect scores, one commenter asked, “I wonder if this is Parker’s stab at immortality . . . poisoning the well of wine reviews by giving everything 100 points destroys the value of the rating system” (Wine-searcher.com, 2014).
A high allocation of one type of rating—specifically, if an intermediary has too many high ratings—can also negatively affect its credibility. Too many high ratings may suggest to audience members that the intermediary is merely a shill for the companies it covers (Ong, 2013). For example, Peter Hammond, formerly of Maxim magazine, was well-known for creating headlines and catchy articles about films that benefited the movie studios, and many celebrated his departure from the magazine as a step toward better journalism (Brevet, 2008). When audiences repeatedly read reports with extremely favorable ratings from a single intermediary, they may be concerned that the intermediary is seeking to curry favor with candidates, or is somehow receiving remuneration from them (such as consulting fees, advertising promotion, or products at reduced or no cost). Therefore, a heavy allocation of high ratings not only provides less information, which reduces its usefulness to audience members, but may also make an intermediary appear unethical (Blank, 2007).
Because being overly favorable risks credibility, intermediaries may be particularly attuned to how their next rating will be perceived given the allocation of their ratings. Intermediaries typically cannot “undo” prior ratings, thus the only way for them to alter the allocation of their portfolio is to address subsequent ratings. If the allocation of their portfolio is heavily weighted toward high ratings, intermediaries may seek to balance it by issuing a lower rating, which I term strategic balancing.
Strategic balancing by intermediaries, in the form of issuing a subsequent lower rating when their portfolio is heavily weighted toward high ratings, adds diversity to their allocation of ratings. While any degree of variability may be helpful, intermediaries receive increased credibility when they issue negative ratings, since negative ratings are often rare, and potentially costly, to intermediaries (Blank, 2007; Brown et al., 2015). Thus, when faced with a greater allocation of high ratings, an intermediary may be more likely to issue a subsequent negative rating than would an intermediary whose portfolio is more balanced. This suggests the following hypothesis:
H1. A greater allocation of high ratings in an intermediary’s portfolio is associated with a higher likelihood of a low subsequent rating on a given candidate.
As the composition of an intermediary’s portfolio becomes increasingly dominated by positive ratings, the alert intermediary may be searching for ways to give a subsequent negative rating. Giving such a rating is not as simple as issuing it, for most intermediaries must provide justifications for their ratings (Blank, 2007). Justifications are particularly important for negative ratings, since such ratings are undesirable, and both those rated unfavorably as well as particular audience members may seek an explanation (Blank, 2007; Reingold, 2006). Justifications increase perceptions of accuracy in ensuing ratings (Ashton, 1992). Intermediaries, when they have a high composition of top ratings and seek to balance their portfolios, may be more likely to give negative ratings in situations in which the qualities of the candidates rated will make negative ratings easier to justify.
The situations that make negative ratings easier to justify can come from many sources and may be context dependent. But one important part of justification involves assessing a candidate’s attributes relative to others in a given category (Hsu, 2006). Attributes matter to intermediaries because they form the bases of performance comparison for specific candidates within their portfolio (Bowers, 2015). Intermediaries, like others, rely on classificatory schemas in order to evaluate candidates: by focusing on a given set of attributes that are common to members of a category, rather than unique attributes of individual candidates, intermediaries can quickly and consistently assess performance in a relative fashion (Bowers, 2015). A candidate who is typical possesses attributes that match well with others in that particular category, while atypical candidates may possess fewer of the features needed for full category membership, and may also possess characteristics that belong to other categories, thus spanning categories (Hsu et al., 2007; Smith, 2011). Although this often makes evaluation difficult for these candidates (e.g. Hsu, 2006), it also may make them easier to rate negatively.
Atypical candidates can be evaluated in several ways, and unique attributes may provide more opportunities to legitimately justify a negative rating than their typical brethren might. Prior research suggests that salient and unique attributes may be relevant for negative justifications (Shafir, 1993) and that highlighting negative information may lead to greater acceptance of the ensuing evaluation (Laran and Wilcox, 2011). For example, Tesla, which manufactures electric cars, received negative evaluations from several analysts in 2014 because of declining fuel prices and concerns about its battery. Such reasons were particularly applicable to Tesla because it manufactures only electric cars, unlike other more typical automakers that manufacture several kinds of automobiles. This made it possible to justify Tesla’s negative rating solely on the basis of batteries and fuel prices. Conversely, using attributes such as battery life to justify a negative rating for more typical automakers would be more difficult because all of those firms produce a variety of cars, few of which are affected by batteries. Any analyst citing battery life to justify a negative rating for a single typical automaker would also have to explain why this was not of importance to all typical automakers, and why the variety of vehicles made by each typical automaker did not overcome this. Such a justification is of course possible, but is more difficult than the simple justification for Tesla. Thus, the argument is that negative ratings on atypical firms may be easier to justify because one need not explain why a situation common to all typical firms justifies a negative rating on only one of them.
This is not to say that performance factors do not matter in receiving a negative rating. Rather, it suggests that if an intermediary has a portfolio dominated by top ratings and is searching for a negative rating to issue to balance her portfolio, then the atypical candidate, for whom a negative rating is easier to justify, may be more likely to receive it. Thus, if strategic balancing occurs, intermediaries should favor some firms over others.
This suggests the following hypothesis:
H2. There is a negative association between the interaction of the composition of prior ratings by an intermediary and the typicality of the focal candidate: the greater the typicality, the lower the positive effect of a high composition of top ratings on the likelihood of receiving a negative rating.
Setting and method
Research setting: the market for equity research
The role of equity analysts in modern American finance grew in importance in the late 1980s, coinciding with the rise of institutional investors as major shareholders in corporations. These institutional investors used analyst research to facilitate their transactions (Eccles and Crane, 1988). Investors seek high-performing stocks, and analysts help them navigate complex and often fast-changing situations within a particular industry, since the stock market is vast and no single investor could analyze the stocks of all publicly traded firms at once (Groysberg, 2010; Michaely and Womack, 2005).
Simply being covered by an analyst is a signal that a firm’s stock is worthy of an investor’s attention (Rao et al., 2001), but the recommendations that individual analysts provide influence financial markets (Boni and Womack, 2004; Brown et al., 2013; Clarke and Subramanian, 2006). Recommendations are ratings chosen from the brokerage’s rating system, a hierarchical set of categories that divides firms into above average, average, and below average. 2 Although category labels differ across brokerage firms, positive ratings are given to those firms expected to perform well, while negative ratings are reserved for those that are not expected to perform well. Neutral categories also exist for firms that do not fall within either dimension. Regardless of the actual composition of a brokerage’s rating system, a recommendation in the brokerage’s highest category is extremely desirable for covered firms, while negative ratings are undesirable (Fleischer, 2009; Hayward and Boeker, 1998). Analyst reports are also sales tools that inspire the clients of brokerage firms to buy and sell stocks (Firth et al., 2013; Groysberg, 2010). Analysts are particularly watchful of their reputations (Fang and Yasuda, 2009; Morgan and Stocken, 2003), as good reputations enhance career options and compensation (Groysberg et al., 2011). In fact, surveys of analysts suggest that negative ratings, even though they may anger covered firms (Siconolfi, 1995), create an “increase in their credibility with their clients” (Brown et al., 2015).
Each recommendation is based on analyst-determined “fundamentals”—specific drivers of a firm’s performance (Bradshaw, 2011)—that are then built into predictive models that help analysts forecast future performance. Analysts must constantly update the data in these models through individual research, visits, and interviews with each firm they cover, and discussions with investors and clients of those firms. In addition, analysts must also develop a perspective on the industry, since clients want to understand more than just the short-term performance of a given firm’s stock. A stock’s performance is likely to be, in part, a function of industry conditions. As one research director noted to a telecommunications analyst, a successful analyst is “someone who knows the industry. Your job is to get Fidelity and Capital Research and Alliance Capital Management to call you before they decide to buy or sell telecom stocks” (Reingold, 2006: 33).
Developing an industry perspective requires focusing on multiple firms, but given the intense effort required to evaluate each firm in the analyst’s portfolio, it would be impossible to provide such coverage for all possible firms in a given industry. Instead, each analyst typically covers a portfolio of 10 to 20 firms. This portfolio forms the reference group in which interpretations about a given firm’s stock are made, and allows the analyst to use the same industry attributes and methodologies to rate all the firms he or she covers (Bowers, 2015; Bradshaw, 2011).
This setting provides a distinct advantage for an empirical investigation of market intermediaries: analysts rate portfolios of stocks, which allows access to a clear set of objects under consideration at any given time, and use set systems of ratings. This means all of the analyst’s outstanding ratings can be clearly observed at the time he or she evaluates a given firm. In addition, since ratings are numeric, they do not have to be gleaned from description, as in many reports of intermediaries. However, the setting also provides specific limitations. First, such a unique setting means any findings should be most applicable to market settings where evaluation occurs within a set system rather than via inference, and where audiences of the intermediary “follow” the intermediary over time rather than making a single rare transaction. Second, analyst reports historically are positively biased, representing a profession that is designed to help investors figure out which stocks to buy. As a result, few analysts have portfolios comprised of entirely negative ratings. Since most analysts nonetheless have a variety of positive rating categories (Fleischer, 2009), this does not cause empirical difficulties, but it does limit the ability to extrapolate results to the case of an analyst with all negative ratings. However, such data sparseness is common to most settings of ratings, as few raters give all negative evaluations (Blank, 2007). Finally, my hypotheses are conditioned on sequential evaluation; that is, on the premise that analysts make recommendations over time rather than all at once. The sequential evaluation and rating system aspects of this setting represent boundary conditions to this study.
Data
I analyzed data on all analyst recommendations for all US publicly traded firms in Thomson Research’s I/B/E/S database between 1995 and 2007. In 2008, I/B/E/S discontinued updating the files revealing analyst and brokerage firm identities, limiting the sample range. These data were then matched to firm-level data from the Compustat database. For performance variables and stock characteristics I was careful to match the observations with those that immediately preceded the recommendation in time, since earnings information is not released concurrently with analyst recommendations. I excluded those observations where I was unable to get a close match in time. I excluded unnamed analysts, as well as analysts following only one firm, since my hypotheses are conditioned on analysts covering multiple firms. 3 This resulted in a final sample of 289,403 recommendations on 10,175 firms by 7633 analysts over the 13-year period.
Method
My hypotheses consider whether the prior allocation of an analyst’s portfolio and a firm’s typicality is associated with an increased likelihood of a negative evaluation of a focal firm. To examine this, I estimate the likelihood of a negative evaluation using a linear probability model. Such models lend themselves to the interpretation of interaction effects (Angrist and Pischke, 2009; see also Waguespack and Sorenson, 2011) and are particularly valuable because they allow the usage of multiple high-dimensional fixed effects, which are not possible to use in standard fixed effect models (Guimaraes and Portugal, 2010). Helpfully, in these models, marginal effects are identical to the coefficients and the significance is meaningful, allowing ease of interpretation (Ai and Norton, 2003). In addition, given that analyst ratings skew positively (Blodget, 2004), a linear probability model allows me to examine all observations within an analyst or within a stock whether or not any negative ratings were given. Since all positive or all negative portfolios are useful contrasts to my theory, it is desirable to include them. Although fewer than 1% of predicted values in the linear probability model are out of range, I also estimate additional models using the full range of ratings available for a given analyst as a dependent variable, which removes additional concerns related to the violation of assumptions of normality with the linear probability model.
My hypotheses suggest that two analysts will give the same firm a different evaluation based on their allocation of prior ratings as well as the typicality of the firm. To ensure that I am identifying the influence of the allocation of the prior ratings, I control at a very deep level for both analyst and stock heterogeneity by including stock-quarter and analyst-year fixed effects (Bowers, 2015). The stock-quarter fixed effects remove heterogeneity caused by specific characteristics of a stock in a given quarter that are not tied to an analyst. These may include the issuance of earnings releases, guidance, winning of new clients, and so on, that may impact the performance of a stock, and would be taken into account by all analysts in that quarter. On the other hand, the analyst-year fixed effects remove heterogeneity in ratings that are due to characteristics of the analyst in a given year that impact all of the stocks the analyst covers, such as the number of categories used, analyst-specific skill, the winning or possession of an award such as Institutional Investor’s All Star Analyst or the Wall Street Journal’s Best on the Street awards, and any other unobserved analyst characteristic, such as gender. In addition, to the extent that characteristics specific to the analyst in a given year influence the likelihood of the selection of firms that he or she covers, the analyst-year fixed effect will account for this.
Because of the stock-quarter and analyst-year fixed effects, I cannot separately estimate the effect of any variable that does not vary within a stock quarter or analyst year. I can only estimate those variables that vary across analysts within quarters and within analysts across quarters. I can, however, estimate the effects of interactions between non-varying variables and those that do vary (such as my typicality variable with the allocation of prior ratings variable) because the interaction will vary. Importantly, even though I cannot separately estimate the effects of these variables, the fixed effects control for the effects of any such variables and do so in a way that eliminates any assumptions about functional form (such as linearity), and are thus more flexible. I additionally control for brokerage fixed effects, which address time invariant characteristics of the brokerage firm itself, and I cluster standard errors by analyst.
I utilize the reghdfe procedure in Stata, which efficiently calculates multiple high-dimensional fixed effects (Guimaraes and Portugal, 2010; McCaffrey et al., 2012). Reghdfe creates the same estimates and standard errors as other routines, such as areg, but can model larger data sets and efficiently calculates multiple sets of fixed effects comprising a large number of values. Simply modeling a series of dummy variables by hand within a regression does not allow for the adjustment of standard errors for all fixed effect variables. The reghdfe approach is therefore preferable to more ad hoc approaches. Because my variable of interest is the allocation of prior ratings, I treat the fixed effects as nuisance parameters and do not examine their coefficients directly.
Measures
Dependent variable
Negative rating
Analyst recommendations were coded using the translation ratings supplied by I/B/E/S. Although brokerage firms may have different category labels for individual rating categories (e.g. buy, sell, and hold, versus market outperform, market perform, and market underperform), the translation ratings allow rating categories to be commensurate across firms, since different firms may use different labels for their categories and may have fewer categories than the five used by I/B/E/S. Interviews with Thomson Research confirm that the brokerage firms work with Thomson to determine the scaling of their rating system at 1 through 5. Thus, one firm with a rating of Buy, Hold, Sell may choose to map its categories to 1, 3, and 5, while another with the same category labels may choose 2, 3, and 5. The translation ratings are on a scale from 1 to 5, with 1 and 2 being positive recommendations, 3 being a neutral recommendation, and 4 or 5 being a negative recommendation. Since any rating below a neutral recommendation is undesirable to firms, I created an indicator variable coded 1 for any rating that was a 4 or 5 and 0 otherwise.
Independent variables
Proportion of top-rated stocks
Being rated highly by a brokerage firm is, not surprisingly, the preferred outcome for publicly traded firms. Because not all brokerage firms use all five rating categories in the translation ratings, I focused on the top positive rating that a brokerage could give because this is the preferred category that covered firms wish to receive. In addition, the top rating has a commensurable meaning across multiple brokerages. I first determined the brokerage firm’s top rating by looking for the highest rating category the brokerage firm used in the prior year. (I used the brokerage firm because individual analysts may not use all of the categories their brokerage firm uses, as when an analyst never rates a firm “strong buy” despite other analysts in the same brokerage firm using that category.) I then constructed the analyst’s portfolio in the following way: for each recommendation made by a given analyst, I/B/E/S records the date the recommendation was released (the “announcement date”) as well as the date on which the recommendation was changed (the “revision date”). For each rating by a given analyst, I determined the analyst’s portfolio, described as all of the ratings by that analyst with an announcement date before the focal firm’s announcement date and a revision date after the focal firm’s announcement date. Some recommendations last merely a few days, while others remain valid for more than a year, and this allowed me to capture all concurrent recommendations. The proportion of top ratings in the analyst’s portfolio was then the total number of top ratings divided by the total number of firms in the portfolio. This measure excludes the focal firm.
Typicality
I measured the degree to which a particular stock fits into known industry categories (Tan and Roberts, 2010; Zuckerman, 2004). Firms with high typicality are those followed by analysts who all follow the same set of stocks, suggesting a close fit of firms within an industry. Those with low typicality are followed by analysts who do not follow the same sets of stocks, suggesting a firm that crosses industry boundaries (Zuckerman, 2004).
I construct the typicality of each firm in a given quarter using a rolling window to calculate the minimum overlap of each pair of analysts for all earnings forecasts released during the previous 12 months, since earnings forecasts are updated more frequently. I use the procedure outlined in Zuckerman (2004) (and replicated in Bowers, 2015), where in the first stage the minimum pairwise overlap is calculated, and then summed across all analysts covering a stock. Formally, this is calculated as pij = min((mij/ni), (mij/nj)), where mij is the number of firms followed by both i and j, and ni and nj are the total number of firms followed by each analyst (Zuckerman, 2004). Then, typicality was calculated as
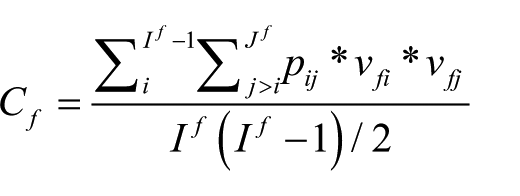
where If is the total number of analysts that follow the focal firm, and vfi and vfj are indicator variables taking the value of 0 when analyst i or j does not cover firm f, and 1 otherwise (Zuckerman, 2004). The value of the typicality variable ranges between 0 (completely atypical) and 1 (completely typical.)
Control variables
Because of the analyst-year and stock-quarter fixed effects, I control only for those variables that vary within the analyst year or the stock quarter. Non-varying characteristics of the stock, such as a firm’s net income or size, are captured with the fixed effects, as are specific characteristics of analysts, such as their status as an All Star, their selection process for stocks during the year, and so on.
My first hypothesis suggests that analysts may be concerned with the allocation of ratings in their portfolio in part because they may provide less information. To control for the information provided by an analyst’s portfolio, I include a measure for the variance of prior ratings in an analyst’s portfolio.
Prior research suggests that individuals (including analysts) use relative comparison to evaluate firms (Bowers, 2015), such that a firm that performs better compared with others under consideration is more likely to receive a higher rating when it fits clearly into industry categories. To measure relative performance, I included a value for the rank of the stock’s performance among other stocks in the analyst’s portfolio. Performance was captured using the price divided by the earnings growth of the stock as recorded prior to the release of the focal recommendation (Bowers, 2015). I rank-ordered the analyst’s portfolio such that the worst-performing firms received the highest rank; thus, a positive coefficient on this variable would suggest that poor performance is associated with an increased probability of a negative rating.
Analysts do not determine their rating systems; these are determined by their brokerage houses. To address the possibility that brokerages may influence the allocation of ratings at a firm-wide level, I include the percentage of low ratings across all stocks covered by analysts at the brokerage firm at the time of the focal analyst’s rating. If analysts work for a brokerage house with a higher level of negative ratings across the stocks it covers, this may increase the likelihood that an analyst issues a low rating independently from any analyst-specific effects (Martin, 2004).
I also include measures for an analyst’s experience, calculated as the number of days from the analyst’s first recommendation on any stock after the year 1990. And I include a measure for the amount of underwriting by the focal brokerage firm, using SDC Platinum to record the number of new issues for a brokerage firm.
Descriptive statistics
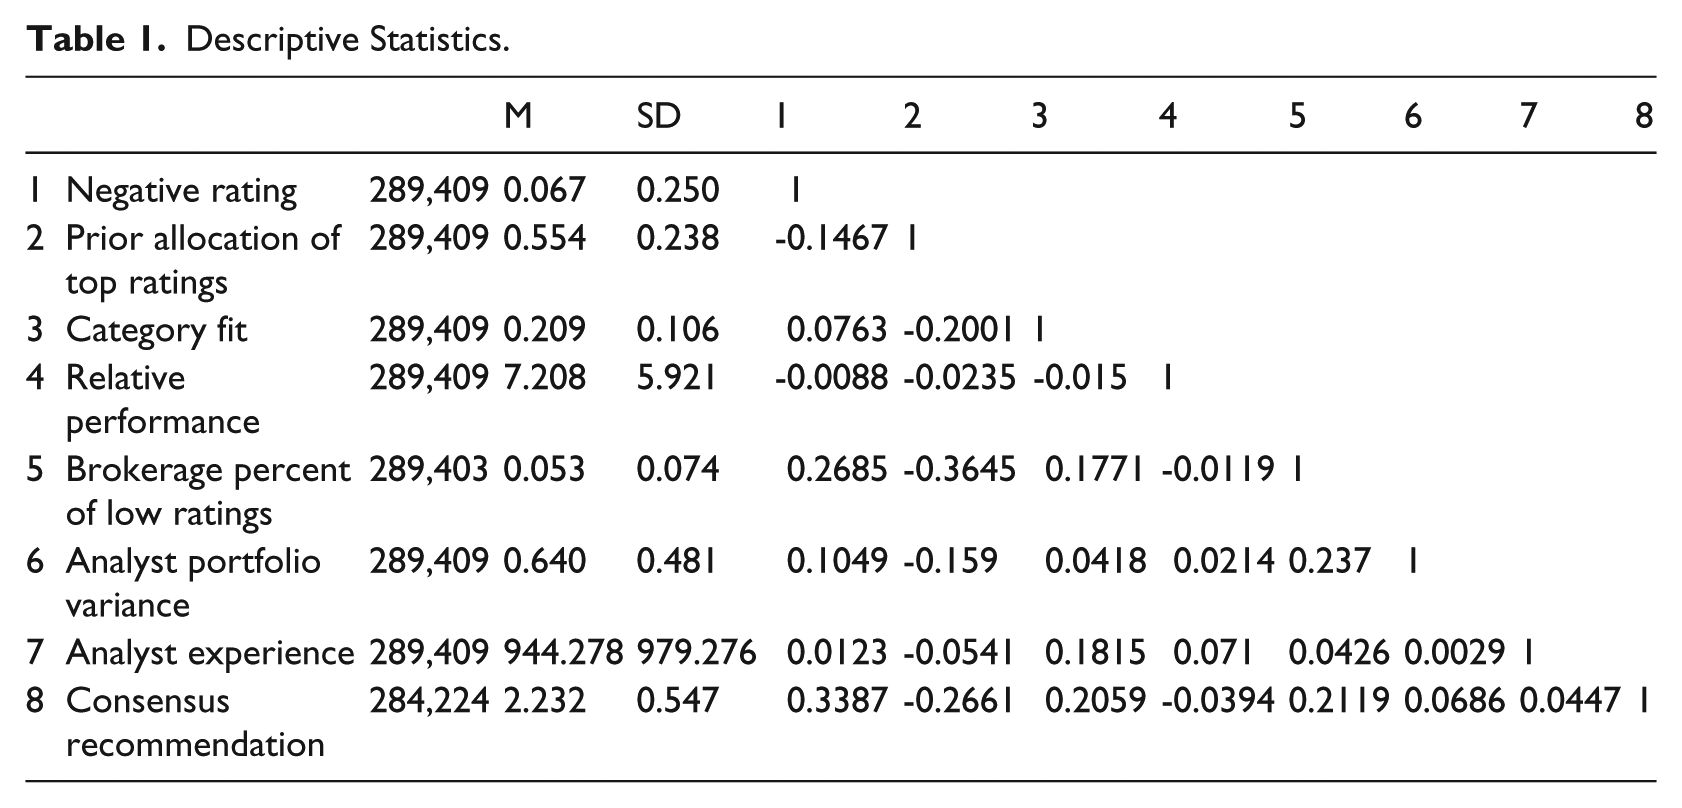
The means, standard deviations, and correlations for all variables are reported in Table 1. In general, the correlations are unremarkable. 4 Figure 1 shows the number of negative ratings in the sample over all years. Negative ratings comprise a very small proportion of the overall percentage of ratings. Only .1% of portfolios have more than 80% negative ratings, and only 1% of portfolios have at least half negative ratings. 5 There is a marked increase in the number of negative ratings after 2001. This reflects a regulatory change that forbade the selective disclosure by firms of information to some analysts to analysts and required changes to the structure of analyst reports (specifically disclosing the entire rating system and whether the analyst or brokerage firm had any interest in the stock). Figure 2 shows the average allocation of top ratings in an analyst’s portfolio. The average allocation reflects the propensity of analysts to provide mostly positive ratings (Blodget, 2004), although there appears to be a change after 2001. The analyst-year fixed effects account for analyst-specific changes related to this regulatory change.
Descriptive Statistics.
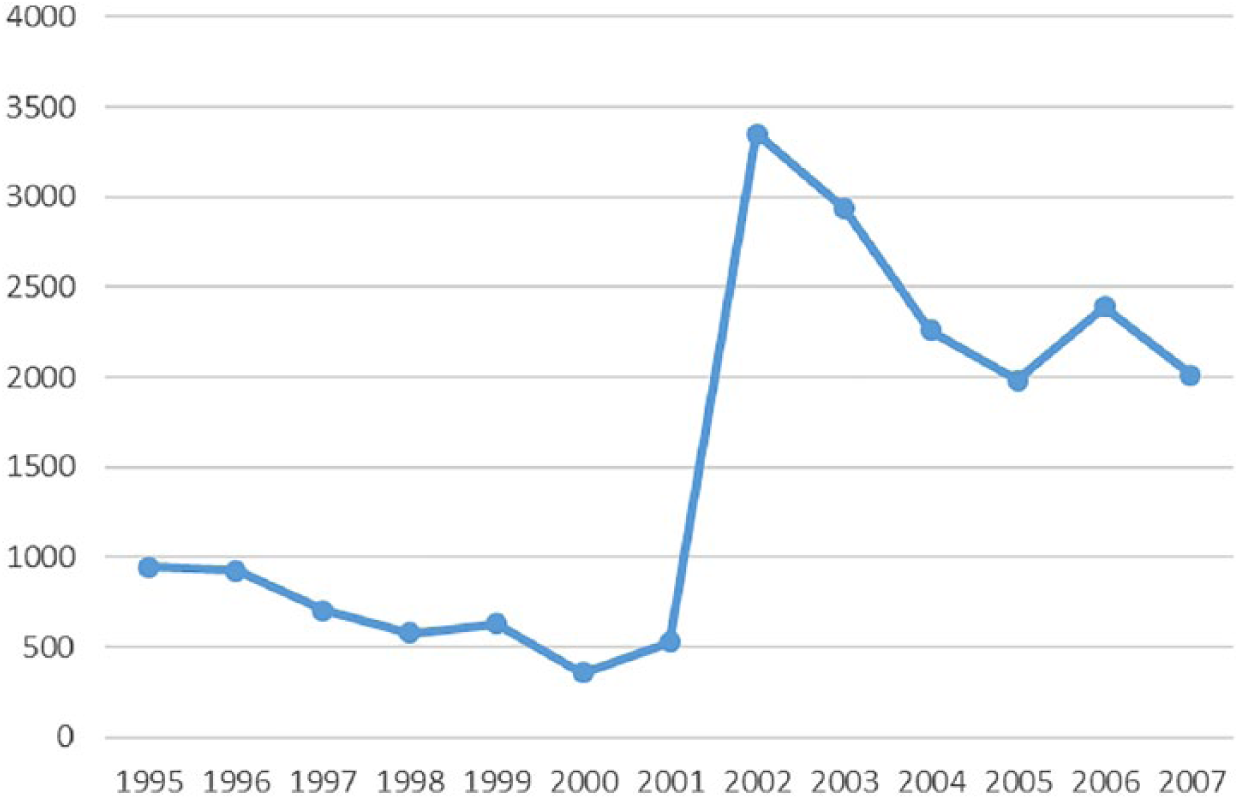
Total Number of Negative Recommendations.
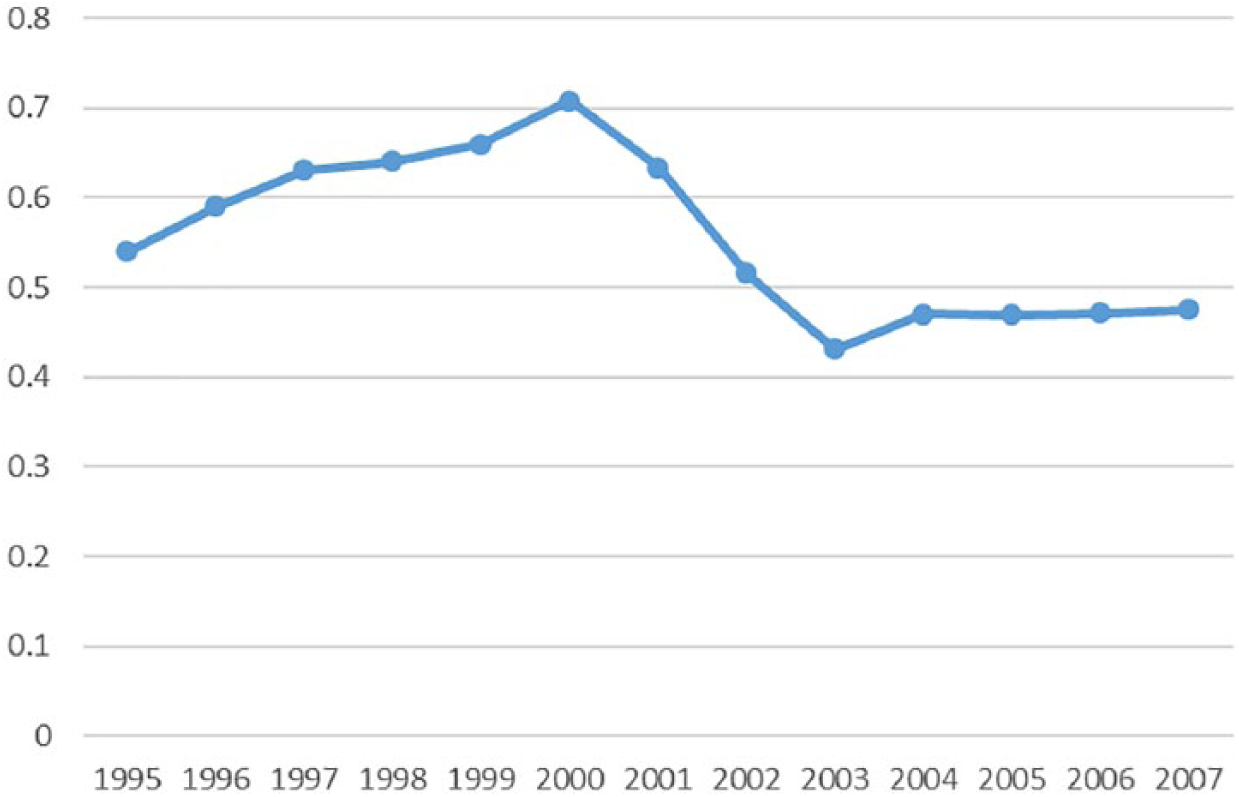
Percent of Top Ratings in an Analyst’s Portfolio.
Results
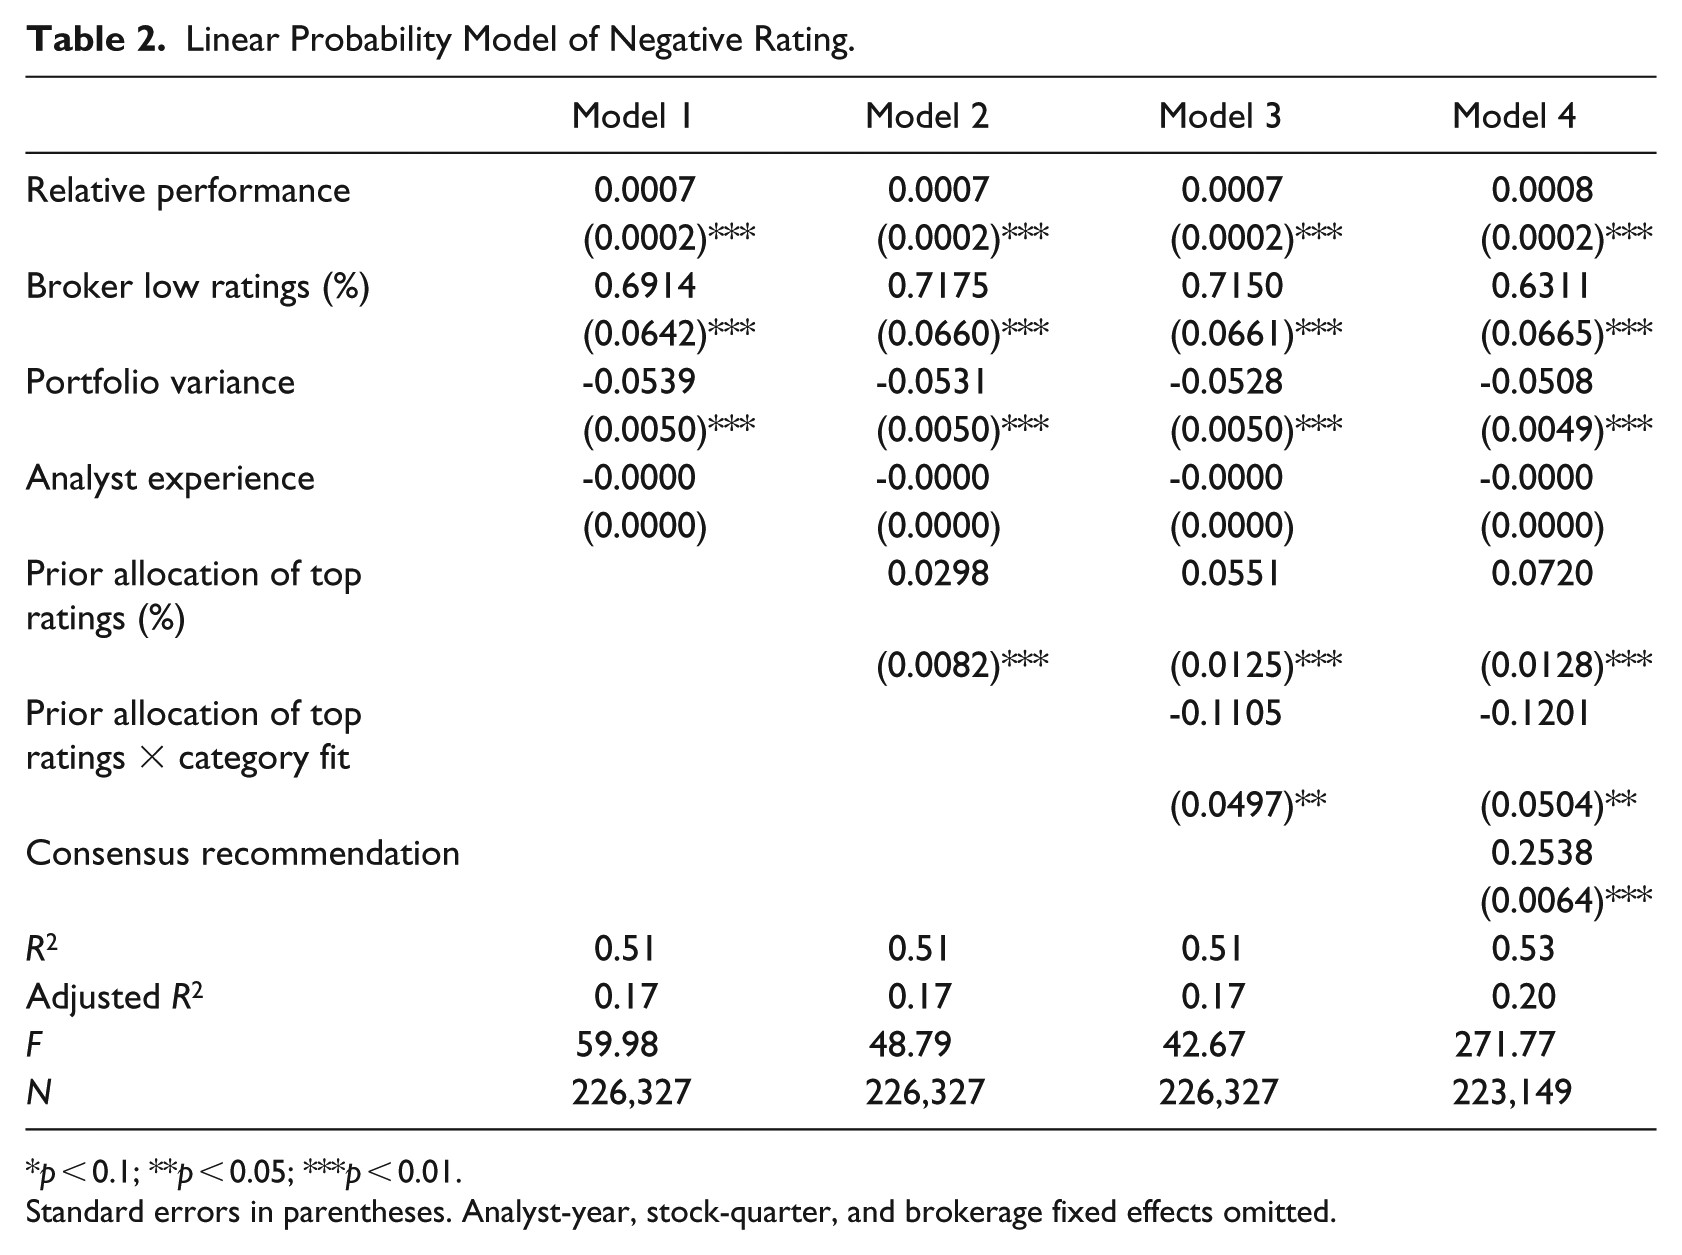
Table 2 presents results of linear probability models on the likelihood of receiving a negative rating. Model 1 contains the variables for relative performance and for the proportion of negative ratings by the brokerage firm. The variable for relative performance is significant and positive, suggesting poor relative performance is associated with a greater likelihood of a negative rating, which is consistent with Bowers (2015). The variable for the percentage of low ratings by a broker is also significant and positive, suggesting that a high level of negative ratings at an analyst’s brokerage firm is associated with that analyst also giving more negative ratings. In Model 2, the coefficients of the variable for the proportion of top ratings is significant and positive, supporting H1. The interpretation of the coefficients suggests that a one-unit increase in the proportion of positive ratings in an analyst’s portfolio is associated with a 3% increase in the probability of a negative rating. This is equivalent to comparing an analyst with no positive ratings in her portfolio to an analyst with all positive ratings in her portfolio. Note that this effect size is small, but if strategic balancing occurs at all it is problematic given the impact of negative ratings on firms. Even one negative recommendation can have a significant impact on a firm’s stock price (Boni and Womack, 2004; Womack, 1996). Thus, even though the likelihood is low overall (suggesting a rare event), strategic balancing is still possible. In addition, given the large number of ratings, over time a small effect can have a sizable impact.
Linear Probability Model of Negative Rating.
p < 0.1; **p < 0.05; ***p < 0.01.
Standard errors in parentheses. Analyst-year, stock-quarter, and brokerage fixed effects omitted.
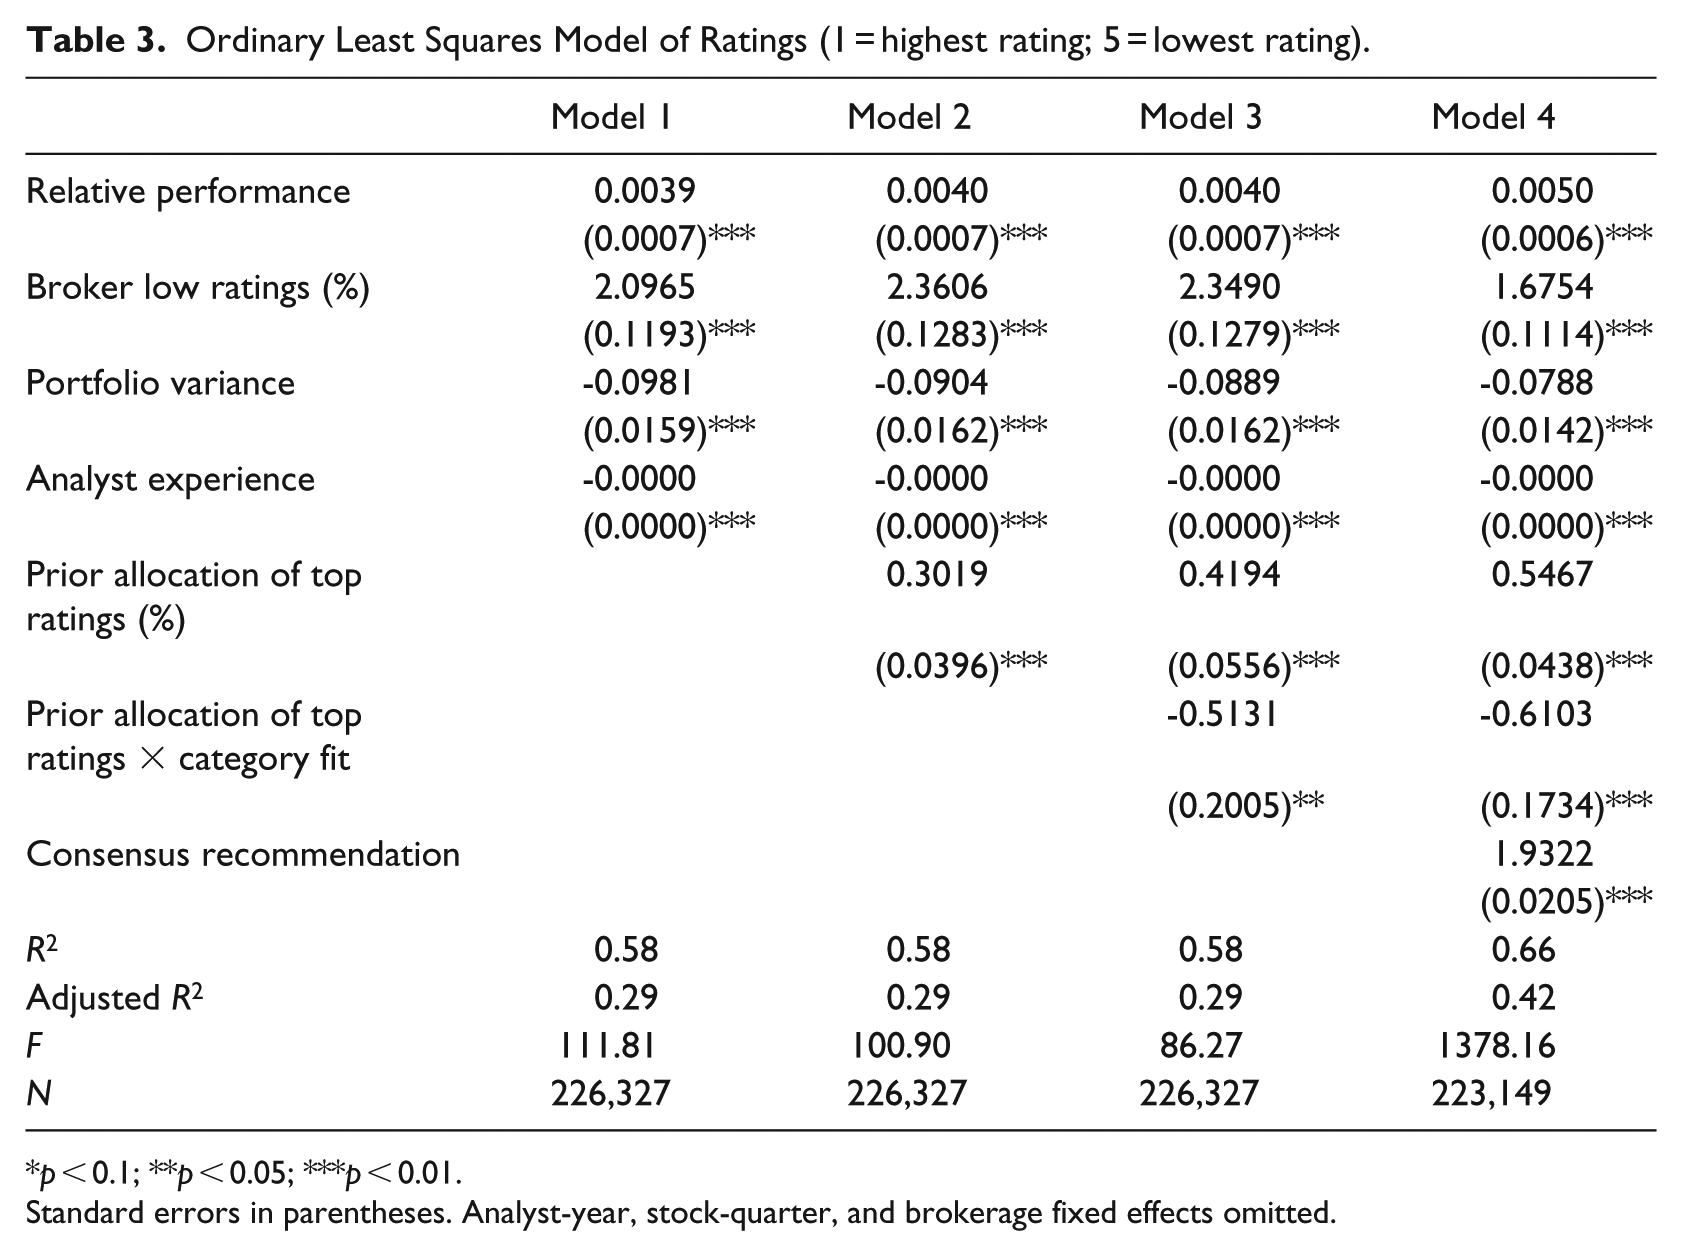
One concern with my approach is that by blunting the dependent variable into two categories I am underplaying the impact of the wide range of positive and neutral categories; additionally, analyst ratings are known to skew positively (Blodget, 2004; Siconolfi, 1995), which could suggest that rare events may be driving my results, as reflected in Figure 1. In Table 3, I re-estimate each model using the full spectrum of ratings by using the translation rating provided by I/B/E/S used to calculate the dependent variable in Table 2. A “1” from I/B/E/S is a strong buy, while a “5” from I/B/E/S is a strong sell. Thus, the interpretation of coefficient directions is the same in both Tables 2 and 3: a positive coefficient for the allocation of top ratings gives support to my hypothesis. In Model 2 of Table 3, my hypothesis is supported. Here the interpretation of the coefficients suggests that a one-unit increase in the proportion of positive ratings in an analyst’s portfolio is associated with an increase of the rating value by .30. Again, this value is small, but given that strategic balancing is undesirable, it is nonetheless meaningful.
Ordinary Least Squares Model of Ratings (1 = highest rating; 5 = lowest rating).
p < 0.1; **p < 0.05; ***p < 0.01.
Standard errors in parentheses. Analyst-year, stock-quarter, and brokerage fixed effects omitted.
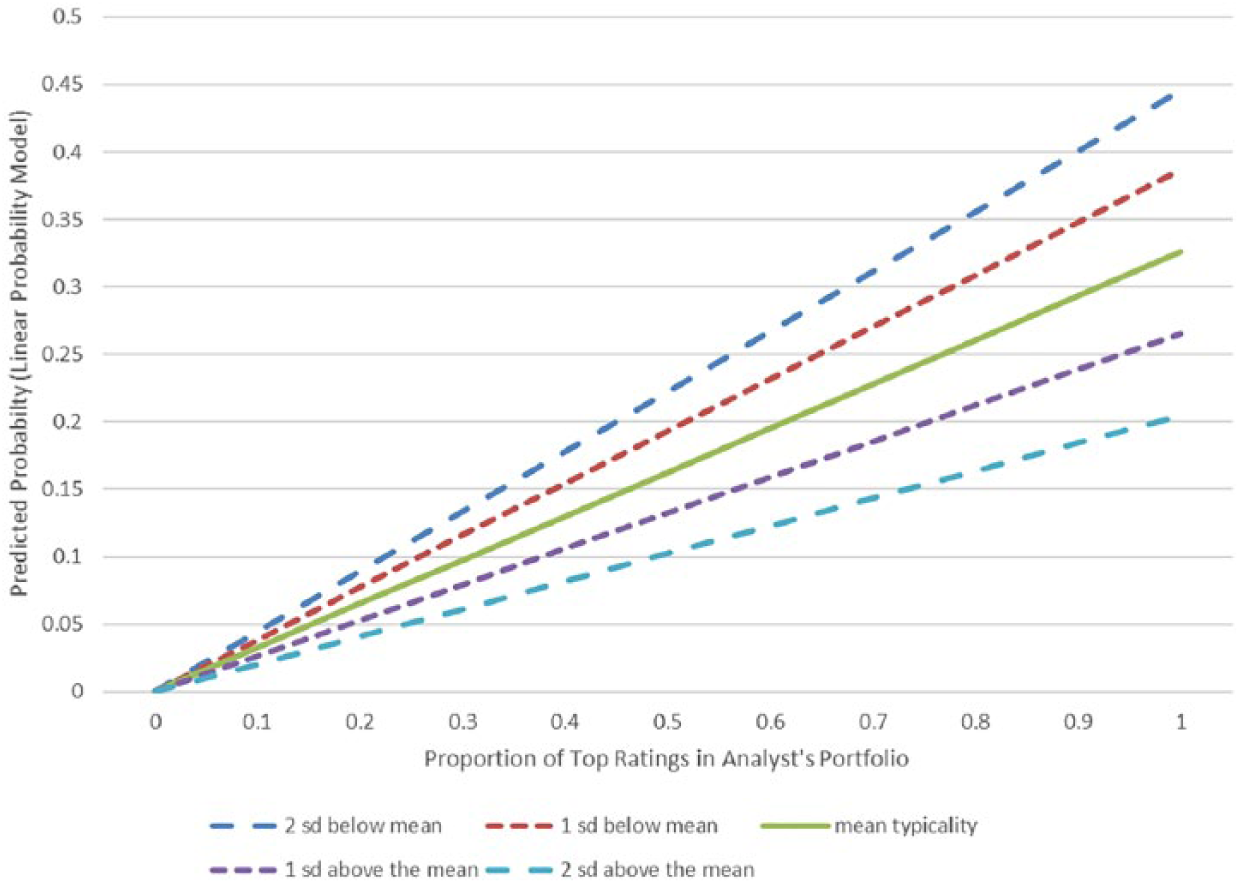
In Model 3 of Table 2, I examine H2. The interaction between the main effect and typicality is significant and negative. It is important to remember that the main effect for typicality is captured with the stock-quarter fixed effect and so does not have a separate estimate; however, because the interaction does vary within the stock quarter, it can be estimated. I graph the interaction in Figure 3, holding all other variables constant, at mean levels of typicality and both one and two standard deviations. The graphs show that atypical stocks are associated with a higher probability of a negative rating when the analyst’s portfolio has a high allocation of top ratings. The graphing suggests that for highly typical firms the impact of the analyst’s portfolio is minimal if not close to zero; however, for highly atypical firms the impact of the analyst’s portfolio is much greater.
Linear Probability Model of Negative Rating (1 = negative, 0 = positive).
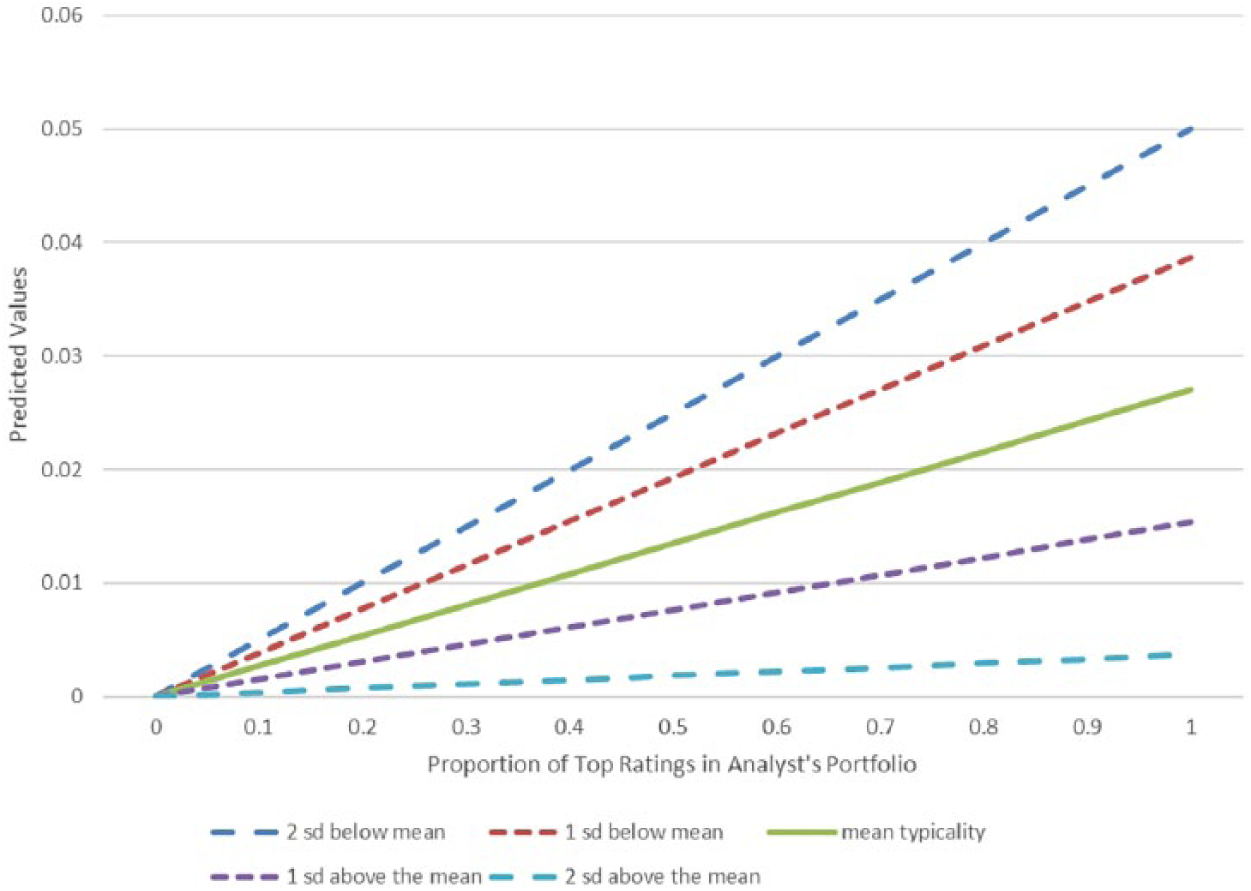
In Model 3 of Table 3, the result for the interaction using the 1 to 5 translation ratings is similar to that based on the dichotomous variable. This interaction is graphed in Figure 4, again using mean values of typicality as well as one and two standard deviations above and below the mean. Again, this suggests for highly atypical firms, a much greater impact for the allocation of the analyst’s portfolio on the recommendation value, varying by as much as .45. (Recall that higher values are negative ratings.)
Ordinary least squares of consensus recommendations (5 = negative rating; 1 = positive rating).
Although the main effect finding for the allocation of ratings is consistent with H1, it is also consistent with several alternative explanations, including the gambler’s fallacy, simple learning stories, and regression to the mean.
When subjects believe that the composition of prior outcomes of independent events should or could impact future outcomes, they are victims of the gambler’s fallacy (Clotfelter and Cook, 1993; Rabin, 2002; Rabin and Vayanos, 2010; Tversky and Kahneman, 1971). Although usually demonstrated in games of chance (Clotfelter and Cook, 1993; Guryan and Kearney, 2008), it has also been found in individuals who control decision-making, including judges deciding on asylum cases, baseball umpires determining balls and strikes, and loan officers (Chen et al., 2016). If the gambler’s fallacy is occurring, then an analyst with a high proportion of positive ratings may believe a negative rating is “due” on the focal rating, but is not behaving strategically.
Regression to the mean also concerns distributions, but the mechanism is slightly different. In statistical terms, regression to the mean suggests that repeated measures of the same outcome tend toward the mean. To apply this to an analyst’s portfolio suggests that each analyst has a mean rating, and examined in isolation, any particular rating will tend toward the mean. Therefore, with regression to the mean, an analyst may have a high proportion of positive ratings simply because his or her lower ratings (which move the portfolio toward its mean) have yet to be shared. Or, described another way, if an analyst’s mean rating is lower than her current ratings, one might expect a lower rating by mathematics alone.
Finally, learning suggests that analysts improve over time in their ability to accurately rate portfolios. Therefore, a lower rating after a series of higher ratings may be simply evidence of the analyst learning how to rate stocks more accurately.
The results for Model 3 in Tables 2 and 3 suggest support for the strategic balancing hypothesis rather than the gambler’s fallacy, because if the gambler’s fallacy is occurring, I would expect that the interaction would not be statistically significant. The gambler’s fallacy should result in an equal likelihood of lower evaluations for all firms, not a greater likelihood for some firms than others. The results for Model 3 also provide evidence that supports the strategic balancing hypothesis versus the learning hypothesis. If learning were driving the results of the allocation variable, I would again expect to find no effect for the interaction, because learning should occur regardless of which firm is rated. Further evidence against the learning hypothesis are the analyst-year fixed effects, which account for the analyst-specific skill within a particular year. Finally, learning should suggest more “accurate” ratings, not necessarily more positive or negative ones. To investigate this last concern, I also estimated a model using a dependent variable of the absolute value between the analyst’s rating and the consensus rating. The absolute value allows me to remain agnostic as to the implications of being either more pessimistic or optimistic than the consensus, consistent with a focus on accuracy. There was no statistically significant relationship. (Results of this last regression are available from the author.)
The results for Model 3 provide some support that the regression to the mean hypothesis is less plausible than the strategic balancing hypothesis. The regression to the mean hypothesis implies that the main effect should be evenly occurring across all firms in the portfolio, and not stronger for some stocks over others. However, regression to the mean could still occur if portfolio selection is not assigned at random. Two possibilities could occur. First, it is possible that some firms could be chosen with the express plan of rating them negatively. The analyst-year fixed effects account for specific behaviors of an analyst within a given year; these include particular selection behaviors affecting the allocation of the portfolio. Since analysts do add new stocks to their portfolios, I examined these descriptively. Descriptive statistics suggest that stocks rated by an analyst for the first time receive a negative rating on average 4% of the time, while stocks that have been previously rated receive a negative rating 8% of the time. This suggests that new stocks are not being chosen simply in order to rate them negatively. Including a variable for whether a stock is new does not alter the results.
However, it could be that analysts specifically rate atypical stocks lower than other stocks, so whenever these stocks appear, they receive lower ratings. In the regressions, the stock-quarter fixed effect controls for the specific performance attributes of the stock that would be associated with a lower rating. For example, the relationship between the typicality of a stock and its rating is controlled by the fixed effect. But selection could still be playing a role if stocks that have lower typicality are more likely to be selected when an analyst has a portfolio with a high allocation of top ratings. Although I hypothesize associations rather than causal claims, to examine this I conducted t tests of the mean value for typicality for analysts with portfolios above the mean allocation of top ratings and analysts with below the mean allocation of top ratings. The difference is small: those with higher than average allocations rated a stock with low typicality 22% of the time, compared with those with lower than average allocations, who rated a stock with low typicality 19% of the time, but it is statistically significant (p < 0.000). This suggests that stock order may be non-random—that is, that analysts may be more likely to choose low typicality stocks to rate when they have portfolios with high allocations of top ratings, although only by a small amount. Such behavior might still be consistent with strategic action on the part of analysts.
A final concern is that I am not considering the true value of a stock’s rating—it could be that my results simply suggest cases in which analysts are more accurate. In Table 2, the stock-quarter fixed effects account for specific stock characteristics that would determine the “correct” evaluation. However, I can attempt to more carefully account for a “correct” evaluation at any moment. In Model 4 in Tables 2 and 3, I include a variable that accounts for the consensus (average) recommendation of all analysts covering a given stock at the time of the focal analyst’s recommendation. To the extent that the average recommendation of all analysts covering the stock may represent its “correct” assessment, this variable should capture the effect of the “correct” assessment. The variable ranges between 1 and 5, with 5 being a poor evaluation by all possible analysts. Both models show that the coefficient for the consensus recommendation is significant and positive and explains a significant portion of the variance in the model. The coefficients for the allocation effect and the interaction remain significant and in the hypothesized direction. Overall, the results are consistent with the hypothesized association supporting strategic balancing when it can be justified.
Discussion
A critical aspect of firm performance is evaluation, since it is via evaluation that buyers make choices and exchange ensues. As a result, understanding the determinants of evaluations—in particular, the objectivity or non-objectivity of ratings—is exceedingly important both for firms and for those who use evaluation for decision-making. Most studies of lack of objectivity in ratings focus on dependence relationships between the intermediary and the firms it rates, since dependence relationships have been shown to introduce upward bias (Blank, 2007; Hayward and Boeker, 1998). Less examined, however, is the relationship between the intermediary and its audience as a source of non-objective ratings. Most research assumes that the interests of intermediaries and their audience are aligned: audiences want objective information; the intermediary, barring conflict-of-interest relationships, wishes to please its audience. However, this relationship is also characterized by dependency, which could impact ratings. I examined whether the self-interested desire for intermediaries to remain credible to their audiences may bias their ratings. Such an investigation is important because, while not all intermediaries face conflict-of-interest relationships, all intermediaries require an audience, thus making the study more broadly applicable to intermediaries that operate in industries such as film, restaurants, and technology.
I began by asking the question, “How does a rater’s prior allocation of portfolio ratings impact its subsequent ratings?” I hypothesized that a greater allocation of high ratings would be associated with an increased probability of a negative rating, because too many high ratings risked intermediary credibility. I termed this strategic balancing. In a study of the stock ratings of analysts, controlling for numerous confounds, I found that the likelihood of getting a negative rating varied with the allocation of top ratings an analyst had already given, such that a portfolio with a high allocation of top ratings was associated with an increased probability of a negative rating. Further analysis suggested this association is particularly strong when the focal stock is highly atypical. Negative ratings on atypical stocks are easier for analysts to justify. The results are more consistent with the strategic balancing explanation rather than alternative explanations, such as learning or accuracy. The results suggest that analysts pay attention to the allocation of ratings for their entire portfolio and may strategically balance that portfolio. Although the effect size is small, it is nonetheless meaningful because strategic balancing is a form of bias and thus undesirable, and, given the large number of ratings created, may be meaningful when considered over time.
My argument centered on the idea that intermediaries engage in a process of social comparison focused on the ratings themselves, separate from the firms that receive these ratings. Prior literature has documented how actors make comparisons in decision-making processes (often termed social comparison). However, it has typically focused on tangible firm attributes, either those that will be similarly observable across multiple decision makers, or those that are relative to an individual’s consideration set (Bowers, 2015; Leung, in press). I provide some evidence that such comparison may occur based on self-determined subjective evaluations (i.e. by the number of different ratings) by an intermediary rather than on tangible firm attributes, which is an alternative metric by which firms can be compared. This study complements prior studies that find that comparison may be used strategically by actors for self-interested gains (e.g. De Vaan, Elbers and DiPrete, 2018; Porac, Wade, and Pollock, 1999), by extending the examination to strategic action by third-party intermediaries.
Studies of intermediaries have primarily centered on the lack of objectivity that emerges from dependencies between the rated firm and the intermediary. When such dependencies exist, research suggests that evaluations may be biased upward (Hayward and Boeker, 1998). By shifting the focus to the intermediary–audience dependency, I provide evidence of a negative association, where evaluations are biased downward. The motivation for such a negative bias was the credibility challenge that arose from overly favorable rating portfolios. However, crises of credibility are only one way in which intermediaries may be tempted to act self-interestedly; there are likely others. It is also possible that dependencies between audiences and intermediaries may be associated with upward biases, for example, if audiences have a strong need for positive third-party ratings. Carefully considering the different outcomes that may arise for the parties in a brokered relationship, particularly when strategic self-interest of intermediaries are considered, would be beneficial.
Finally, this study provides additional evidence that challenges the common belief that third-party evaluations, barring overt conflict of interest, are solely the result of quality or performance differences among those that are rated. Intermediaries seek credibility, which arises not only from specific ratings, as shown in prior literature (Blank, 2007) but also from the portfolio of ratings, as shown here. Should ratings all be positive, the intermediary risks a perception that it provides little value other than being a shill, which challenges its position as a credible authority in the field. Were intermediaries only to give positive ratings, their relevance as intermediaries would be less valuable. Negative ratings, when mixed with more positive ones, thus provide portfolio-wide value in addition to any firm-specific information they may provide.
The findings here suggest that a negative rating may not be necessarily the result of evaluators having negative information about a particular firm, but rather may occur because such a rating allows an intermediary to maintain credibility in the eyes of its audience. Although evaluations are often seen solely as attribute-based outcomes linked to specific firms under consideration, the findings here suggest that the evaluations of market intermediaries in particular must also be understood in the context of their self-interested role as interpreters and evaluators for their audiences. That is, the very features that define the role of the intermediary—as a credible interpreter of many market offerings—can create conditions in which its ratings may become biased.
More generally, this study points to the value of examining the underpinnings of evaluations, particularly when third parties are involved. Some of the concerns about bias related to outside evaluators are well documented, such as conflict-of-interest relationships, but future research can and should investigate other aspects of third-party relationships, particularly given the fact that evaluations have significant outcomes for rated firms as well as for their audiences. Given the ease with which rankings and ratings are created, whether by professionals or consumers, evaluations are becoming more and more a part of organizational life. Negative ratings in particular impact firm performance (Hsu, 2006; Shrum, 1991; Womack, 1996) and often prompt changes in firm behavior (e.g. Sauder, 2008; Wiersema and Zhang, 2011; Zuckerman, 2004). They most certainly impact audience engagement. If at least some negative ratings occur because of strategic balancing, these responses may be misguided. A deeper understanding of who creates ratings, and how, will offer insights both to those who use these systems and to those who would be evaluated by them.
Footnotes
Acknowledgements
Special thanks to Matteo Prato, Ned Smith, Todd Zenger, Laura Doering, Chris Liu, Andras Tilcsik, and participants at the Utah Strategy Conference and Lugano Conference on Organizations who provided helpful comments. Editor Glen Dowell and 3 anonymous reviewers also provided important insight, including a better title.
Funding
The author(s) disclosed receipt of the following financial support for the research, authorship, and/ or publication of this article: This research is supported by a Social Sciences and Humanities Research Council of Canada Insight Development Grant.