
Abstract
Policy makers in California intend to provide free preschool to all 4-year-olds solely within public schools by 2026, becoming the nation’s second largest single pre-K program in the United States after Head Start. This initiative builds on the state’s existing Transitional Kindergarten (TK) option that has served a modest share of 4-year-olds since 2010. Tracing the historical growth in TK enrollments, we find that just 30, mostly urban school districts, enrolled two-fifths of all children served by 2020, responding to funding incentives and displaying stronger organizational capacity. Meanwhile, one-third of California’s nearly one thousand districts enrolled fewer than 12 TK children. Black, white, and Asian children remained disproportionally under-enrolled as a share of their respective populations, as enrollments climbed past 90,000 children prior to the COVID-19 pandemic. Identifying factors that may explain widely differing gains in TK enrollment, merging education and local census data, we find the suburbs began to catch-up with cities in serving additional 4-year-olds, as well as districts offering school choice (e.g., charter schools). We discuss implications for other nations attempting to rapidly expand preschool, including the inequities that may inadvertently arise.
Introduction
California has joined numerous nations throughout the world along with several other states and cities across the United States (US) to offer free and universal prekindergarten (pre-K) to all young children. A half-century of research details the cognitive and social-developmental benefits that accrue to youngsters from families with weaker resources who attend high-quality pre-K programs (e.g., Yoshikawa et al., 2013). Policy questions persist on why such gains tend to fade in primary school and how to equitably distribute high-quality programs to reduce disparities in children’s early growth (Fuller and Leibovitz, 2022). Most relevant for our study, we know little about how widely diverse local communities respond to the state’s hopes for expanding pre-K rapidly. During early expansion, we seek to understand if inequities arise in terms of which families first enroll and which local school authorities hold the capacity to expand.
Nations such as France, Italy, Japan, and the Netherlands offer near universal access to pre-K. Yet other countries—Argentina, China, Mexico, Turkey, and Uruguay, for example—are widening access to pre-K (Agirdag et al., 2015; OECD, 2010, 2013). As these efforts gain political steam, it is important to understand which families and local education authorities are more likely to respond to fiscal incentives or policy messages from government during initial stages of expansion. This is the core question we addressed in our paper, relevant to many nations and regions around the globe. The incremental implementation of this education reform may inadvertently favor certain groups or locales.
In 2021, California joined the universal pre-K movement when the state’s governor pushed to fund pre-K for all 4-year-olds, aiming for free and universal access by 2026, eventually costing about USD$8 billion per year. Policy makers expanded the state’s existing Transitional Kindergarten (TK) program which served about one-fifth of 4-year-olds before the COVID-19 pandemic. California’s effort operates solely in public schools, excluding community-based nonprofits (NGOs that often provide pre-K services in other nations), while offering a significant fiscal incentive to local school districts that open TK classrooms. Many districts face declining K-12 enrollments as fertility rates decline, resulting in excess classroom space. California’s TK program is similar to systems in Denmark, Finland, and Norway in that it seeks to build a public system rather than a mostly private one; China, Germany, and the Netherlands have structured a “mixed market” of pre-K centers (Van der Werf et al., 2021). Unlike France and Mexico’s preschool systems, California’s TK program is not compulsory (Flemons et al., 2022; Lopez, 2011).
In this paper, we examine how different racial and ethnic groups gained access in the initial years of TK, and why certain local areas and school districts responded in robust fashion to the state’s incentives for growing this program, while many others did not. We trace enrollment gains for different groups through the spring of 2020, just prior to the COVID-19 pandemic. After observing widely varying rates of enrollment growth among California’s one thousand school districts, we examine what demographic and institutional factors explain this variation over time.
Our results should inform policy makers and local educators on how differing communities respond to pre-K expansion initiatives, along with how local institutions vary in their capacity to serve additional families. We found that enrollment of 4-year-old children grew steadily in California, averaging 14% annually, during the TK program’s initial decade. By the 2019–20 school year, roughly 19% of all 4-year-olds statewide were enrolled in TK.
Yet, growth was most robust in 30 largely urban school districts. These districts potentially had more organizational capacity to open TK classrooms and hire experts in early childhood education, along with responding to a stiff fiscal incentive to add this pre-K program when faced with declining enrollments. Meanwhile, one-third of California’s one thousand districts enrolled fewer than 12 TK students by 2020, mostly small- and mid-sized districts with more limited organizational capacity. In many counties, Black, 1 Asian, and white children remained disproportionally under-enrolled compared to their Latinx peers, as total TK enrollments reached more than 90,000 students statewide.
We begin with a review of the recent push to expand free, universal pre-K to 3- and 4-year-olds, a policy gaining political appeal worldwide over the past quarter-century. Next, we outline the aims and decade-long history of Transitional Kindergarten in California, one particular model of pre-K in the state. This leads to our empirical questions regarding which school districts have responded to state incentives and what kinds of families have expressed strong or weak demand for this new program (state allocations reached USD$21,600 per TK child by 2022). We then estimate variation in TK enrollment growth among school districts, controlling for demographic features of communities and organizational facets of districts—seeking to explain the wide variability in TK among local areas. Our study yields lessons for governments eager to widen access to pre-K, yet often faced with limited institutional capacity locally, along with unequal access to preschool initiatives that threaten to reinforce, not narrow, disparities in children’s early learning.
California case—Pre-K history and policy priorities
California’s rising investment in preschool—spurred by state and federal policy leaders—stems from two underlying forces. The first is the increasing demand for nonparental forms of child care, sparked by rising rates of maternal employment from the 1970s forward. Nationally, in 1975, 39% of mothers with a child under 6-years-old worked outside the home for wages. This rate climbed to 67% of mothers by 2019. (Maternal employment rates for Black women were high long before (Goldin, 1997).) To ensure wider career opportunities for women, and to backstop the economic well-being of families, policy makers began to fund a variety of child-care options, from vouchers to support kith and kin caregivers, to formal preschools.
The second force shaping pre-K investment stems from the half-century of research detailing the crucial importance of a child’s initial 5 years of life, including basic health status and early cognitive and social-emotional growth. A wide body of research finds that high-quality pre-K experiences can lift these developmental trajectories for children from families with weaker economic or social resources (Fuller et al., 2017; Heckman, 2010; Joo et al., 2020). Empirical reviews also show that intervening early to enrich a child’s social environment can yield stronger benefits compared to effects resulting from later schooling (McCoy et al., 2017). Research on the sustainability (or fade-out) of pre-K effects (Durkin et al., 2022) continues, along with benefits that middle-class children may or may not accrue from attending quality pre-K.
California began funding a state preschool program (CSPP) in the 1960s soon after the creation of federal Head Start centers. Child-care vouchers followed with state and federal dollars by 1990 (Fuller et al., 1996; Grubb and Lazerson, 1977). 2 The most dramatic policy shift occurred in 2021 when California’s governor began funding free and universal pre-K for all 4-year-olds. When fully implemented, building out from the existing TK program, the state will spend at least another USD$8 billion per year on preschool.
This ambitious expansion requires significant effort by local school districts, which are required to host approximately 250,000 additional children, along with finding an additional 11,000 new teachers (Jackson, 2021). When Mexico made preschool compulsory, the government lacked the financial resources to support institutions that provide training for teachers which made quality a concern, especially for students in rural communities (Lopez, 2011). The California model is similar to the path taken in Oklahoma, where enrollments have grown to more than 80% of 4-year-olds. In turn, community-based pre-K’s that include nonprofit and federal Head Start centers have shifted toward serving 2- and 3-year-olds in Oklahoma. A similar shift occurred in France when preschool became compulsory—there was an increase in preschool enrollment among 3- and 4-year-olds, but voluntary 2-year-old enrollment declined as these children had to find other childcare options (Flemons et al., 2022). Meanwhile, New York City opted to include community nonprofits within their networks of publicly supported pre-K’s. As some countries develop policies to offer universal pre-K, they rely on the private sector to implement their preschool system. For example, as pre-K expands in China because of family demand, the nation relies on a mixed delivery system where private early childhood centers have developed at a faster rate than public ones (Fuller, 2020; Gupta, 2018).
In 2016, roughly 65% of California’s 4-year-olds, numbering about 514,000, were enrolled in a nonprofit center or TK classroom. The remaining share of approximately 180,000 children were cared for by a parent, an individual provider, or in a licensed home-based child-care center. Some 260,000 of the state’s 4-year-olds enrolled in nonprofit centers were eligible for subsidized care or pre-K because their families earned less than 70% of the state median income. About 69% of children eligible for subsidized care attended a center-based program. Subsequently, about 72,000 children not eligible for subsidized care attended pre-K centers that charged parental fees (Manship et al., 2018).
Given this context, we ask whether certain groups of children and families responded to California’s initial creation of TK by enrolling their eligible 4-year-old children, and how the distribution of access may have changed over time. Closely related, was the response of California’s districts to the TK policy uniform or uneven across local areas? That is, do we observe certain regions of the state or types of districts hosting stronger growth in TK enrollments during the program’s initial decade? And how do the demographic features and attributes of school districts help to explain widely varying rates of growth in TK enrollments over time?
Methodology
Our study analyzed data from 2013 to 2020 on children enrolled in TK provided by the California Department of Education (CDE), along with demographic information stemming from the 2015 US Census and American Community Survey, which provides local estimates on a variety of demographic and economic variables. The CDE dataset includes state, county, district, and school-level enrollment information, disaggregated by race, ethnicity, and subgroup (i.e., English learner, migrant family, and socioeconomically disadvantaged status). We drew on CDE counts of TK students reported by local districts on the school census day (the first Wednesday in October) for counting average daily attendance.
To accurately calculate TK enrollment rates (4-year-olds turning 5 between September 2 and December 2), as a proportion of kindergarten enrollments (5-year-olds), we compiled data for children at both grade levels. When we report growth on either the school or district level, total counts include only schools and districts that offer kindergarten. In total, our study includes data from 58 California counties and 934 districts nested within counties.
To identify underlying factors that might shape differing rates of growth in TK enrollment among school districts from 2013 to 2020, we merged data on features of district organizations (e.g., enrollment size) and census data on demographic features of residents within the bounds of districts, matching geographic shape files available in Stata. We drew from the 2015 National Center of Education Statistics (NCES) Common Core of Data (CCD) for a variety of district characteristics that may help explain variation in rates of TK enrollment growth. This included collateral growth in neighboring pre-K programs, such as CSPP, which may compete for 4-year-old children or signal stronger organizational capacity to expand the newer TK initiative.
After reporting descriptive information on TK enrollments by racial and ethnic group, along with how California’s school districts differ in populations served and organizational features, we regressed TK enrollment growth on these possible determinants of a district’s propensity to expand its TK program. Predictors tied to district features include district size, count of children enrolled in a CSPP program operated by the district, geographical location (urban, suburban, town, or rural), percentages of schools that hold charter or magnet school status in the district, and student-teacher ratio (as a proxy for resource levels). For our student composition variables, we included the percentage of students eligible for free-and-reduced-price meals and pupil racial and ethnic composition.
We used multivariate regression to identify the correlation between student populations, organizational features of districts, and parallel pre-K programs operating within districts and TK enrollment growth. We used this strategy because TK enrollment growth may be correlated with these characteristics. Relying on a linear regression design, the initial equation for our analysis was:

where enrollment was the outcome of interest, total enrollment accounted for the average total K-12 enrollment in 2013–14 for each district according to the Common Core of Data, CSPP enrollment accounted for total CSPP enrollment in each district during the 2020–21 school year, location denoted the percentage of schools located in cities, suburbs, towns, or rural areas in a district according to the US census, charter schools represented the percentage of charter schools in a district, resources indicated the student-teacher ratio in a district, alternative schools characterized the percentage of alternative schools in a district, FRPM was the percentage of K-12 students eligible for free-and-reduced-priced meals in a district, demographics was the percentage of K-12 students that were Black, Latinx, Asian, or multiracial in a district, and
Our second and third models included 2013–14 TK enrollment numbers. The second and third models for our analysis were:
where baseline was the number of TK students enrolled in a district during the 2013–14 school year.
Findings
We first explored how enrollment growth in California’s TK program varied by school district and types of children served during the program’s initial decade. These early patterns—operating at the junction of family demand and district capacity to expand—may predict where growth occurs. Then we turned to multivariate estimation of how local demographics and organizational features of school districts may help to account for wide variation in TK growth during the 2013–2020 period.
Differences in TK growth among school districts
First, we split districts into quartiles based on district size, measured by the count of kindergarten students enrolled. Whereas annual TK enrollment grew by 27,000 children aggregating across the largest one-fourth of all California districts from 2013 to 2020, the remaining three-fourths of districts (with complete data) grew by just over 6800 children.
Noting that high TK enrollments in a few large districts artificially inflate statewide means, we report medians for each district quartile. Figure 1 displays the median count of children enrolled in TK classrooms among districts from the 2013–14 to the 2019–20 school year, just prior to the shutdown of schools due to the pandemic. As shown in Figure 1, the largest one-fourth of all districts initially experienced quick growth from 2013–14 to 2014–15, which flattened-out and then rose again between 2016–17 and 2017–18.
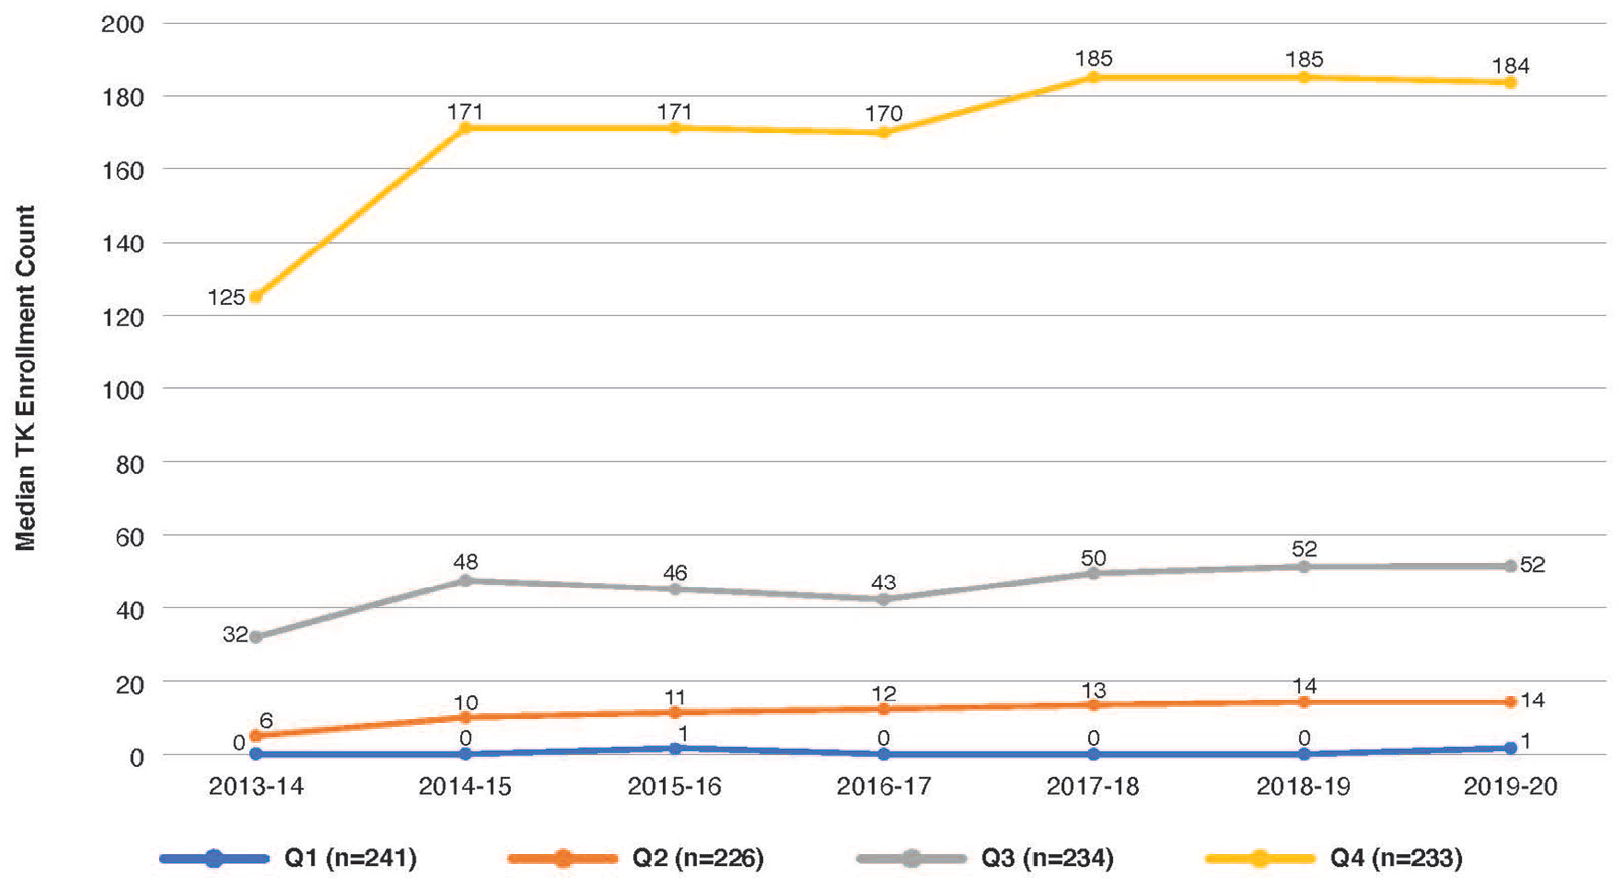
Median count of TK students among districts, split by enrollment quartiles, 2013–2020.
In contrast, the median count of TK students in the smallest one-fourth of districts remained stagnant during the period. The median number of TK students in California’s smallest districts fluctuated between zero and just one student enrolled between 2013–14 and 2019–20. Figure 1 shows in raw terms that enrollment counts and growth have depended upon overall district size.
Disparities in enrollment growth by location
We found that TK enrollment counts remained low in the Bay Area, the state’s far northern counties, and much of the Central Valley during the 2019–20 school year. On the other hand, TK enrollment counts were relatively high during the 2019–20 school year in Los Angeles, Orange, and San Diego counties, along with districts in the East Bay area. This pattern suggests that larger districts benefitted from stronger organizational capacity to equip classrooms for young children and find new TK teachers, necessary to serve additional preschoolers.
Figure 2 reports on TK enrollments as a percentage of kindergarten enrollments, which takes into account a district’s overall enrollment size. Darker red dots indicate districts with low TK enrollment rates, equaling between zero and 10% of kindergarten enrollment counts. Districts indicated by light yellow dots are those with TK enrollments that equal 25% of kindergarten enrollments or higher. During the first decade of TK, children with birthdays from September through December were allowed to enroll in the program. This means, if a district enrolled all eligible 4-year-olds, their TK enrollment rate would equal 25% of kindergarten enrollment.
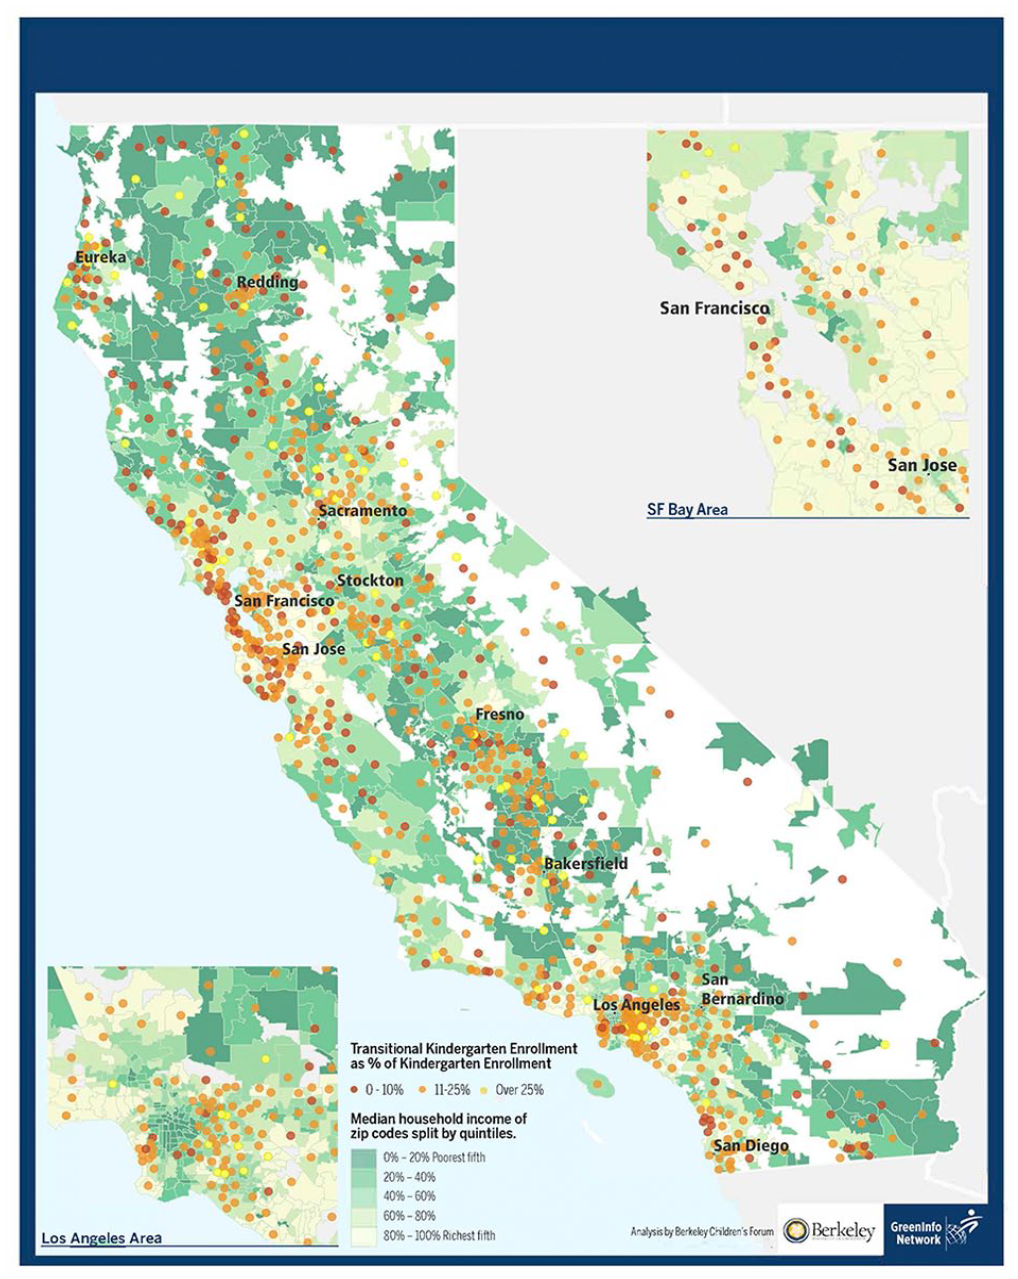
TK enrollments as percent of K enrollment by school district, 2019–20.
Figure 2 illustrates wide variability in district capacity to expand TK enrollments since the program’s inception, although some clear patterns do emerge. The San Francisco Bay Area and far northern districts display lower enrollment levels, along with several districts in southern California and those scattered across the Central Valley, the state’s large agricultural region. Further disaggregating median TK enrollments as a percentage of kindergarten enrollments, we found that other than the smallest one-fourth of districts (lowest quartile), districts across California follow a similar trend from 2013 to 2020. While larger districts can more easily enroll TK children relative to the capacity of, and perhaps family demand felt by, smaller districts, medium-size districts enrolled comparable percentages of TK children (available from the authors).
Growth disparities among counties
Beyond variation in enrollment among districts, TK enrollment levels have varied widely among the state’s counties as well. Again reporting TK enrollment levels as a percentage of kindergarten enrollment, we found that TK enrollments hosted by districts within Los Angeles County equaled 27% of total kindergarten enrollment in 2019–20. This stems largely from assertive efforts by the LA Unified School District to grow their TK program.
Yet, the rural-urban divide is not the only driver of variable enrollment levels. In contrast to Los Angeles, urban San Francisco County enrolls just nine kids in TK for every 100 kindergarten students. This is partly due to a large CSPP program in San Francisco, the state’s decades-old effort that still serves 3- and 4-year-old children. The largely urban Sacramento County similarly enrolls 13 TK children per 100 kindergarten students, whereas nearby and rural Placer County hosts 27 TK children for every 100. These differences may also be due to the presence of other subsidized and nonprofit preschools. Much remains to be learned about how organizational capacity and commitment to expanding pre-K varies among counties and school districts.
Racial and ethnic enrollment disparities among counties
TK enrollment levels vary by the racial and ethnic backgrounds of children as well among the state’s counties. In Figure 3, we report TK enrollments as a percentage of 4-year-old residents living in Alameda, Los Angeles, Merced, Sacramento, San Bernardino, or San Diego. This offers a second gauge of access, rather than reporting TK enrollment as a percentage of kindergarten enrollment. Of all 4-year-old Asian-heritage children in Alameda County, for example, 22% enrolled in a TK program in 2019–20. In Los Angeles and Merced counties, Latinx families were more likely to enroll their children in TK, 27% and 25%, respectively.
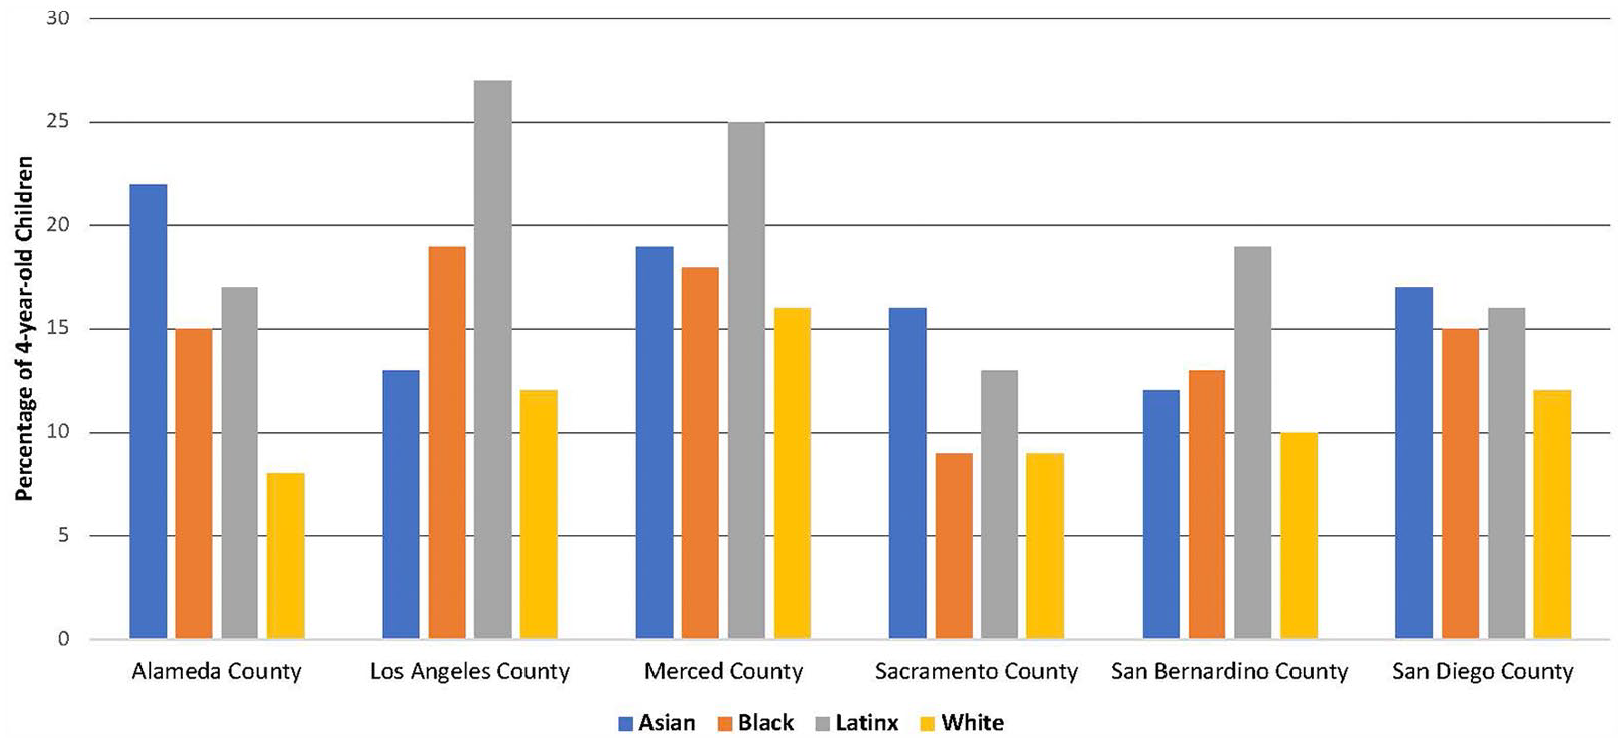
Percentage of all 4-year-old children enrolled in TK for illustrative counties, 2019–20.
Across the six counties shown in Figure 3, white families appear less likely to enroll their children in TK compared to peers of other racial and ethnic heritage. In Alameda, Merced, and Sacramento counties, Black families were less likely than Latinx or Asian families to enroll their 4-year-olds in TK. Yet, in Los Angeles and San Bernardino counties, Asian families were less likely than Black or Latinx families to enroll their 4-year-olds in TK. If families from various racial and ethnic backgrounds were adopting TK at a similar rate, again, we would expect all groups to enroll about 25% of their 4-year-olds given age eligibility during this period.
Explaining differing growth rates among districts
Next, we turn to explaining variation in TK enrollment growth observed among school districts. We examined the possible influence of demographic features of district populations, along with organizational features and parallel pre-K programs operating within districts. Several factors may shape enrollment growth. These include levels of parental demand tied to maternal employment rates, school-finance incentives, and the strength of federal Head Start, CSPP, and related community-based pre-K programs. Our descriptive findings suggest that district size may correspond to the organizational capacity to expand local TK programs. We assembled data for subset of these possible explanatory factors.
Correlations between explanatory factors and baseline TK enrollments
We began by examining associations between enrollment levels in 2013–14 (baseline school year) with demographic and organizational features of school districts (n = 926). At baseline TK enrollments ranged higher in districts with larger K-12 enrollment overall (β = 22.62, p < 0.001), consistent with our descriptive findings. TK enrollments were lower at baseline in districts enrolling larger shares of Asian-American students (β = −107.9, p < 0.05). These significant factors explained about one-sixth of the variance in enrollment levels among districts. In turn, we must conclude that unmeasured factors operating within districts further affected local capacity and interest in growing-out TK (Table 1).
Factors explaining growth in TK enrollments among school districts, 2013–14 to 2019–20.
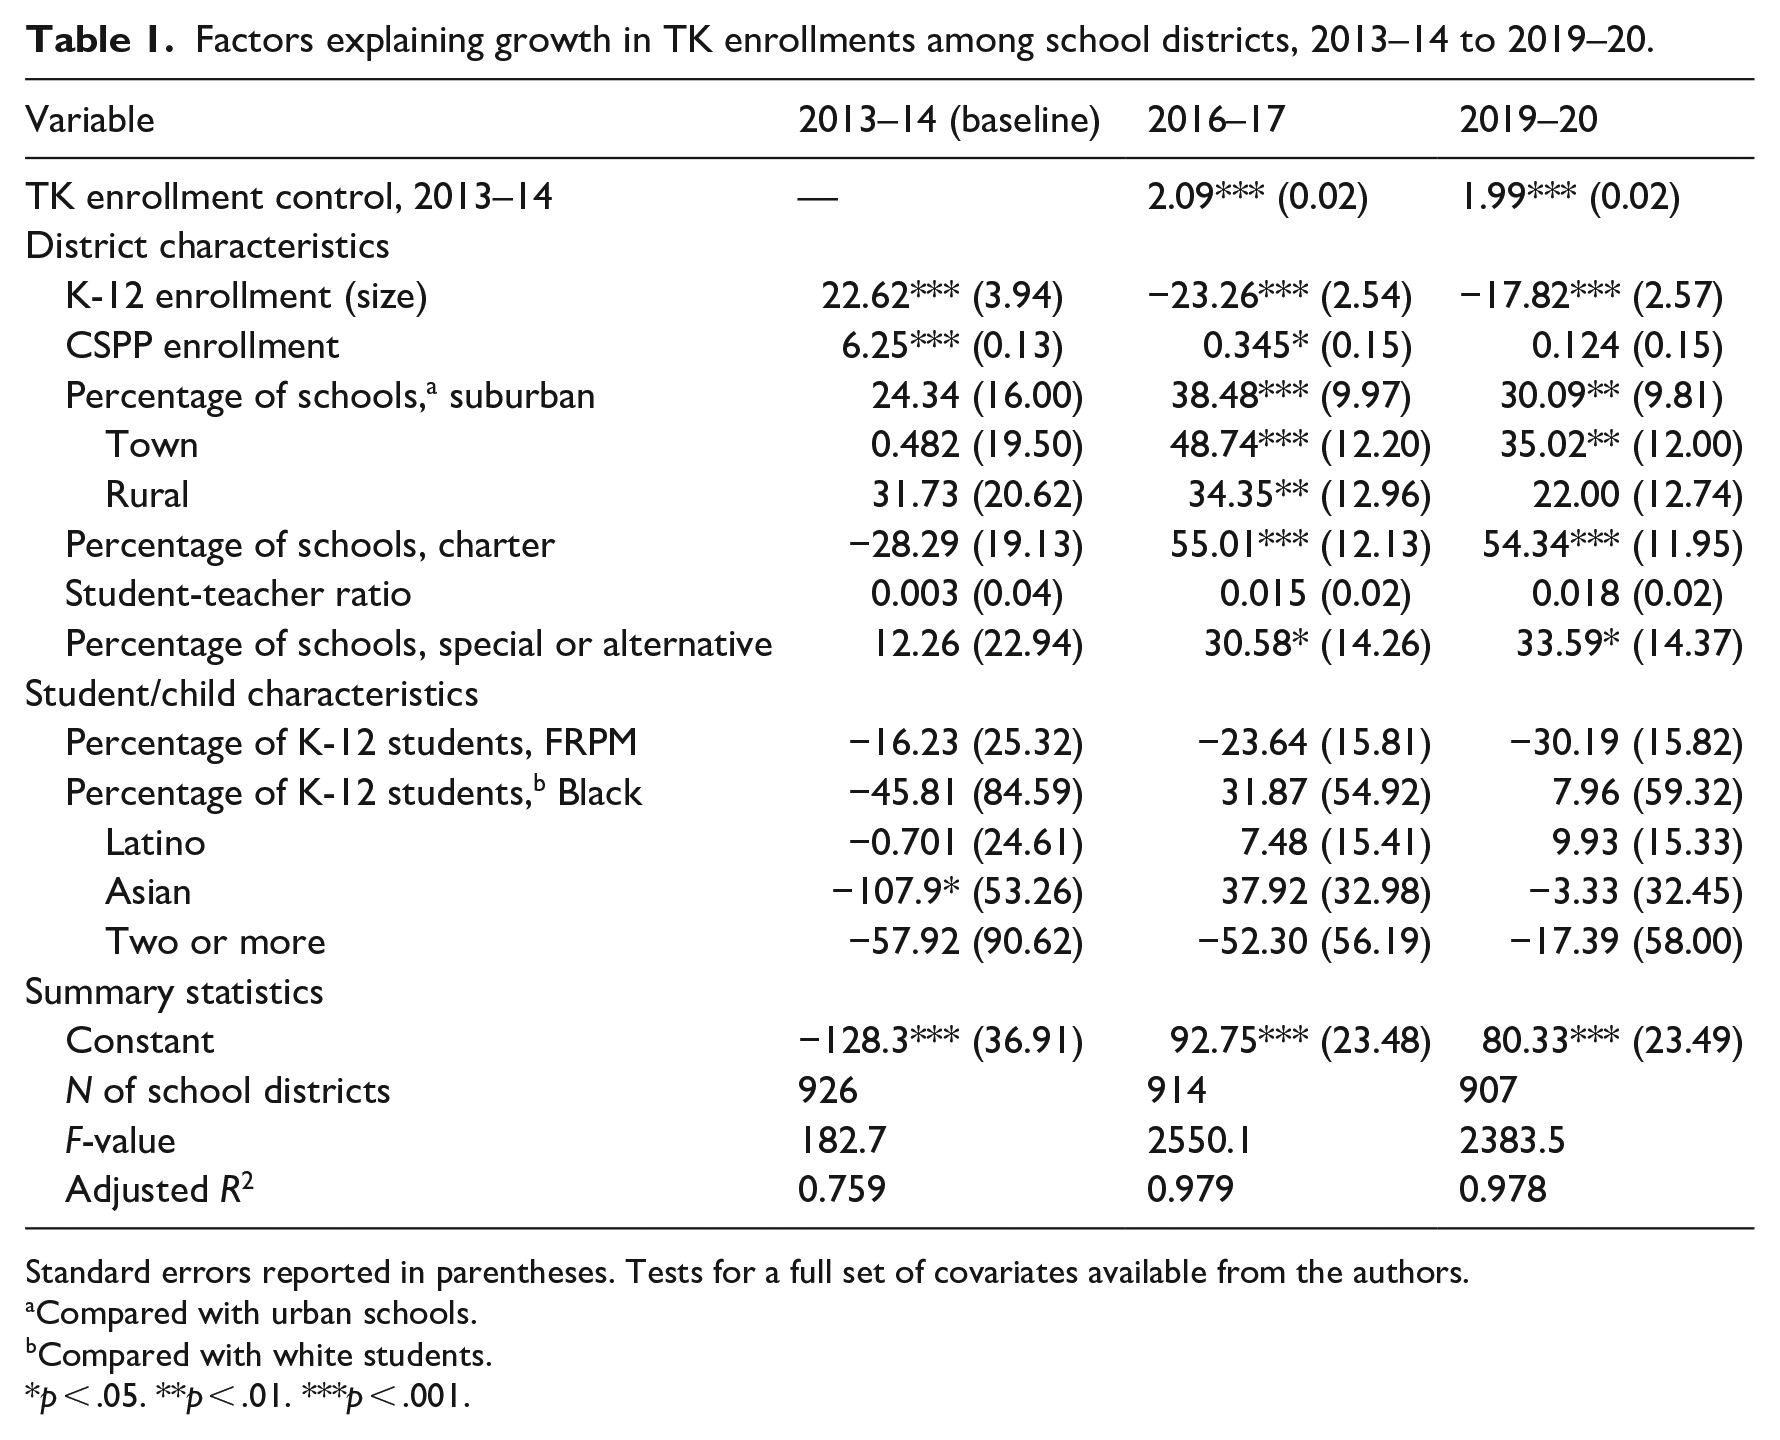
Standard errors reported in parentheses. Tests for a full set of covariates available from the authors.
Compared with urban schools.
Compared with white students.
p < .05. **p < .01. ***p < .001.
Factors explaining growth in TK enrollments
A wider range of factors predict growth in TK beginning in 2016–17. Districts with schools located in suburbs (β = 38.38, p < 0.001), towns (β = 48.74, p < 0.001), and rural areas (β = 34.35, p < 0.05) expanded TK enrollments more strongly compared to districts dominated by urban schools. Districts with more charter schools (β = 55.01, p < 0.001) also expanded their TK enrollments at a stronger pace. These trends follow the state legislature’s decision to liberalize child eligibility by lengthening the birth-month window during which children turned 5 years of age. At the same time, recall that growth in TK enrollments slowed statewide overall from 2017–18 forward.
To examine the impact of our explanatory variables, we regressed raw TK enrollments in 2019–20, controlling for baseline enrollment levels. This allowed us to estimate degrees of growth from the possible predictors run at baseline. We found that TK growth occurred largely in suburban districts from 2016–17 forward (β = 30.09, p < 0.01), and somewhat in towns across the state (β = 35.02, p < 0.01). TK enrollments grew more in districts hosting larger shares of charter schools (as a percentage of all district schools; β = 54.34, p < 0.001). This may be due to rising TK counts in charters themselves, or that regular elementary schools expanded TK to better compete with charter schools for new students.
We find positive relationships between the count of children enrolled in CSPP in the baseline year (2013–14) and growth in TK enrollments (β = 6.25; p < 0.001). That is, we did not find that CSPP enrollments “crowd out” incremental gains in TK enrollment, at least not during this period. Perhaps districts already operating robust CSPP programs held greater capacity to now grow-out their TK program. Note that these regression models are over-determined, given the strong correlation between K-12 and TK enrollment counts. To adjust for this, we also ran growth estimates using TK enrollment as a percentage of kindergarten enrollment, yielding similar but somewhat less robust results (available from the authors).
Lessons learned, global policy implications
How do these results—tracking growth in TK enrollments and early determinants—inform future expansion of similar pre-K initiatives within and around the globe?
Overall, we find that demographic conditions in local areas and the organizational capacity of local education agencies shape which children benefit from universal preschool programs during early periods of implementation. These findings spotlight several challenges facing local school authorities and California’s state education department as they expanded access to TK. First, large and medium-sized districts that have led initial expansion of TK appear best positioned to further widen access over time. Small districts displayed less interest or capacity to grow TK classrooms. This may exacerbate disparities in the geographical distribution of TK opportunities. Geography corresponds to poverty levels in California, including the agricultural Central Valley and rural expanses of the state.
We have observed this pattern in nations, such as China, where government normatively encourages pre-K enrollment, but growth in better-off urban areas far outpaces enrollment gains in rural areas (Fuller, 2020). This disparate pattern of pre-K expansion occurs even as government leaders argue that pre-K will narrow disparities in children’s early growth. This appears to result from uneven levels of family demand and differing capacity of local governments or NGOs to build additional pre-K supply.
Second, the evolving composition of TK students signals possible inequities in which families may be served by the planned expansion. TK appears to be attracting large shares of Latinx children and families. Yet, declining participation of English learners and relatively lower shares of Black, white, and Asian children raise a variety of questions. Do Black parents prefer other forms of center-based care, including CSPP or Head Start programs? Are white families accessing care in the (tuition-charging) pre-K market, or can these parents afford to stay at home during their child’s preschool years? Additional qualitative research, both in California and across the world, is needed to answer these questions and understand how parents are deciding which pre-K program is appropriate for their children.
Our analysis also arrives at a variety of unanswered questions. Currently, California does not have the capacity to trace the flow of young children across differing child-care and pre-K programs. Nor can CDE track the movement of pre-K teachers across programs or into TK positions. We do not know how 4-year-old children not attending TK sort into other forms of child care or pre-K.
Government is attempting to remedy this situation by collecting more data in the case of California. Yet, expansion plans outpace analytic capacity to understand which children and families are being served, identify regional variation across California, and weigh such indicators against (as yet undefined) benchmarks of distributive equity. Without thick information on which children are being served by publicly funded TK in relation to other pre-K providers, policy makers will have difficulty knowing whether they are narrowing disparities in children’s access to preschool. Additionally, there is still much to learn about the quality of TK classrooms and how quality levels may differ among local communities. Lopez (2011) discusses how this is also a concern as Mexico expands pre-K access.
From the current data provided by the state, we know little about how families that enroll in TK are combining other forms of care after school and during breaks. Until school district leaders address this “wrap-around” element, they may not attract working parents to their TK classrooms. The expansion and vitality of TK will likely depend upon partnerships with nonprofit pre-K’s that have long served this age group. But we know little about the extent to which districts will build from cooperative arrangements to ensure full-day care for working parents.
Many nations appear eager to widen access to quality preschool programs. Yet, these centrally shaped policies and plans depend upon the local capacity of schools or nonprofit agencies to both expand and distribute access fairly across racial, ethnic, and social classes. The agility and capacity of these local organizations must be taken into account, along with the availability of other child care and pre-K options. Family demand for access may be strong and continue to grow, but the interplay between state-led financing and local agencies will determine which children benefit and the extent to which disparities in early learning narrow over time.