
Abstract
Simulated and real tri- and tetrachromatic light-emitting-diode (LED) clusters were optimized for luminous efficacy of radiation (LER) and the memory colour quality metric developed by the authors. The simulated clusters showed no significant differences in achievable colour quality and LER between the different cluster types investigated. The real clusters (composed of commercially available LEDs) showed substantial differences in achievable colour quality and LER between the different cluster types investigated. The real clusters also exhibited a large drop in LER and memory colour quality compared to the simulated clusters due to the limited range of available peak wavelengths and spectral halfwidths. A real tetrachromatic LED lamp, constructed with commercial red, green, blue and warm white LEDs, was optimized for LER and colour quality. In a psychophysical experiment, several aspects of the colour quality of the LED lamp (optimized for 2700 K) and an incandescent lamp were assessed by 18 observers. The visual appreciation (in terms of attractiveness, preference, and memory colour similarity) of the LED lamp was rated significantly higher than the incandescent lamp.
1. Introduction
Over the past few years, the tremendous progress in solid-state lighting technology has increased the interest in solid-state lighting as an alternative to more conventional light sources in general lighting applications. This interest has been spurred by several factors, which included, but are not limited to, the increased efficacy and hence the potential of substantial energy savings and environmental benefits, the compactness of the light source, the lifetime and the tunability of the spectrum, e.g. to create and/or enhance the mood of a room.1–4
Next to the above, another aspect of lighting and important to many end-users, such as lighting designers, architects, shop and retail owners, is colour quality. Unfortunately, colour quality – often assumed to be synonymous with colour fidelity – is usually assessed with the CIE Colour Rendering Index Ra. However, this metric does not always correspond well with the actual perceived colour quality of a white light source.5–10 Reasons might be several, but one of the main reasons is that colour quality is, for many users, more than just fidelity to a CIE reference illuminant. Aspects such as preference, attractiveness, colour discrimination, and colour harmony should be taken into account. 11 Another closely related reason is that a CIE reference illuminant (daylight phase/Planckian radiator of equal correlated colour temperature (CCT) as the test source) need not be the ‘optimal’ light source. At the time of writing, CIE Technical Committee TC1-69 is investigating new ways of evaluating the colour quality of white light sources. Although it is generally agreed that colour rendering should be calculated based on the strict colour difference between a set of coloured samples under a test source and a CIE reference illuminant (colour fidelity), no consensus has been reached with regards to other aspects of colour quality. However, it should be noted that a strict colour difference-based metric – using CIE reference illuminants – will not solve the problem of solid-state sources for these other aspects of colour quality, as some light sources (e.g. Nd Incandescent12,13 and several light-emitting-diode (LED) sources14,15) are known to score visually higher – for certain aspects of colour quality (like preference, attractiveness, naturalness, harmony, etc.) – than their CIE reference illuminant.
Because many users are more interested in how good objects look under a given light source than in the colour difference relative to a CIE reference illuminant, a metric that takes this directly into account would be more suited to evaluate the overall colour quality of a light source. Such a metric is the colour quality metric based on memory colours developed by the authors.10,15,16 This metric has been found to correlate well with the visual appreciation – in terms of attractiveness and preference – of light sources. 10
This paper summarizes some of the main results of a study on the optimization of LED clusters based on the memory colour quality metric 17 and extends it by describing how this metric was used to optimize the spectrum of a LED module composed of real LEDs. The optimized LED module (for 2700 K) was physically constructed and its colour quality, as well as that of an incandescent lamp, was tested in psychophysical rating experiment with 18 observers.
2. Method
2.1. Memory colour quality metric
2.1.1. Principle
The basic idea of the memory colour quality metric is simple and intuitive: The more similar a light source renders the colour appearance of objects to what is expected, i.e. its memory colour, the better will be the perceived colour quality of the light source.
2.1.2. Memory colours and similarity distributions
The similarity with memory colours is determined based on the visual rating data obtained by the authors in a previous study.
16
In those experiments, the colour appearance ratings of a set of nine familiar real objects, with colours distributed around the hue circle, were investigated. The nine familiar objects chosen were a green apple, a banana, an orange, dried lavender, a smurf figurine, strawberry yoghurt, a sliced cucumber, a cauliflower and Caucasian skin. The set was later extended with a neutral grey sphere. In the experiments, the objects were presented in approximately one hundred different colours to a group of observers who were asked to rate the colour appearance of the presented object with respect to what they thought the object looked like in reality. The colour of the objects was changed by placing them in a specially constructed illumination box that masked all clues to the colour of the illumination. Thereby, the illusion was created that the objects themselves changed colour. A self-luminous white back panel was used to maintain a constant adaptation state. For each object, the pooled observer ratings (>1000) were modelled by a modified bivariate Gaussian distribution in IPT colour space.
18
An example of such a distribution is shown in Figure 1. These similarity distributions, describing the similarity between any apparent object colour and its memory colour (centre of distribution), are the basis of the memory colour quality metric.
Similarity function in IPT colour space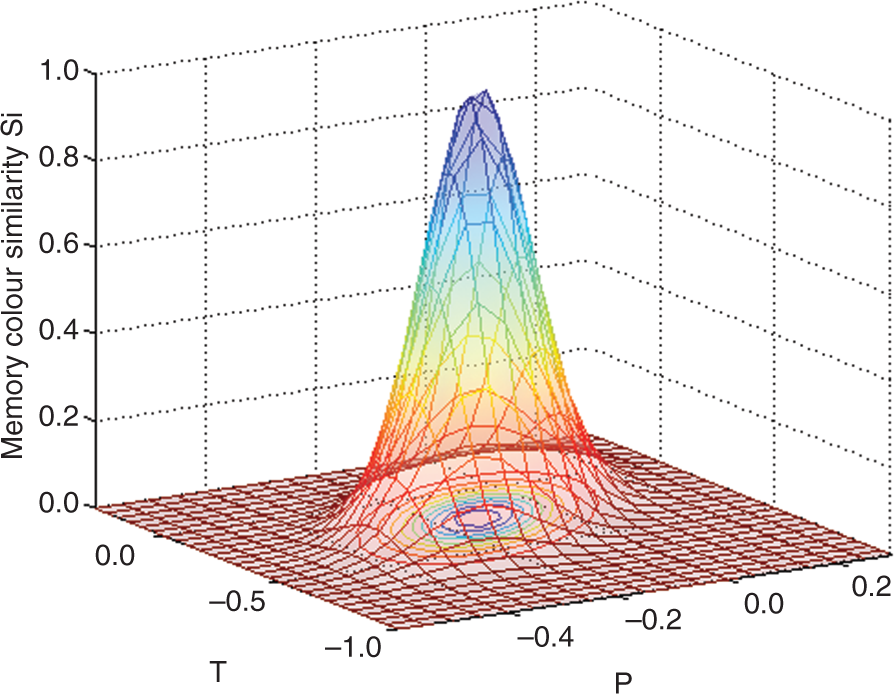
2.1.3. Practical calculation scheme
The general degree of similarity, a measure for the colour quality of a light source, is calculated as follows. 10 First, for each familiar object, the apparent object chromaticity Xi = (Pi,Ti), under the test light source is calculated in IPT colour space using the spectral reflectance of the object and the CIE 1964 standard observer. Because the white point of IPT colour space is illuminant D65, all tristimulus values under the test source should be transformed to their corresponding colours under D65 using the CAT02 chromatic adaptation transform prior to the calculation of the IPT coordinates. For a more accurate prediction, the degree of adaptation should be calculated from the luminance of the adaptation field. If this is unknown, a degree of adaptation of 0.90 gives good general results.
Second, these apparent chromaticities Xi are inputted into the corresponding similarity distribution Si(X), resulting in a set of special colour quality indicators describing the degree of similarity with the object’s memory colour:
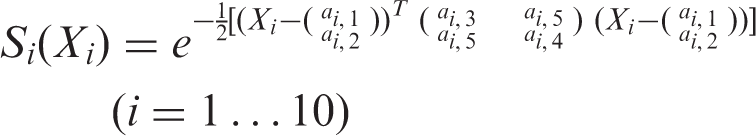
The parameters ai,1–5 describe the shape, size, orientation and location of the similarity distribution Si (X). Then, the general degree of memory colour similarity Sa is obtained by taking the geometric mean of the 10 individual Si values:
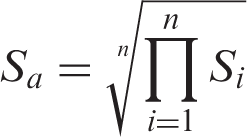
The geometric mean was chosen because it is less susceptible to outliers and more suitable for values that are exponential in nature, such as the function values of the similarity distribution. Finally, to create a scale range that is more understandable to people familiar with the CIE colour rendering index, the specific and general colour quality indicators, Si and Sa, are rescaled to specific and general colour quality indices, Rm,i and Rm, with a sigmoid-like function:
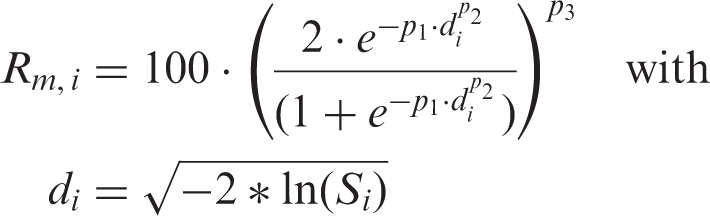
A sigmoid-type function was chosen as this better reflects the human response – which tends to saturate at the extremes of a scale – than the typical linear rescaling used to rescale the colour differences in the CIE colour rendering index, a finding experimentally corroborated for colour fidelity by Bodrogi et al. 19 The rescaling parameters p1–p3 (respectively, 1.1733, 8.4261 and 2.4153) were selected such that light sources with Sa values below 0.5 have Rm values of zero and the CIE illuminants F4 and D65, have values of 50 and 90, respectively. A light source with a score of 100 would perfectly render all 10 familiar object colours as their associated memory colours.
2.1.4. Correlation with perceived colour quality
Although at present the memory colour quality metric is limited to only 10 familiar objects, a correlation analysis of the visual appreciation (preference/attractiveness) of light sources obtained in three different studies showed that even with this limited number of test samples it worked very well and significantly better than the CIE colour rendering index and the NIST Colour Quality Scale (CQSa). 10
These results were further confirmed by extending the correlation analysis to a total of 7 studies and by comparing it with 12 other colour quality metrics. 20 The memory colour quality metric had a high correlation with the perceived colour quality (preference/attractiveness) of the light sources in all these studies and was found to be statistically better than all the other tested metrics: CIE Ra, 21 CAM02UCS-CRI_35samples, 22 CQSa, 23 CQSf, 23 CQSp, 23 RCRI, 24 FCI, 25 GAI, 26 average of GAI and CIE Ra, CSA, 27 memory colour quality metric,10,16 Judd Flattery Rf 28 and Thornton CPI. 29 It should be noted, however, that none of the strict colour difference-based metrics (CIE Ra, CAM02UCS_CRI, CQSf and RCRI) were ever intended to correlate well with preference or attractiveness. More information, as well as the results for the naturalness aspect of colour quality, are reported in Smet et al. 20
2.2. Multi-objective optimization of LED cluster spectra
2.2.1. Optimization objectives
In this study, tri- and tetrachromatic LED clusters were optimized for luminous efficacy of radiation (LER) and for colour quality as assessed by the memory colour quality metric. To ensure a white appearance of the optimized spectrum, Δu′v′ was limited to 5.4 e−3. As the restriction on Δu′v′, the luminous efficacy and the memory colour quality might be in trade-off, this multi-objective problem was evaluated by calculating the Pareto optimal solutions. A Pareto optimal solution is optimal in that no further improvement can be made for one objective without degrading at least one of the other objectives.
2.2.2. Genetic algorithms
In this paper, the NSGA-II genetic algorithm (GA) 30 was used to generate the Pareto optimal front. A GA is based on the evolutionary principle of survival of the fittest and encodes the decision variables in a set of genes (the chromosome). At the start, it randomly generates a population of individuals each with its own chromosome. Each individual represents a possible solution to the optimization problem. The population is then allowed to evolve into new generations based on the ‘fitness’ of the individuals as measured by the objective function. After a large enough number of generations, an estimate of a global solution is obtained. In the case of a multi-objective optimization problem, the GA is modified to converge not on a single solution, but on an estimate of the Pareto optimal front.
2.2.3. Simulated LED clusters
Although the spectral power distribution of a LED can be modelled based on physical principles, 31 such models require many parameters (i.e. decision variables), making them less suited for optimization of LED clusters. The spectral power distribution of a single-coloured LED was therefore modelled using the equation proposed by Ohno 32 while phosphor white LEDs (with a pump and two phosphors) were modelled by a set of equations proposed by Smet et al. 17 As single-coloured LEDs depend only on the flux, the peak wavelength and the full-width-half-maximum (FWHM), they could be modelled by only three parameters. The phosphor-type LEDs are a bit more complex and require a total of nine parameters (flux of total LED, peak and FWHM of pump, peaks and FWHMs of the two phosphors and relative contributions of the phosphors). A LED cluster composed of n single-coloured LEDs and m phosphor-type LEDs could therefore be simulated using (3 n + 9 m) parameters.
The optimization was limited to tri-and tetrachromatic LED clusters composed of all single-coloured LEDs (respectively, R/G/B and R/G/B/Y-A) or single-coloured LEDs and one phosphor type LED (respectively, R/B/phLED and R/G/B/phLED). The number of decision variables was therefore reduced to 9 and 12 for clusters composed solely of single-coloured LEDs, and to 12 and 18 for clusters containing one phosphor-type LED. This relatively low number of decision variables made it possible to simulate a large population (10 000) evolving over a large number of generations (250), thereby increasing the accuracy of the estimate of the Pareto optimal front.
2.2.4. Real LED clusters
As an aid in selecting the most suitable (for high colour quality) commercially available LEDs, the subset of Pareto optimal solutions with a memory colour quality higher than that of any of the CIE reference illuminants was investigated to identify the most commonly found LED peak wavelengths and spectral halfwidths. The measured spectral radiance of the selected commercially available LEDs was then incorporated into the GA, leaving only the flux of each of the LEDs as a free parameter in the optimization routine.
To assess the influence of binning, two RGB LED clusters were composed with the red and green LEDs having nearly identical peak wavelengths, whereas the blue LEDs had peak wavelengths on the opposite sides of the bin mentioned in the datasheet of the manufacturer.
Finally, a real LED lamp optimized for 2700 K was constructed in order to visually test its colour quality in a psychophysical experiment.
3. Results
3.1. Simulated LED clusters
Only the most general results are reported here as the simulated LED clusters only served as an aid to select the most suitable commercially available LEDs for each cluster type to construct a real LED lamp. A more thorough analysis of the simulated LED clusters is given by Smet et al. 17
The results of the GA optimizations, the LER, Rm Pareto optimal fronts, are illustrated in Figure 2. To illustrate how these solutions compare with common CIE reference illuminants, several Planckian radiators (2700 K, 3000 K, 3500 K, 4000 K and 4500 K) and several daylight phases (5000 K, 5500 K, 6000 K, 6500 K, 7000 K and 8000 K) were also plotted.
Pareto optimal fronts for the four types of LED clusters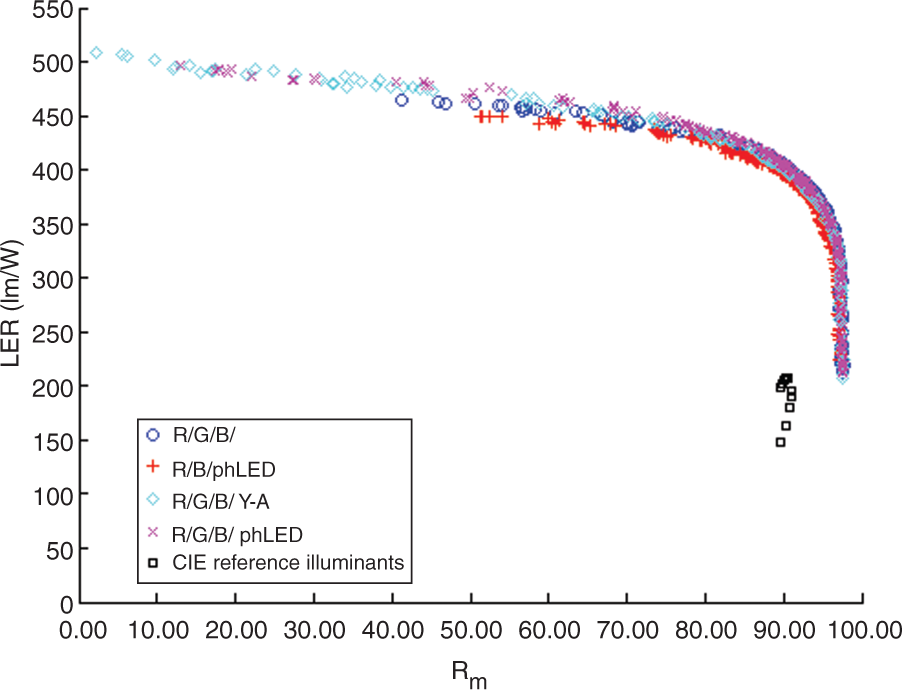
As it is clear from Figure 2, no or only insignificant differences were observed between the four types of simulated LED clusters as far as solutions with ‘good colour quality’ (Rm values larger than those of the CIE illuminants) are concerned. In theory, a LED lamp with good colour quality could therefore be constructed from any type of cluster given that any desired peak wavelength and spectral width would be commercially available. To test the difference between the optimization of a simulated LED cluster and a real LED cluster, several commercial LEDs were purchased. As an aid in the selection of the desired peak wavelengths, the subset of Pareto optimal solutions, with a memory colour quality larger than the CIE illuminants, was investigated. It was found that many of the most commonly occurring peak wavelengths were located close to the peak of the CIE 1924 photopic luminous efficiency function used in the calculation of the LER or to one of Thornton’s prime colours (450 nm, 533 nm and 611 nm 33 ).
3.2. Real LED clusters
Based on the results of the simulated LED clusters, several red, green, blue and warm white LEDs were purchased. As no significant differences were found between the four simulated cluster types, the optimization was performed again, but this time with the measured spectral radiance as input and the LED fluxes as decision parameters. As is clear from Figure 3, this reduction in the number of free parameters had a substantial impact on the achievable LER and colour quality for each of the four types of clusters.
Pareto optimal fronts of real LED clusters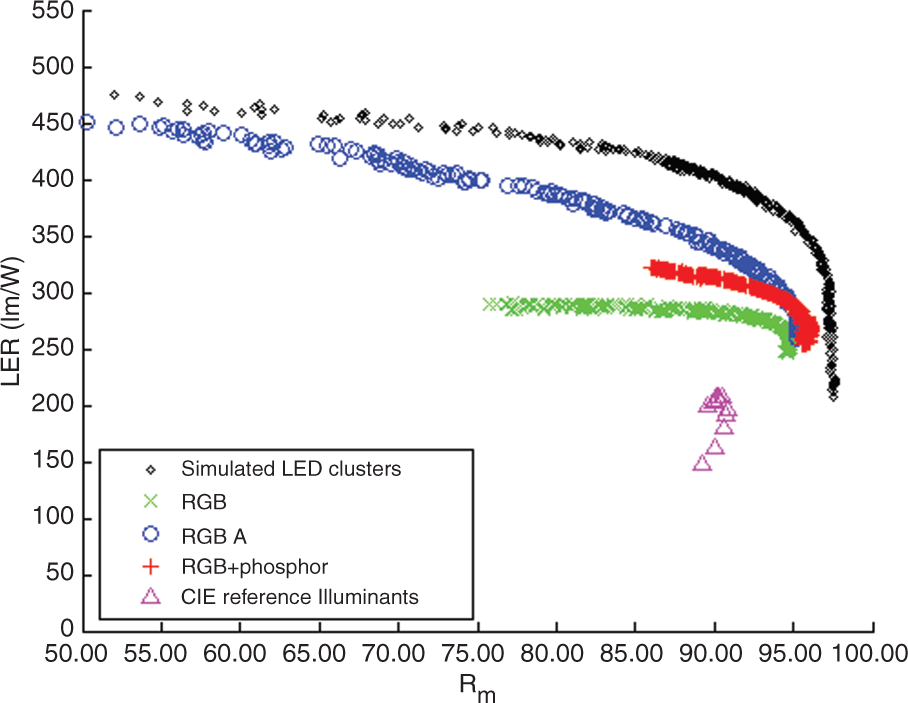
The effect of binning was also found to be potentially large, as seen from Figure 4. In the RGB and RGBA clusters, the red and green LEDs had almost identical peak wavelengths and spectral halfwidths. Both blue LEDs came from the same bin, but had a difference in peak wavelength of 17 nm, resulting in a substantial drop in achievable colour quality.
Effect of binning on RGB and RGBA clusters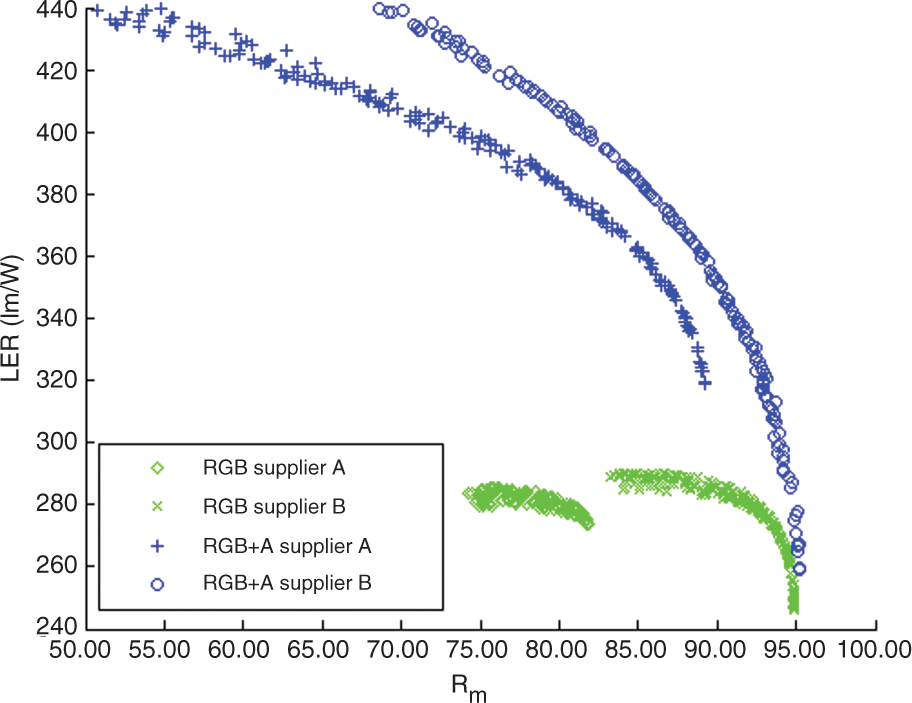
4. Real LED lamp
4.1. Construction
As it is clear from Figure 3, the tetrachromatic cluster composed of a red, green, blue and warm white LEDs had the highest potential for good colour quality. This type of cluster, along with its corresponding commercial LEDs, was selected to construct a real LED lamp.
The real LED lamp was composed of 22 high power LEDs (4 red, 2 green, 2 blue and 14 warm white). The intensity of the LEDs was pulsed-width-modulation controlled using a three-channel chromoflex controller. Because only three channels were available, the warm white LEDs were kept at maximum intensity with a forward current of 690 mA, while the RGB LEDs were allowed to vary based on the results of the optimization routine. The LEDs were mounted on an actively cooled heat sink. A diffuser plate was placed in front of the LEDs to avoid coloured shadows. The CCT and illuminance produced by the optimized LED lamp were 2700 K and 215 lx at 80 cm, respectively.
4.2. Psychophysical test of LED lamp
Mean/median values of the observer ratings. The associated (standard deviation/inter-quartile range (SD/IQR)) are also given.
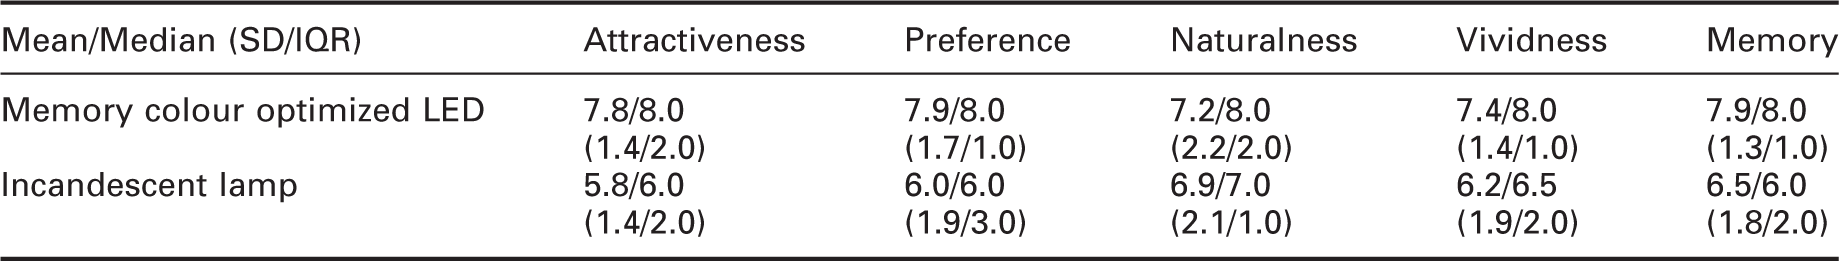
From Table 1, it is clear that the LED lamp outperformed the incandescent lamp for all aspects of colour quality investigated. Only for naturalness were the differences small. The statistical significances of these differences were examined using the Wilcoxon signed rank test. These tests showed that the colour quality of the LED lamp was statistically better (p < 0.05) than the incandescent lamp for attractiveness, preference and memory similarity. For naturalness and vividness, no statistically significant differences were found.
These results confirmed the inability of a colour difference-based metric, i.e. a fidelity metric, to correctly evaluate the colour quality of a white light source in terms of attractiveness, preference and memory similarity.
5. Conclusions
Tri- and tetrachromatic LED clusters, exclusively composed of single-coloured clusters or clusters wherein one singled-coloured LED was exchanged for a phosphor-type LED, were modelled and optimized for the LER and the memory colour quality metric. The Pareto optimal fronts obtained with the NSGA-II GA suggested that, in theory, a LED cluster lamp with high colour quality could be constructed from any of the four cluster types investigated. The subset of Pareto optimal solutions, with Rm values larger than those of the CIE illuminants, revealed that those peak wavelengths resulting in good colour quality were located close to Thornton’s prime colours or the peak wavelength of the CIE 1924 photopic luminous efficiency function. Based on the results of the simulated LED clusters, a LED cluster composed of commercially available LEDs was optimized. Compared to the simulated clusters, a substantial drop in achievable LER and colour quality was observed. This was due to the limited range of available peak wavelengths and spectral halfwidths for commercially available LEDs. The most suitable LEDs available to the authors were used to construct a real LED cluster lamp. In a psychophysical experiment, the good colour quality, as predicted by the colour quality metric, was visually confirmed by a group of 18 observers. The lamp was found to have a statistically higher colour quality, in terms of attractiveness, preference and memory colour similarity, than an incandescent lamp of the same CCT (2700 K). The memory colour quality metric is therefore not only able to predict the perceived colour quality of existing light sources, but can also be successfully used to design new light sources with good perceived colour quality.