
Abstract
This study proposes a supplementary lighting and regulatory scheme for application in semi-closed crop production systems. This supplementary lighting control module is primarily based on fuzzy logic inference and an expert database. Under the hypothesis that the temperature and humidity conditions are consistent, the system will implement supplementary lighting of different wavelengths according to current solar spectral distribution conditions and plant growth patterns. Simulations demonstrate that under the condition of full sunlight, the system still provides supplementary light to compensate for insufficient light spectrum. Compared to traditional plant lamps that need to be lit for long periods of time, this system can randomly adjust light spectrum and intensity to achieve energy savings, and is therefore suitable for application in lighting control systems in future greenhouses.
1. Introduction
In response to global climate change and environmental pollution, many scholars and experts have begun to adopt necessary measures to protect the environment, save resources, and develop techniques to ensure food safety. In recent years, due to advances in energy-saving techniques, auto-control techniques, robotic arm techniques, light emitting diode (LED) manufacturing techniques, material recycling and reuse techniques, and internet communication techniques, the development and establishment of an automated vegetable and fruit production factory is no longer an impractical dream. During the establishment of a given factory, the environmental factors that affect crop growth are rather significant.1,2 Among these environmental factors, light source selection and control is one of the indispensible aspects of the production system. As demonstrated by the literature, it is already well known that the light cycle and spectrum distribution are of considerable importance to plant photosynthesis and morphological growth. 3 In 1937 and 1956, scholars found that red light (640 nm–690 nm) would boost the growth of lettuce seed sprouts, while far-red light (710 nm–750 nm) would suppress it.4,5 In fact, the ratio of light density between the two wavelength bands in terms of red light and far-red light has a great impact on seedlings. 6 In addition, related studies have specified how various red and blue LED combinations have different effects on plant growth and morphological growth7–17 and that red light stimulates the phytochromes in plant cells.
The interchange between the presence of red light (bright) and the absence of red light (dark) makes phytochromes affect plants by causing the stems and leaves of the plants to grow. 18 Blue light sources (460 nm–470 nm) are also crucial to plants. The growth of plants, the absorption of nutrients, and the growth of sturdy stems are all affected by blue light. In addition, the phototropism normally observed in plants is also caused by blue light. Blue light sources also play an important role in plant differentiation and stomatal regulation. If blue light is insufficient while red light is oversupplied (Blue/Red = 10%), a plant’s stem will grow excessively and cause the leaves to become yellow. 3 During a plant’s growth process, only lights of certain wavelengths are needed and not all wavelengths of light are effective. The wavelength, illumination conditions, and duration of light sources affect the size of medium-sized stems and leaves during the growth process.19–21 Previous studies have shown that light in the green wavelength band affects the formation of carotene and also intensifies the metabolism of carbohydrates and nitrates, 22 even as green light has no significant effect on crop growth patterns, 23 Green light has been shown, on the other hand, to have an effect on the colouring of leaves. 24
At present, many scholars are conducting studies on the effects of LED multichrome lighting on plant growth. It has previously been found that in the seedling stage, the use of LED light sources and adjustments to light quality and photosynthetic photon flux density (PPFD) will not only decrease energy consumption and costs enormously but also shorten the cultivation cycle and improve the quality of plants to a certain degree. Many studies have proven that with high-brightness LEDs, the growth of crops such as lettuce, strawberries, and Phalaenopsis, among others, will be affected.9,13,25,26
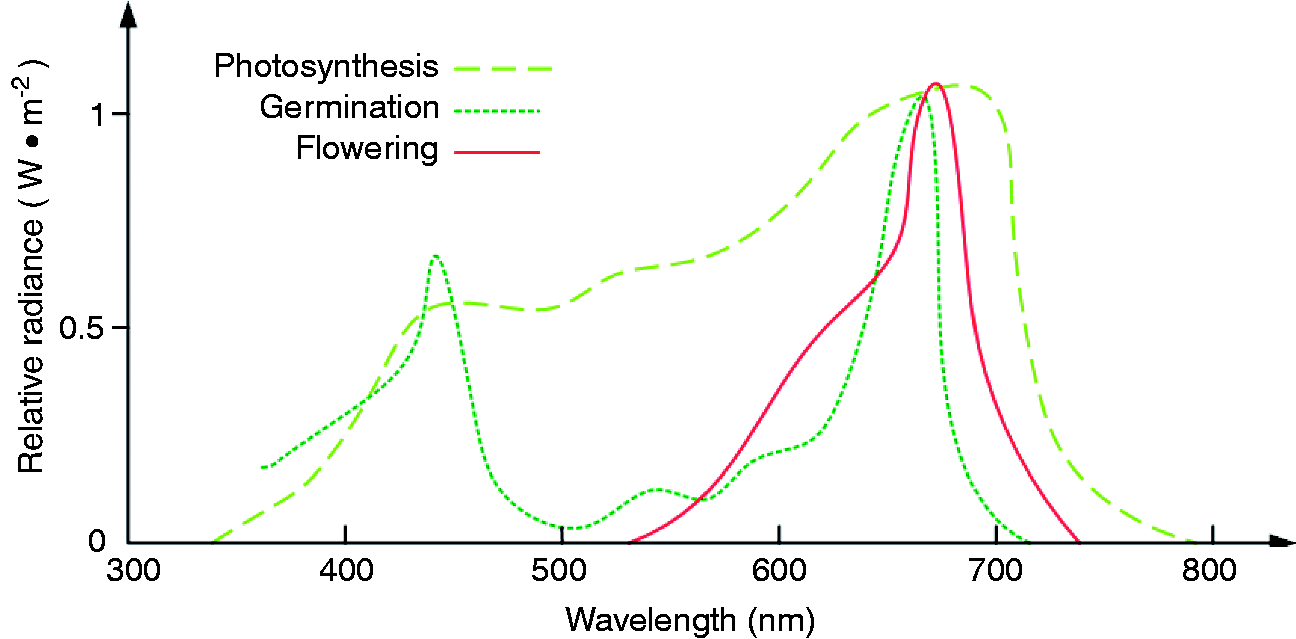
Sunlight is one of the vital elements for plant growth. However, the most efficient light spectral wavebands for photosynthesis in plants fall between 400 nm and 700 nm on the visible wavelength (see Figure 1).7,27 It is also true that wave band intensities affect plant growth the most when red light and blue light are applied for plant photosynthesis. However, the three-dimensional cultivation techniques developed by the advanced greenhouse industry are insufficient, and the light intensities provided to plants by such methods are also insufficient.28,29 Because the lower layer of a multi-layer cultivation frame is blanked by the upper layer, the average amount of sunlight of lower layer is less than that of upper layer. In fact, plants may be grown in vain as a result of various forms of sunlight radiation loss, such as reflection loss, transmission loss, and penetration loss, which can make plants unable to achieve maximum photosynthetic effects. Thus, effective supplemental lighting for plants is significant to produce high-quality crops.30,31
In 2005, multiple combinations of LEDs of different wavelengths were used to design adjustable light sources to replace the current plant light source design, an advance which is well-suited to establishing manual supplementary lighting and regulatory systems in the three-dimensional agriculture of the future. 32 However, Fryc et al.’s system still requires that an entire package of automatic adjustment mechanisms for the plant wavelengths be applied in the supplementary system.
The development of smart systems has been put into practice for many years. Commonly seen control methods currently rely on fuzzy logic inference and expert data to determine optimised parameters for a given system.33–36 The expert system is composed of a knowledge database. 33 The user can revise the database to strengthen system performance. The expert system is adopted to solve complicated control problems. Fasanghari and Montazer 34 have demonstrated a fuzzy expert system for selecting superior stocks so as to meet the uncertainty of stock portfolio recommendations and to model the recommendation rules adopted by experts at the Tehran Stock Exchange for portfolio recommendations.
Kolhe et al. 35 proposed an integrated intelligent multimedia interface based on fuzzy logic for crop disease management. The system can provide a significant aid in crop management, giving quick solutions for plant pathologies. A multistaged fuzzy logic controller has been adopted to regulate plant growth. 36 This strategy can create the optimal growth conditions for plants at different growth stages so as to enhance the quality of plants. In this study, a fuzzy controller was used under fixed conditions of humidity and temperature and a constant cycle of light and darkness. The proposed system gives plant lighting in terms of red light, green light, and blue light at seedling stage based on leaf area size, leaf colour, and stem height, respectively. Meanwhile, supplementary lighting is performed given an insufficient amount of sunshine. In short, the supplementary lighting system was able to shorten the duration of growth by keeping the crop growing efficiently. Moreover, this efficiency allows energy savings to be achieved.
2. Materials and methods
2.1. An overview of fuzzy logic
A fuzzy logic control system is a digital control methodology that simulates human thinking by incorporating the imprecision inherent in all physical systems.37,38 The main feature of the system is that expert knowledge can be transferred via a linguistic control strategy into an automatic digital control strategy while system control output can be obtained via a fuzzy logic inference. 39 In the control system, there are four principle components, namely, the fuzzification interface (FI), the decision making logic, the knowledge database, and the de-fuzzification interface (DFI).
The functions of the FI are three-fold: first, to input the variables for pre-handling (i.e. normalisation); second, to conduct scaling mapping, a measure to transfer the range of values for the input variables into corresponding universes of discourse; and third, to input data for the transformation of suitable linguistic values which could be seen as labels for fuzzy sets. The second of the aforementioned components, decision-making logic, is formed according to the fuzzy behaviour concept of humans in making decisions, and this decision-making is determined by employing fuzzy implications and the rules of inference in fuzzy logic. The third component is the expert knowledge database, which is incorporated with fuzzy database and linguistic control rules. The database is applied to supply definitions of fuzzy subsets of variables and membership function (MF) when planning. A linguistic control rule database is used to describe the control purpose and strategy through the standard rules established by experts in the field. The last of the four components is the DFI. It serves to transfer the values of the output variables into the corresponding universes of discourse, and then the fuzzy control actions inferred can be transformed into actual control actions. In the following section, the application of the fuzzy control strategy used in the automatic supplementary lighting system for plant cultivation will be introduced.
2.2. LED supplementary and regulatory system
Figure 2 presents a block diagram of the whole LED supplementary lighting system. It contains the fuzzy logic controller, the knowledge database, image processing and LED spectrum model establishment, and photometric unit transformation. The fuzzy logic controller was mainly used to determine the amount of red, green, and blue light necessary. The knowledge database contains plant growth pattern data and related data on the amounts of red, green, and blue light required. An LED spectrum model was used to transfer the driving current of the light source outputs from the fuzzy logic controller into their respective spectrum distribution functions. Irradiance unit transformation, on the other hand, was used to transform spectral radiant intensity into PPFD for the purpose of being in accordance with the light intensity standard for agriculture.40,41 With image processing – specifically, through an image capture process used during the cultivation of the plants
42
– the plant leaf area indexes (LAIs) and stem heights are calculated, while leaf colours are also judged according to the knowledge database, in order to determine the most suitable light spectrum and intensity. In the following section, how the fuzzy logic system for the supplementary lighting works will be introduced step by step.
The LED supplementary lighting system LED: light emitting diode; LAI: leaf area index; DF: de-fuzzification.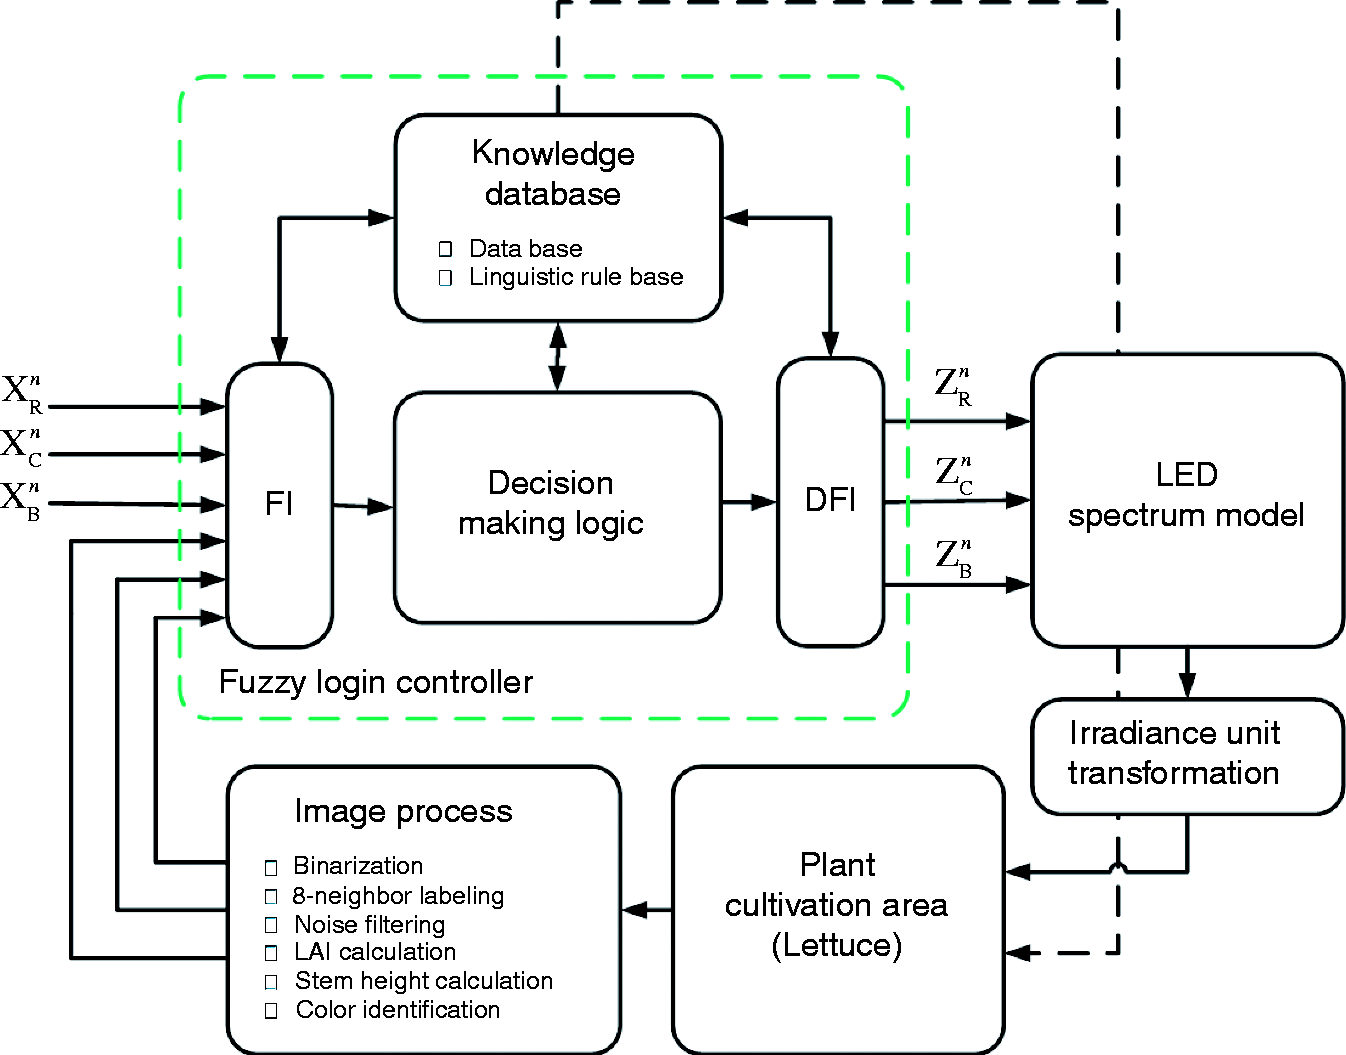
2.2.1. Selection of input/output variables
The seedling stage growth pattern database established in this study was based on previous data and related literature.42,43 The light spectrum was determined by the fuzzy system, and lettuce was the experimental crop. The lettuce in the seedling stage was supplemented with different wavelength bands of light quality and light quantity and was then assessed by the system for the resulting effects. The input variables for the system were LAI, leaf hue, and stem height. It is known that red light and blue light affect the leaf area and stem height in the seedling stage of the plant, while green light stimulates the metabolism of nitrates and carbohydrates and causes the leaves to exhibit more colours. As a result, the output variables in the entire system apply three types of wavelength (red light, blue light, and green light) as the driving current values. The selections of the wavelengths can be determined by the required components of the plants that users wish to grow. An extra wavelength can also be added in the system. However, the addition of an extra wavelength will lead to more consumption of LED drive current, which results in more power consumption by the proposed system. Meanwhile, the total system complexity is enhanced due to the increase in the number of output variables. In the system, three LED wavelength bands, such as red, blue and green, are selected. The choice of colour is determined by the user. Afterwards, the LED driving current values of each wavelength should be substituted into equation (1), and the light intensity distribution function of the multi-wavelength LED is thereby formed. Since the single wavelength LED output is a narrow waveband, the bandwidth (full width at half magnitude) usually falls between 20 nm and 50 nm. According to the physical characteristics of the LED, under ideal circumstances, the physical characteristics of the spectrum can be obtained approximately by using a Gaussian distribution function.44,45 As a result, it can be hypothesised that the three types of light quality function are all Gaussian distribution functions, and the functions can be merged by computing the three functions respectively and summing them. The equation involved is as follows:
Differential comparison of CIE 1931 colour-matching functions and theoretical model values in simulations.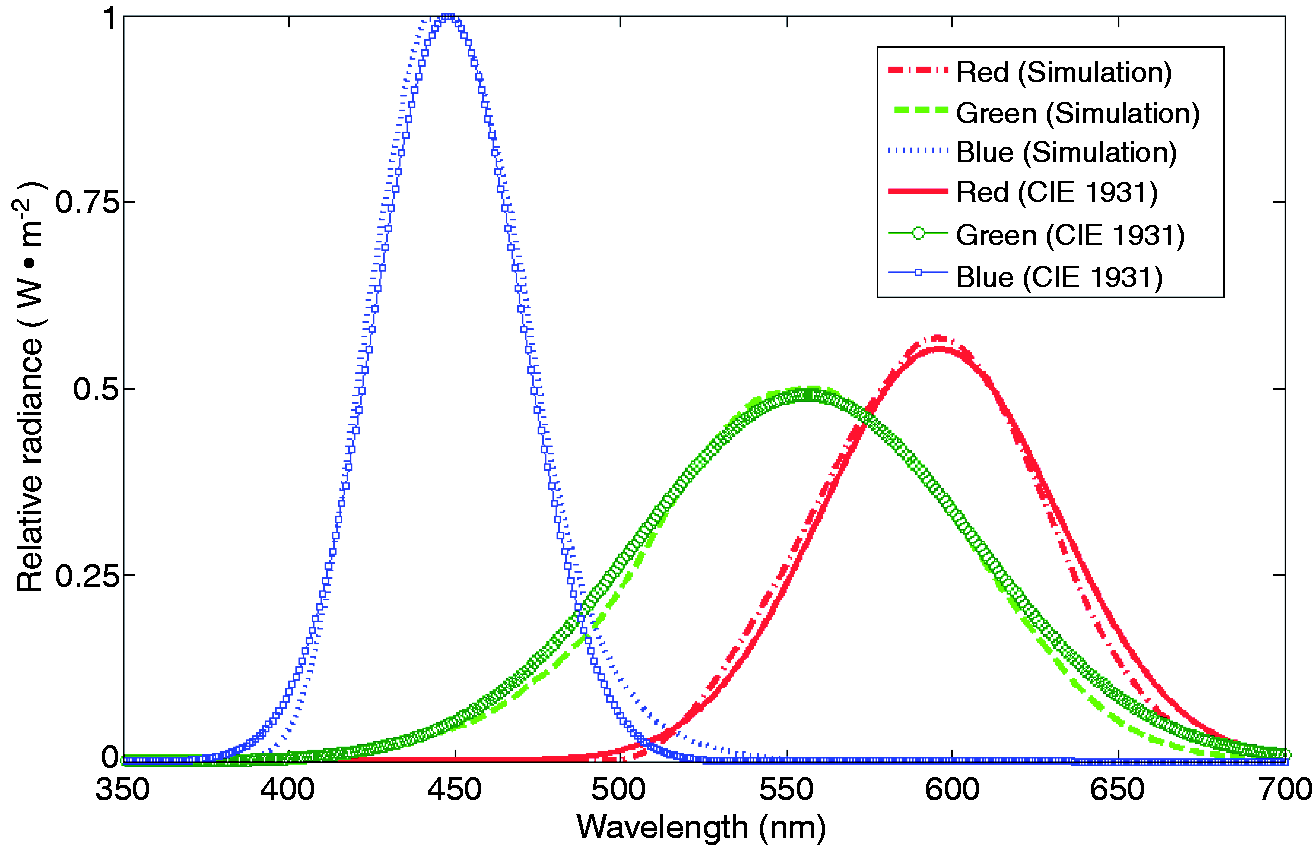

Consequently, a LED multi-wavelength spectrum model is established based on the output of each corresponding light quality from the fuzzy system. Achieving this kind of LED light spectrum distribution is no longer a difficult task, thanks to the advances in LED manufacturing techniques.
2.2.2. Fuzzification interface
In fuzzification, the corresponding fuzzy subset amount of each single input variable and MF type must be decided. Since the plant growth pattern is curved instead of linear, Gaussian MFs and sigmoidal MFs are applicable for the system input MFs, and the equation is presented with vector x acting as function
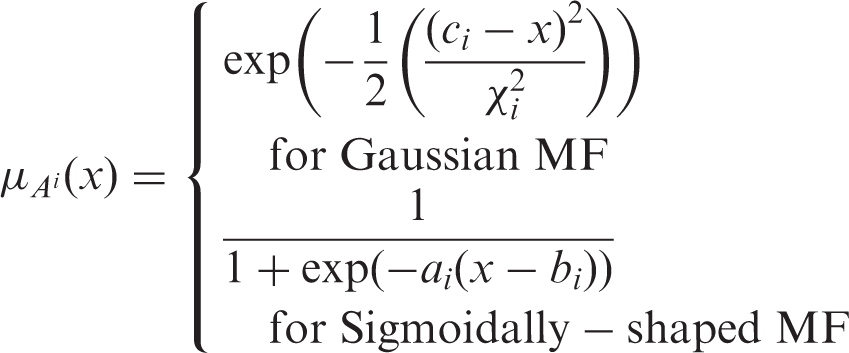
The three input variables, Input and output membership functions of fuzzy logic controller: (a) membership function of LAI fuzzification; (b) membership function of leaf colouration fuzzification; (c) membership function of stem height fuzzification; (d) membership function of fuzzy logic controller output LAI: leaf area index.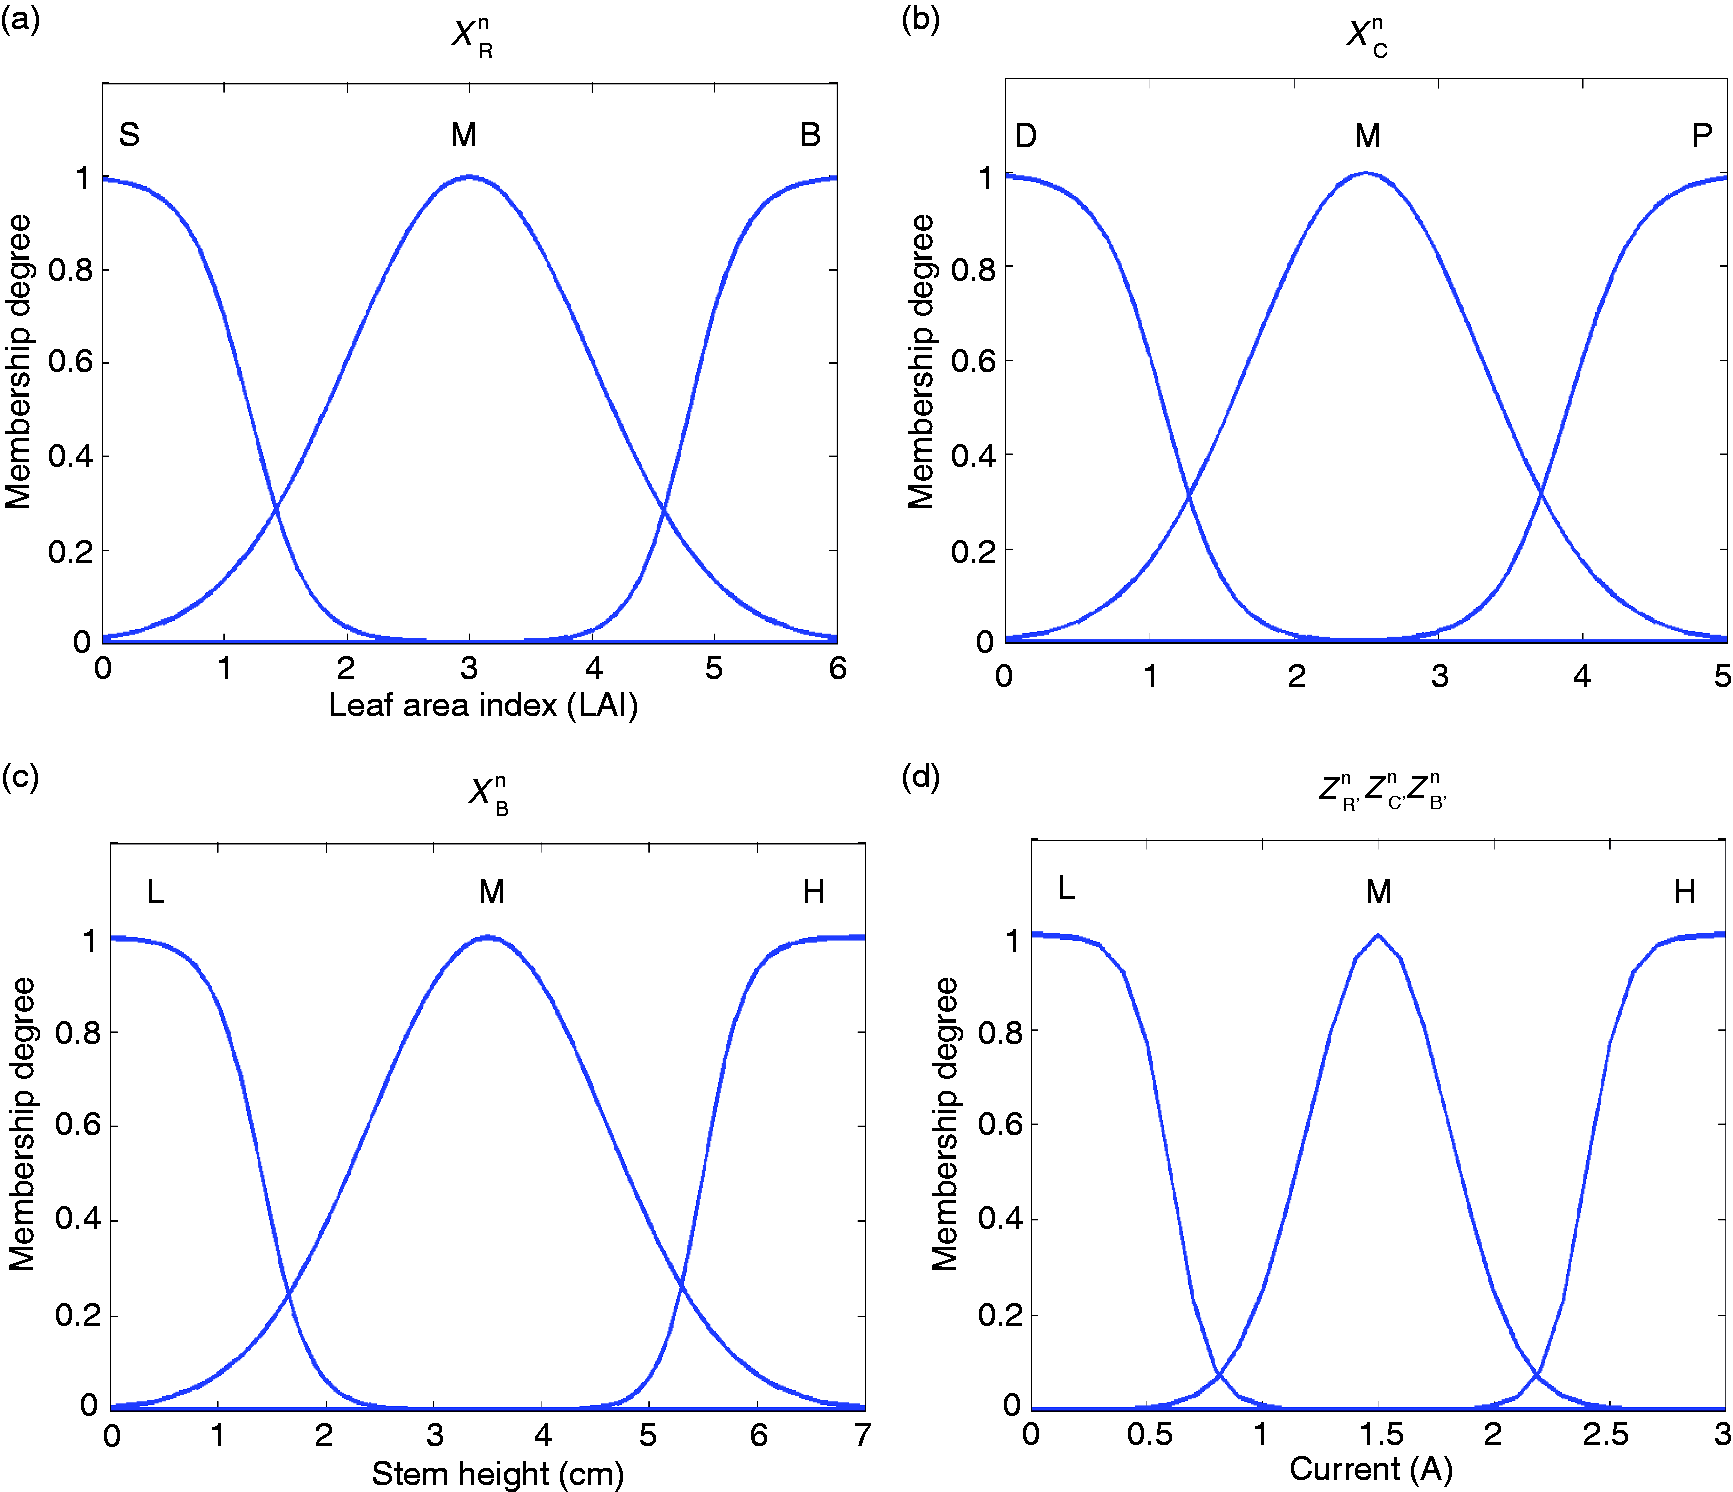
2.2.3. Decision-making logic and knowledge database
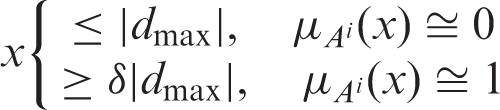
Linguistic control rule: If The fuzzy inference and rules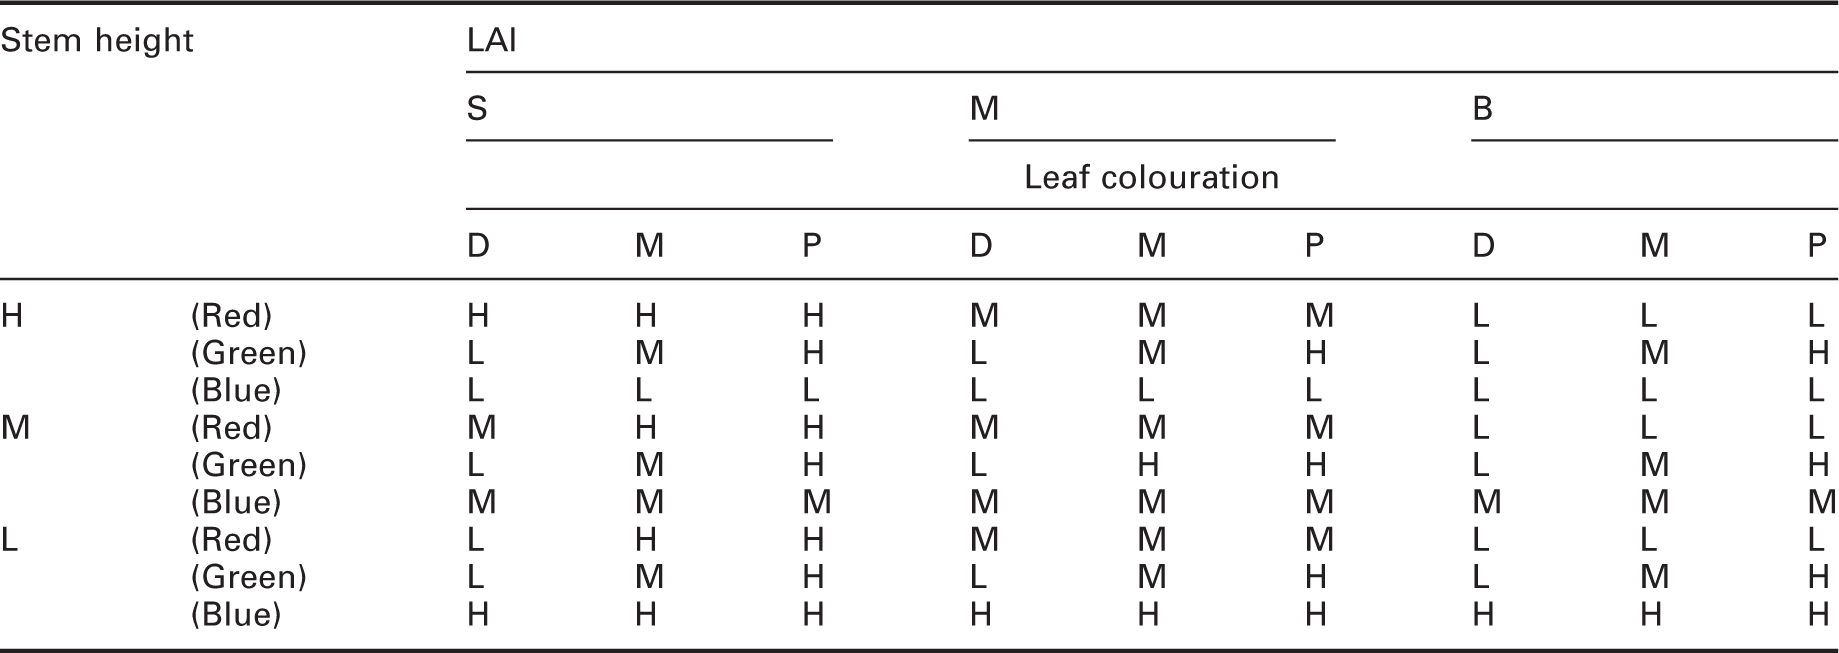
2.2.4. De-fuzzification interface
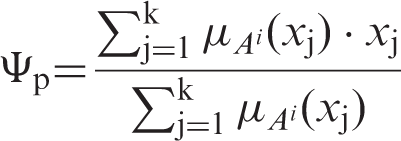
After performing the decision-making logic, the system will receive three output fuzzy sets. The three different wavelength current output values will therefore be obtained by using the DFI. The de-fuzzification methods applied in this study were the centre of gravity and mean of maxima methods. The current output value of each light quality set can be computed by Equation (4), as shown in the following:
2.2.5. LED irradiance unit transformation
After finishing the de-fuzzification step, the system will yield each light quality current value output. The current values should be then substituted into Equation (1) to obtain the spectral intensity of each light. However, the growth rate of the plant is affected by photosynthetically active radiation, specifically, by the PPFD (the customary unit of which is 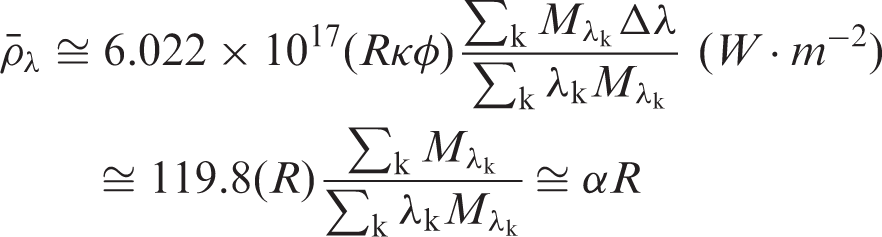
2.3. Image processing techniques
This system utilised two sets of video cameras to capture photos of the plant side views and leaf areas. The main purpose of this was to observe the growth height and to calculate the LAI. The technique used here was to transfer the RGB pixels of the photos into a gray scale image, and then conduct binary image processing.
48
Afterwards, the component labeling method was used to locate eight neighbouring objects and calculate each plant’s leaf area and stem height. Meanwhile, the noise was also filtered.
49
Finally, the leaf area of the each unit area (i.e. the LAI) was calculated; this value can also be obtained through manual measurement and it is closely related to the final volume of production.
50
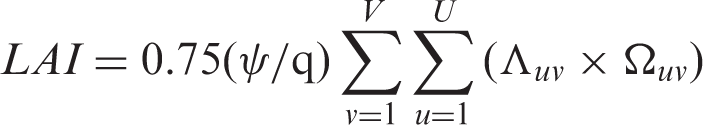
The LAI can be calculated with the following equation:
As for determining the leaf colours, there are various methods, including direct visual inspections, the colorimetric method 53 the chlorophyll metre method, 54 and the spectrophotometry method, 55 among others. The most convenient and fastest method is direct visual inspection, and its correlation with the chlorophyll content of plants is the highest. Chlorophyll content can be assessed by a linear equation; therefore, for leaf colour determination, the direct visual inspection method was adopted. The colours of leaves can be divided into brownish-yellow (level 1), light green (or greyish-green; level 2), green (level 3), dark olive green (level 4) and dark green (level 5). The leaf colour of a given leaf is categorised into one of these five levels (1–5).56,57 Usually if the leaf colour is dark green, it indicates that the leaf is rich in nitrogen fertiliser, or it may imply that the leaf absorbs too much green light. 53 As a result, in leaf colour determination, it can be said that a green or dark olive green leaf represents an ideal condition.
3. Numerical example
3.1. Establishing the plant photo-physiology database
To determine the correctness of the flux density adjustment of this system, a database concerning the relations between the spectrum and the growth patterns of plants needed to be set up first before running the system simulation. Therefore, a 13-day crop cultivation experiment was conducted with a combination of natural light and LED light in the mini greenhouse in the Department of Biomechatronics Engineering building at National Pingtung University of Science and Technology. The target plant is garden lettuce, where the seed source is provided by the Know-you Seed Co. Ltd. Hydroponic nutrient solution include 1.8 g ammonium nitrogen, 8.7 g carbon-nitrogen nitrate, 9 g water-soluble phosphoric acid and 28.5 g water-soluble potassium hydroxide, which totally equals 48 g. One litre of water is added for dilution. Each planting bed is 90 cm in length, and 45 cm in width. The cycle time of the pump in the circulating system is 15/45 (on/off) minutes. The CO2 concentration is between 600 ppm and 800 ppm, temperature is between 21 (a) Original image; (b) remove the noise of image; (c) use the RGB colour space method to remove the areas of non-specific colour of plant; (d) remove the RB colour space; (e) find the possible area of plant leaf; and (f) perform the erosion and expansion Light supplementation of the system under three different sunlight intensities: (a) full sunlight; (b) shaded by dark clouds; and (c) mostly shaded or when sunlight intensity is low Light supplementation at different times within one day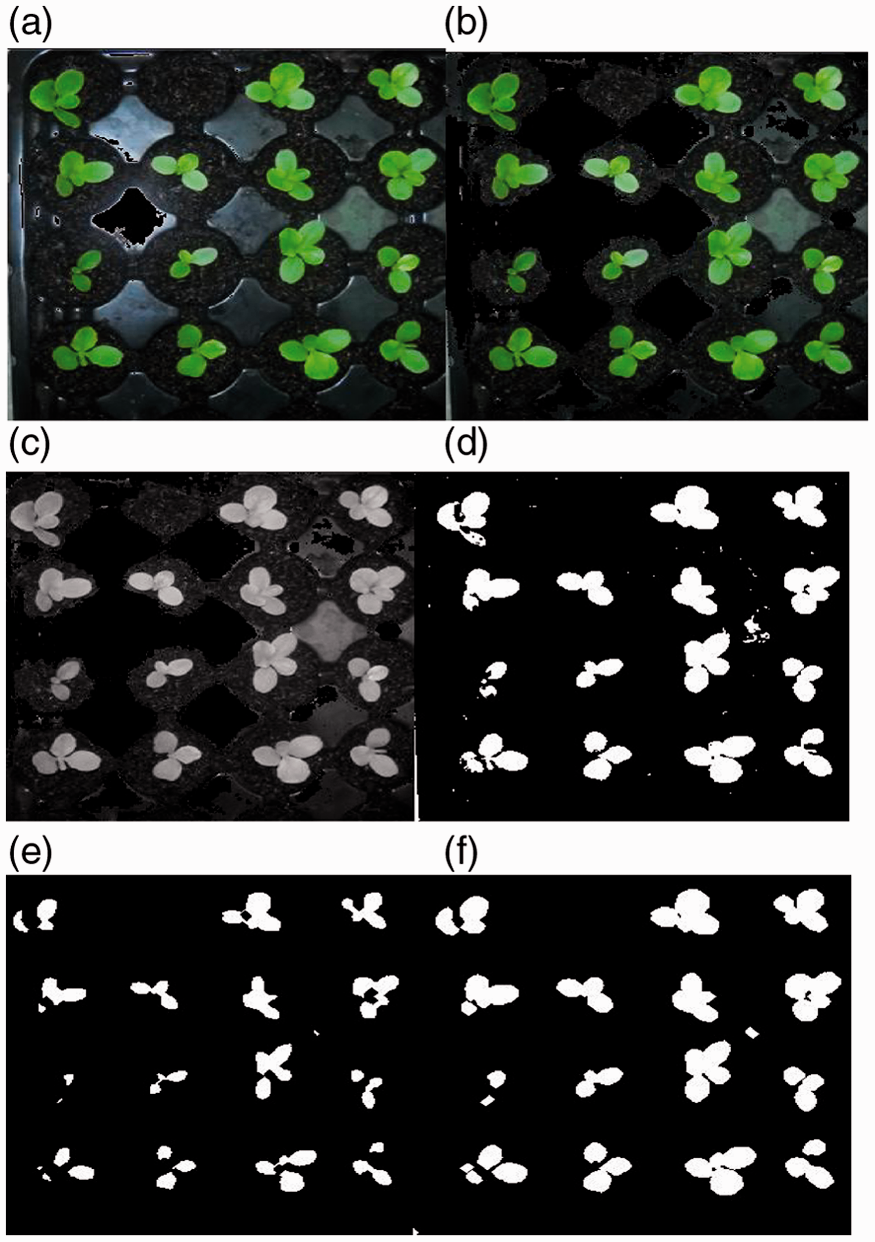
All the growth pattern analyses were calculated over the average of 30 plants, excluding plants with extreme growth pattern variations. To enable comparison and verification, a combination of three types of LED light spectrums was also tested, where the wavelength of the red light was
3.2. Simulation process
The main purpose of this part of the study was to determine the feasibility of the proposed mechanism and to analyse and evaluate the effects of the said mechanism. The focus here was on the light distribution achieved once the system had started to emit supplementary lighting. When the system was offline, the steps below were followed in sequence for internal system verification, with the light–dark cycle, temperature, humidity, and uniformity of the distribution of light quality and intensity remaining consistent.
Step 1: First, Lactuca sativa Linn. (garden lettuce) is chosen as the subject, and a fuzzy MF set up has begun, as shown in Figure 4. Step 2: Then, a database is established on the relations between the growth pattern of plants and various light qualities and intensities (Table 1). At the same time, the spectrum database of plant growth is also established. Step 3: The current growing day of the lettuce is recorded and compared with the corresponding ideal plant growth pattern data (including LAI, stem height, and leaf colour) in the database. The spectrum distribution and the growth pattern of the plant growing in a human-controlled environment is then compared with the data in the database, calculating the variations and inputting the growth pattern variation data and the spectrum distribution variation data into the fuzzy system. Based on these variation data, the fuzzy system can then decide whether or not supplementary lighting is required and, if so, what type of supplementary lighting is required. Step 4: The parameters of the ideal spectral function are determined, including spectrum wavelength band and full width at half magnitude, as well as the transformation coefficient for the current and optical power output (as in equations (1) and (5)). Based on these functions, the system can then adjust the current for the spectrum wavelength band to achieve the ideal spectrum distribution. Step 5: The three output values of the system are then transformed into a photosynthetic photon flux value (these transformation steps have already been explained above). After the spectrum of the natural light source is compiled, the complete spectrum distribution of the light received by the plant can be drafted out and the total PPFD value can be calculated. Step 6: Step 3 is then returned to, and the correctness of the supplementary lighting of the system is tested.
As seen in Figure 6, it was determined that when there are changes in the natural light spectrum, the system can promptly provide supplementary lights of different intensities to achieve the ideal spectrum distribution. Figure 6(c) shows that the supplementation of green light is relatively low because the plant requires a low amount of green light during photosynthesis. Once the offline simulation test was verified, the online simulation could then be conducted.
4. Experiment
4.1. Method
During the online system simulation process, data collected from a one-day experiment and a one-week experiment were analysed. The main purpose of the one-day experiment was to explore the light supplementation of the fuzzy system at different time points in the day. The purpose of the one-week experiment was to explore the growth pattern variations of plants with and without light supplementation. In the simulation system, the light intensity was adjusted every 30 min. The air temperature, relative humidity, and CO2 levels for all treatment were maintained at 22.3
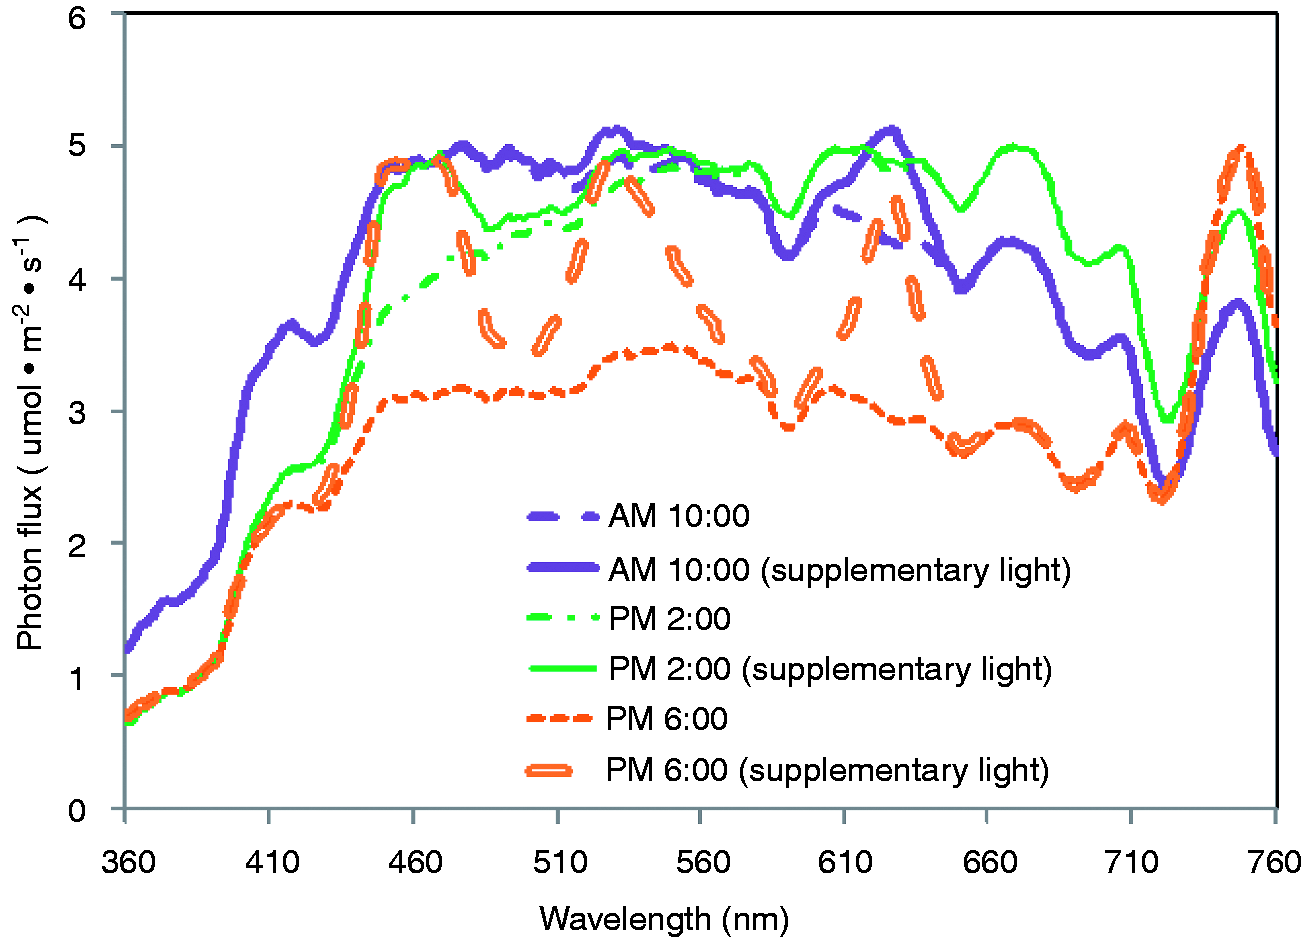
4.2. Results
Figure 7 shows the one-day light supplementation. The real-time simulation of the system involved activity at 10:00 a.m., 2:00 p.m. and 6:00 p.m. At these time points, light supplementation was observed. From the spectrum distribution shown in Figure 7, it can be seen that the intensity of the light in the red wavelength band was relatively weak in the morning, the intensity of the light in the blue wavelength band was relatively weak in the afternoon, and the intensity of all the lights in the entire spectrum was weak in the evening. Although the intensity of all the lights in the entire spectrum was weak, the system was able to supplement all the light in the various wavelength bands.
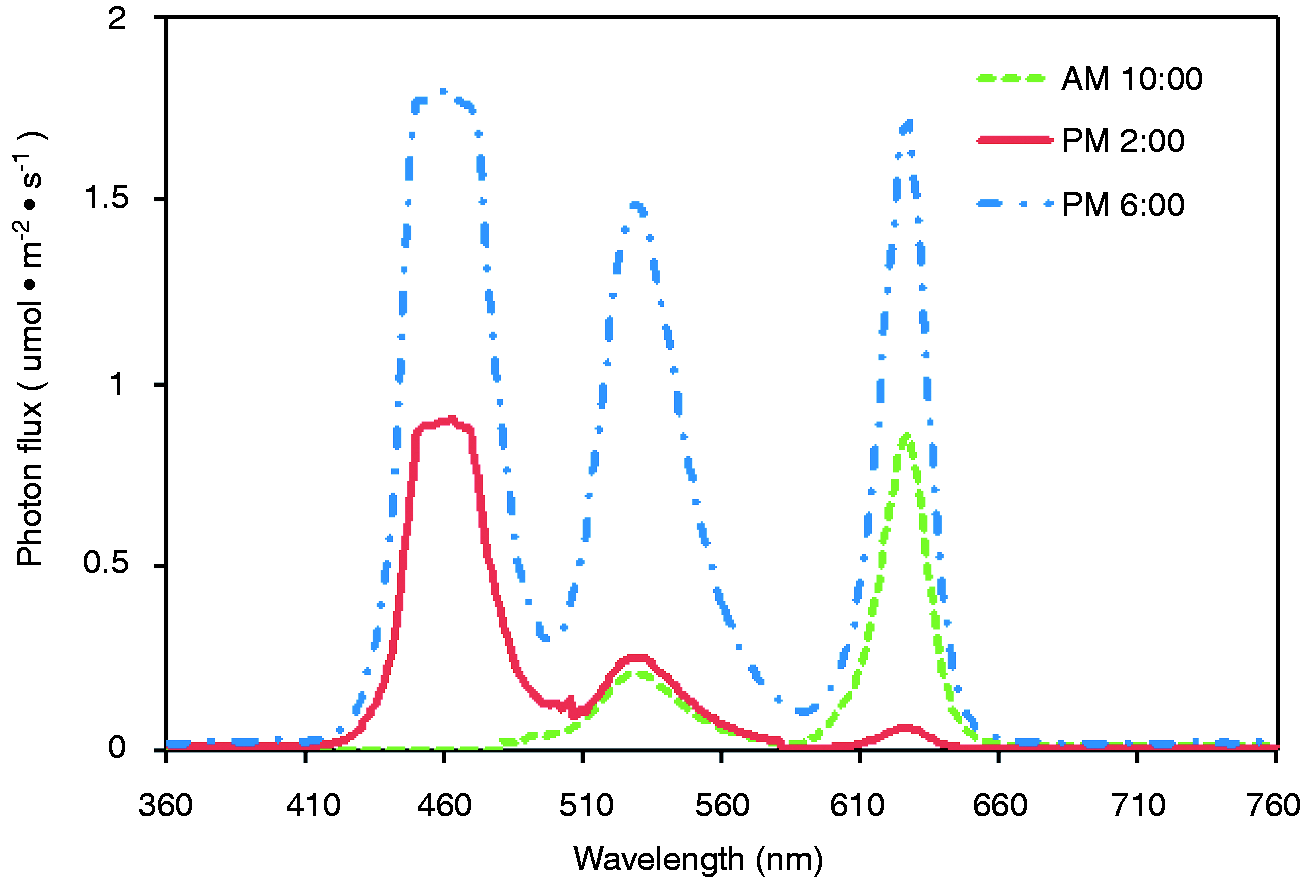
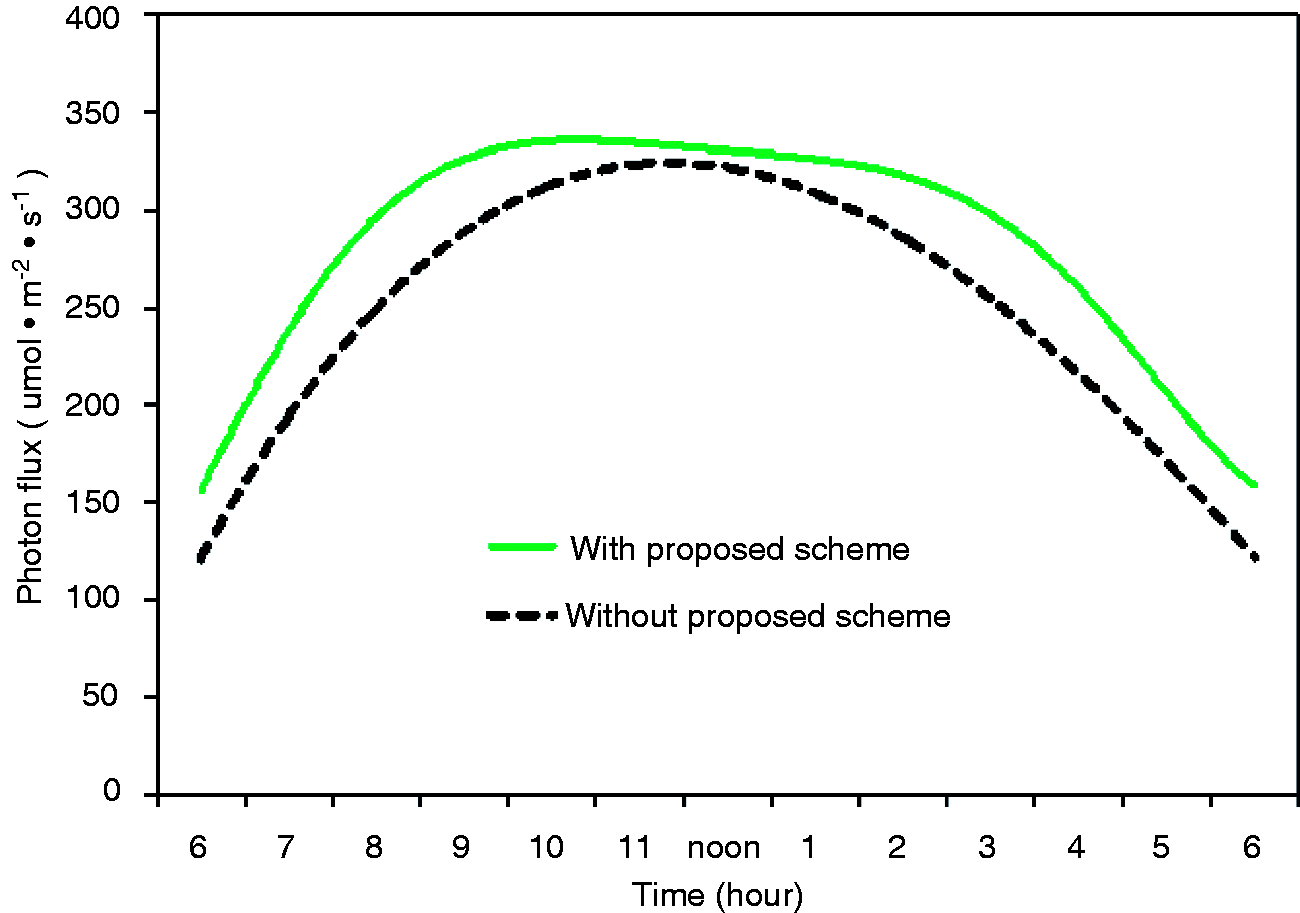
This system was designed, in fact, to supplement different light qualities and intensities at different time points of the day for the three wavelength bands which are vital for the photosynthesis of plants. Compared with the traditional system, which is unable to adjust light intensity, this system is more efficient and requires less energy consumption. Figure 8 shows the spectrum distribution of the supplementary lighting at the three different time points of the day. It clearly shows that the amount of supplementary light required in the evening is higher than at other time points. Figure 9 shows the variations between the total amount of light supplementation provided by the proposed system and by the traditional system over one day. Findings show that the system proposed in this study provides the right amount of light supplementation at different time points of the day and is able to reduce energy consumption. A separate system performance test was also conducted, in which the growth period of the plant was extended to 11 days (the actual simulation time of the system is 5 min). The growth pattern of each plant was analysed. The data in Figure 10 shows the changes in the daily growth pattern of the plants. Recordings of the findings were begun from day 3, when the seeds germinated. The growth pattern information for the plants without supplementary lighting was derived from the results of the experiments conducted in the mini greenhouse earlier. As a complete database for the relations between the growth pattern and the light quality had already been established, the output value of the fuzzy system could be compared with the growth pattern of the corresponding plants in the database. The plant growth information in the database can serve as a reference for the supplementary lighting quality required by the fuzzy system (see Figure 10).
Variations in plant growth patterns (day 3 to day 13): (a) leaf area index; (b) leaf colour; and (c) height of stem Supplementary light spectrum at different time ps within one day Total light supplementation (PPF) at different times within one day PPF: photosynthetic photon flux.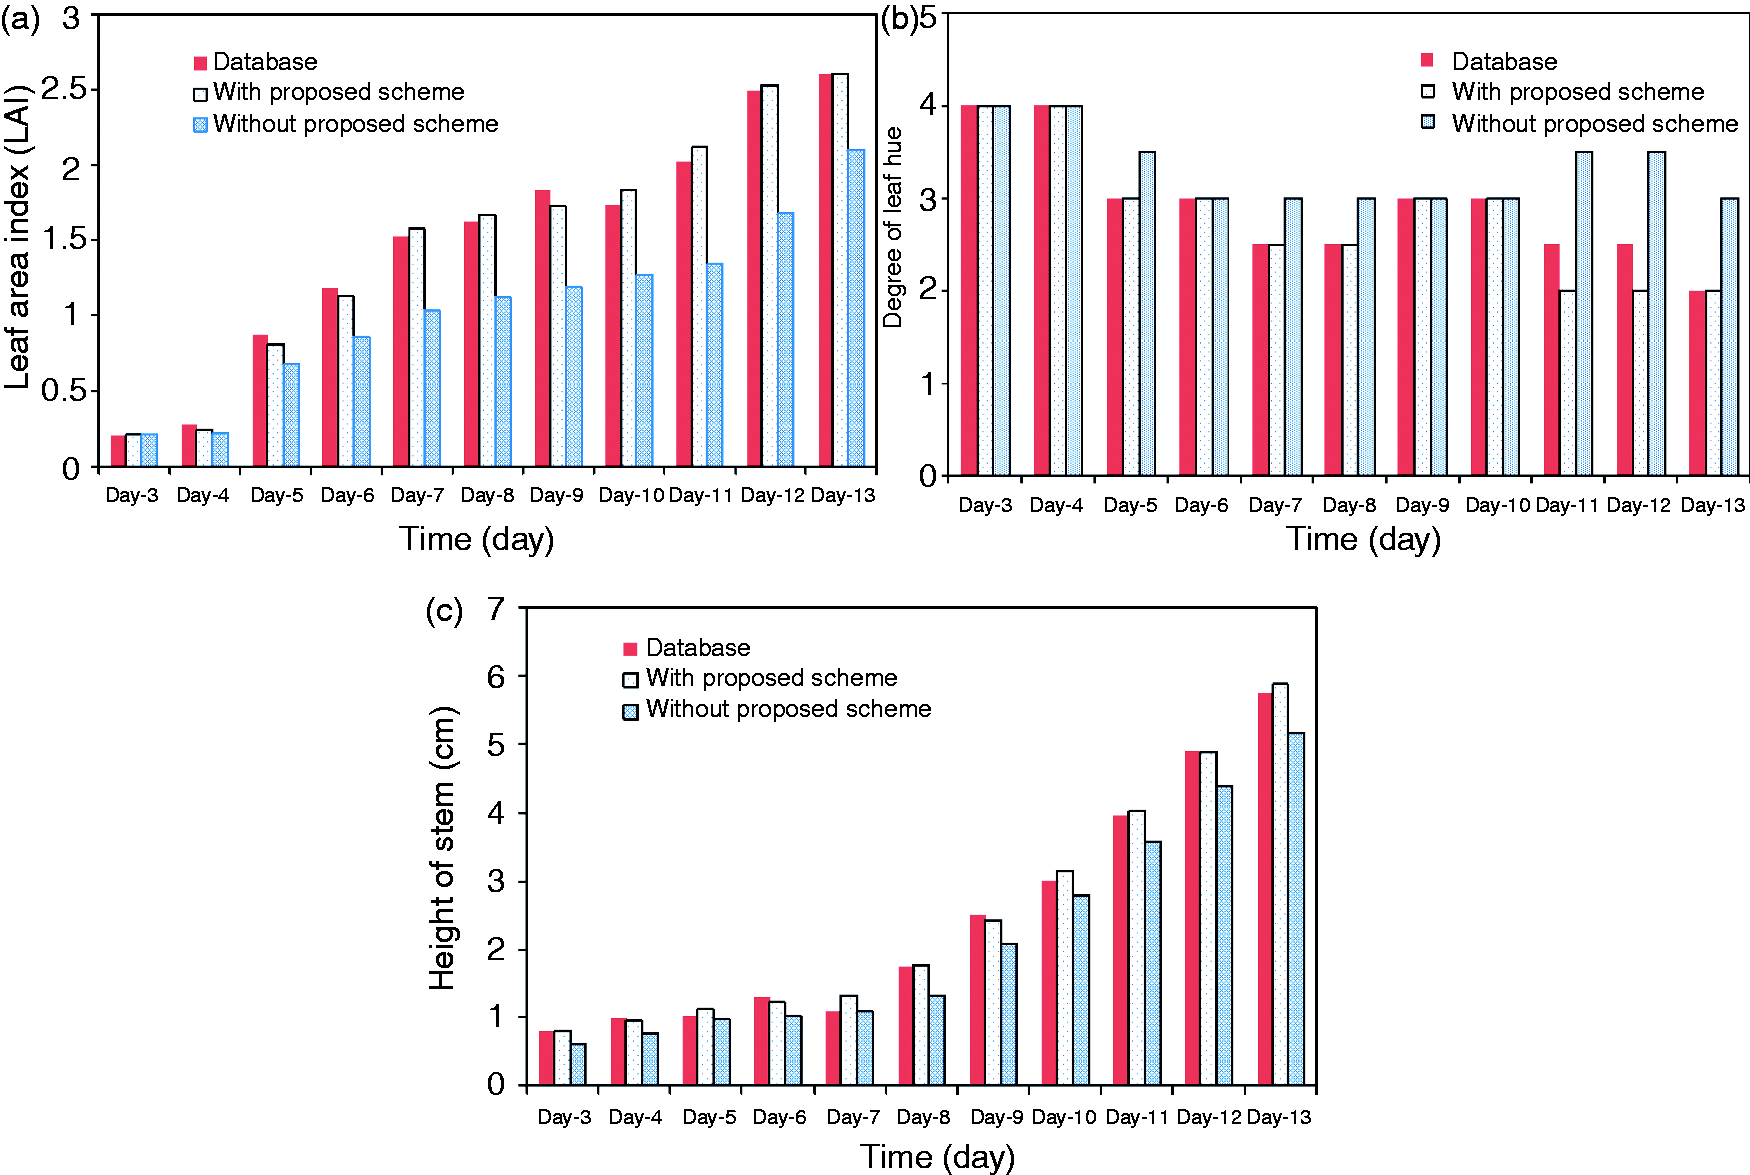
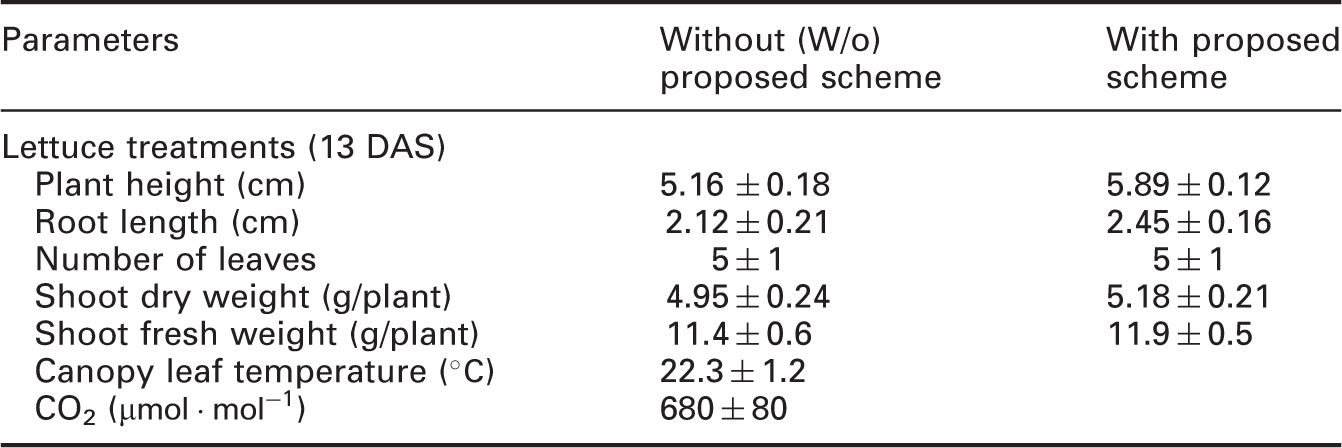
Influence of light quality on plant height, root length, number of leaves, shoot dry weight, and shoot fresh weight at 13th day after sowing (DAS)
5. Conclusion
This paper proposes an intelligent light supplementation and regulatory system which can be used in modern greenhouse crop cultivation. The results indicate that this system can, with a fuzzy logic inference and the guidance of experts, effectively overcome light adjustment inefficiency in a semiclosed crop production systems in a greenhouse. Optimum light quality and the right amount of light can be supplied with this system. Our simulations showed that even under the condition of full sunlight, the system can still provide supplementary light to make up for insufficient light of certain wavelength bands within the sunlight. This improves the growth patterns of the plants and reduces waste of power resources. In the future, carbon dioxide control technology and an automatic LED lamp lift system may be integrated into this system for optimum agricultural growth.
Footnotes
Funding
This work was supported by the National Science Council, Taiwan, ROC, under grant nos. NSC 101-2622-E-020-002-CC2 and NSC 102-2622-E-020-006-CC3.