
Abstract
To investigate the performance of three different colour fidelity metrics, Commission Internationale de l'Eclairage (CIE) colour-rendering index (CRI), colour quality scale (CQS) and CRI2012, lighting booth experiments were conducted. Three different light-emitting diode spectral power distribution, all at correlated colour temperatures of 2800 K, 4000 K and 6500 K, were simulated for Ra > 90, Ra ≈ 80 and Ra < 60. It was found that CIE CRI, CQS and CRI2012 were highly correlated with visual colour difference. It was also found that colour quality scale provides better prediction for the light-emitting diode light source that highly increases object chroma. However, more colour fidelity experiments using light-emitting diode light sources that highly increase object chroma are required before recommending any final colour fidelity metric.
1. Introduction
Commission Internationale de l’Eclairage (CIE) Colour Rendering Index (CRI) is the only internationally recognised metric to measure the colour-rendering properties of a light source. 1 It was designed to compare the colour rendering or colour fidelity of light sources by calculating the colour differences of test samples illuminated under a test illuminant and a reference illuminant. However, many deficiencies are associated with the CIE CRI,2–4 among them, the use of outdated colorimetric tools and the use of relatively low saturation test samples. Moreover, CIE CRI gives a poor estimation of the colour-rendering properties of light-emitting diodes (LEDs). 5 Attempts have been made by CIE to revise the CIE CRI,5,6 one of the latest being the formation of a technical committee CIE TC 1-90: colour fidelity index that was formed with the terms of reference ‘to evaluate available indices based on colour fidelity for assessing the colour quality of white light sources with a goal of recommending a single colour fidelity index for industrial use’. 7 Many new metrics like colour quality scale (CQS), 8 CRI2012, 9 and CRI-CAM02UCS 10 have been proposed. However, due to a lack of more precise and comprehensive data, no metric has been recommended.
The failure of CIE CRI was more prominent when LED technology emerged.5,8,11–13 Visual experiments11,14 related to colour fidelity have been conducted to test the CIE test method (the method used to calculate CIE CRI) and different colour difference formulae. Sándor and Schanda 11 adopted a simultaneous colour-matching technique to assess, with the help of 10 observers, the colour difference of different colours of the Macbeth Colour checker (MCC) chart. Li et al. 14 conducted an experiment with eight observers, using a successive colour-matching technique. These studies showed that visual colour rendering is not well described by the CIE test method and that visual colour difference correlates very well with the CIECAM02-based colour difference formula.11,14,15 Even though Sándor and Schanda 11 and Li et al. 14 adopted two different techniques for colour matching, they reached the same conclusion. A study conducted by Luo et al. 15 showed that CQS, nCRI, CRI-CAM02UCS and CIE CRI gave similar performance regarding colour fidelity. The study adopted a successive colour-matching (magnitude estimation) technique to assess 22 colours under 19 light sources. However, only 10 observers participated in the study.
Aalto University Lighting Unit conducted a colour fidelity experiment to investigate the performance of three different colour fidelity metrics CIE CRI, CQS and CRI2012. Three different LED spectral power distributions were optimised for Ra > 90, Ra ≈ 80 and Ra < 60, each at 2800 K, 4000 K and 6500 K. A simultaneous matching technique using grey scale was used for the study. Twenty observers took part in the experiment. After the experiment, the visual differences were compared with the different metrics. The results showed that visual colour difference correlates very well with CQS, CRI2012 and CIE CRI. However, at 4000 K, it was found that CQS provide better prediction for the LED light source that highly increased object chroma. This study did not include, CRI-CAM02UCS; CRI2012, which is based on CRI-CAM02UCS, was considered instead. The main difference between the two is in the test samples. CRI2012 uses the HL17 set, which is based on mathematical functions to have a minimum change of spectral sensitivity across spectrum to avoid gaming. 9
2. Experiment
2.1 Double lighting booth
Two viewing cabinets were constructed for the experiment and were placed side by side (Figure 1). One cabinet was illuminated by reference light sources and other cabinet by different test LED SPDs. The walls and the bottom of the cabinets were painted with a black matte paint to have a similar colour appearance. Experiments were conducted with light sources of correlated colour temperatures (CCTs); 2800 K, 4000 K and 6500 K.
Two viewing cabinets used in the experiment.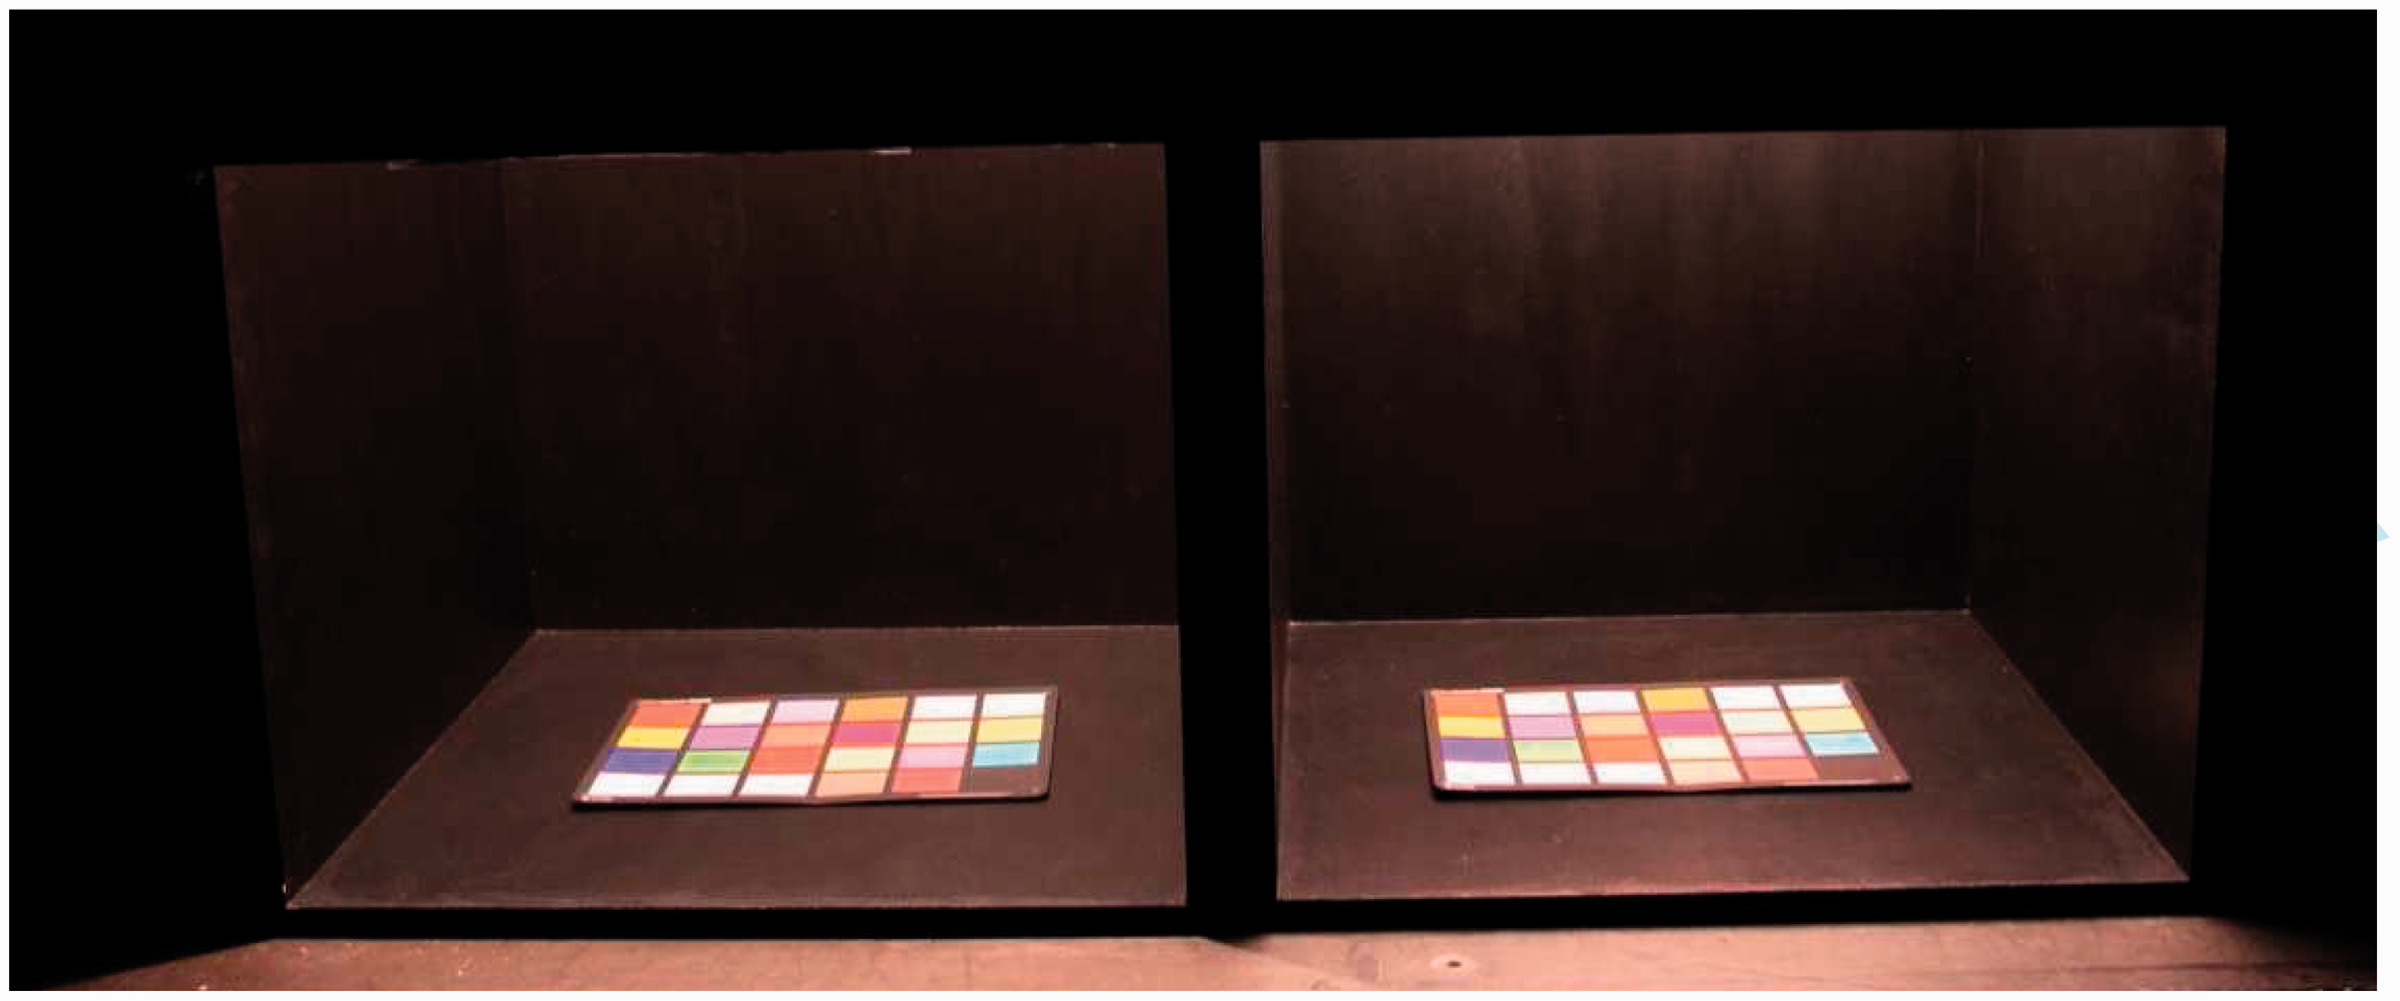
The task of the observer was to scale the visual colour difference between the corresponding chromatic samples of the MCCs, as was done by Sándor and Schanda. 11 Initially, the experiment was conducted using a short-term memory colour difference evaluation method as conducted by Li et al. 14 Later, there was a shift to side-by-side comparison, as observers commented that the experiment was very difficult and they were marking arbitrary judgements.
2.2 Measurement equipment
A calibrated spectroradiometer, Konica-Minolta CS 2000, was used to measure the light source SPDs and the surface reflectance of objects. The SPDs were measured by focusing the spectroradiometer at a 45° measuring angle on diffuse reflecting material (BN-98-SQ2C reflectance standard) placed at the horizontal centre of the booth. The spectroradiometer was calibrated at Aalto University Lighting Unit. An illuminance meter, LMT Pocket Lux-2A, calibrated by LMT Lichtmesstechnik Gmbh Berlin, was used to measure the horizontal illuminance.
2.3 Light source SPDs
The different LED SPDs were generated with the help of a 12-Channel LED-based SPD Simulator System (LED Simulator) as was done in previous studies.16,17 The LED simulator has three main parts:
LED panels – 12-channel LED panels (LightingMetrics Kft.). Interface – PC DMX/RDM USB Interface (Dezelectric Kft.). Power supply unit (PSU) – 24-channel DMX/RDM Compatible Power Supply Unit (IST Ltd).
The LED panel of the LED Simulator has 12 independent strings of different types of LED, and each string has nine LEDs connected in series. The illuminance provided by the LED simulator was controlled by the master dim function of the PSU. The LED panel was concealed by a Plexiglas GS WHO2 diffuser, which blended the light well, thus providing homogeneous illumination at the base of the cabinet.
Colour characteristic of the light sources used in the study.
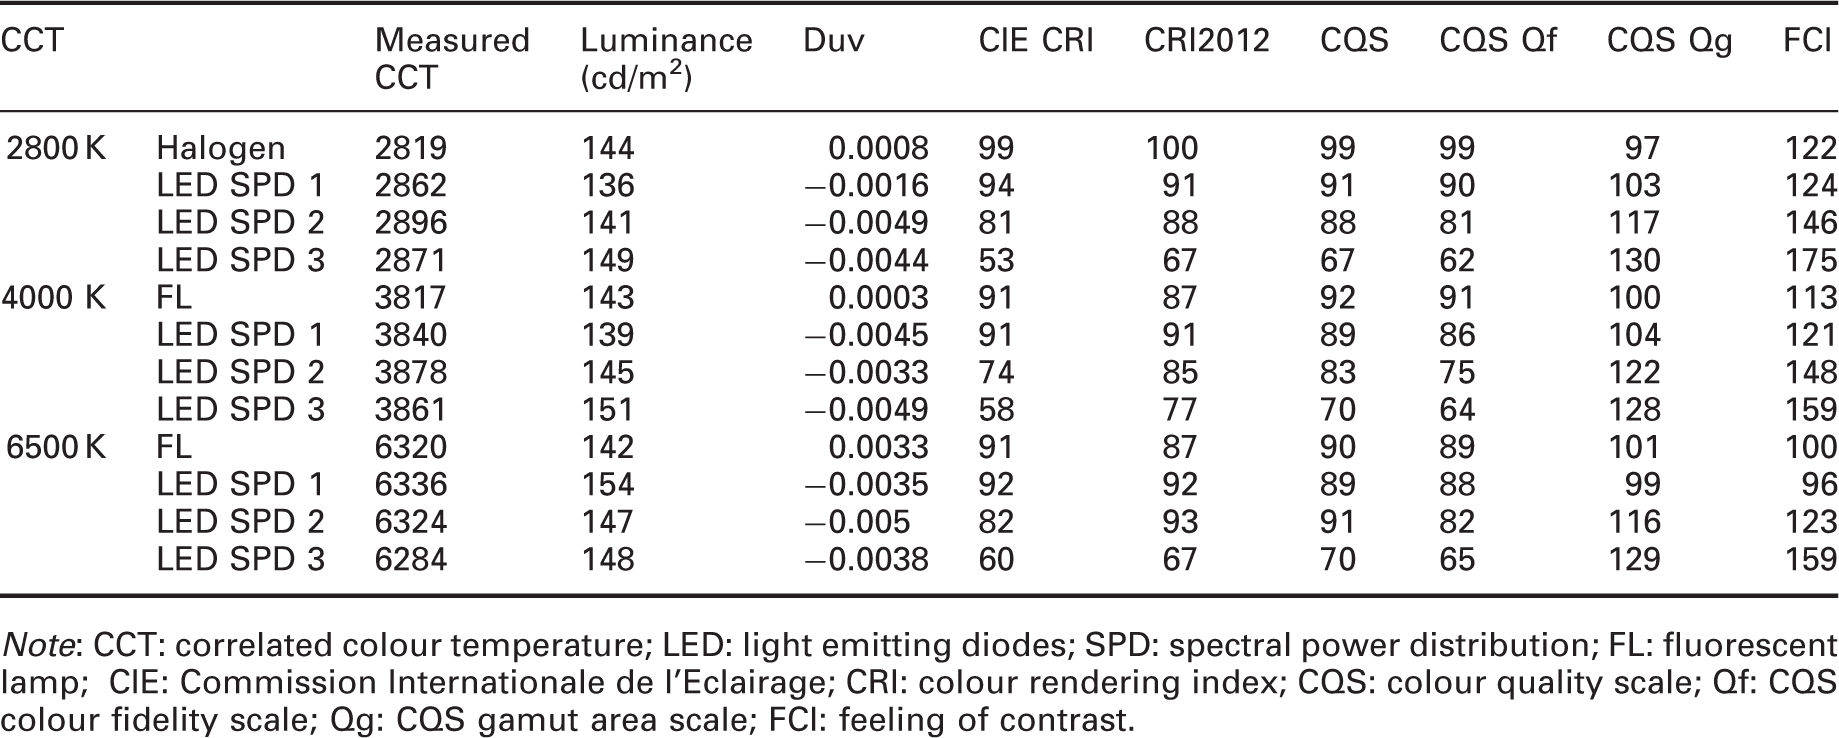
Note: CCT: correlated colour temperature; LED: light emitting diodes; SPD: spectral power distribution; FL: fluorescent lamp; CIE: Commission Internationale de l'Eclairage; CRI: colour rendering index; CQS: colour quality scale; Qf: CQS colour fidelity scale; Qg: CQS gamut area scale; FCI: feeling of contrast.
A luminaire for the FL lamp was constructed with electronic control gear (QTi 4X18/220-240 DIM) and has four FL lamps. The illuminance of the FL luminaire was controlled by a dimmer ‘Osram HF DIM MCU’.
The experiment was conducted using the following light sources:
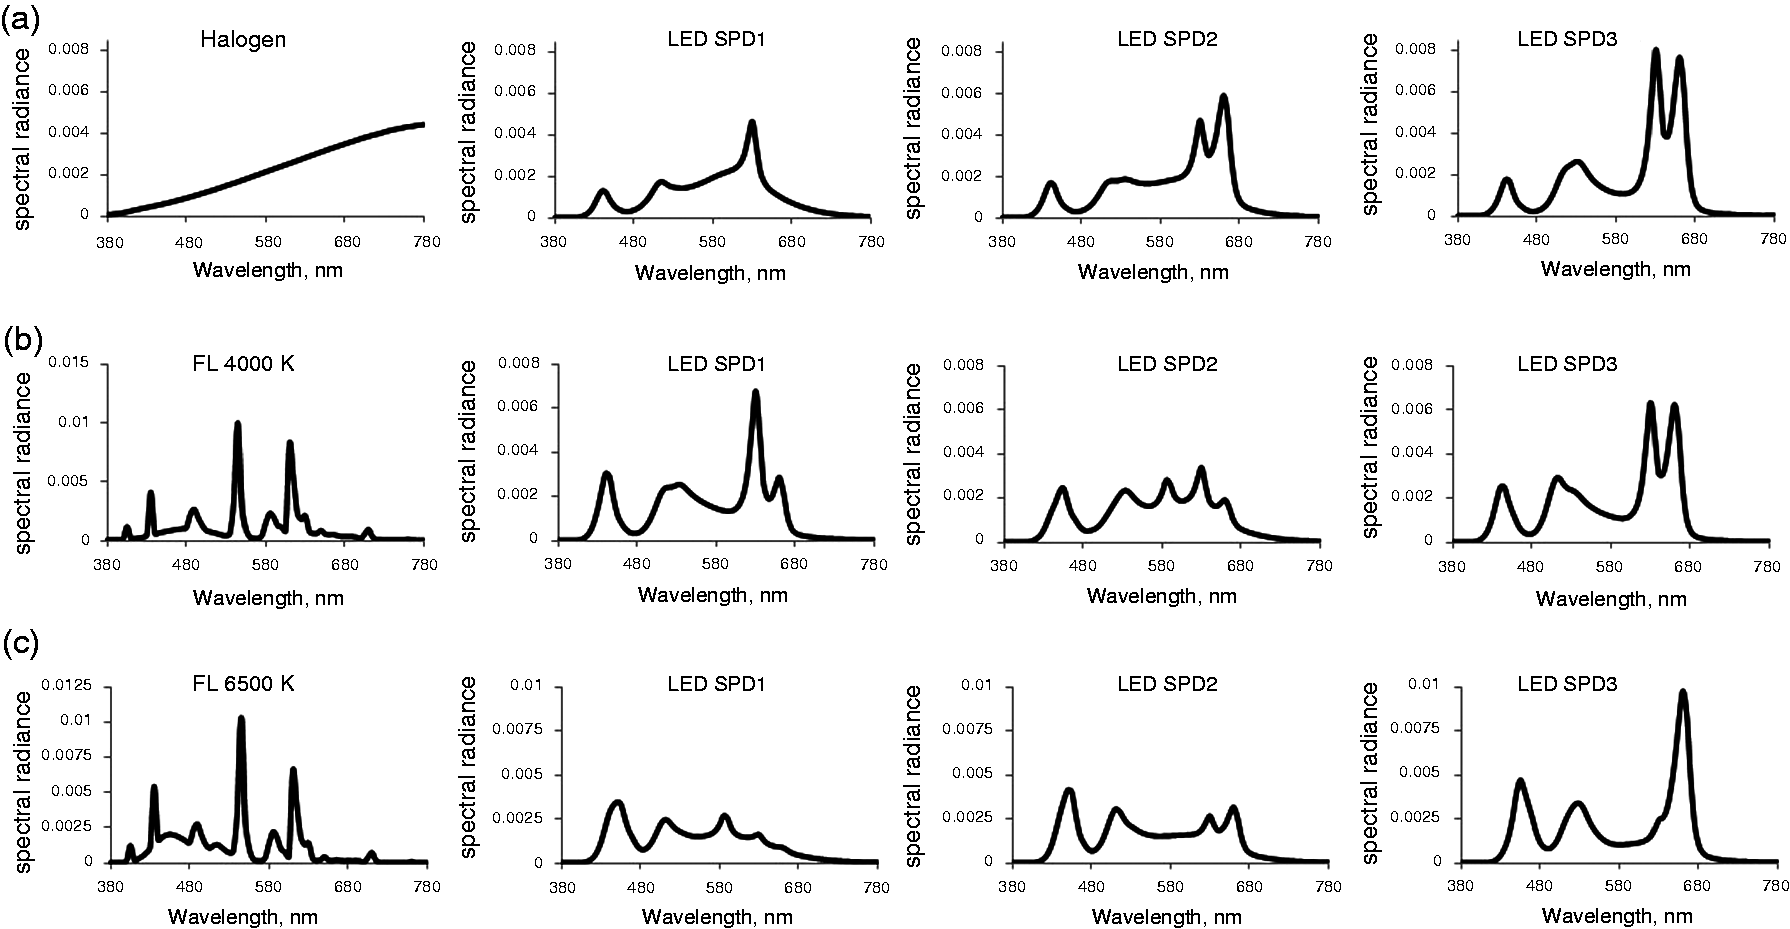
Halogen lamp , Philips Master TL-D 90 De Luxe 18W/940, and Osram 18W/965 Lumilux DE Luxe Daylight as reference light sources at CCTs of 2800 K, 4000 K and 6500 K, respectively, representing warm, neutral and cool white CCTs. Nine different LED SPDs (three spectra each at 2800 K, 4000 K and 6500 K). The LED SPDs were simulated for high, medium and low CIE CRI. LED SPD 1 at 2800 K, 4000 K and 6500 K has high CIE CRI values (Ra > 90). LED SPD 2 has CIE CRI values of around 80, and LED SPD 3 at all three CCTs has low CIE CRI (<60). The SPDs used in the experiment are shown in Figure 2. SPDs used in the experiment at CCT of (a) 2800 K, (b) 4000 K and (c) 6500 K.
2.4 Observers
Twenty observers participated in the experiment (16 male and 4 female). The observers participating had normal visual acuity and colour vision. For measuring visual acuity of the observer, the LEA numbers near-vision chart was used. The value >6/6 was considered as the limit for normal vision. The colour vision was tested with the help of Ishihara pseudoisochromatic plates. The average age and standard deviation for all subjects were 27 years and 4.2 years.
2.5 Procedure
At the start of the experiment, observers spent approximately five minutes to become adapted to the lighting conditions. They were requested to look at one of the cabinets during adaptation. After the adaptation, they were asked to scale the visual colour difference between the corresponding chromatic samples of the MCC charts with the help of a grey scale (1–5) placed in the reference cabinet. They were allowed to switch between two cabinets with both eyes in one field at a time, before making their judgement. The observers had to determine the grade by figuring out the grade in the grey scale (Figure 3) corresponding to the most appropriate change in colour. A grade of 5 is given only when there is no perceived difference in colour or contrast between the sample placed in the reference booth and the sample in the test booth. This method is more precise and takes a shorter time than other methods. However, the method may suffer from incomplete adaptation. The CCTs between the test and reference light sources were made as close as possible so that the chromatic readaptation could be neglected (Table 1). Sándor and Schanda,
11
and Li et al.
14
conducted their studies with the help of a simultaneous colour matching and successive colour-matching technique, respectively, and both studies drew similar conclusions.
The grey scale used in the experiment.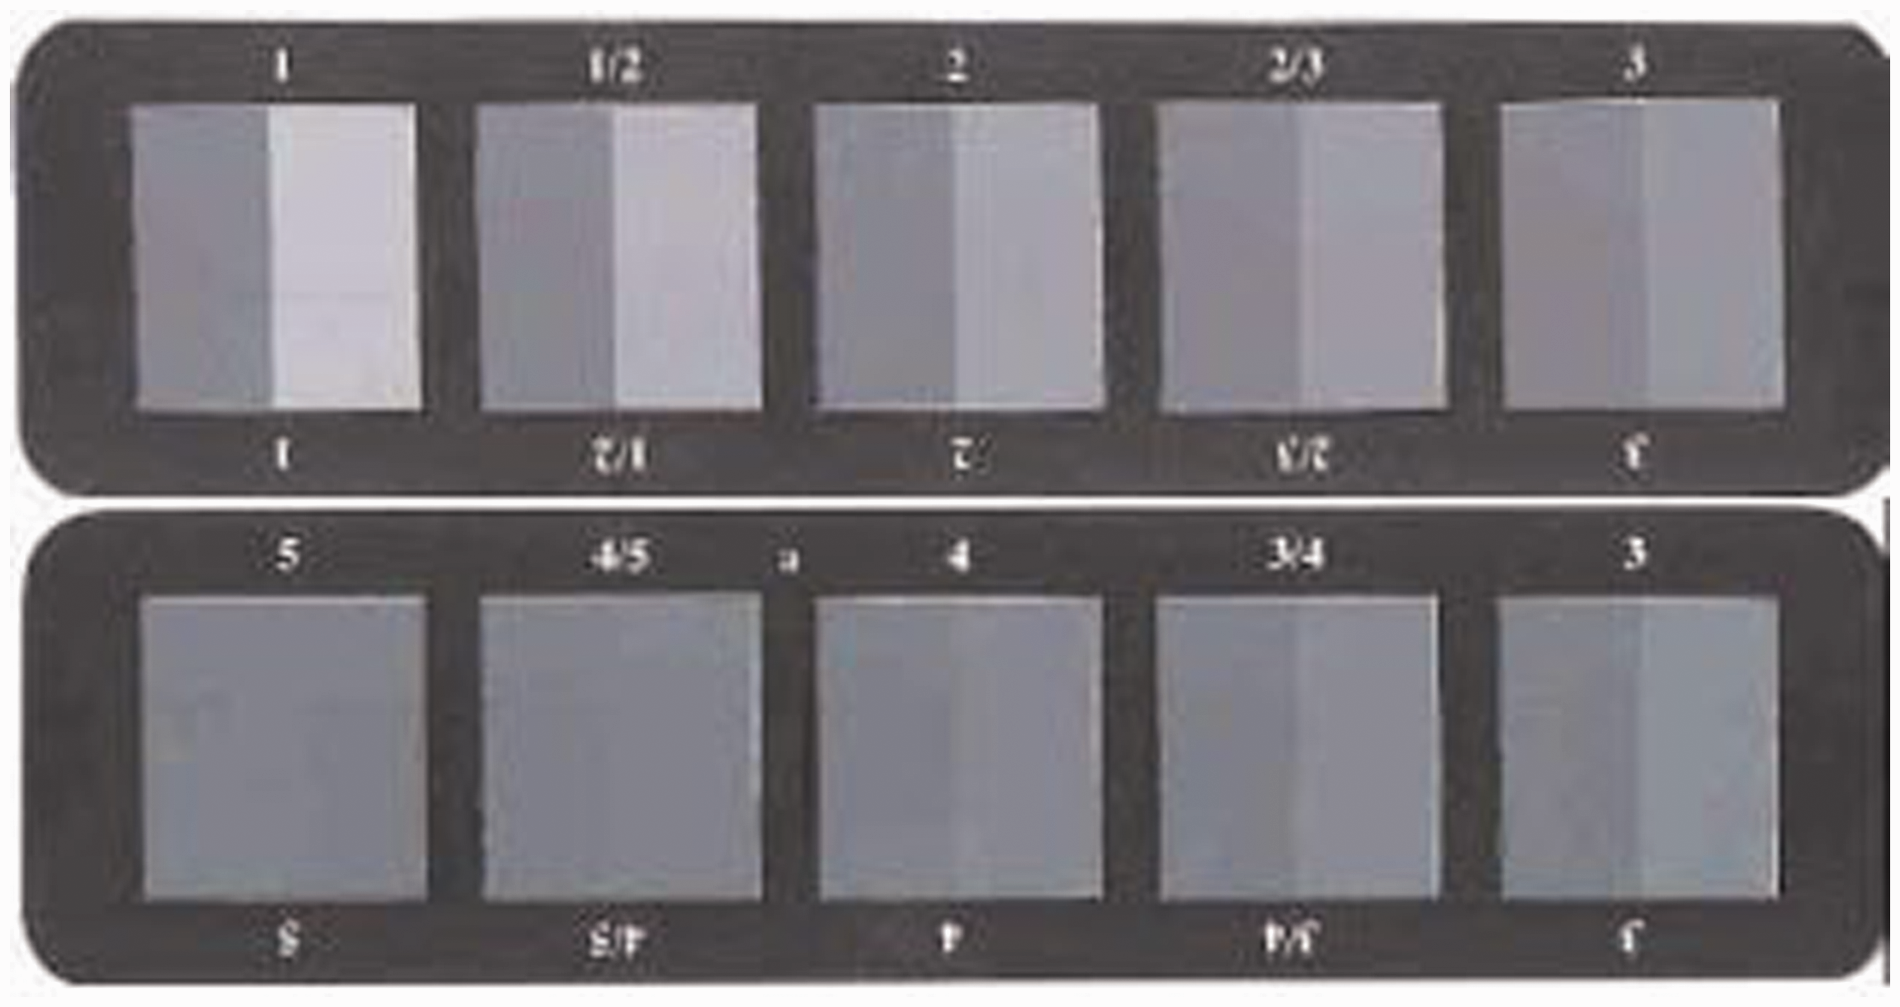
The whole experiment was divided into six sessions. In each session, observers evaluated three test SPDs of the same CCT. A five minute break was given after each evaluation of a lit scene under a light source. Observers were allowed to do only one session each day. In the whole experiment, observers evaluated the same test SPD twice in two separate sessions. In total, 6840 (19 sample pairs × 20 × 2 × 9 test light sources (3 SPDs at each CCT observers) data were accumulated.
3. Results
The results obtained in terms of grades 1–5 from each observer were transformed to visual difference (ΔV) in CIELab colour difference. The average visual differences (ΔV) for each sample under different light sources at different CCTs are shown in Figure 4.
Average visual difference of each colour sample at (a) 2800 K, (b) 4000 K and (c) 6500 K.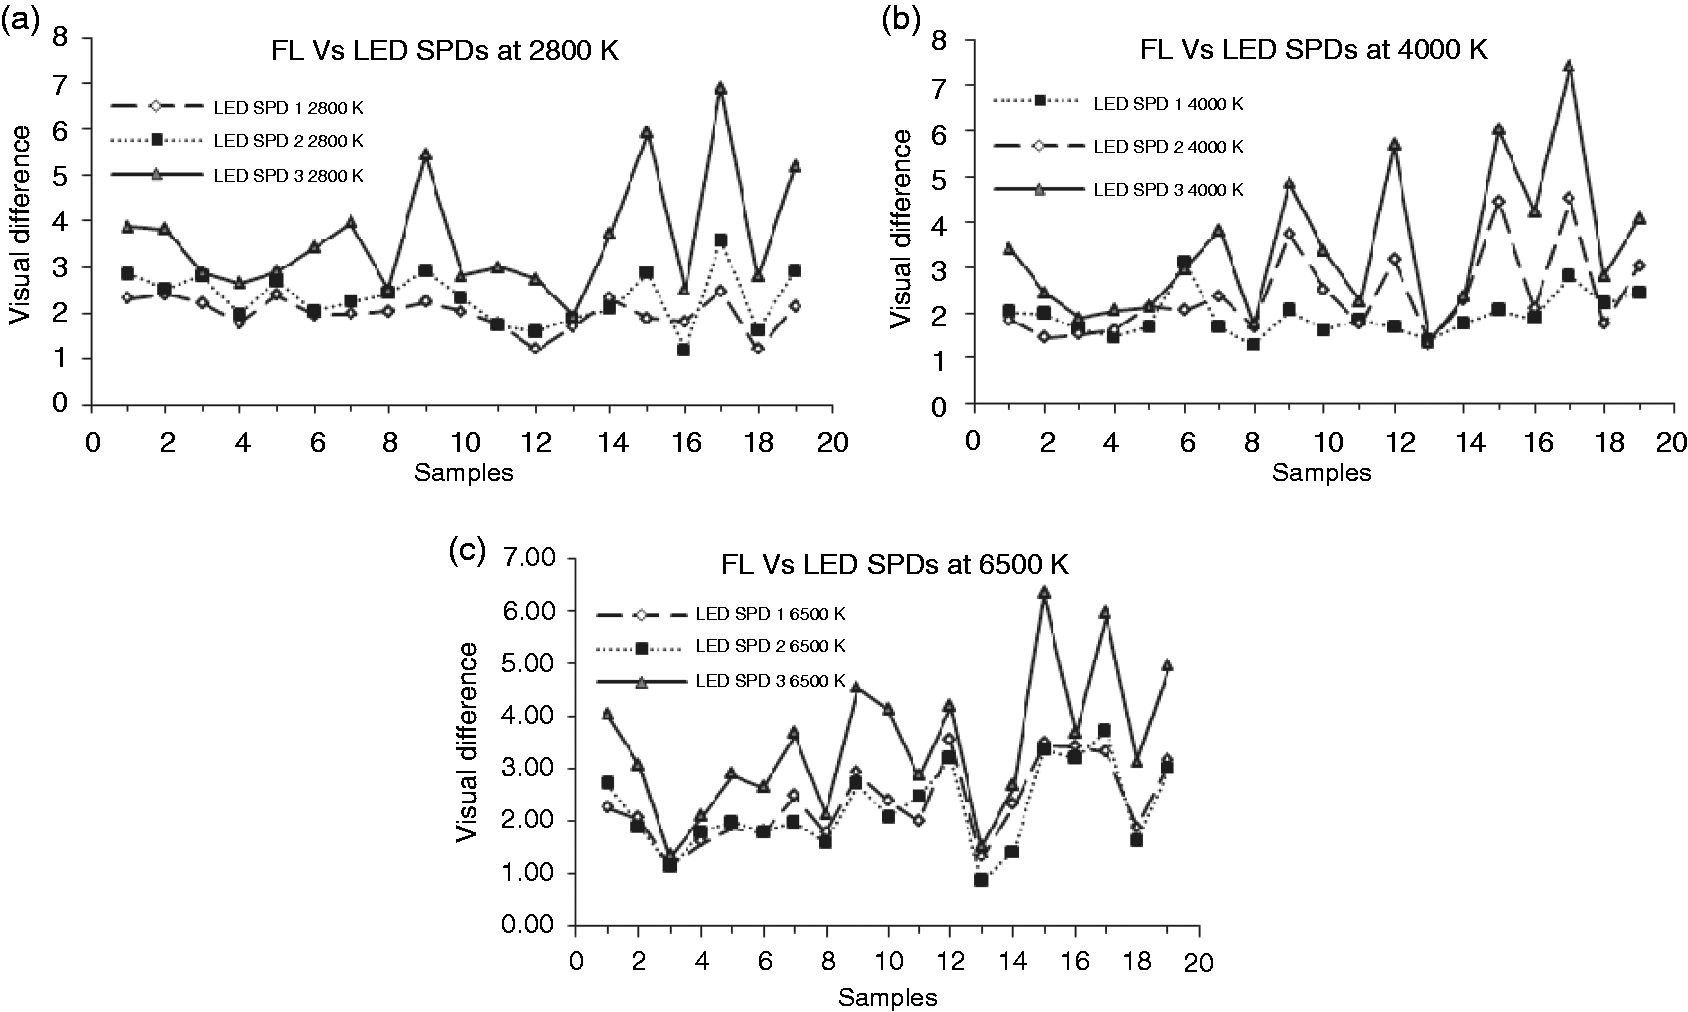
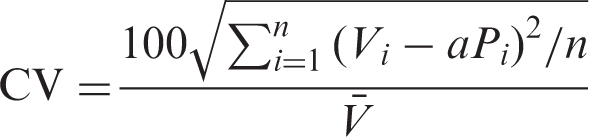
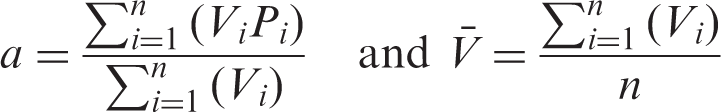
To examine the agreement between the two sets of data compared, a coefficient of variation (CV) was calculated, as done by Li et al.
14
and Luo et al.,
18
with the help of equation (1).
3.1 Observer performance
Observers repeatability and accuracy in CV units.
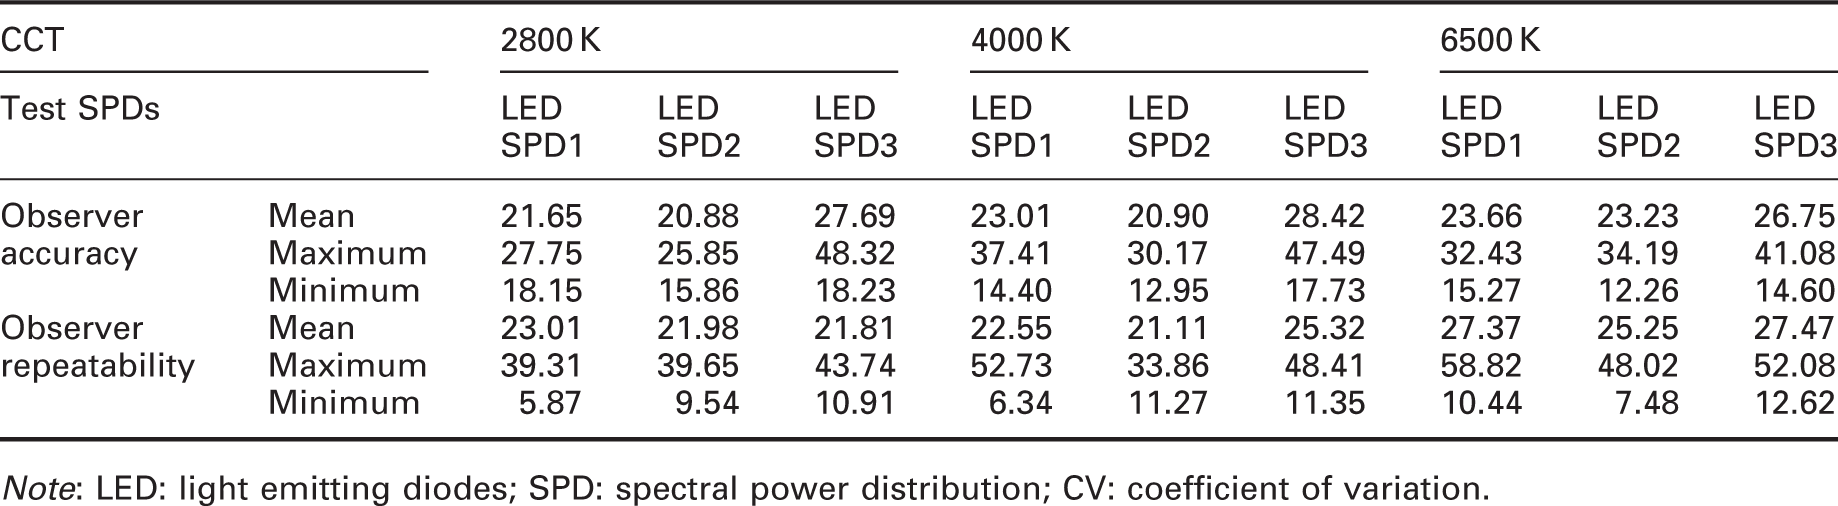
Note: LED: light emitting diodes; SPD: spectral power distribution; CV: coefficient of variation.
3.2 Performance of different CRIs
The SPD for each test source was used to calculate different CRIs: CIE CRI, CRI2012, CQS, CQS colour fidelity (Qf), CQS gamut area scale (Qg), feeling of contrasts (FCI) and the values of these metrics are presented in Table 1. Visual colour difference results (ΔV) were used to test the performance of the indices calculated in Table 1. The visual difference results ranged from 1.9 to 3.7 from the best, LED SPD 1, to the worst, LED SPD 3. The LED SPDs (LED SPD 1 and LED SPD 2), which have high CIE CRI, CQS and CRI2012 values have low visual colour differences. The LED SPD 3 at all three CCTs have higher visual colour differences. Figure 5 shows the visual differences of all test sources plotted on the Y axis against the predictions from different indices on the X axis.
Performance of five indices.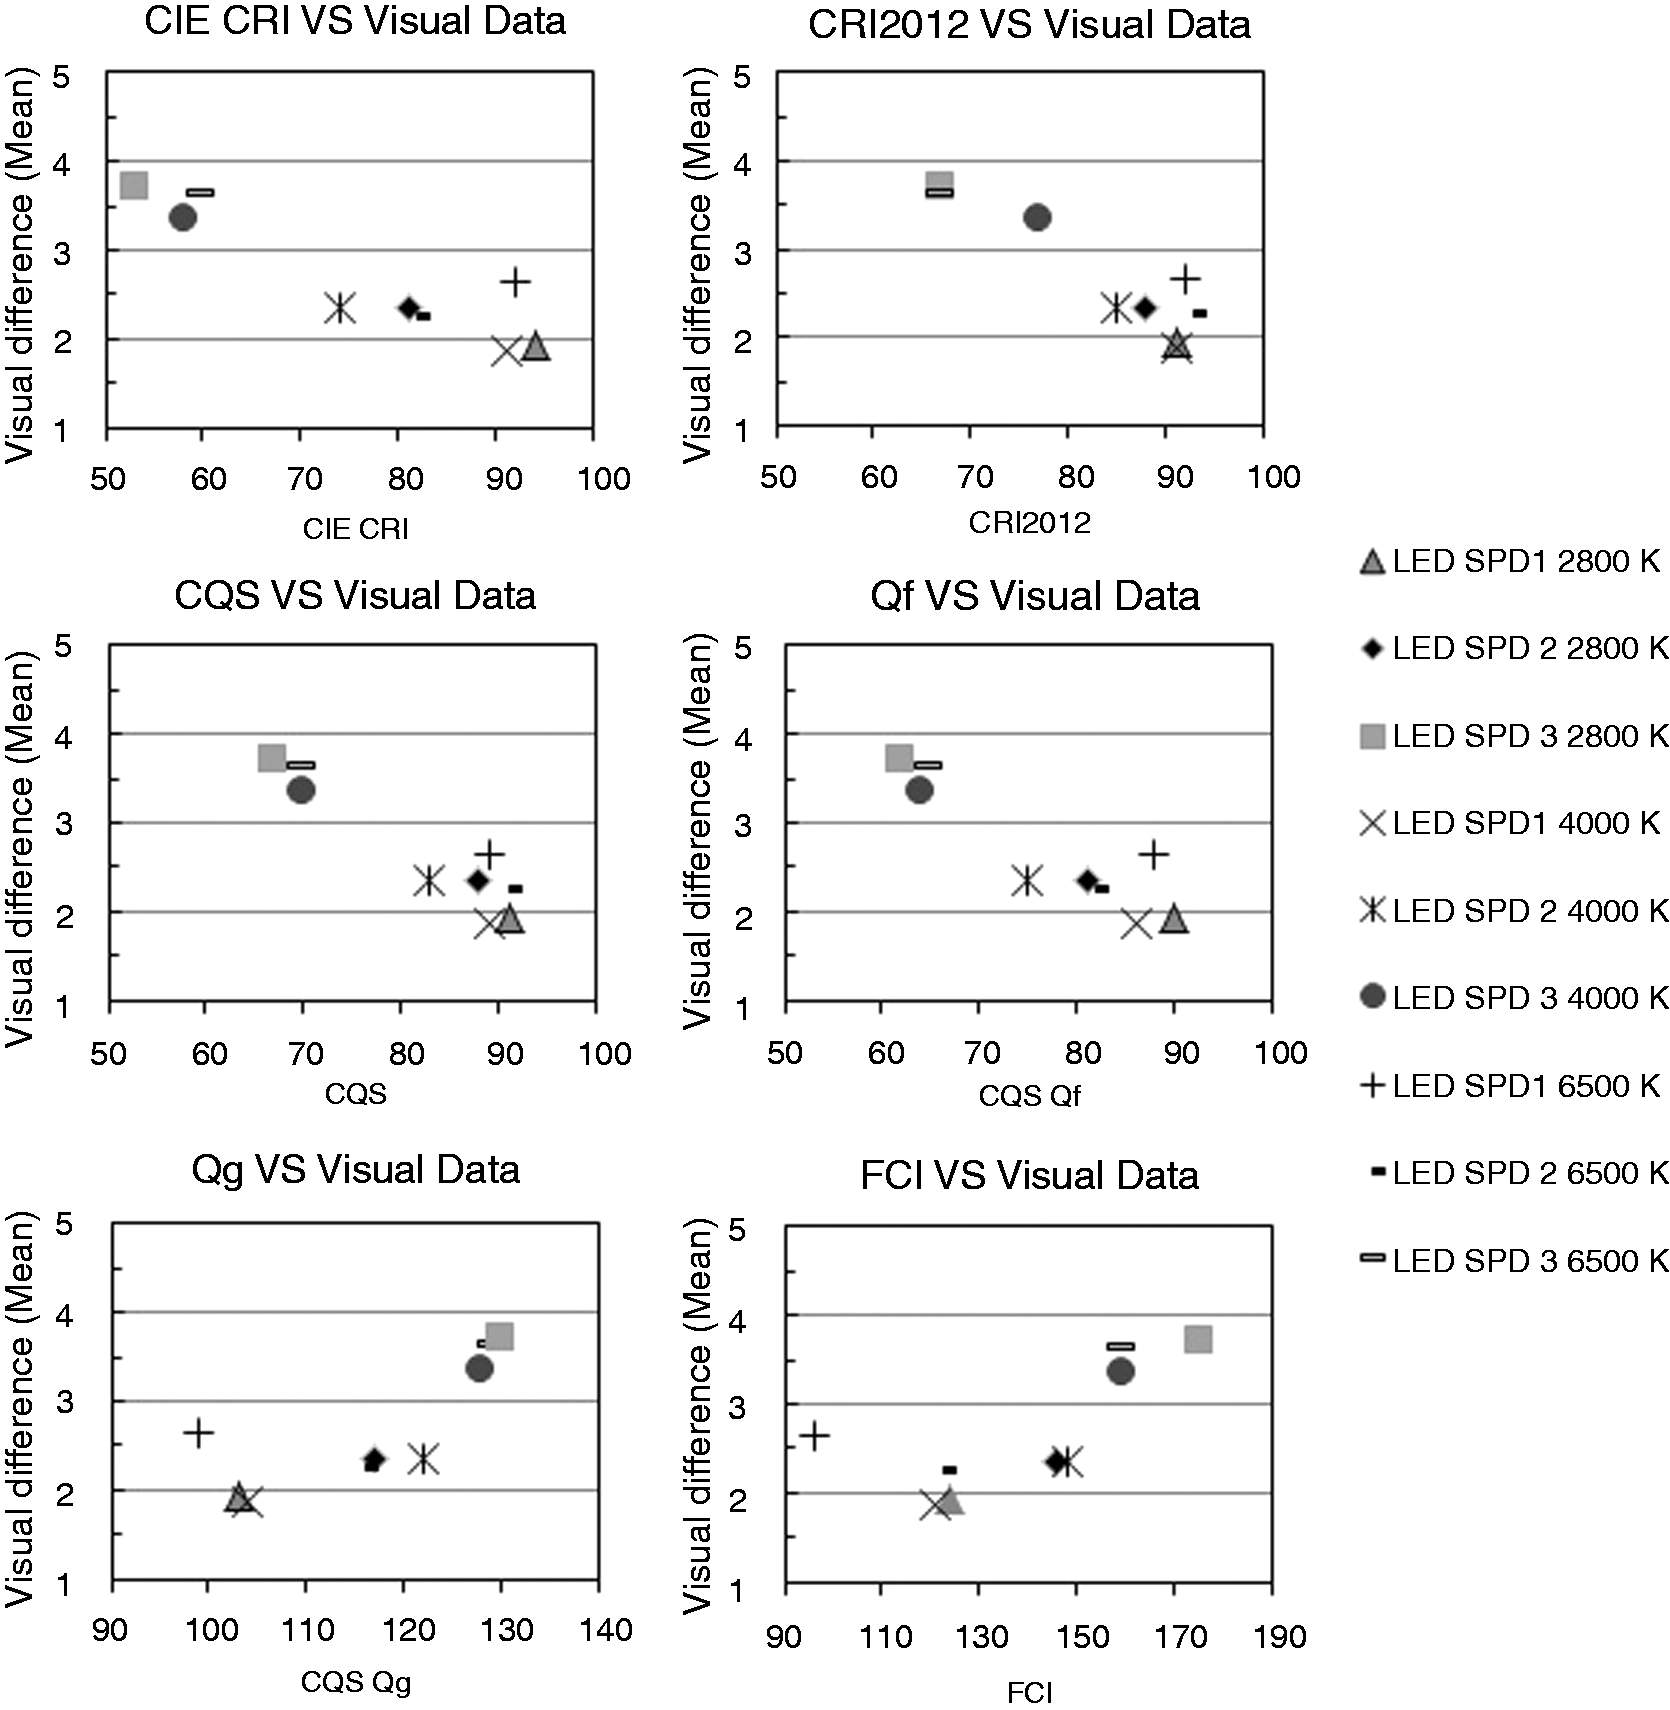
Correlations between visual difference (ΔV) and various indices.
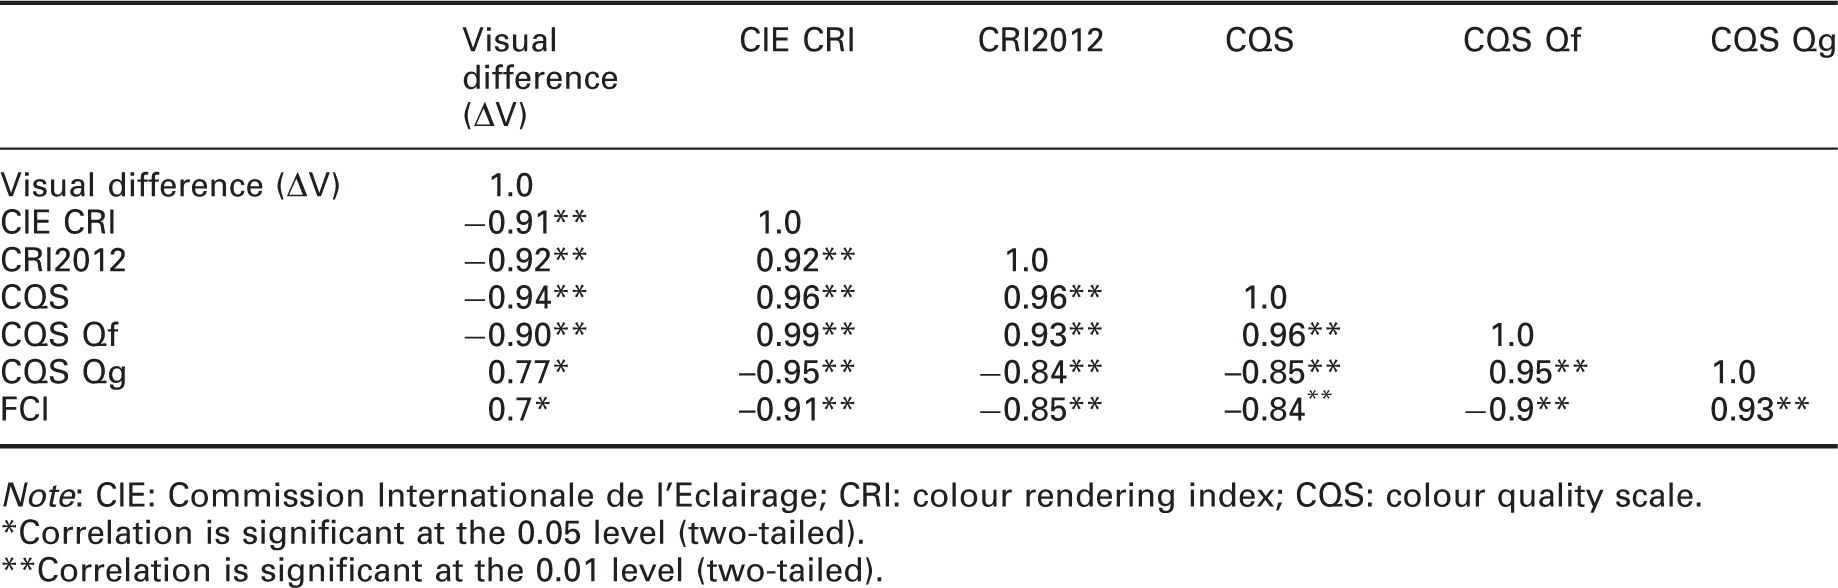
Note: CIE: Commission Internationale de l'Eclairage; CRI: colour rendering index; CQS: colour quality scale.
Correlation is significant at the 0.05 level (two-tailed).
Correlation is significant at the 0.01 level (two-tailed).
4. Discussion and conclusions
The experimental results show that the performances of CIE CRI, CRI2012, CQS and CQS Qf in terms of correlation coefficients (with visual difference) are very similar. This finding supports the studies done by Luo et al.
15
The correlation coefficients for CIE CRI, CRI2012 and CQS were 0.91, 0.92 and 0.94, respectively (Table 3). The Pearson correlation coefficient between CQS and visual difference (ΔV) was slightly greater than other metrics. From Figure 6, it can be seen that LED SPDs that have high CIE CRI (>90), also possess higher CRI2012, CQS and CQS Qf values and test samples had lower visual difference under these SPDs. However, for LED SPDs which have low CIE CRI (≤60) i.e. LED SPD 3 (at all CCTs), CRI2012 and CQS values vary from 67 to 77 and visual difference varies from 3.3 to 3.7. LED SPD 3 at 4000 K has a CQS value of 70 and CRI2012 has the value of 77 and a visual difference of 3.4. On the other hand, for LED SPD 3s at 2800 K and 6500 K, the performance of CRI2012 and CQS was similar, and visual differences were 3.6 and 3.7, respectively.
Comparison of different metrics for different light sources as used in the experiment.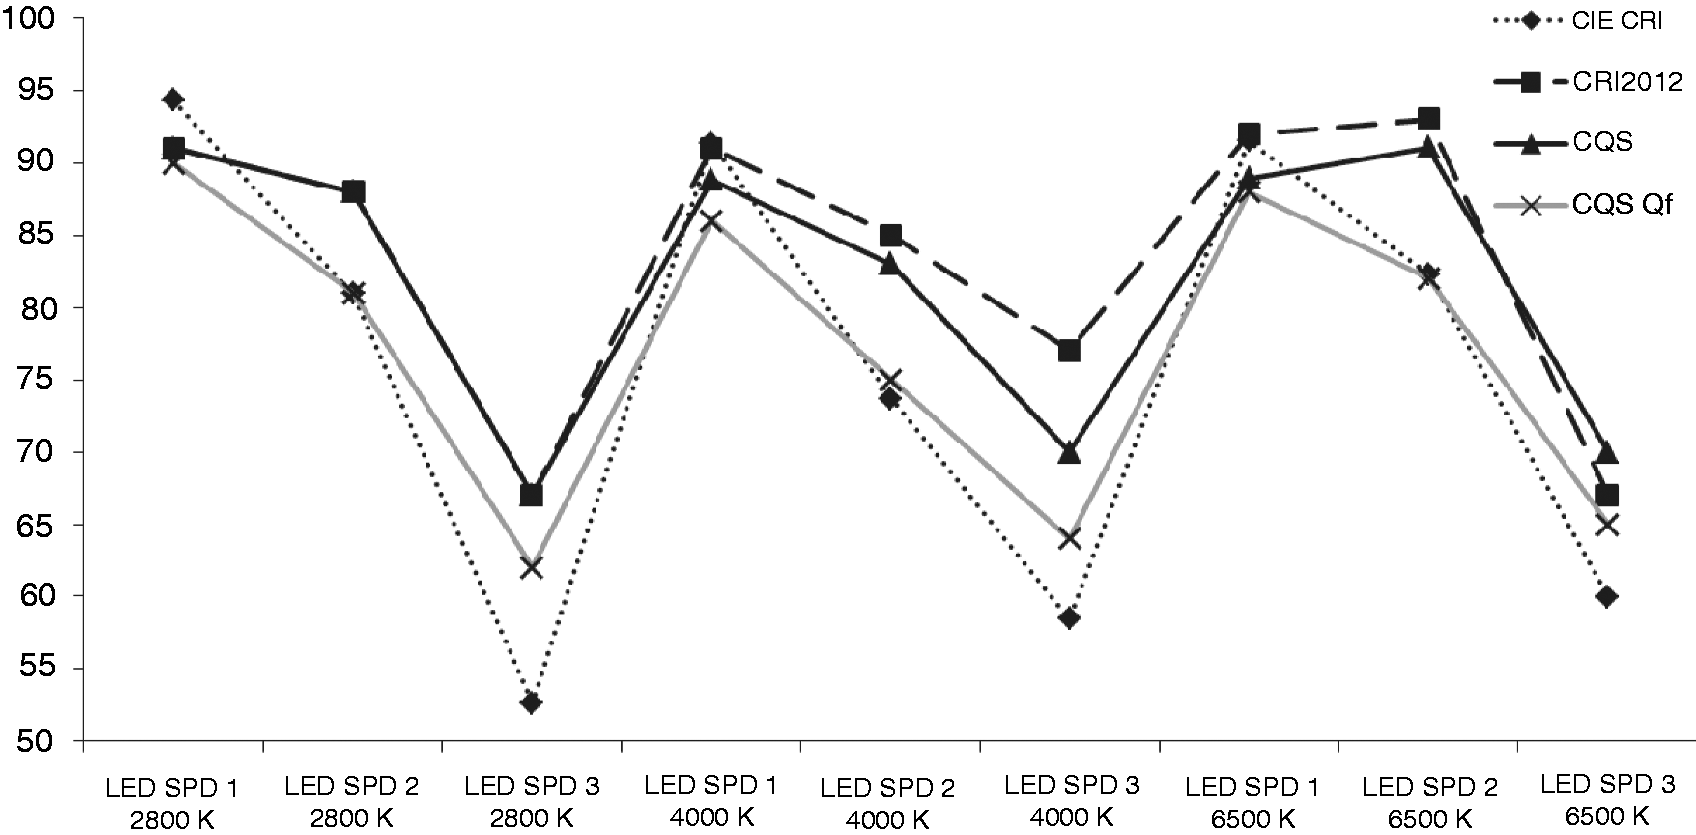
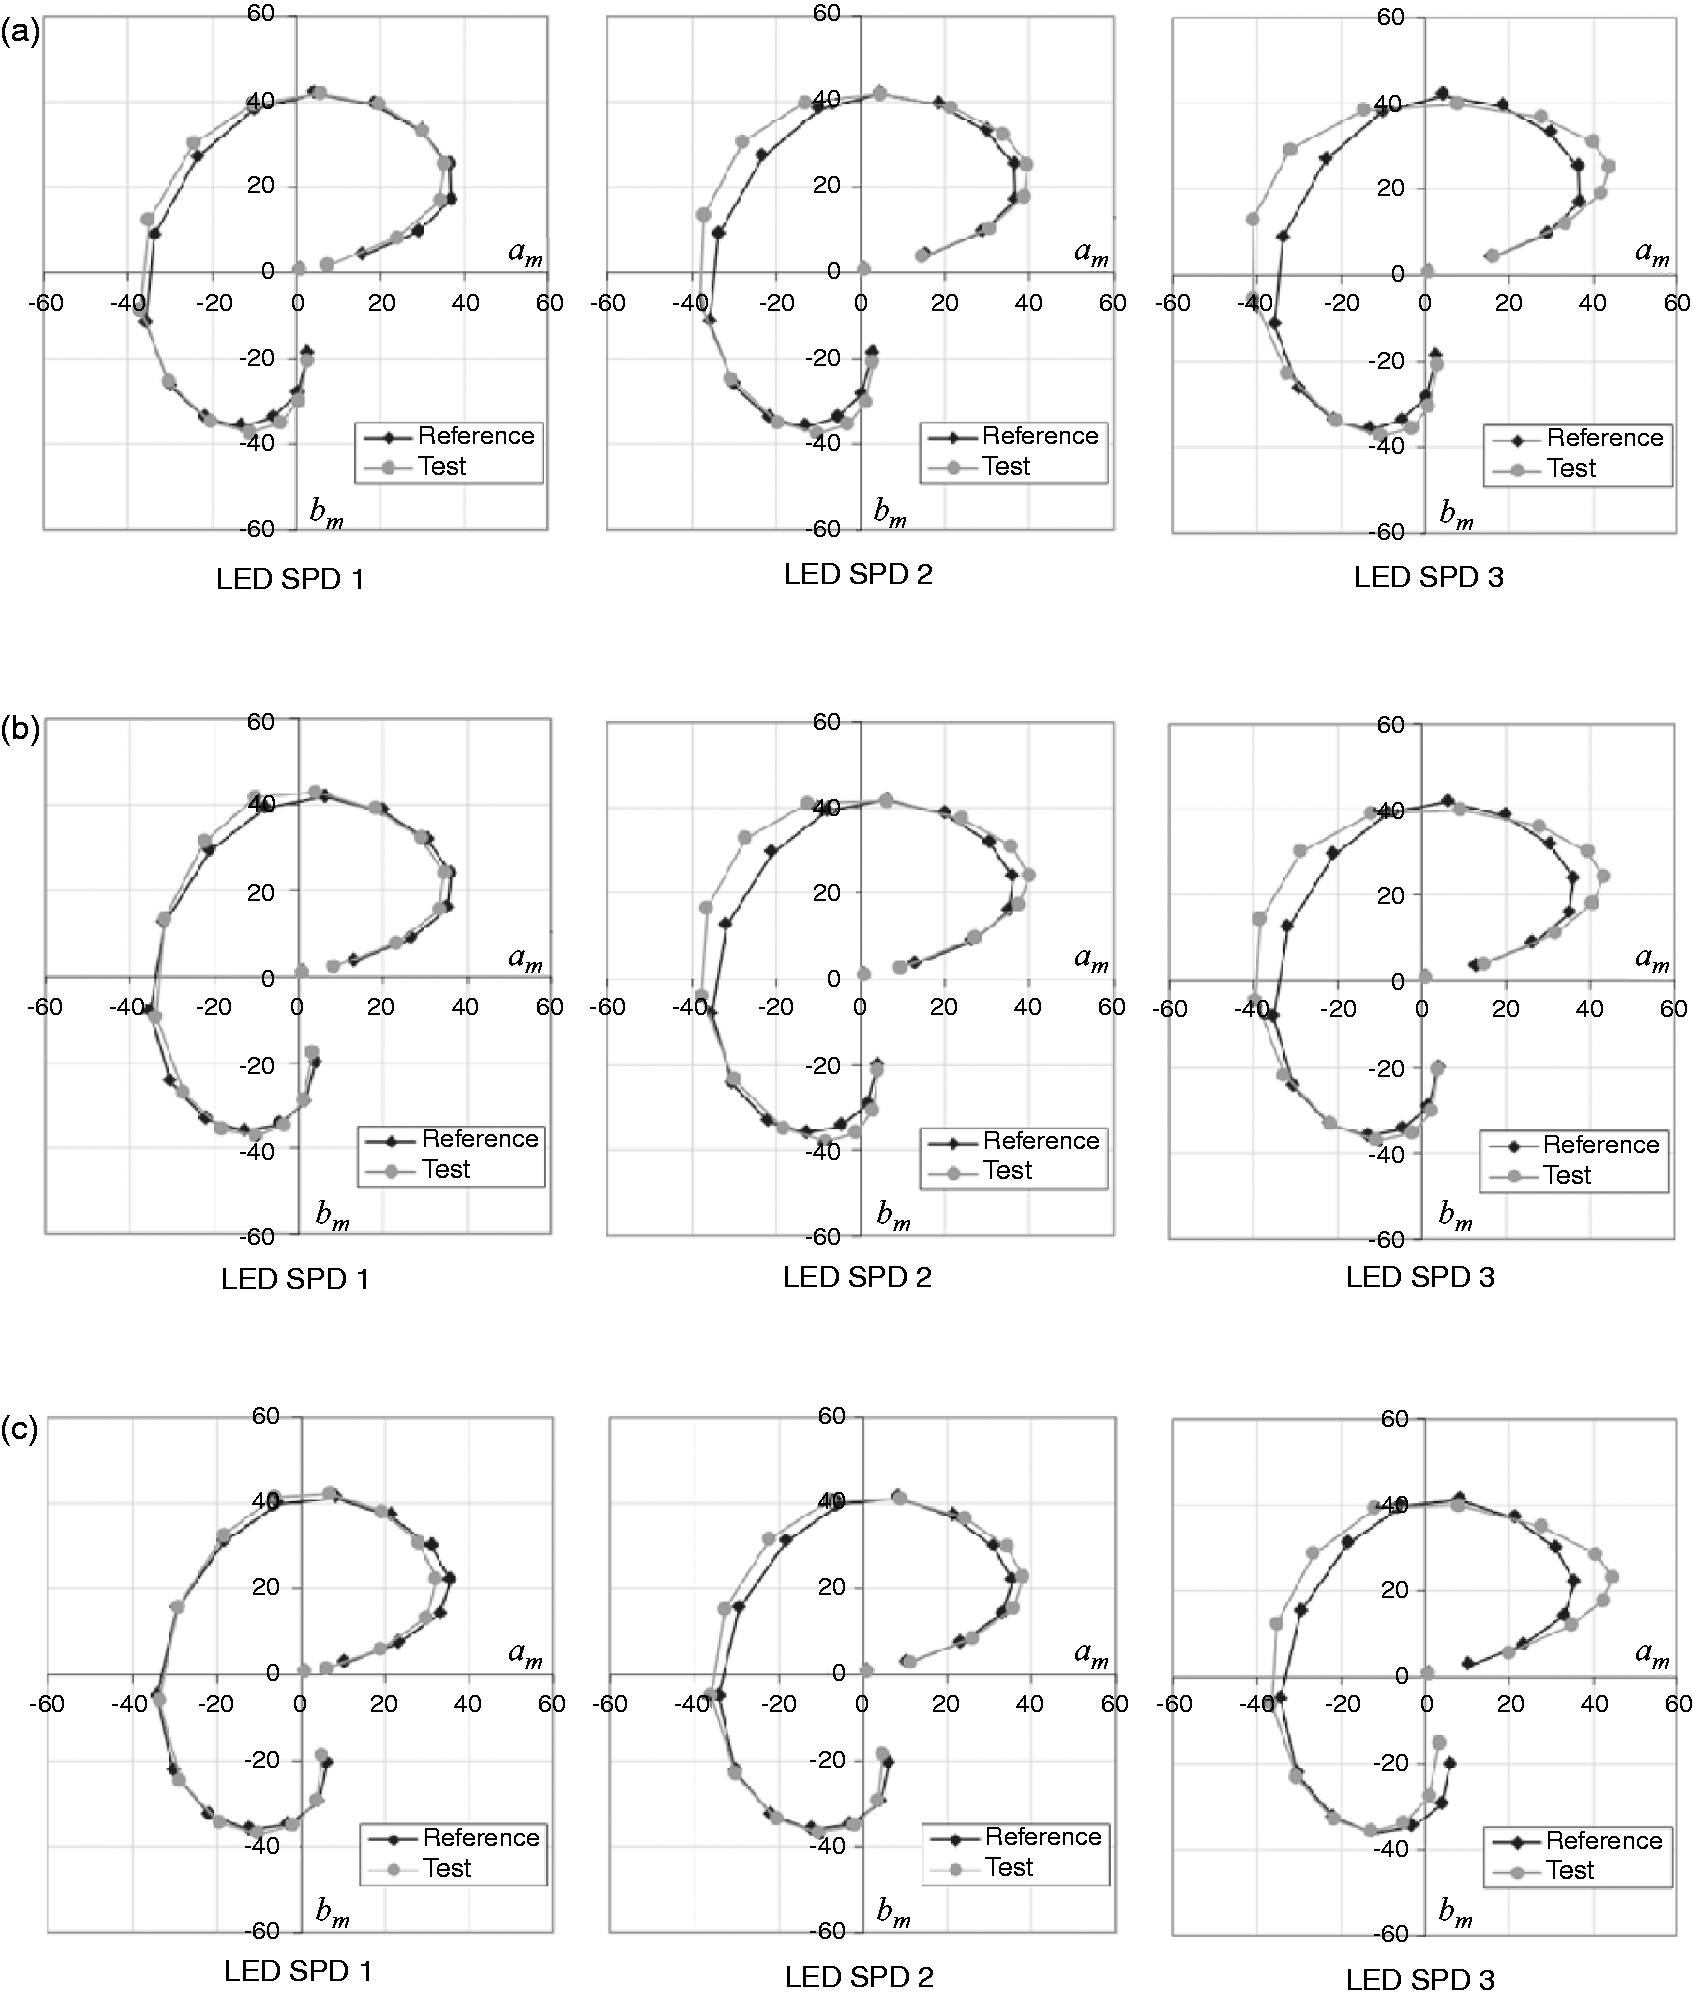
Figure 7 shows the distribution of the 15 test samples (used by CQS) under different light sources used in the experiment plotted in CIELab colour space when illuminated by the test source and its reference source. It can be seen from Figure 7 that most of the test samples under LED SPD 3 have a larger chroma than under the reference light sources. CIE CRI penalises a change in chroma,
8
so LED SPD3s had low CIE CRI. As CQS does not penalise the increase of chroma, CQS values of LED SPD3s were higher than Ra values. From Figures 8 and 6, it can be seen that CRI2012 also does not penalise the light sources that increase chroma, either. A larger difference in the prediction by CQS and CRI2012 was seen for LED SPD 3 at 4000 K (Figure 6). That difference was of 7 points. CQS only penalises the light sources, which increase chroma beyond CIELab coordinates of the 15 samples used by CQS when illuminated by the test source (grey) and the reference source (black) at (a) 2800 K, (b) 4000 K and (c) 6500 K. CIECAM02-UCS coordinates of the HL17 samples used by CRI2012 when illuminated by the test source and the reference source at (a) 2800 K, (b) 4000 K and (c) 6500 K.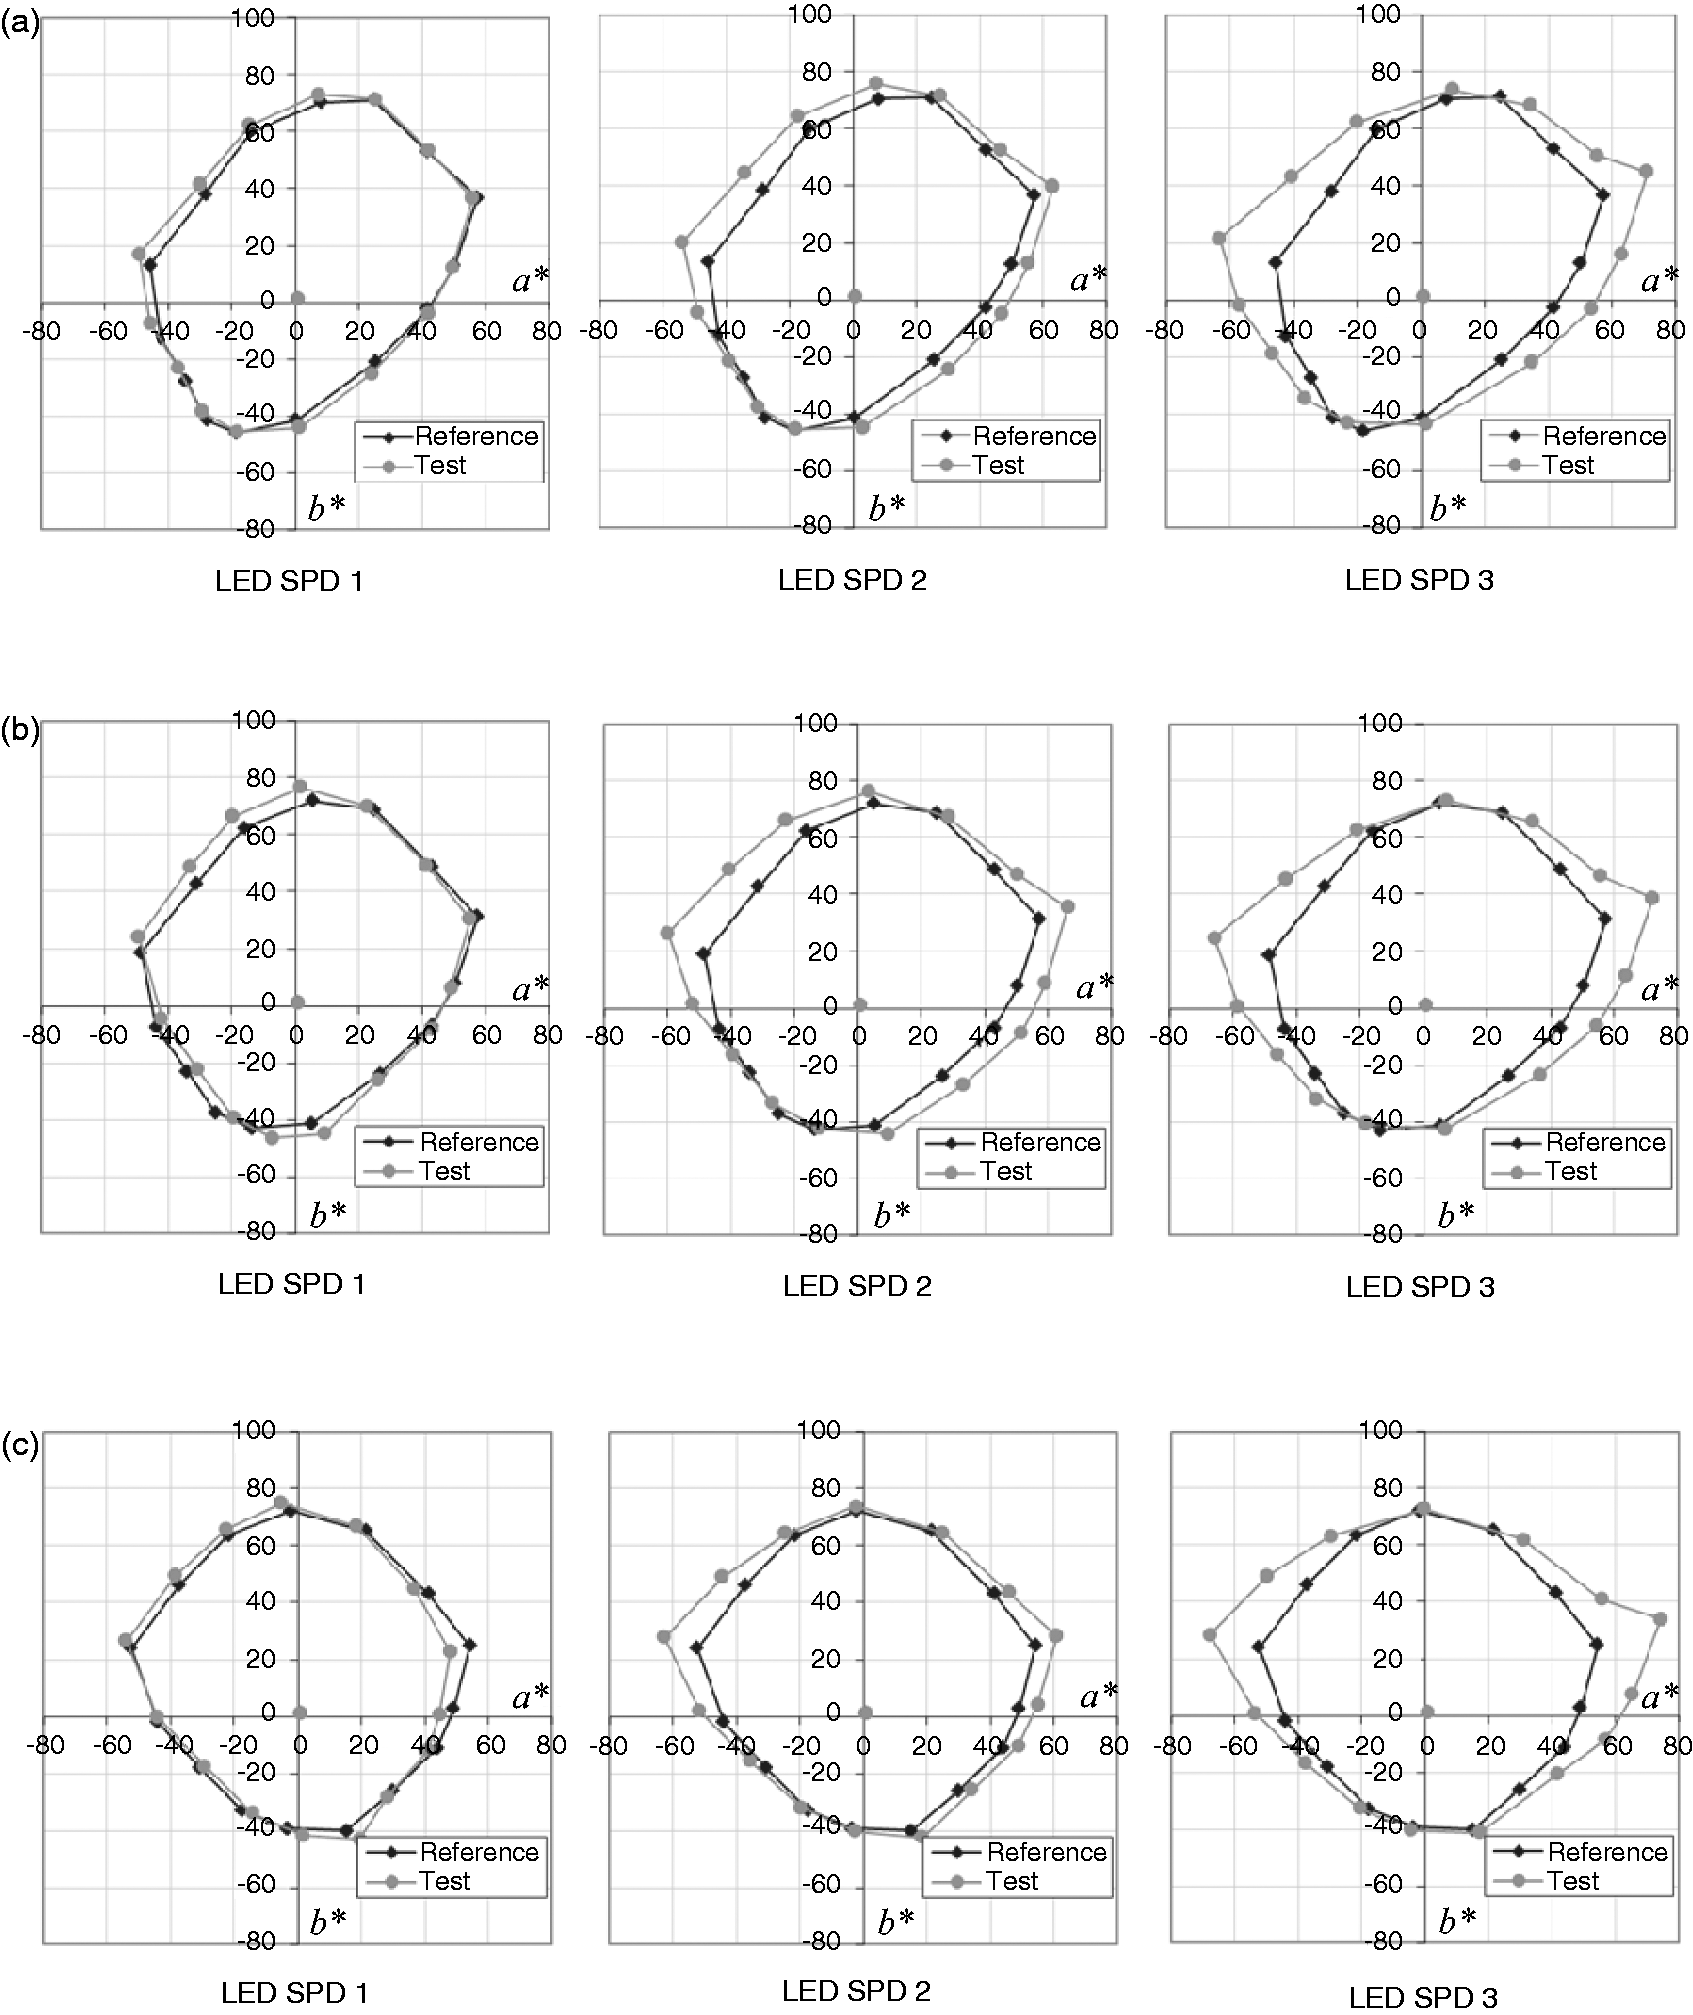
The results show that CIE CRI, CRI2012 and CQS provide similar predictions for LED light sources that do not highly increase chroma. The prediction of colour fidelity by CIE CRI for an LED light source that enhances object chroma was the worst and the prediction of colour fidelity provided by CQS was better than by other metrics. From this study, it can be seen that the colour fidelity predictions of CQS and CRI2012 were satisfactory except for the LED SPD3 at 4000 K. However, more experimental data using LED light sources that highly increase object chroma and using experimental materials that correspond to everyday materials such as stone, leather, jewellery, variety of foods and fabrics for which people care about colour fidelity are required before choosing final colour fidelity metrics.
Footnotes
Acknowledgement
The authors gratefully acknowledge every one of the 20 subjects who gave their time for this research. The authors would also like to thank Dr. Kevin A.G. Smet and Professor M. Ronnier Luo for providing valuable suggestions.
Funding
This work was carried out in the Light Energy project funded by Aalto University in the Aalto Energy Efficiency Research Programme.