
Abstract
Providing subjective impressions of security is central to outdoor lighting design. Current parking lot lighting recommendations are based upon photopic illuminances, regardless of spectrum. Scene brightness perception is directly related to impressions of security, and depends upon both light level and spectrum. A provisional model was used to predict scene brightness for three parking lots, each illuminated to different levels by different light sources. Observers judged scene brightness, security and other factors for each lot. The provisional model accurately predicted both scene brightness and security judgements. The lighting associated with the best subjective ratings also had the lowest power density. A design method using ‘brightness illuminance’ is presented, which can lower system costs while maintaining a sense of security by users.
1. Introduction
Higher photopic illuminances are typically recommended for outdoor spaces where good visual performance is needed. 1 The North American industry standard 2 for parking lot lighting design, for example, recommends higher illuminance levels for potential vehicle conflict points, such as vehicle entrances and exits. In addition to supporting good visual performance, an important lighting design criterion to consider for parking lot lighting is providing pedestrians with a sense of personal security and safety.2–4 Dimly illuminated parking lots are perceived as less safe and secure relative to those illuminated to higher light levels.5,6
A variety of studies have been published indicating that both light level and light spectrum affect how bright a scene appears.5,7–12 Scenes illuminated to higher light levels will appear brighter and, for the same photopic illuminance, outdoor scenes illuminated by cooler light sources will also appear brighter. 9 Despite this research, current recommendations for parking lot lighting are based upon photopic illuminances without regard to the spectral characteristics of the light source.
A provisional model of the spectral sensitivity of scene brightness perception has been published.
9
Research continues to provide greater insight into the phenomenon as well as the neurophysiology underlying scene brightness perception.
10
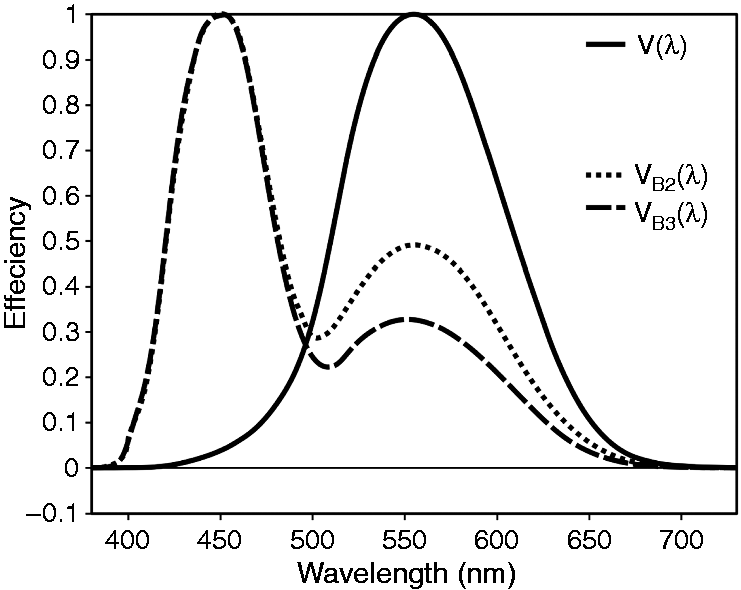
Figure 1 shows two, very much simplified, luminous efficiency functions based upon early developments of that evolving provisional model: one, denoted VB3(λ), for ‘high’ levels like those found in commercial applications such as schools and offices, and one, denoted VB2(λ), for ‘low’ levels that might be found for outdoor applications such as parking lots.
13
These luminous efficiency functions are comparable to the photopic luminous efficiency function, V(λ), also shown in Figure 1, whereby the spectral power distribution of any light source can be used to calculate photometric quantities such as illuminance and luminance.
Three luminous efficiency functions, the photopic luminous efficiency function [V(λ)], and two brightness luminous efficiency functions [VB2(λ) and VB3(λ)] from Rea
13
Power density (W/m2) is also an important design consideration for parking lot applications. (Of course, other factors such as initial/life-cycle costs and maintenance requirements are also important for light source selection.) It is common practice to compare power densities required by different lighting systems for a given lighting installation where a specific photopic illuminance is recommended or prescribed. 14 Using conventional photometry based upon the photopic luminous efficiency function [V(λ)], high pressure sodium (HPS) has often been the source of choice for outdoor lighting applications because, for a given recommended photopic illuminance, the power density would be less than that required by other light source types. However, light-emitting diodes (LEDs) have recently become a viable source for outdoor lighting applications because the photopic luminous efficacy of these sources has become comparable to HPS. The first costs of LED systems are greater than those of HPS, limiting their widespread application. A common estimator’s guide for construction costs, 15 for example, put LED cobra head luminaires ($1800; all costs are in US dollars) at about three times the cost of comparable HPS cobra heads ($580).
The present study was primarily designed to validate predictions of scene brightness based upon the provisional model by Rea et al. 9 For example, scenes illuminated by sources that produce ‘white’ light, like LEDs, should be perceived as brighter by a predictable amount than ‘yellow’ HPS at the same photopic illuminance. Since a formal link has previously been established between scene brightness and perceived sense of security, 16 a given perceived brightness level should also provide a predictable impression of personal safety and security. A second study goal was to determine how lighting design based upon a prescribed brightness criterion, and consequently a predictable impression of personal safety and security, might be used to systematically reduce power densities for parking lot applications. By reducing power densities to meet a prescribed criterion of perceived safety and security, the life-cycle cost of an LED system becomes more attractive for wider application.
The present study was conducted on the University of Washington campus in Seattle, Washington, USA. Photometric measurements and subjective evaluations were collected by researchers at Rensselaer’s Lighting Research Center (LRC) in collaboration with those at the Seattle Lighting Design Lab (SLDL).
2. Method
2.1. Measurement sites
Lighting systems in the three parking lots.
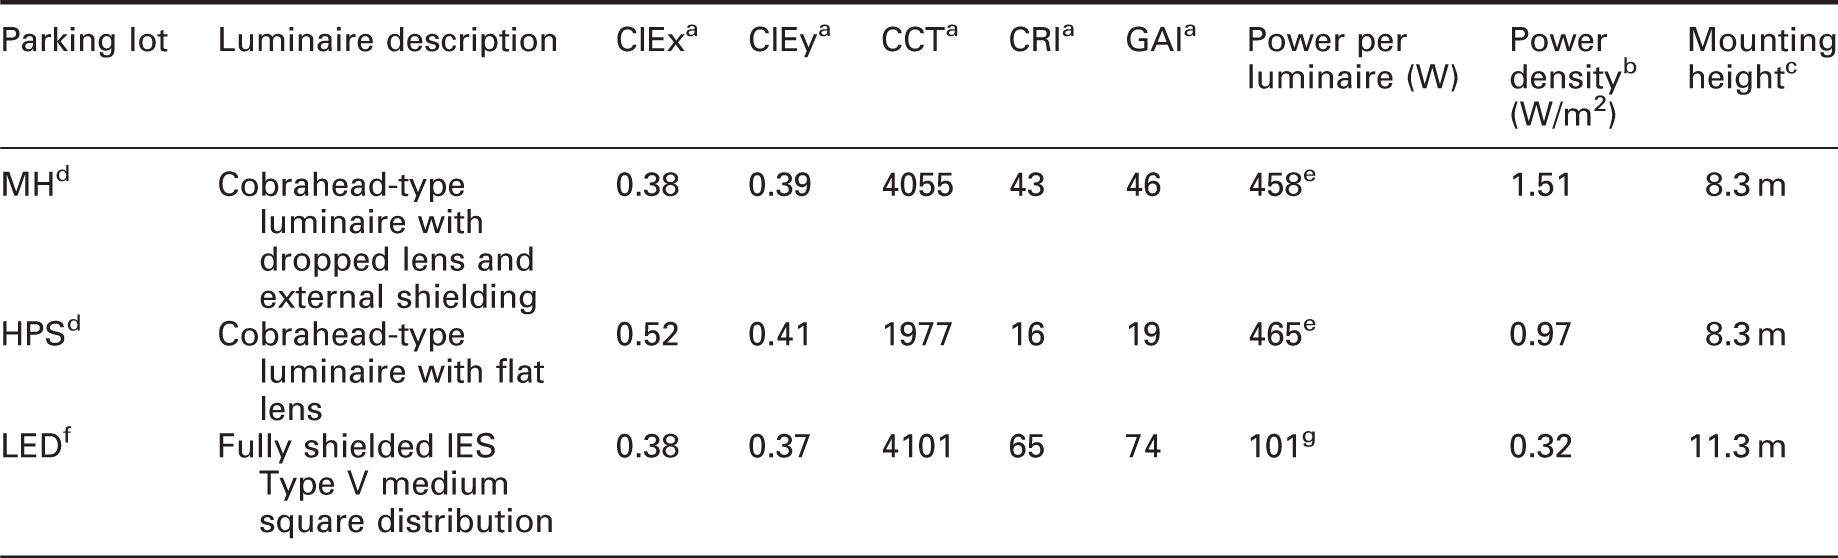
Note: MH: metal halide; HPS: high pressure sodium; LED: light-emitting diode; CIEx and CIEy: Commission Internationale de l'Éclairage 1931 chromaticity coordinates; CCT: correlated colour temperature; CRI: colour rendering index; GAI: gamut area index (see Reference 13).
Based upon on-site spectroradiometric site measurements.
Power density assumptions: 101 W per LED head, two staggered heads per ‘bay’ (defined in Section 2.2), with an area of approximately 621 m2 per bay; 465 W per HPS head, with an area of approximately 472 m2 per head; 458 W per MH head, with an area of approximately 301 m2 per head.
As reported by facilities personnel at University of Washington.
Luminaire distribution types for existing MH and HPS luminaires were unavailable.
Estimated according to Leslie and Rodgers. 6
Reference condition.
As reported by LED luminaire manufacturer.
2.2. Photometric and radiometric measurements
Photometric measurement summary of (a) photopic illuminance; (b) brightness illuminance; and (c) uniformity ratios in the three parking lots.
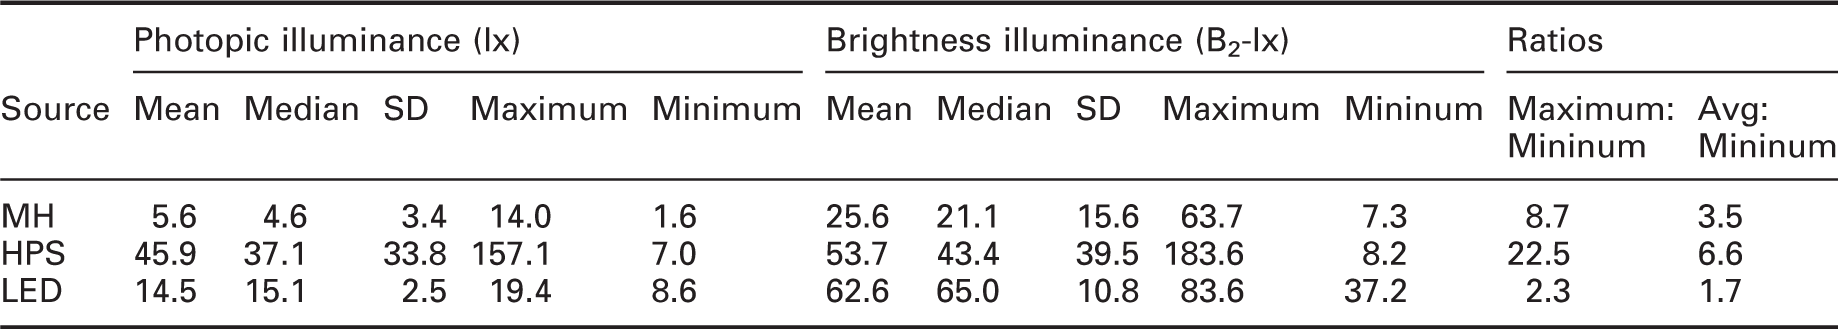
Note: MH: metal halide; HPS: high pressure sodium; LED: light-emitting diode.
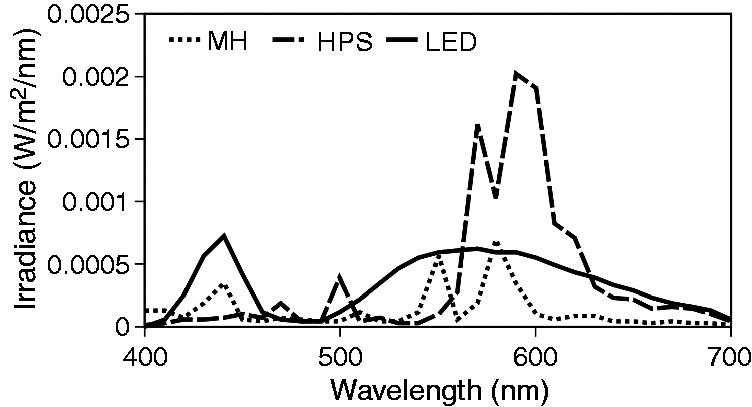
LRC researchers sampled spectral irradiance distributions (SIDs) at the three parking lot sites using a spectroradiometer with a remote sensor (Ocean Optics, USB650); a laptop computer was used to store and process the spectral data. Two steps were taken to determine the ‘brightness illuminance’ provided by the different lighting systems. First, the raw SID values were converted into photopic illuminance using the conventional photopic luminous efficacy function (Figure 2) and then scaled to equal the measured photopic illuminance values from Table 2. Figure 3 shows the SID values, scaled to the average photopic illuminances from Table 2. From the scaled SID values, the VB2(λ) luminous efficiency function from Rea
13
was applied using the conventional unit conversion of 683 lm/W at 555 nm (Figure 2). An equivalent method for determining brightness illuminance would be multiplying the wavelength-specific photopic illuminance values by a brightness (B2)/photopic (P) ratio for each light source, whereby the ratio of VB2(λ) to V(λ) is multiplied by the scaled SIDs; the B2/P ratios are 4.32 for the LED source, 1.17 for the HPS source and 4.55 for the MH source. Table 2 provides the descriptive statistics for the three parking lots based upon brightness illuminance (B2-lx). Uniformity ratios are also provided in Table 2; these ratios are identical for both of the photopic and brightness illuminance distributions.
Luminous efficacy functions based upon the photopic luminous efficiency function [V(λ)] and the B2 luminous efficiency function [VB2(λ)] from Rea
13
Average measured spectral irradiance distributions (SID) from the three parking lots, each illuminated to different levels by different light sources (MH, HPS and LED)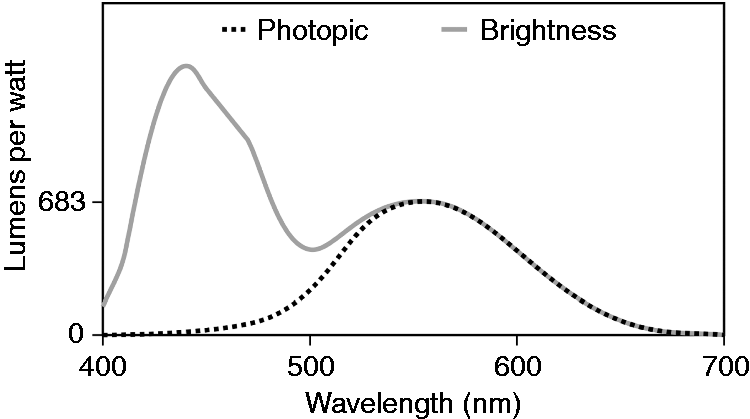
2.3. Procedures
In December 2014, researchers at the SLDL recruited 18 (7 female) adults (mean age = 46 years) to provide subjective assessments of brightness during one night in the three parking lots on the University of Washington campus. All three parking lots were mostly devoid of parked vehicles and other pedestrians during the experimental sessions. Subjects met near the parking lot illuminated by the LED sources. Weather conditions consisted of occasional light mist. The parking lot surfaces were initially dry, but towards the end of the nighttime session, they were beginning to become wet.
Instructions were given to all subjects at the same time. Each was provided with a pen and a clipboard containing five copies of a questionnaire, one to be completed at the first parking lot and two each to be completed at the other parking lots. The questionnaire comprised 10 Likert-type scale ratings, ranging, qualitatively, from ‘completely agree’ to ‘completely disagree’ and, numerically, from +2 to −2 (see Appendix). Each rating scale was associated with a different perceptual aspect of the parking lot lighting, ranging from a sensation of glare to a psychological sense of personal safety. All subjects saw the LED lot first and together as one group. They were told that the brightness of the LED lot should be rated as a 10 and that the subjective brightness levels of the other two lots that they would be seeing would be rated relative to this value; if a subsequently seen parking lot appeared brighter than the first parking lot, then it should be given a number greater than 10 proportional to its relative brightness. Similarly, if another parking lot appeared dimmer than the first parking lot, it should be given a number proportionally less than 10. Both magnitude estimations of the parking lot brightness and responses to a Likert-type scale rating about the brightness of the lot were used as independent assessments of the perceived brightness of each parking lot.
A bus transported the subjects to the other two parking lots, located near each other. For logistical convenience, the subjects were divided into two groups when they arrived at the drop-off location near the two parking lots; one group walked to the parking lot illuminated by the HPS sources, while the other walked to the parking lot illuminated by the MH sources. Two viewing locations at each parking lot had been previously identified by the researchers, one view was across the shorter side of the parking lot and the other was along the longer side. Participants provided subjective assessments at each of the two viewing locations for both HID lots. The two groups of subjects moved to the other parking lot and repeated their subjective assessments at both viewing locations. After completing the final questionnaire, subjects were transported back to the LED site to submit their completed questionnaires and collect a small incentive gift card. The protocol was approved by Rensselaer’s Institutional Review Board (IRB).
3. Results
Overall, most subjects judged the LED parking lot to be neither too bright nor too dark (Figure 4), indicating that the light levels in this lot, which served as a reference condition, were not considered extremely high nor extremely low.
Subjective brightness assessment of the reference (LED) parking lot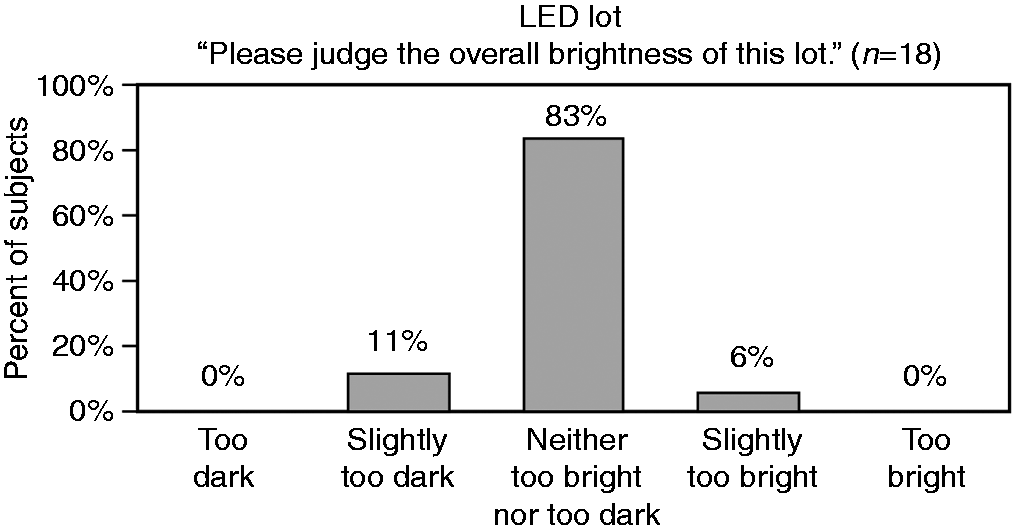
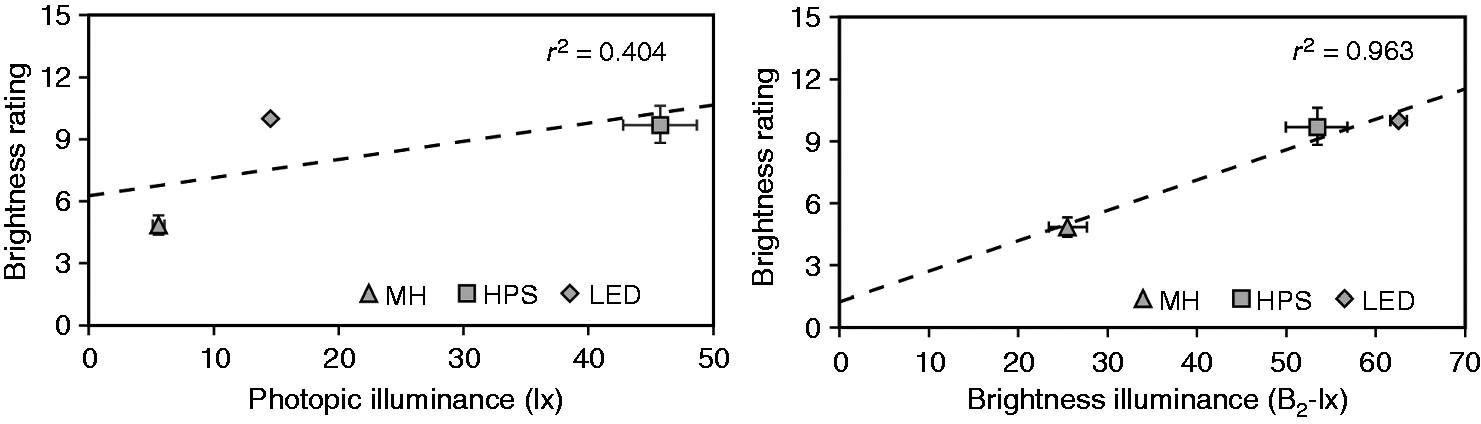
As shown in Figure 5, subjects rated the HPS site as about the same brightness as the LED site, which was defined in the study as having a brightness of 10. The MH site was rated as about half as bright as the LED site. Figure 6 compares the photometric characterisations of the three parking lots from Table 2 to the subjective brightness judgments in Figure 5.
Subjective brightness assessments of the HID parking lots (HPS and MH) compared to those of the reference (LED) parking lot Functional relationships between subjective ratings of brightness (±SEM) and photopic illuminance (left, ±SEM) and brightness illuminance (right, ±SEM) for the three parking lots
The results from each Likert-type scale (see Appendix 1) are given in Figure 7. Table 3 provides descriptive statistics for each scale together with the results of the inferential statistics (Student’s t-test) comparing subjective responses from the HPS and the MH parking lots to those from the reference, LED parking lot. For all questions, subjects rated the LED lot as statistically equal to or better than the HPS lot. Both the LED lot and the HPS lot were always rated more positively than the MH lot. In addition, the mean brightness ratings for each parking lot (Figure 5) were very strongly correlated (r2 = 0.998) with the mean Likert-type scale responses to the statement ‘This parking lot looks bright’ (Figure 7).
Questionnaire results for the three parking lots, average responses (±SEM) for the two viewing locations at the two high-intensity discharge sites; the star (⋆) highlights the scale used to assess perceptions of safety Questionnaire rating results. Note: MH: metal halide; HPS: high pressure sodium; LED: light-emitting diode. HPS and MH were significantly different on all rating scales at p < 0.01. ns = not significant.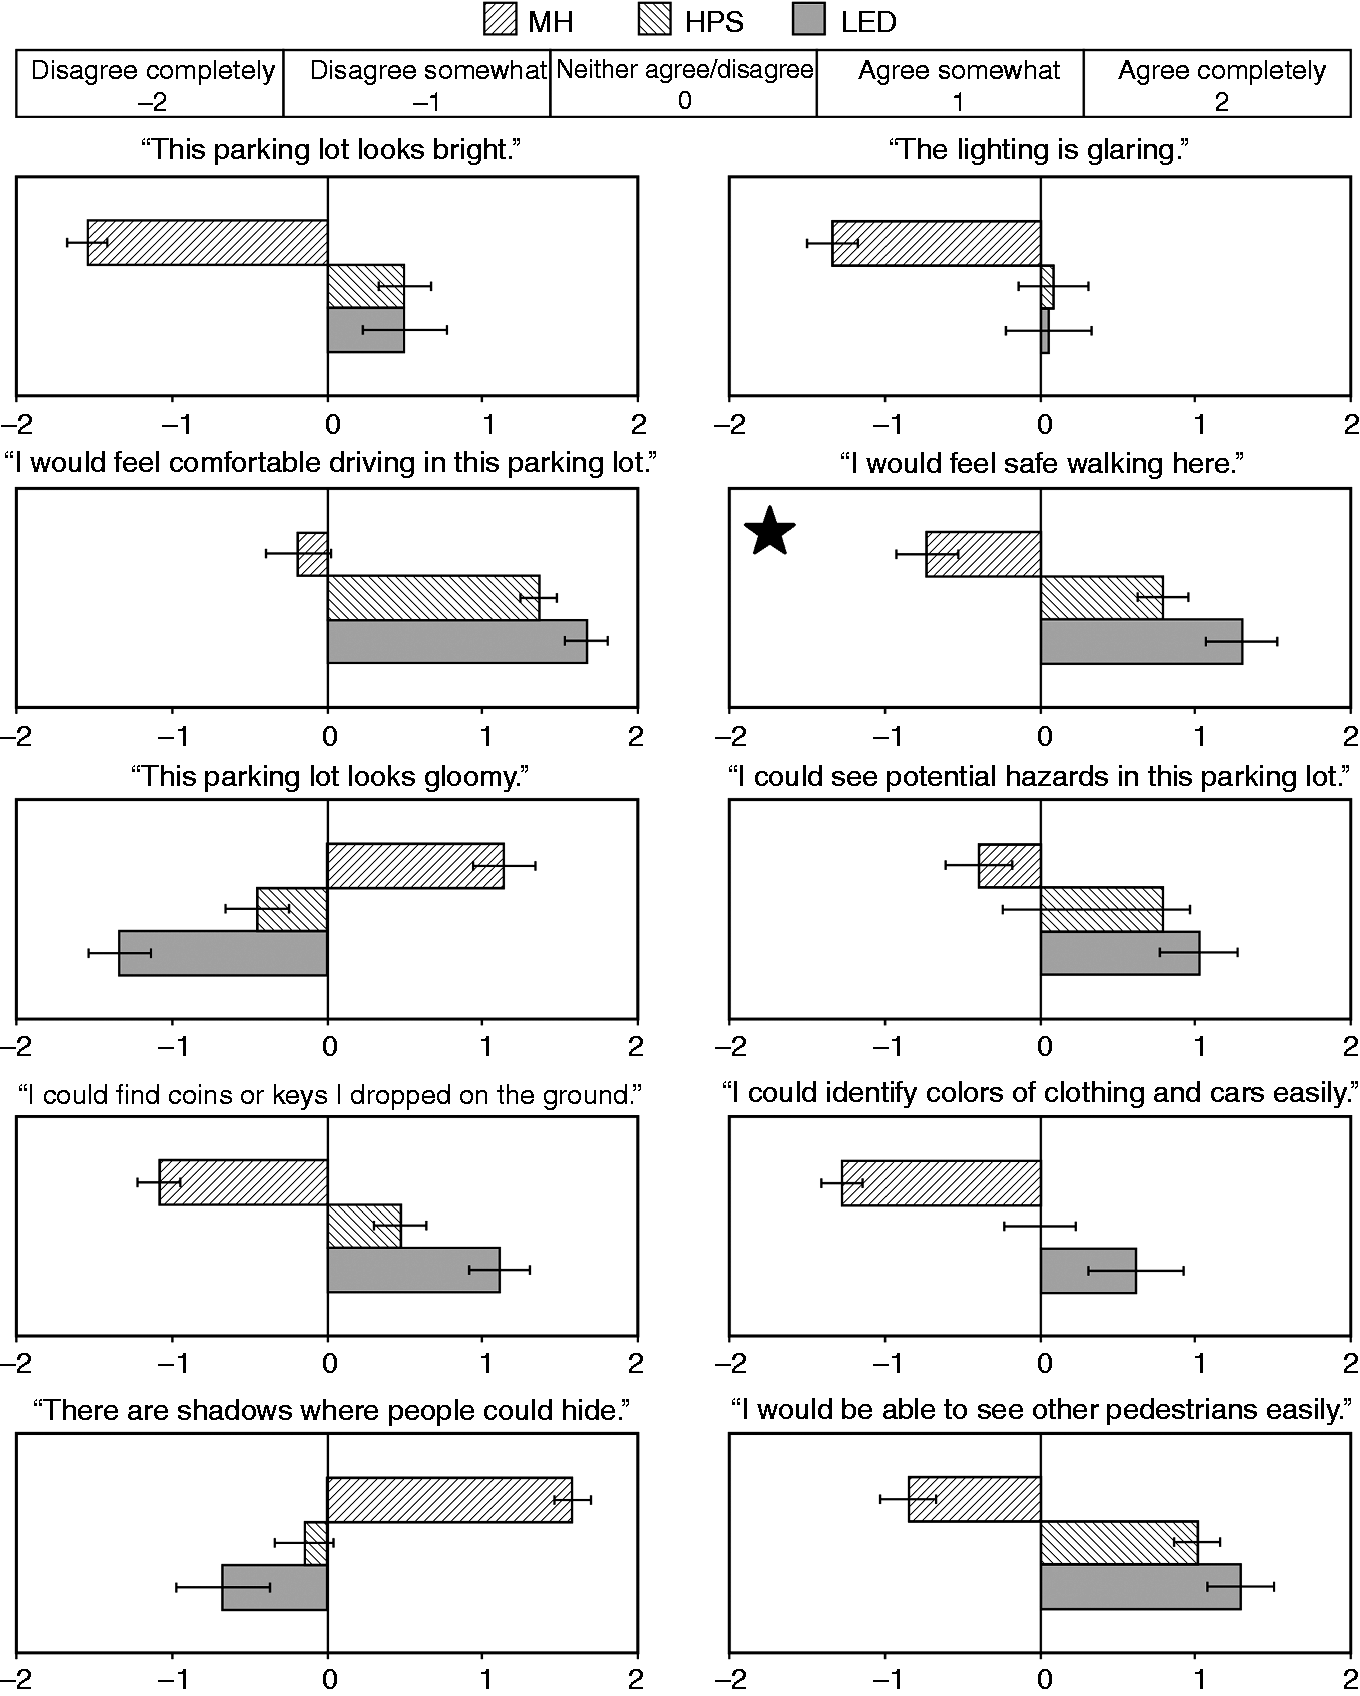
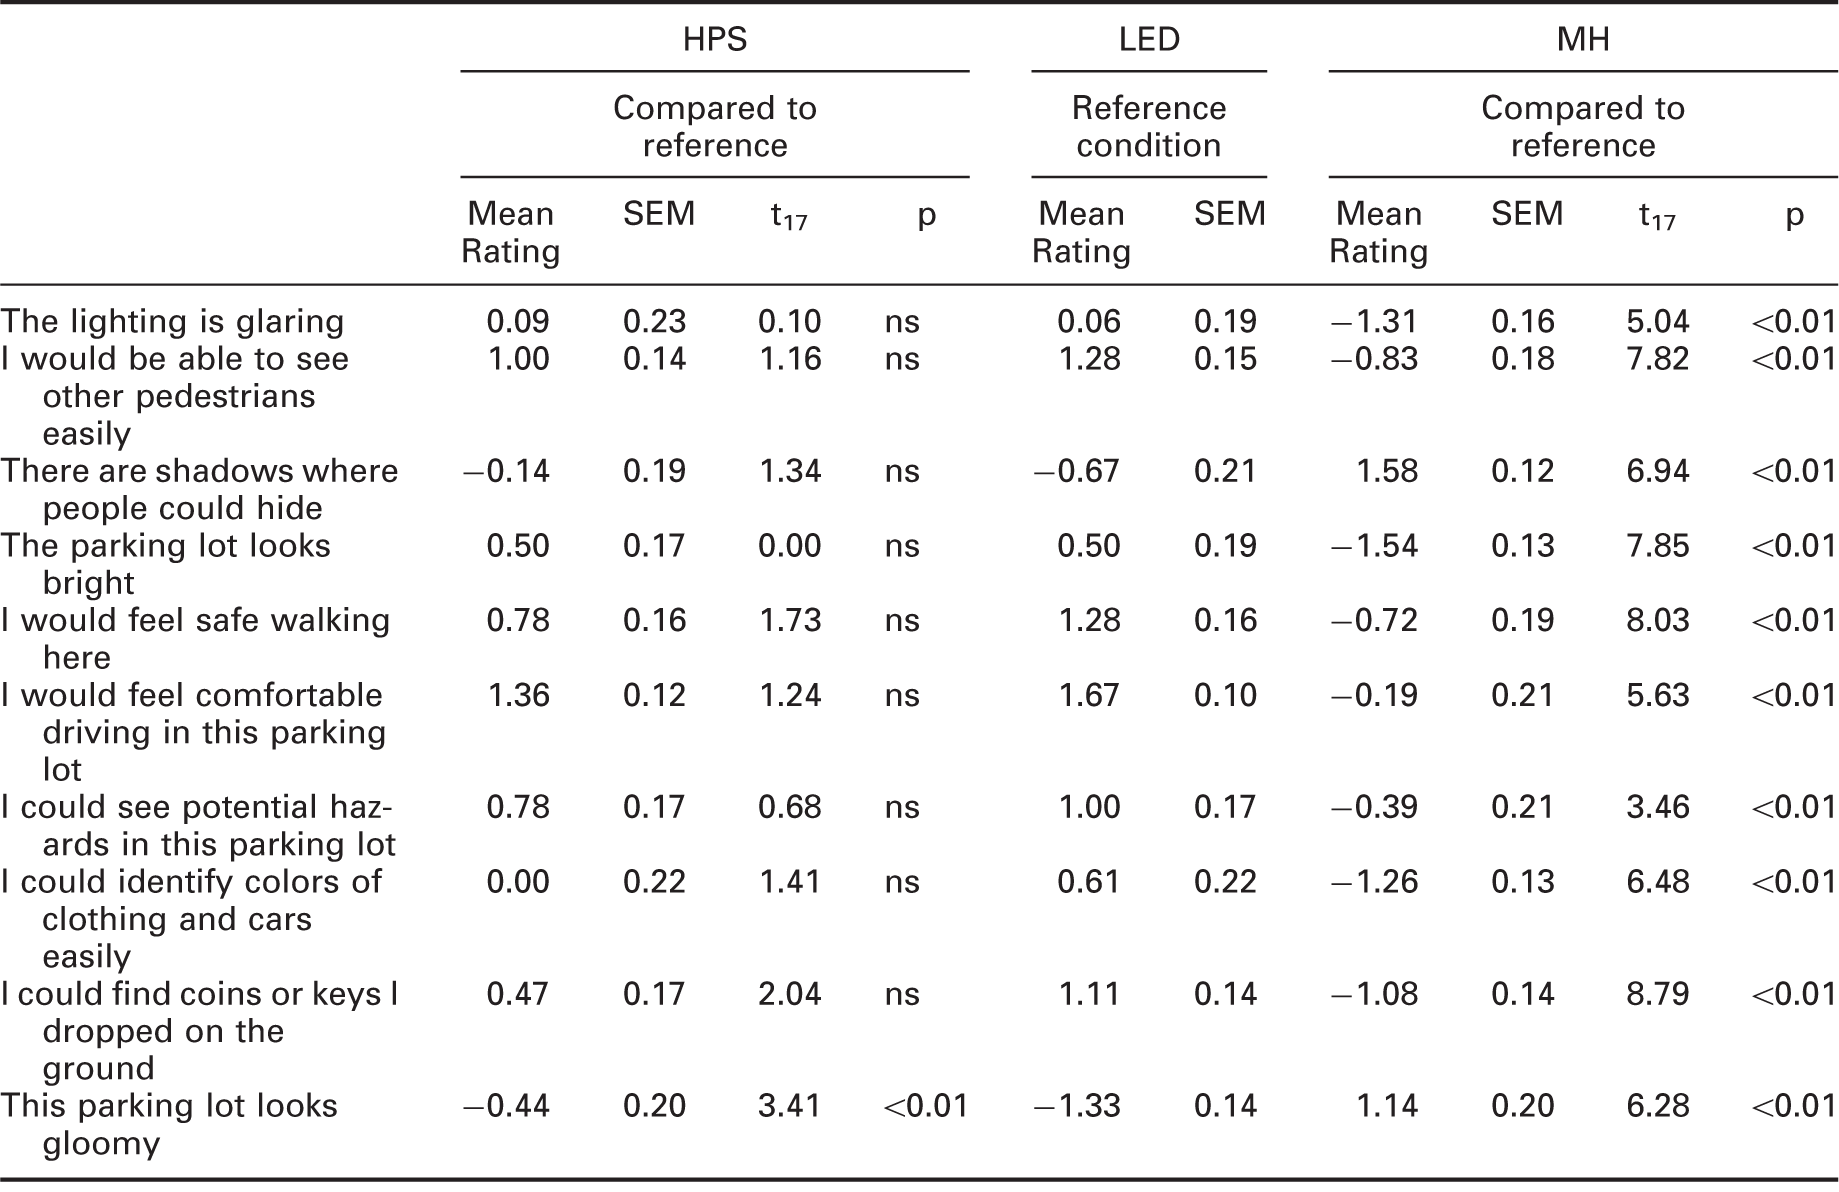
Several of the Likert-type scale responses in Figure 7 specific to the MH parking lot can probably be explained by the substantially lower light level in that lot compared to the others (Table 2). For example, the MH lot was rated as least glaring although the MH luminaires used dropped lenses, while the HPS and LED lots used flat-lensed luminaires. The lower light level also resulted in poorer colour identification under MH than under HPS, despite the superior colour-rendering characteristics of MH (Table 1). And, the MH lot was judged to have more shadows despite being more uniformly lighted than the HPS. These findings reinforce the notion that overall light level, as well as spectral and spatial distributions, affects perceptions of lighted exteriors.
As shown in Figure 8, the brightness function is also more predictive of impressions of safety than photopic illuminance.
Safety question averages (±SEM) excerpted from Figure 7 (⋆); the brightness function is more predictive (r2 = 0.999) of ratings of safety than the photopic spectral sensitivity function (r2 = 0.224)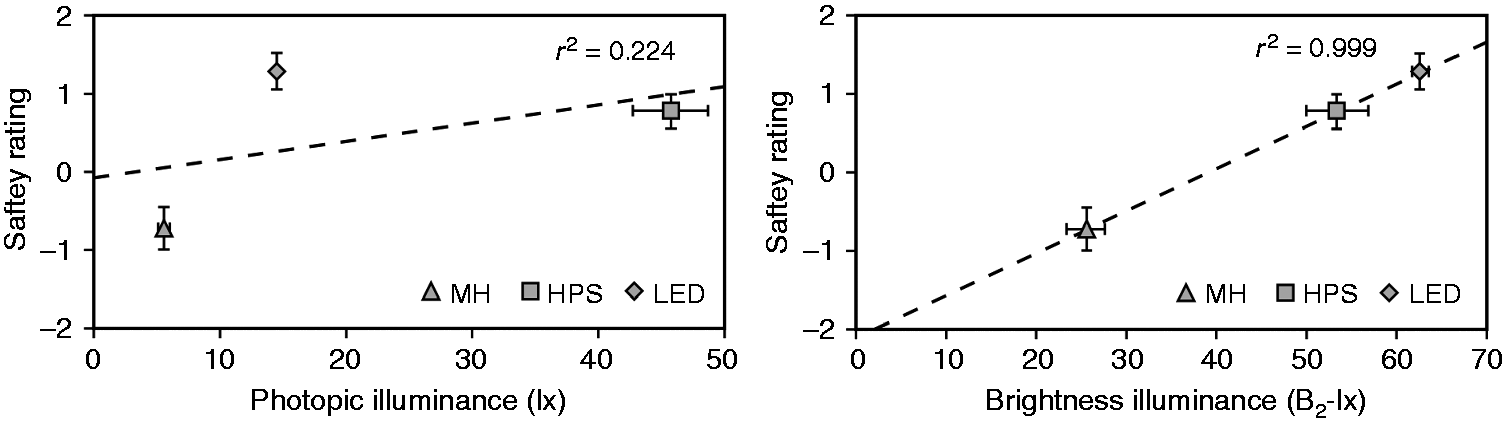
4. Discussion
Outdoor lighting should provide pedestrians with an acceptable level of perceived safety and security.2–4 Perceptions of safety and security are well correlated with perceptions of scene brightness; 16 dimly illuminated parking lots are perceived as less safe and secure than brightly illuminated parking lots. Obviously increasing light levels will make outdoor spaces appear brighter, and therefore they will also be perceived as safer and more secure. Increasing light levels, however, has direct and obvious implications for capital and operational costs. Consequently lighting engineers and designers should optimise their designs to provide the benefit of lighting for perceived safety and security while minimising cost.
One aspect of outdoor lighting that affects apparent brightness, but is unrecognised in current lighting recommendations, is the spectral composition of the source of illumination. At the same photopic illuminance, outdoor scenes illuminated by sources with relatively more short-wavelength radiation will appear brighter. This phenomenon would have significant implications for outdoor lighting practice if it could be reliably demonstrated that by taking into account both light level and spectrum, an acceptable level of perceived safety and security could be achieved at lower capital and operational costs than could be achieved with current practice where only light level is considered.
Systematic investigations of scene brightness perceptions have been published over several decades, 17 with growing interest in the last few years.5,7–12 A provisional model of apparent scene brightness has been recently published so that for any SID (both spectrum and amount), the apparent brightness of a scene can be predicted.9–12,18 Moreover, a direct link has been shown between apparent brightness and perceived sense of safety and security, 16 and the present results confirm this link. In principle then, the body of research makes it possible to optimise the benefits and costs of outdoor lighting by taking into account the SID of illumination. 19
The present study was aimed at validating the promise of this research for the design of parking lot illumination. As shown in Figures 6 and 8, by taking into account the SID and an appropriate brightness luminous efficiency function [VB2(λ)], it was possible to predict both perceptions of scene brightness and perceptions of safety and security. These results are consistent with the provisional model predictions by Rea et al. 9 and, therefore, provide a justification for engineering outdoor lighting based upon apparent scene brightness as it affects perceptions of safety and security.
The costs associated with lighting also need to be considered when engineering outdoor lighting. Once a design goal is established, such as ‘to provide an acceptable level of security in the parking lot’, it is then possible to specify a criterion level of brightness illuminance needed to meet the design goal. For the present study, it was assumed that the Likert-type scale rating of +1.5 in Figure 7 (⋆), corresponding to a qualitative rating midway between ‘agree somewhat that I would be safe walking here’ (+1.0) and ‘agree completely that I would be safe walking here’ (+2.0), would be the design goal. Thus, it was assumed that a Likert-type value of +1.5 would ‘provide an acceptable level of security in the parking lot’. Based upon Figure 8, a Likert-type value of +1.5 corresponds to a brightness illuminance value of 66.8 B2-lux.
The brightness illuminance and the associated photopic illuminances needed to achieve a +1.5 Likert-scale (‘agree’) rating of security under the HPS, MH and LED sources.
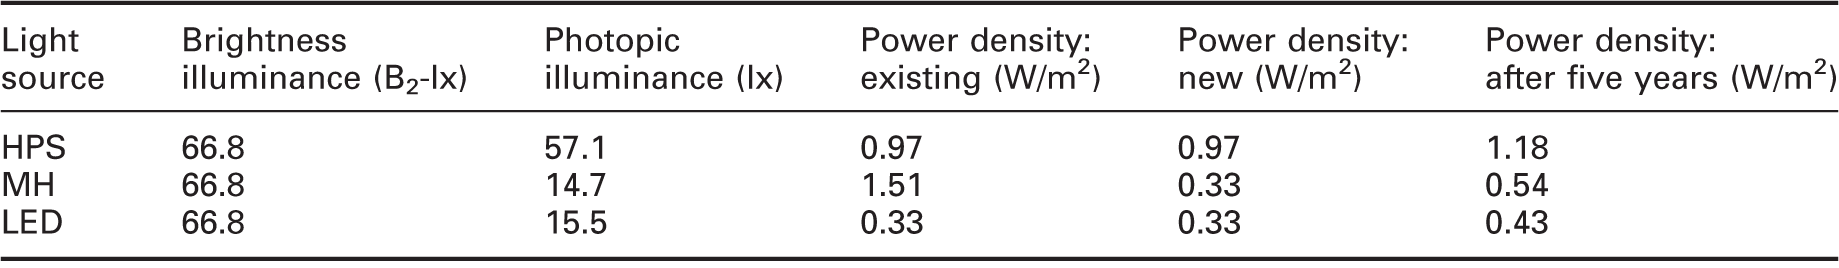
Note: MH: metal halide; HPS: high pressure sodium; LED: light-emitting diode.
Brightness illuminance was calculated using the VB2(λ) luminous efficiency function from Rea. 13 Also listed are power densities required to provide these illuminances under the existing lighting conditions, when the same sources would be new according to manufacturer reported data, and after five years of operation according to the US Department of Energy. 20
The initial costs of LED lighting systems are greater than those of comparable HPS lighting systems. 15 To be cost-effective then, it is important that the LED lighting system save sufficient energy over the lighting system lifetime to justify its higher initial cost. The amount of light needed to deliver an ‘acceptable’ (+1.5 on the Likert-type scale) level of light would be 66.8 B2-lux for any light source. From Table 4, the incremental power density needed by the HPS lighting system over the LED lighting system after five years, taking into account lumen depreciation, 20 is 0.75 W/m2, or 0.00075 kW/m2. To determine the break-even cost after five years, it is necessary to calculate the annual hours of use as well as the incremental energy (power × time) costs of the HPS relative to the LED systems to deliver 66.8 B2-lux after five years. The annual electricity use (12 hour/day × 365 day/year) is 4380 hour/year or 21,900 hour/five years. The incremental annual power density savings per year is 3.3 kWh/m2/year or 16.5 kWh/m2/five years. At an estimated utility rate, including use and demand charges, of $0.10/kWh, the annual energy cost savings per year from the LED lighting system would be $0.33/m2/year or $1.65/m2/five years.
As an example, for a 4650 m2 parking lot, the incremental annual savings would be approximately $1500/year. So for the five-year payback, the initial cost of the LED system over the HPS system should not be more than $7500. Illumination of this parking lot might require seven luminaires, based on the number of luminaires needed to illuminate a proportionally larger lot. 19 An initial system cost increment of $7500 would correspond to about $1070 per luminaire. As described above, the current estimated cost difference between LED and HPS luminaires is greater, approximately $1220, 15 so LED system prices would need to be somewhat lower to achieve a five-year payback. Importantly, if the parking lot were illuminated by the LED lighting system to the same photopic illuminance as the HPS system needed to deliver an ‘adequate’ light level, the LED parking lot would appear much brighter, but there would be an energy penalty as well as an initial cost penalty for the LED lighting system.
5. Conclusions
Outdoor lighting serves multiple objectives and critical among these is providing an impression of personal safety and security to the occupants of a space. Meeting this objective is practical with evolving light source technologies such as LEDs, which are beginning to outpace traditional outdoor light sources such as HPS lamps in terms of photopic luminous efficacy. However, the results of the present field demonstration show that the spectral characteristics of LED lighting systems can provide additional leverage over HPS systems by providing greater scene brightness and perceptions of safety and security at lower power densities. From a practical perspective, then, there are substantial opportunities to use less energy, produce lower peak power demand and reduce lighting system costs by designing outdoor lighting that supports perceptions of safety and security when LED sources are considered in comparison to HPS sources. More generally, the present study offers a ‘brightness illuminance’ design methodology by which any light source can be utilised to maintain perceived safety and security for outdoor lighting.
Footnotes
Acknowledgements
The authors acknowledge the contribution of Dr. Levin Nock representing the Bonneville Power Authority who served as the project manager. Also acknowledged are the staff at the Seattle Lighting Design Laboratory for their invaluable assistance in coordinating site logistics and photometric measurements. In particular the authors would also like to thank Kurt Nielsen, Jeffrey Robbins, Eric Strandberg and Edward Smalley, who were instrumental in making the project possible. From the Lighting Research Center, Dr. Mariana Figueiro is acknowledged for her assistance in collecting subjective evaluations, Andrew Bierman and Timothy Plummer for technical support, and Dennis Guyon for editorial and graphic support. Also acknowledged are the University of Washington and Sound Transit for enabling us to use their parking lots for this research project. Finally, the subjects who volunteered their evening during the busy holiday season are gratefully acknowledged.
Declaration of conflicting interests
The author(s) declared no potential conflicts of interest with respect to the research, authorship, and/or publication of this article.
Funding
The author(s) disclosed receipt of the following financial support for the research, authorship, and/or publication of this article: This project was sponsored by the Bonneville Power Authority (TIP 329).