
Abstract
Pulse width modulation for dimming the light output of LEDs has become common. When pulse width modulation is used at low frequencies unwanted visual artefacts including flicker perception and stroboscopic effects may occur. These artefacts need to be avoided or at least reduced to a minimum in order to obtain high user acceptance. In this paper, an optimized phase-shifted pulse width modulation method is described, implemented and validated in a visual experiment. The method is intended to minimize the stroboscopic effect on a reference surface by first optimizing the LED units of a single LED luminaire and then co-optimizing several of these luminaires. The optimized pulse width modulation waveforms are then compared to standard pulse width modulation dimming methods. In the visual experiment, 13 subjects rated the extent of the stroboscopic effect of standard and optimized waveforms in a white painted experimental room. The results indicate that the optimized waveforms are indistinguishable from constant light.
1. Introduction
To dim LED light sources, two different approaches are applicable: current regulation (constant current dimming) or pulse width modulation (PWM). In contrast to constant current dimming, the chromaticity shift caused by PWM dimming is virtually unnoticeable. 1 However, PWM dimming may also cause unwanted visual artefacts such as flicker perception and stroboscopic effects in the presence of fast eye or object movements. In order to obtain high user acceptance and to avoid possible health risks,2,3 these temporal artefacts need to be reduced to a minimum.
Therefore, PWM power supplies have to run at frequencies high enough to be imperceptible to the human visual system. The higher the frequency, the less likely someone is to observe visual artefacts. According to Bullough et al., 4 flicker can be perceived up to frequencies of approximately 100 Hz, and even higher frequencies (several kHz) are required to completely eliminate stroboscopic and related artefacts.5–9 However, high-frequency power supplies are generally more complex and expensive to produce, especially when low light levels are desired. In addition, high PWM frequencies may cause electromagnetic interference problems for surrounding electronic devices. Hence, the goal of this study is to find and validate a method to reduce the stroboscopic effect in interior-lighting applications by using low-frequency PWM power supplies.
The present paper is organized as follows. In Section 2, the main technological parameters of PWM dimming are introduced and the potentially occurring visual artefacts of PWM-controlled LED luminaires are discussed. In Section 3, the phase-shifted PWM method to reduce the stroboscopic effect is described. According to the best knowledge of the authors, this method – which is based on the spatial integration of the light from several LED luminaires – has not been published before. The experimental setup used for visual validation is explained in Section 4 and the corresponding results are shown in Section 5. In Section 6, we finish the paper with some concluding remarks and a short outlook on future developments.
2. Technological parameters and visual artefacts of PWM dimming
Considering various interior-lighting applications, e.g. home and office lighting, the use of PWM for dimming the light output of LEDs has become common in today’s technology. The modulation depth, frequency and duty cycle are the most important technological parameters regarding this method and will be discussed in the first part of this section. The second part of this section is dedicated to the different visually perceptual artefacts that may occur when PWM is used for LED dimming, particularly at low frequencies.
2.1. Modulation depth, frequency and duty cycle
Since LEDs need only a short time to switch between their on and off state, it is possible to adjust their light output by switching them continuously on and off. This procedure is called PWM dimming where the ratio of on-time to off-time determines the brightness of the LED. In this context, the so-called duty cycle D is defined as
Illustration of the PWM dimming process. The duty cycle is defined as 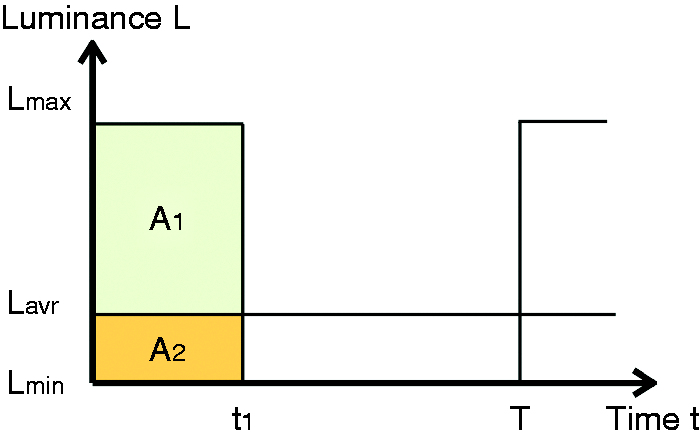

If the PWM frequency is higher than what the human visual system is able to perceive only the average luminance
In order to describe the ratio between the average luminance and the luminance during the on-time, the so-called flicker index


Both quantities given by equations (2) and (3), respectively, can be used as prediction criteria for the visibility of PWM-induced artefacts, i.e. flicker perception and stroboscopic effects, which will be discussed in the subsequent section.
2.2. Visual artefacts
When PWM is used to dim LEDs unwanted visual artefacts may occur, especially at low frequencies. Basically, we can distinguish between three different types of artefacts. Flicker on the one hand is a well-known and extensively studied
10
temporal artefact that is related to the direct perception of the above-mentioned cyclical luminance modulations (luminance flicker) but is also related to the changing chromaticity of the light (chromatic flicker) occurring in temporally modulated light systems. The stroboscopic effect on the other hand is less well understood. It can be perceived under temporally modulated light when looking at a moving object. Depending on the object’s velocity and on the duty cycle, depth and frequency of the modulation, the object seems to move discretely rather than continuously.11,12 An example of the appearance of a stroboscopic effect is shown in Figure 2. The third type of visual artefacts can be perceived under temporally modulated light when a stationary object is viewed during rapid eye movements called saccades. Due to a breakdown in the mechanism of saccadic suppression a bead-string artefact, which is also known as phantom array, can be observed.13,14 This can be noticed until the visual afterimages on the retina are too closely spaced to be individually separated by the human visual system.
A stroboscopic effect seen on a rotating black disc with a single white dot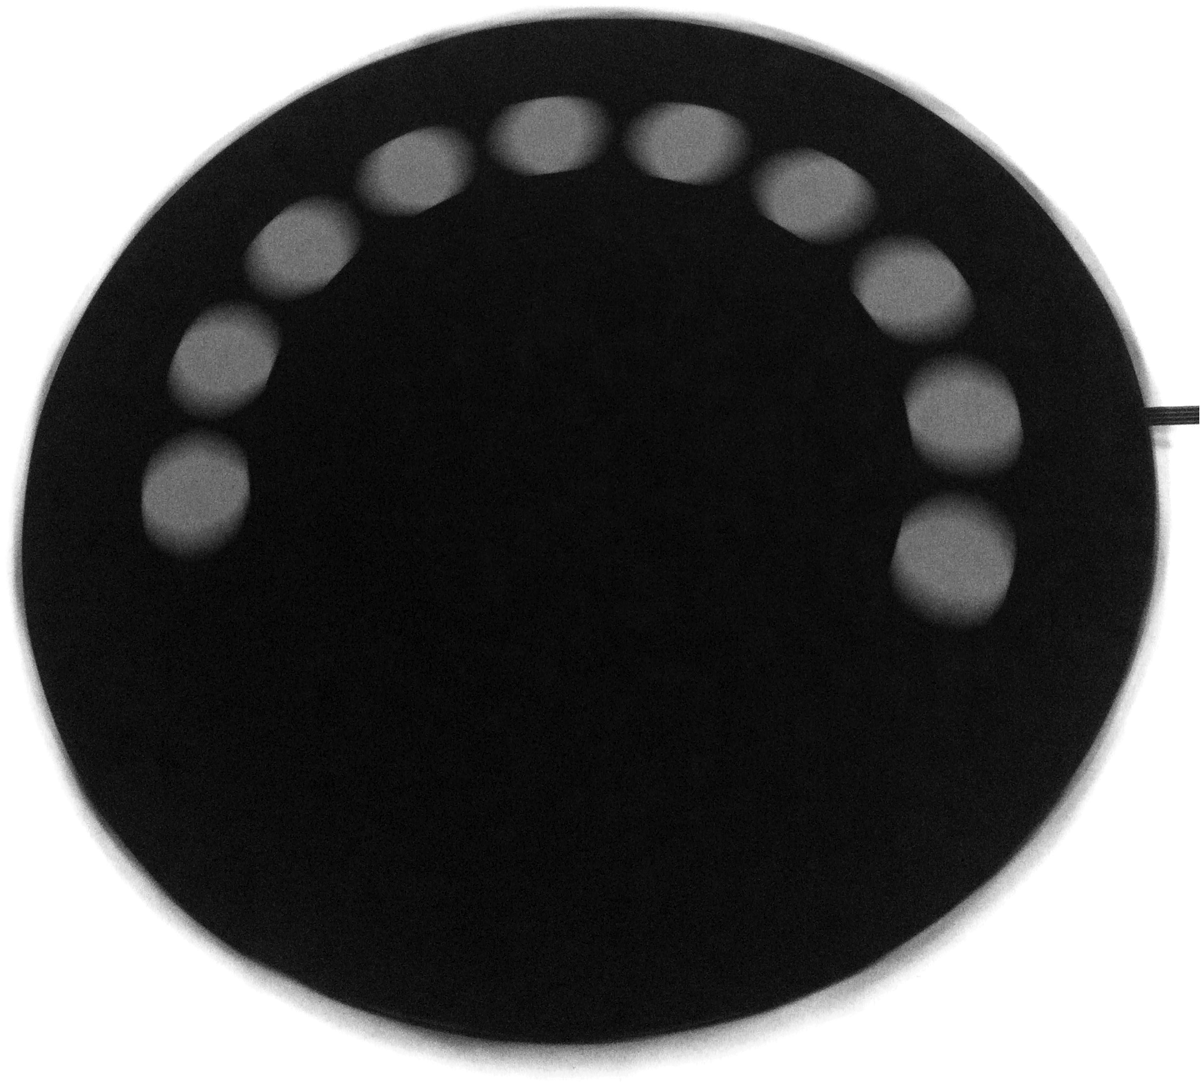
In contrast to flicker, which can only be perceived up to frequencies of approximately 100 Hz, the two other visual artefacts are still perceivable at much higher frequencies up to several hundred or thousand Hz. For example, Wernicke and Strauß 8 calculated the phantom array threshold frequency for automotive applications by assuming a realistic eye movement velocity of 200°/s and a visual acuity of 10 arc minutes leading to a frequency of 1.2 kHz in dynamic traffic situations. Experimentally, Roberts and Wilkins 9 found an even higher threshold frequency of approximately 2 kHz.
Regarding the stroboscopic effect, Vogels et al. 6 investigated its visibility threshold in terms of modulation depth using square waveforms. It was confirmed that the visibility of the stroboscopic effect depends on the frequency and duty cycle of the modulated light and on the velocity of movements in the observed environment. Within the boundaries of the tested conditions, Vogels et al. found that the stroboscopic effect could still be perceived at 400 Hz. Investigating the influence of different waveforms, the study of Perz et al. 7 showed that much higher frequencies are required to completely eliminate stroboscopic effects. Depending on the modulation depth and waveform, subjects perceived visual artefacts even at frequencies of 800 Hz.
In the following, we focus on the stroboscopic effect only since this is the most dominant visual artefact for frequencies higher than 100 Hz that may be perceived by a human observer in typical interior-lighting applications (e.g. office lighting) where deep shadows are unlikely and the illumination is sufficiently diffuse on the work surface. Hence, the goal of the case study presented in this paper is to minimize the stroboscopic effect on the work surface by using a phase-shifted spatial-integration approach and to point out the usability of the proposed method for the lighting engineer.
3. The phase-shifted PWM method and its implementation
Assuming a typical interior-lighting situation based on a certain arrangement of PWM-dimmed LED ceiling-mounted luminaires, the main idea of our approach is to minimize the resulting stroboscopic effect on a previously defined illuminated reference area (spatial-integration area) by using different phase-shifted PWM patterns applied to the individual LED luminaires.
3.1. Phase-shift patterns for a single LED luminaire
Each LED luminaire used in this study consists of four warm white LED units arranged in a diamond pattern. The LED units are driven with different phase shifts but with the same duty cycle and frequency. With this procedure several different phase-shift-based PWM patterns become feasible for each LED luminaire. However, only phase-shift patterns that have proven to be better than standard PWM dimming are shown in Figure 3.
Three possible phase-shift patterns for a single LED luminaire consisting of four LED units. On the left: standard PWM; in the middle: dynamic phase shift; on the right: fixed phase shift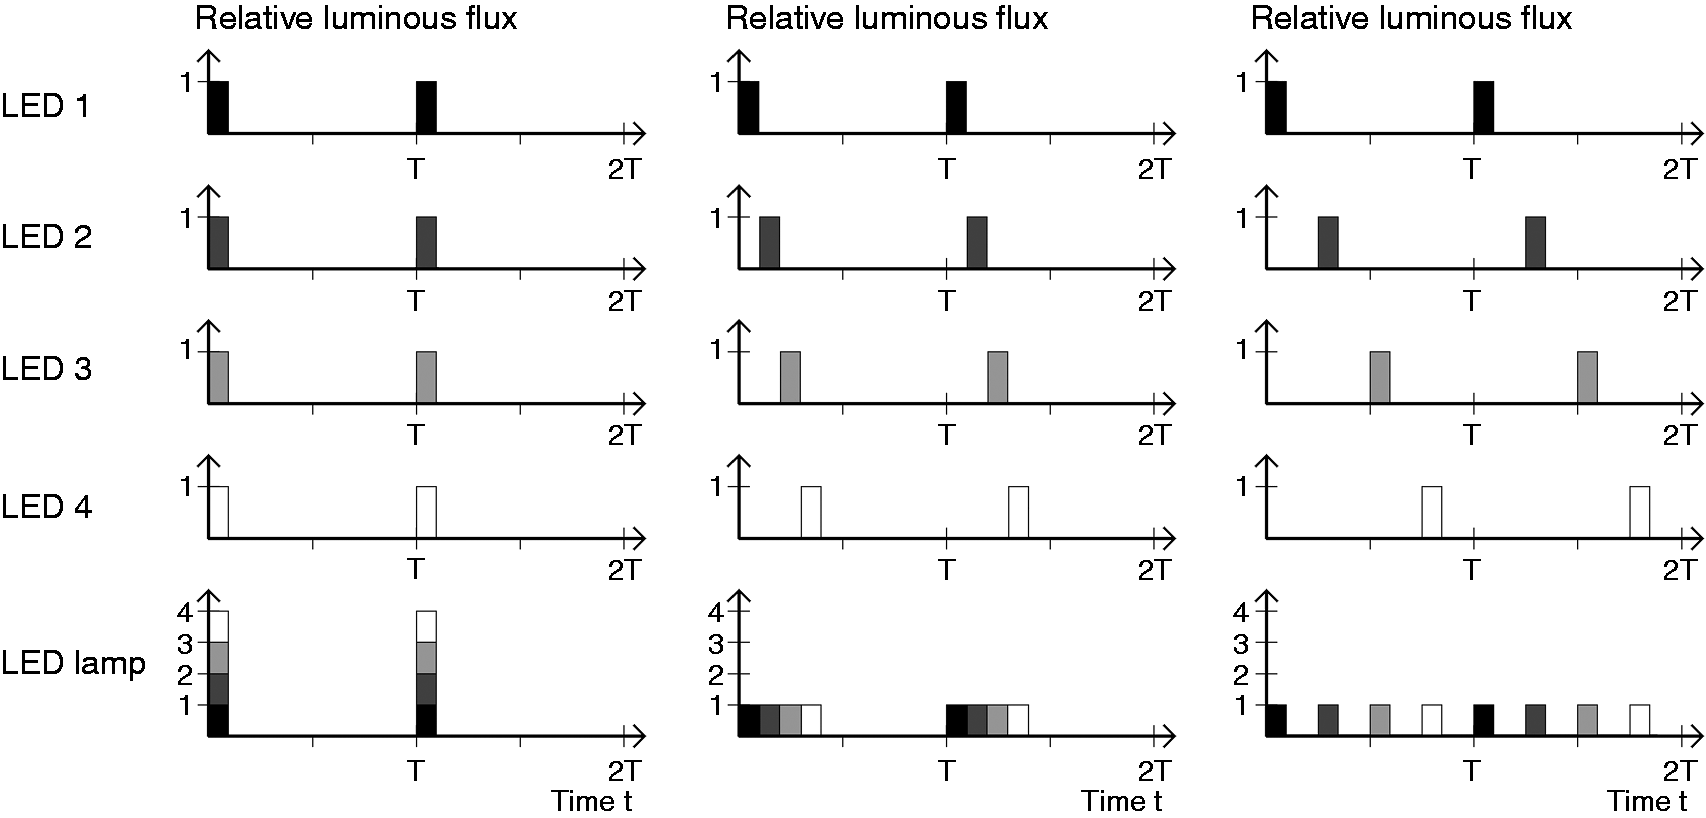
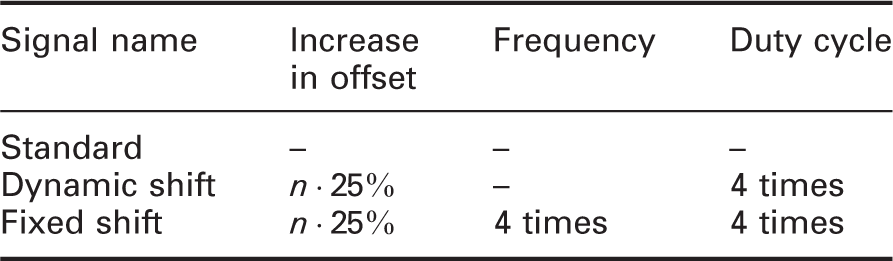
Summary of phase-shifted PWM patterns.
3.2. Phase-shift patterns for an array of several LED luminaires
In this study, a total of nine LED luminaires (as described above) were mounted in the ceiling of a windowless, white-painted experimental room at the Laboratory of Lighting Technology at the Technische Universität Darmstadt, which is shown in Figure 4.
The ceiling of the experimental room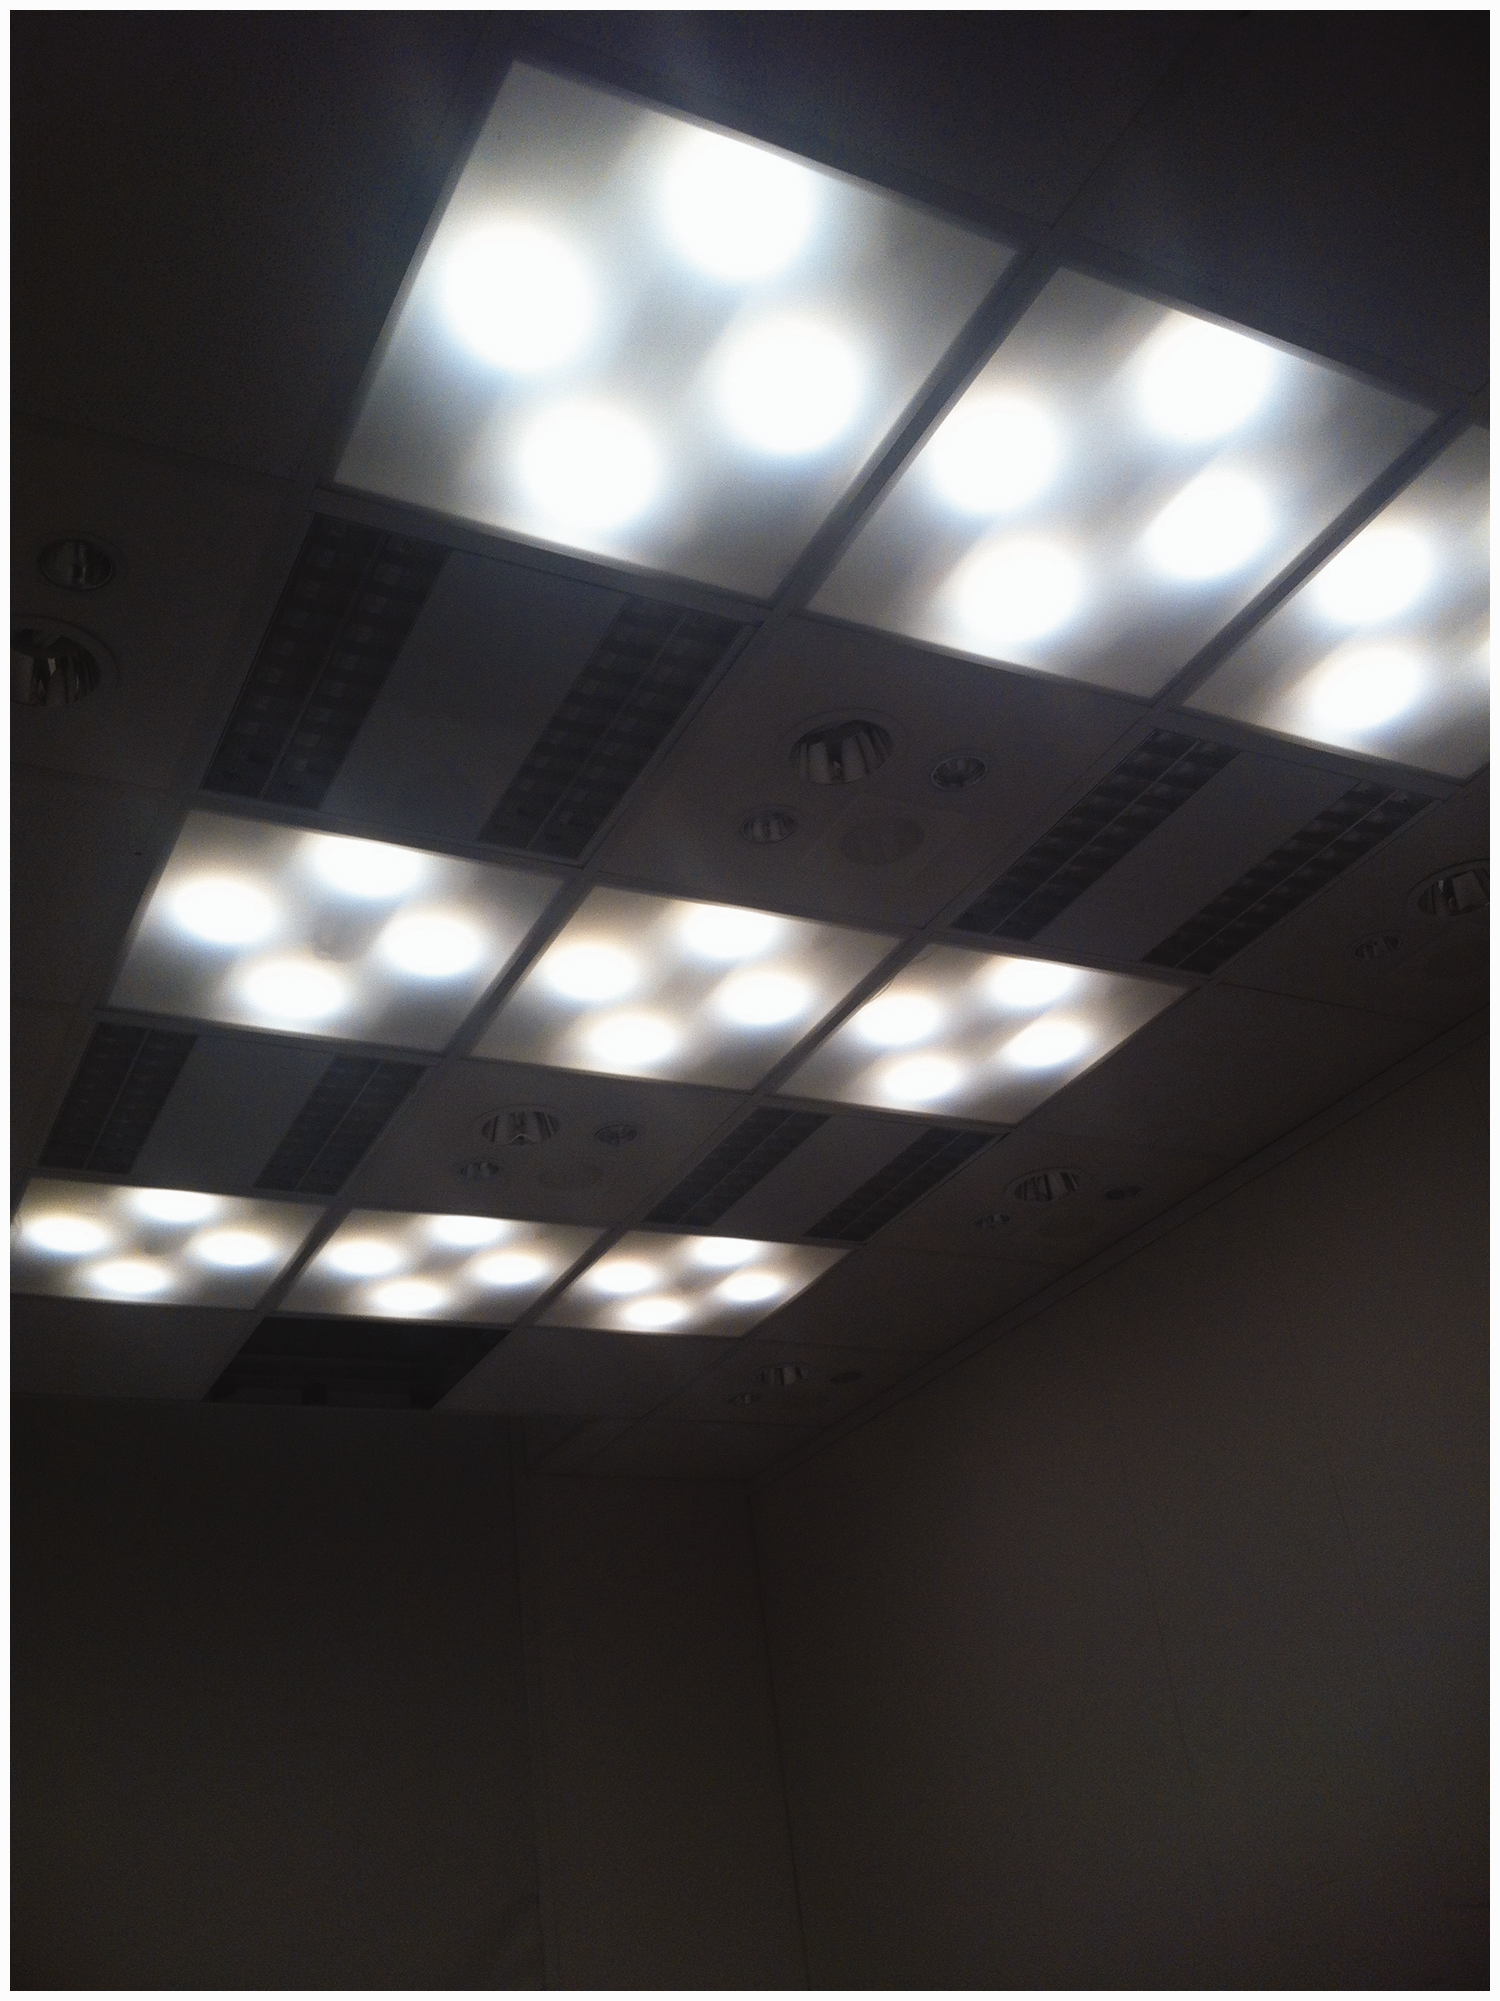
For further investigations, these nine LED luminaires were classified into different groups in such a way that every single group gives the same average luminance on the reference surface. Here, the reference surface is represented by an ordinary office desk of 0.8 m height which is placed right in the middle of the experimental room. Note that every group consists of at least one LED luminaire and all LED luminaires within a certain group are driven with the same PWM pattern, i.e. they are synchronously switched on and off.
As can be seen from Figure 5 six different groups (black numbers) could be found by simulating the radiation characteristics of the LED luminaires in the room assuming a reflectance of 50% for the light grey floor and 78% for the white walls and the ceiling. The simulation is based on previous measurements of the luminous intensity distributions of the single LED units at 350 mA using a near-field goniophotometer.
Spatial distribution of the LED ceiling luminaires in the experimental room and their appropriate classification into six different groups (black numbers) which guarantees that the average luminance on the reference surface (light grey area) is equal for every single group 1–6. Grey shaded black squares indicate LED units being switched on at a constant current of 350 mA. The contour lines represent the corresponding spatial illuminance distribution (in lx) measured at 0.8 m above the ground which approximately complies with the height of the reference surface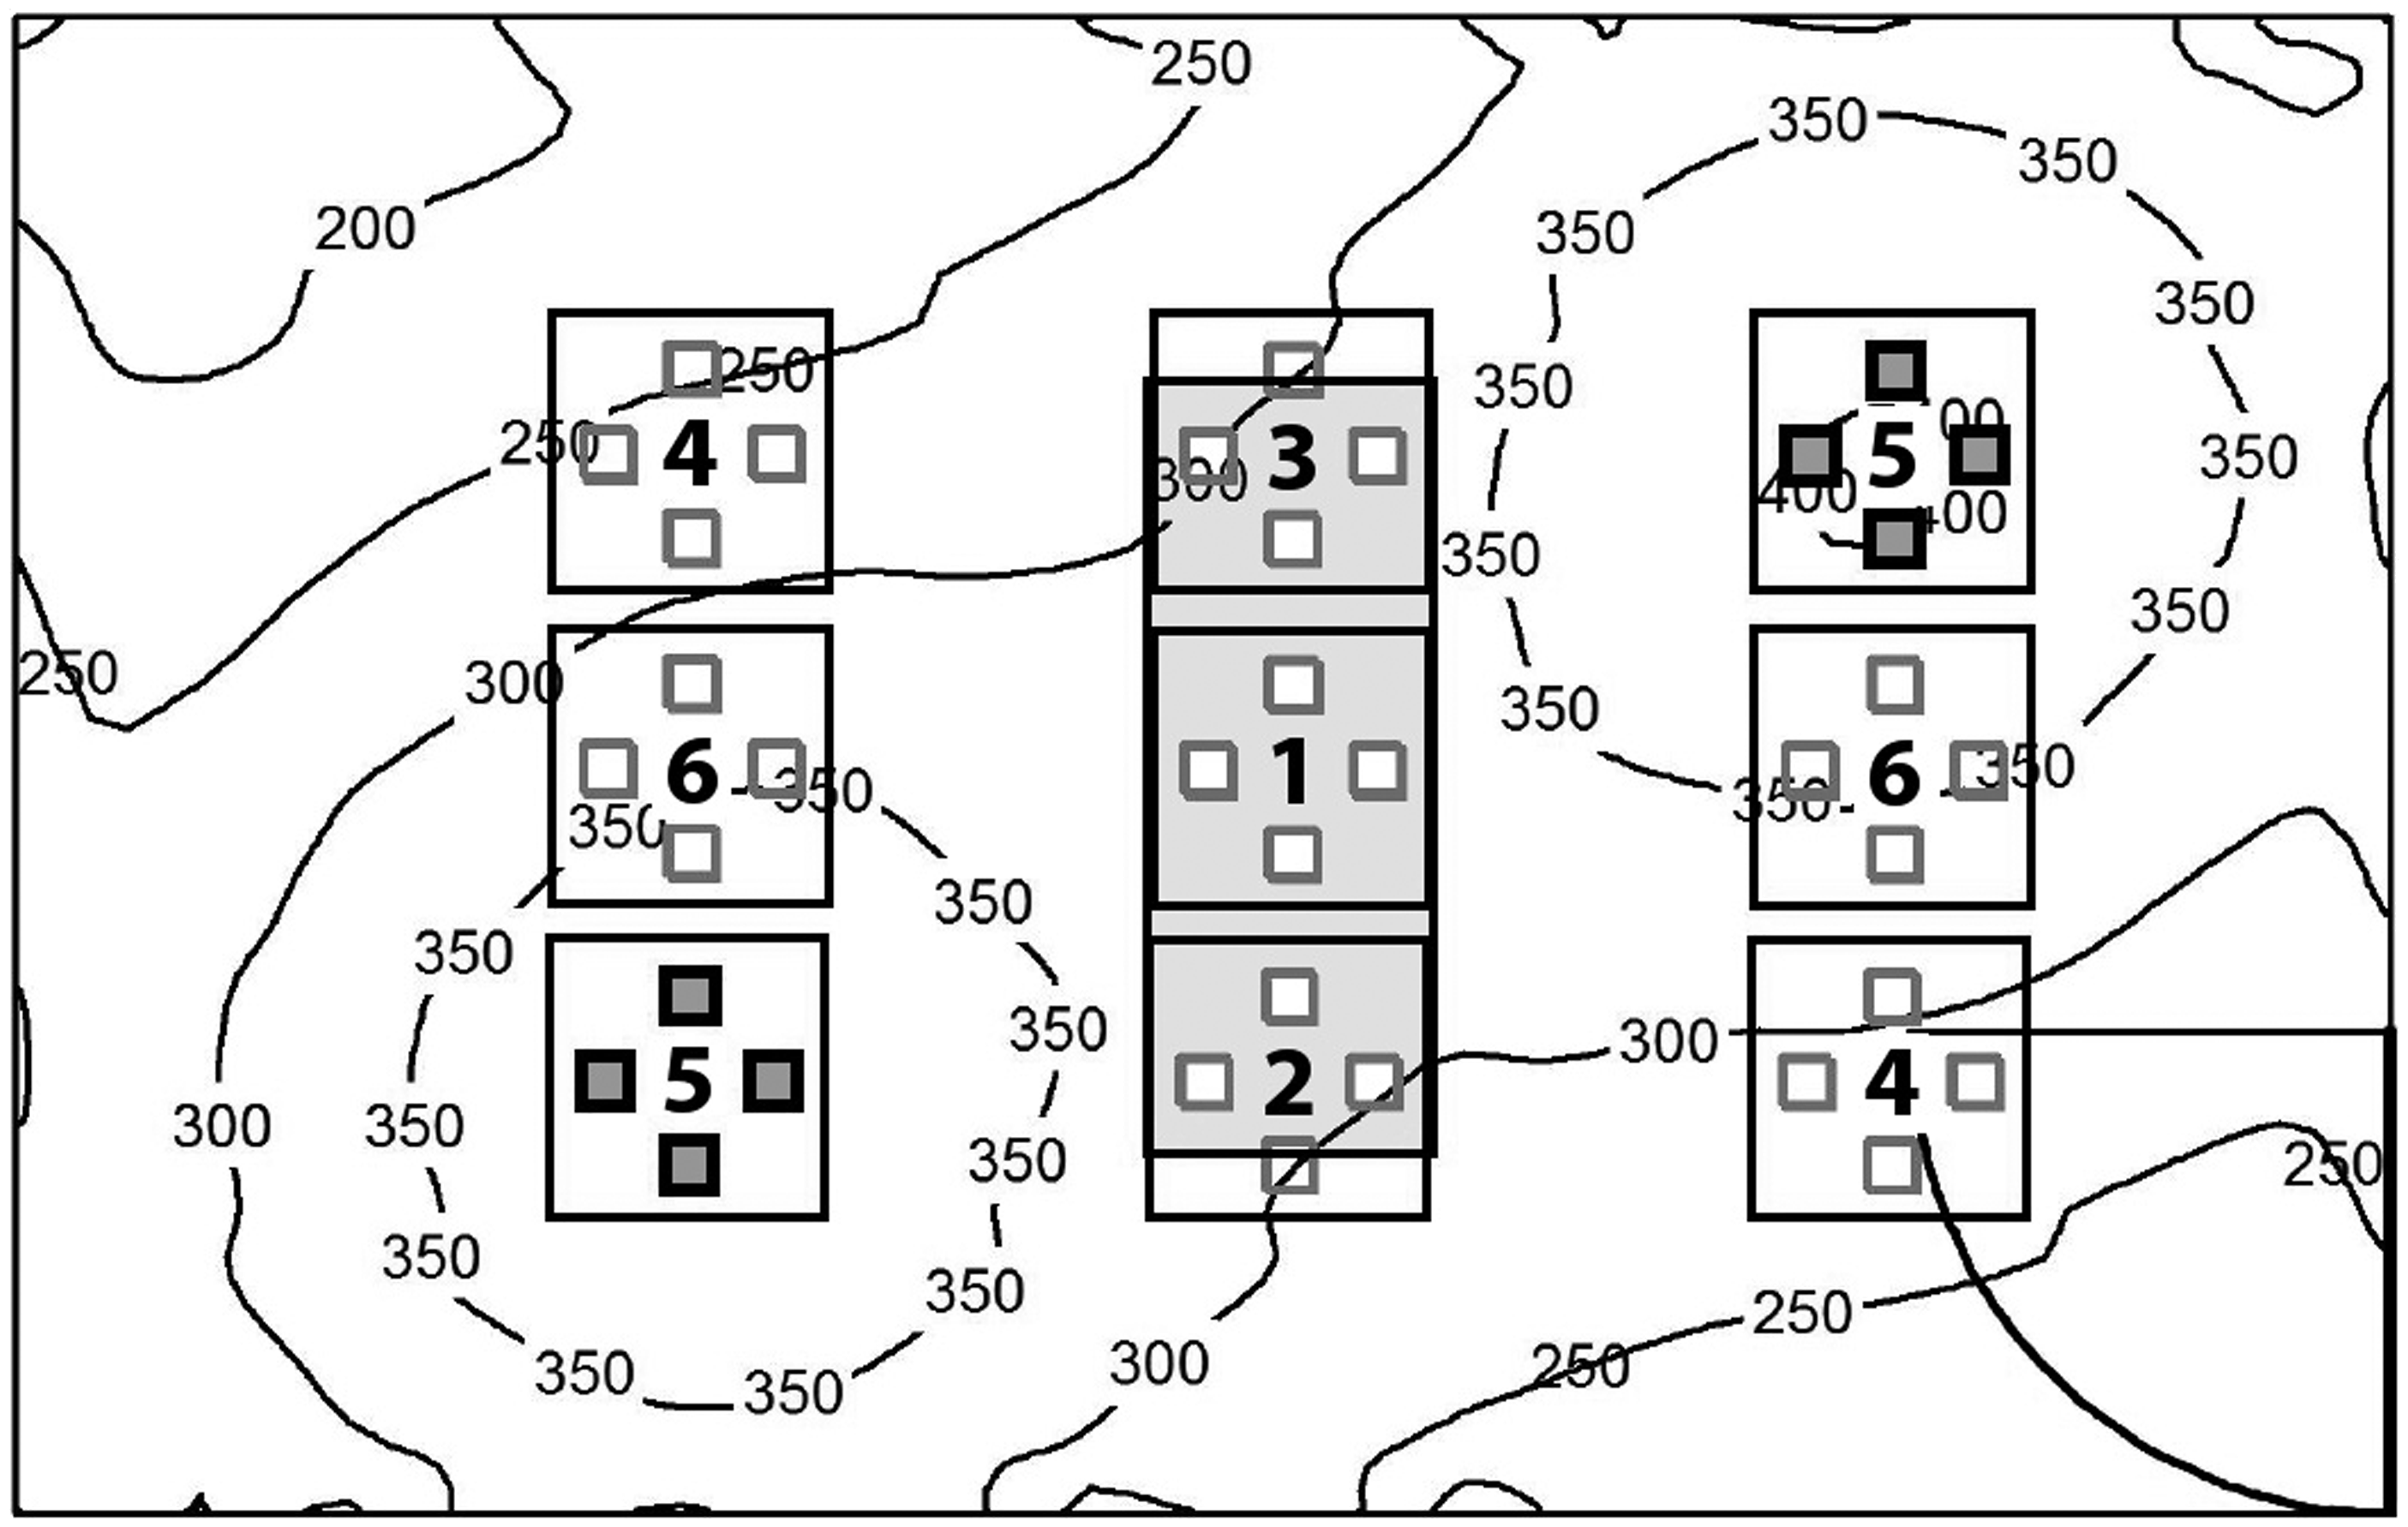
In the next step, the previously defined groups are driven using different combinations of the phase-shift-based PWM patterns previously explained in Section 3.1. This basically results in a huge variety of possible spatially shifted PWM patterns. For this study, only two of these patterns, which are illustrated in Figure 6(a) and (b), respectively, have been chosen to be investigated in the visual experiment.
Space standard: The LED units of each LED luminaire are driven with standard PWM dimming while there is a fixed spatial shift between the different groups. Space shift: The LED units of each LED luminaire as well as the different groups experience a fixed phase shift. Illustration of the two spatially shifted PWM patterns selected for the visual experiment: (a) space standard and (b) space shift. Numbers on grey shaded background indicate the six groups (1–6) of LED luminaires mounted in the ceiling of the experimental room. Each luminaire consists of four individually controllable LED units (black, dark grey, light grey, white). Here, the duty cycle of the single LED units within each LED luminaire is set to 10%
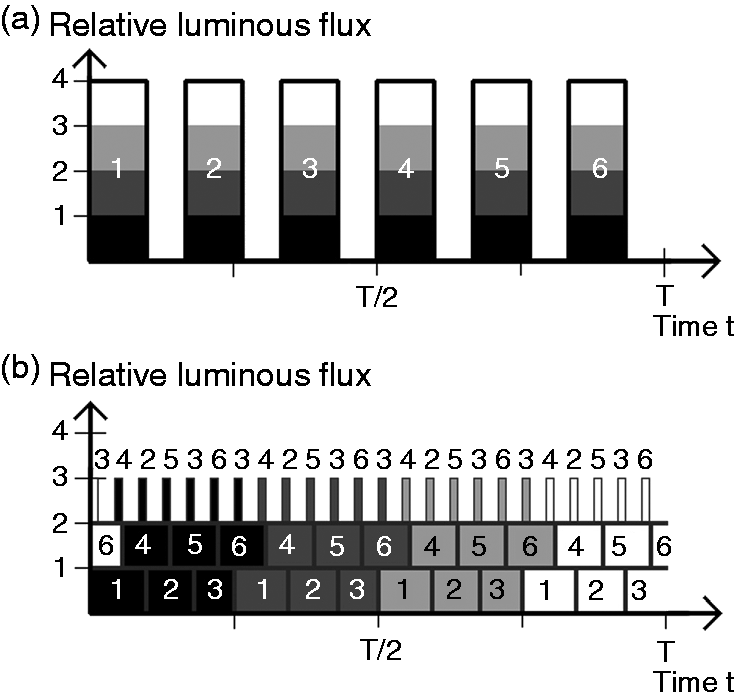
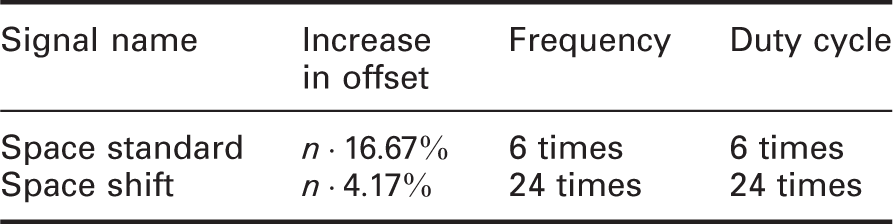
In Figure 6, the labelling ‘space standard’ indicates that the four individually controllable LED units of each LED luminaire are driven with standard PWM dimming, i.e. they are switched on and off at the same time, while there is a fixed spatial phase shift between the six different groups during one period T. This leads to a six times higher duty cycle and frequency compared to standard PWM dimming. On the other hand, the designation ‘space shift’ indicates that both the four LED units of each LED luminaire as well as the six different groups experience a fixed phase shift during one period T leading to a PWM signal which is 24 times higher in duty cycle and frequency compared to standard PWM dimming.
Summary of spatial PWM patterns.
4. Experimental setup for visual validation
For the visual experiment only four of the nine LED luminaires were used in order to ensure an adequate amount of light falling onto the reference surface ranging between 500 lx and 1000 lx, which is the official DIN standard for the illumination of indoor work places.
15
Subsequently, two different test setups, which are illustrated in Figure 7(a) and (b), have been chosen, both giving a uniformity in illuminance of at least 80% measured on the reference surface.
Spatial distribution of the two test setups used for the visual validation of the spatially shifted PWM patterns. Grey shaded black squares indicate LED units being switched on at a constant current of 350 mA. The contour lines represent the corresponding spatial illuminance distribution (in lx) measured at 0.8 m above the ground. (a) Rhombic test setup consisting of three different LED groups (black numbers); (b) Rectangular test setup consisting of four different LED groups (black numbers)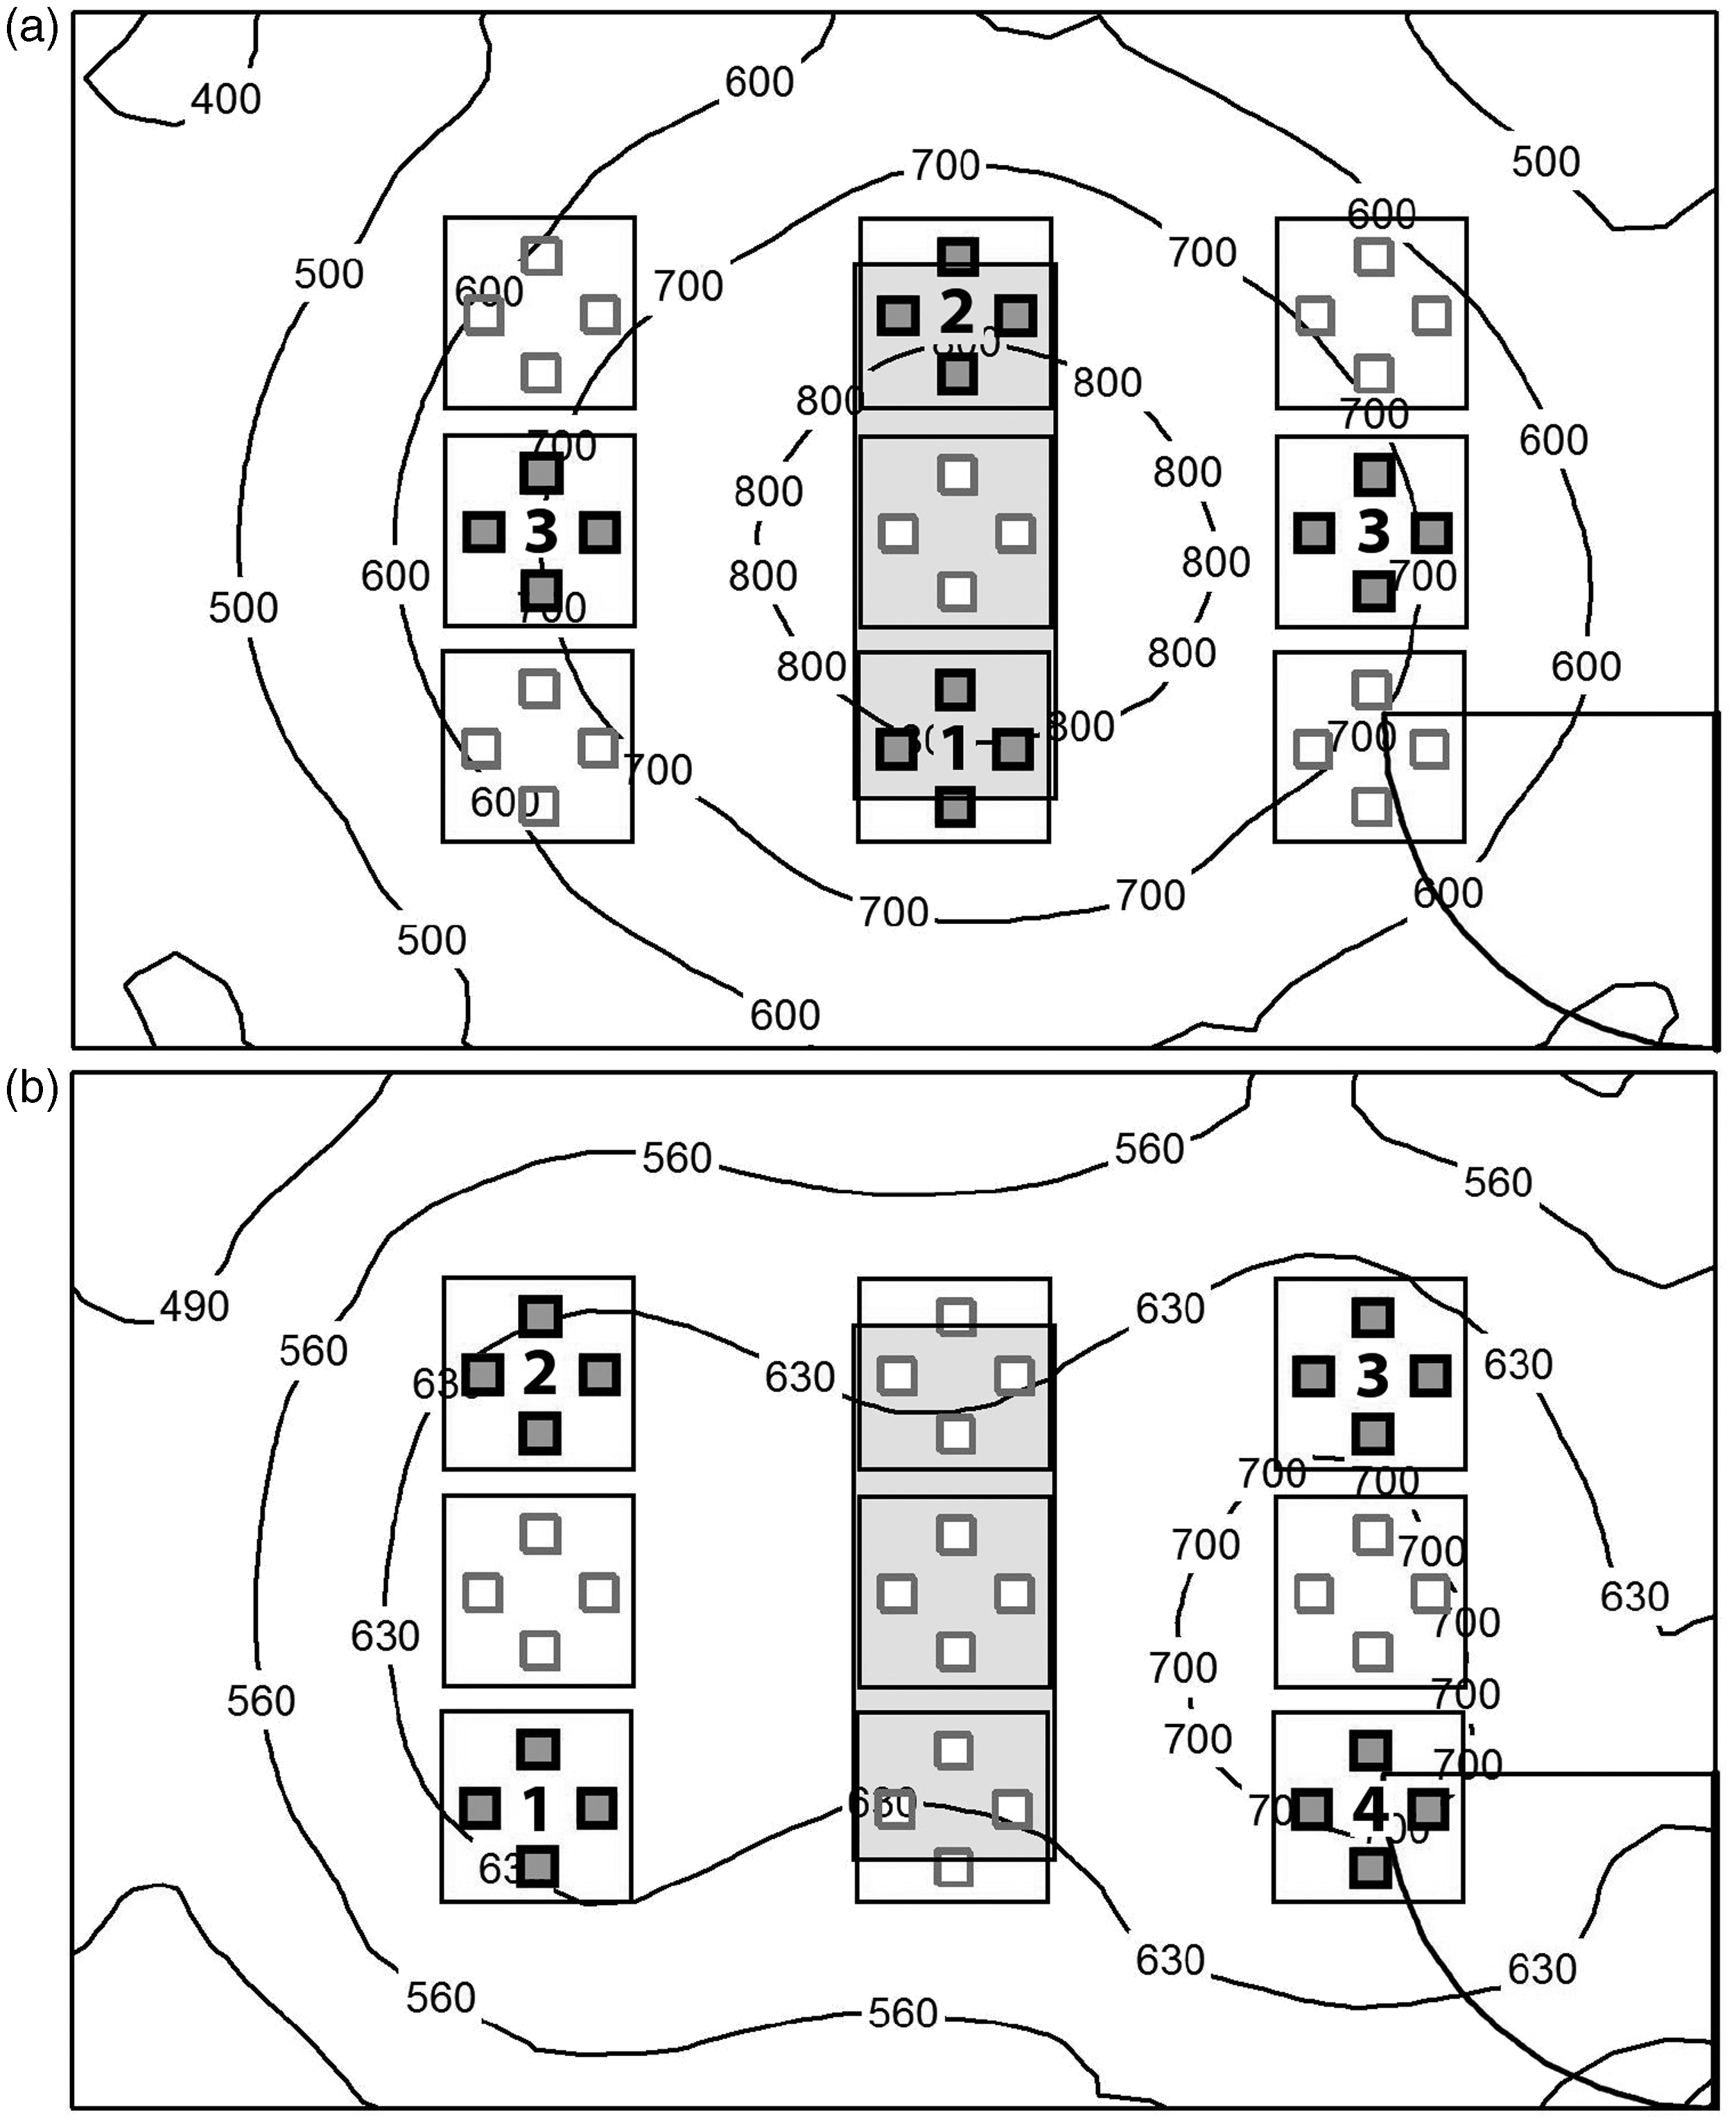
Note that the rhombic setup of Figure 7(a) consists of three different LED groups whereas in the rectangular case of Figure 7(b) four different LED groups can be identified. Consequently, the rhombic (rectangular) setup in combination with the ‘space standard’ PWM pattern leads to a three (four) times higher duty cycle and frequency compared to standard PWM dimming whereas the ‘space shift’ PWM pattern gives a PWM signal which is 12 (16) times higher in duty cycle and frequency. It should be further noticed that in the rhombic (rectangular) case both spatial PWM patterns show a higher offset in luminous flux as soon as the duty cycle for each LED unit reaches a multiple of 33.33% (25%) and 8.33% (6.25%), respectively.
The single LED units of each LED luminaire were controlled via self-designed power supplies using field programmable gate arrays to generate square wave PWM signals at a frequency of 100 Hz, which is slightly above the critical flicker fusion frequency,16,17 and with phase shifts ranging between 0° and 360°. The LED driving current was set in such a way that for both test setups the mean illuminance on the reference surface was 1000 lx at 100% duty cycle for each LED unit, i.e. at constant light output of the respective LED luminaires. The illuminance was monitored using a calibrated photometer. Note that the resulting spatial illuminance distributions are not explicitly shown here since they differ only quantitatively from the simulations shown in Figure 7(a) and (b).
In the next step, a total number of 13 subjects (aged from 21 to 37 years) participated in the visual experiment in order to evaluate the visibility of PWM-induced stroboscopic effects using the two spatially shifted PWM patterns discussed in Section 3. For each combination of test setup and spatial PWM pattern, four different duty cycle values were used (1%, 5%, 10% and 20%, respectively). In all cases, the modulation depth of the light emitted by a single LED luminaire mounted in the ceiling of the experimental room was
For the visual experiment, a test disc (see Figure 2) was used which had been placed right in the middle of the reference surface. The black disc has a diameter of 27 cm and rotates at a velocity of
The subjects were seated at the reference surface and all 32 lighting conditions were shown three times in randomized order. Each time the subjects were asked to report whether or not they could observe any stroboscopic effect similar to the one seen in Figure 2. There was no time limit for the subjects to give their answers. However, most of them answered within 10 seconds for each lighting condition so that the whole experiment took less than 20 minutes per subject (φ 15.3 minutes). Hence, no fatigue of the test persons’ eyes was expected which is supported by the fact that no significant differences between their answers at the beginning and the end of the experiment could be observed.
5. Results of the visual experiment
In Figure 8 the results for the different spatially shifted PWM patterns are summarized and compared to both standard PWM dimming and constant light emission. For each combination of test setup and PWM pattern, the absolute and the relative number of subjects that perceived stroboscopic effects are shown as a function of the duty cycle. Note that subjects were considered in the results only if they had claimed to notice stroboscopic effects at least twice within the three repetitions of the same lighting condition, i.e. in more than 50% of the cases. This method of analysis is widely used in psychology and neuroscience and aims to account for expectation and habituation errors.
18
Perception rate of the stroboscopic effect for different combinations of test setup and PWM pattern as a function of the duty cycle. The numbers on top of the bars indicate the absolute number of subjects that perceived stroboscopic effects. (a) Results for the rhombic test setup, see Figure 7(a); (b) results for the rectangular test setup, see Figure 7(b)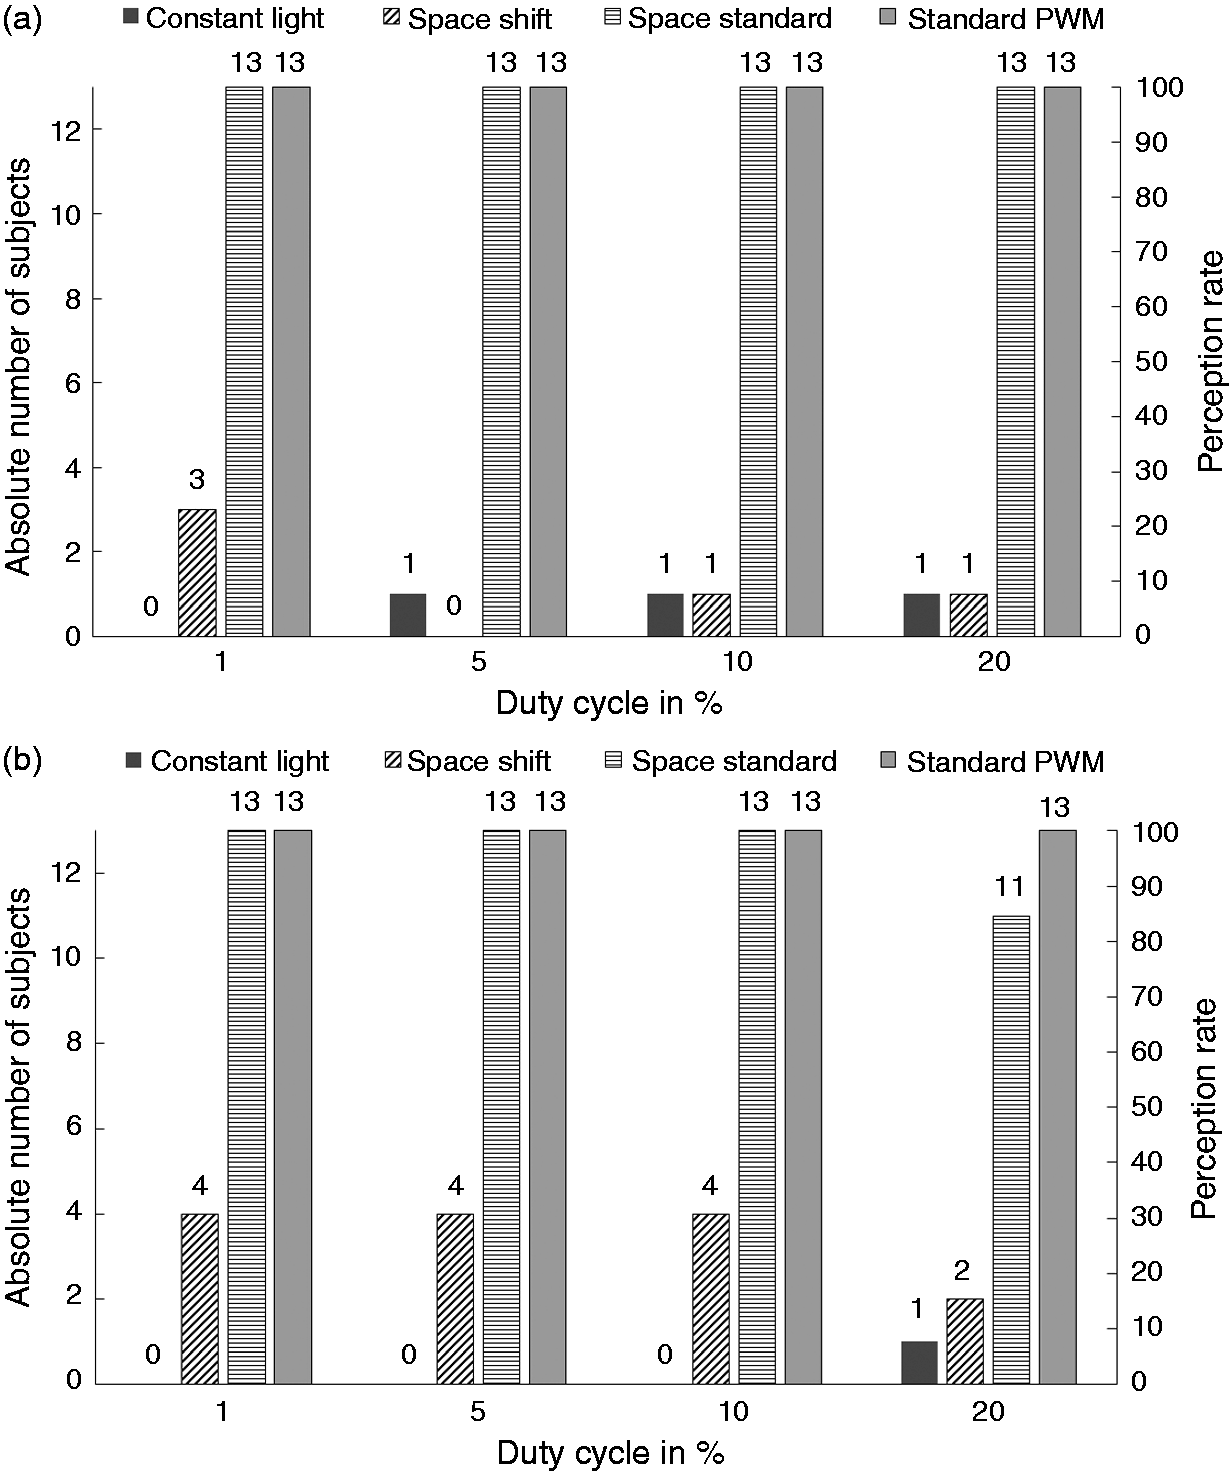
As can be seen from Figure 8(a) and (b), visual artefacts were widely perceived for both test setups when using the ‘space standard’ PWM pattern, i.e. no significant improvement over standard PWM dimming could be observed. In these cases, moderately small integrated light frequencies of 300 Hz and 400 Hz were measured on the reference surface for the rhombic and rectangular test setup, respectively.
Using the ‘space shift’ PWM pattern, on the other hand, leads to drastically reduced visual artefacts, especially for the rhombic test setup where the stroboscopic effect is negligible small. Here, even at 1% duty cycle it is perceived by only 23% of the subjects. In contrast, the rectangular test setup shows a slightly higher perception rate regarding the stroboscopic effect. Nevertheless, it also applies in this case that the visual artefacts could be reduced by more than 60% compared to standard PWM dimming.
For both test setups, integrated light frequencies of 1200 Hz in the rhombic case and 1600 Hz in the rectangular case could be measured on the reference surface, indicating that increasing the PWM frequency has a much bigger influence on the perception of the stroboscopic effect than a sole increase in duty cycle.
From Figure 8(a) it is further obvious that if the ‘space shift’ PWM pattern is applied to the rhombic test setup this leads to integrated waveforms that are practically indistinguishable from constant light emission verifying the excellent performance of our approach.
6. Conclusion
In this work, we have presented a phase-shifted spatial-integration method to minimize the stroboscopic effect that could be observed in typical interior-lighting applications when PWM-driven LED luminaires are used. Depending on the geometry of the specific lighting application, a huge variety of phase-shift-based PWM patterns can be realized leading to significantly higher duty cycles and frequencies compared to standard PWM dimming.
For validation purposes, the spatial-integration method was implemented in a dedicated experimental room to conduct a visual experiment for which two different spatially shifted PWM patterns were selected. It could be shown that increasing the PWM frequency has a much bigger influence on the perception of the stroboscopic effect than a sole increase in duty cycle. Hence, the goal of designing PWM patterns for specific applications in interior lighting should always be to achieve a significant increase in frequency compared to standard PWM dimming in order to minimize stroboscopic effects. By doing so, it can be shown that our approach leads to integrated waveforms that are practically indistinguishable from constant light emission.
Regarding an implementation of the proposed method in interior-lighting applications, special care must be taken to ensure complete spatial integration of the light coming from different luminaires. If the spatial integration is incomplete or the illumination is not diffuse enough, disturbing spatio-temporal artefacts among shadows may arise. Another disadvantage regarding the potential use of PWM to transmit data by light 19 is that the spatial integration might prevent such a use. Additional research and discussions are necessary.
It should be further noted that the phase-shifted spatial-integration method is not limited to interior-lighting applications only. An implementation in street, automotive and sports lighting is also feasible. Research on these topics is currently being performed by our group.
Footnotes
Acknowledgment
The authors would like to thank Sebastian Fischer, Jonas Kobbert and Peter Bodrogi for fruitful disscusions and their support during the writing process of this paper.
Declaration of conflicting interests
The author(s) declared no potential conflicts of interest with respect to the research, authorship, and/or publication of this article.
Funding
The author(s) disclose receipt of the following financial support for the research, authorship, and/or publication of this article: This work is part of the Project PQL (Standardization of a Performance Quality Label – PQL – for LED luminaires) funded by the German Federal Ministry of Economic Affairs and Energy (BMWi).