
Abstract
Instrumentation for photometry, radiometry and colorimetry has developed significantly over the past fifty years. New measurement techniques and types of detectors as well as miniaturisation of computers and electronic hardware have fundamentally changed both the size, design and complexity of instrumentation and the way that we go about our measurement work. There has also been a significant change in mindset as the increasing need for accountability for measurement results and recognition of the role of traceability and measurement uncertainty have become more pronounced. This paper summarises the state of photometric laboratories in the 1960s and list some of the key highlights in the development of instrumentation and measurement techniques since then. It is not intended as a strict chronological account of technological invention, but a reflection of how and when these technologies were adopted and adapted to light measurements, along with accompanying key papers published in Lighting Research and Technology and associated journals over that time.
1. Introduction
Light measurement techniques and instrumentation have developed at an ever-accelerating pace in the last fifty years, driven by diverse technological advances and the increasing expectations of users. As always, the competing demands of increasing accuracy and decreasing costs determine the direction and speed of changes, but the lighting industry has often benefited from technological advances in other applications, giving almost quantum leaps of development. Conversely, ideas and technologies that do not provide significant or lasting improvements are consigned to the history books.
2. 1960s
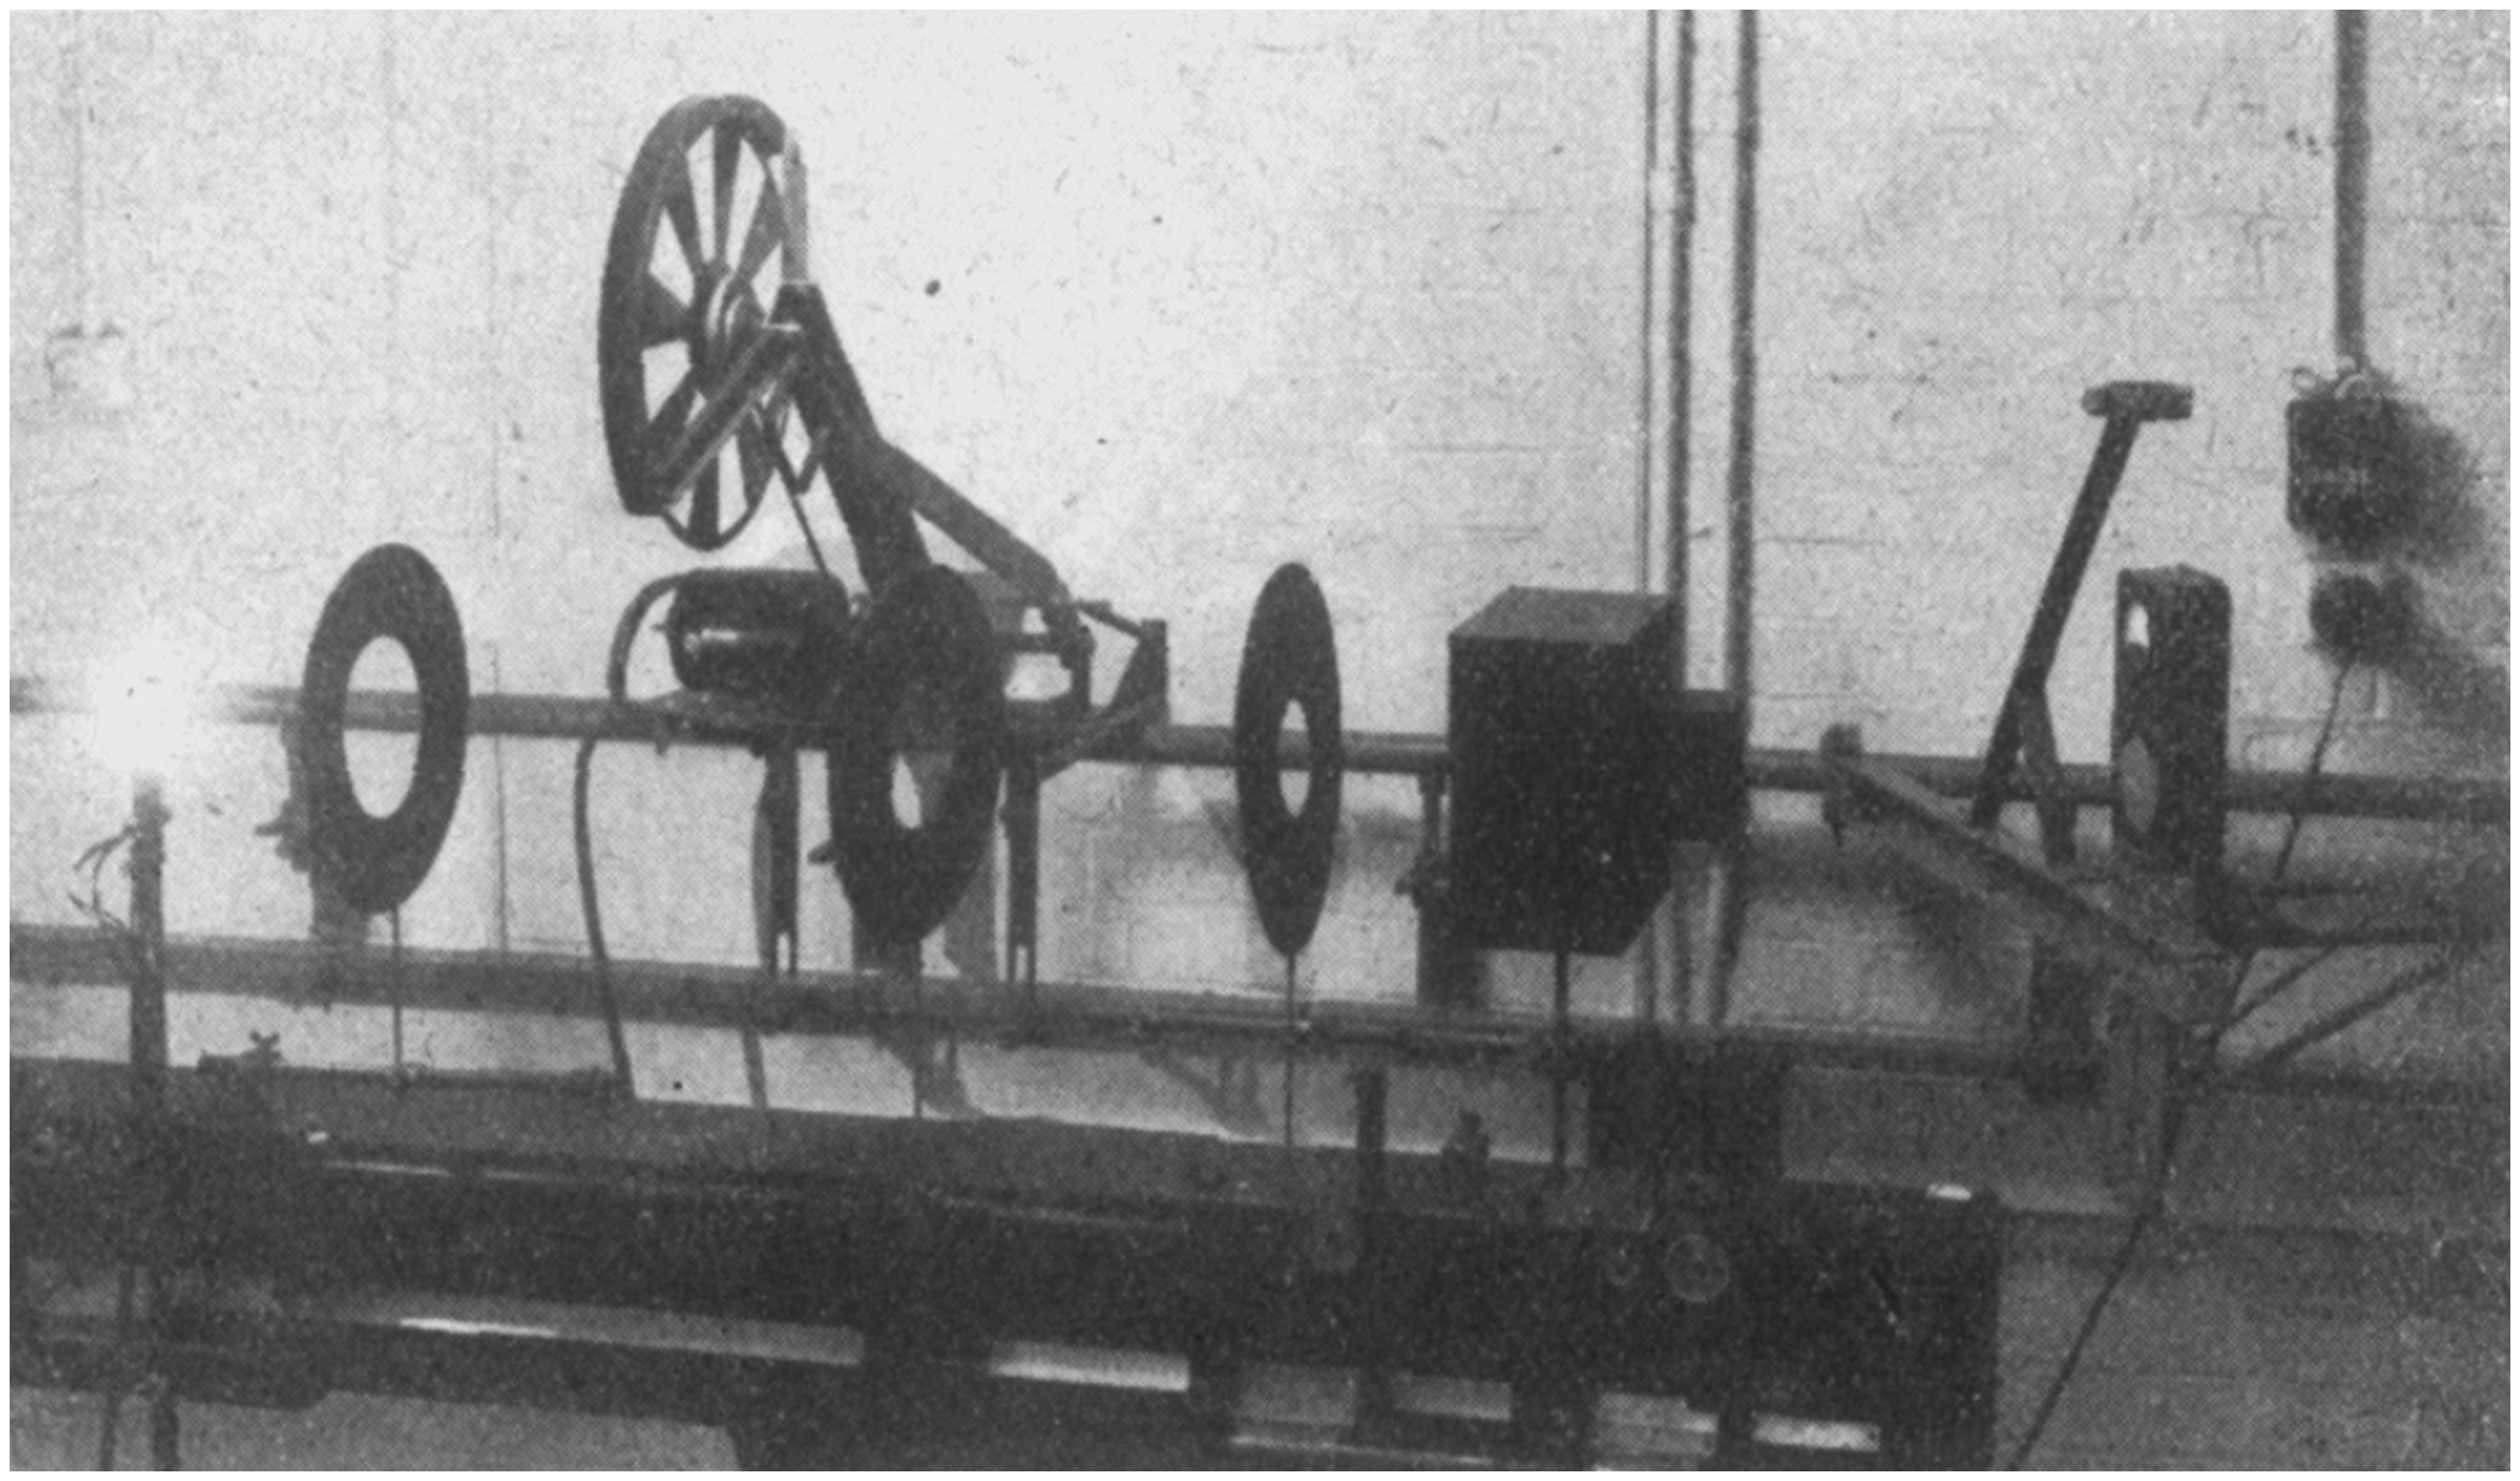
People involved in light measurement today would have a hard time appreciating the knowledge and hard work typical of fifty years ago. Most of the quantities required today were already established by this time but the instruments to measure them were in the early stages of development. Fifty years ago, values were often obtained using a mixture of visual comparison methods and measurement instrumentation. The computers and digital electronics that are integral to today’s systems were in their infancy and still far too bulky and expensive to be practical in everyday measurements of light. Instead, photocells or photomultipliers and manual amplifiers gave readings that were read from analogue meters and written down. Commercial equipment was available but at a high price, so much of the equipment was built in the laboratories making the measurements and users required extensive knowledge of all aspects of their instruments and applications. Measurements of light were therefore often made by experts in the field or trained technicians. Equipment for calibrating illuminance meters could look similar to that shown in Figure 1.
Setup for ‘photoelectric photometer’ calibration in the mid-twentieth century
1
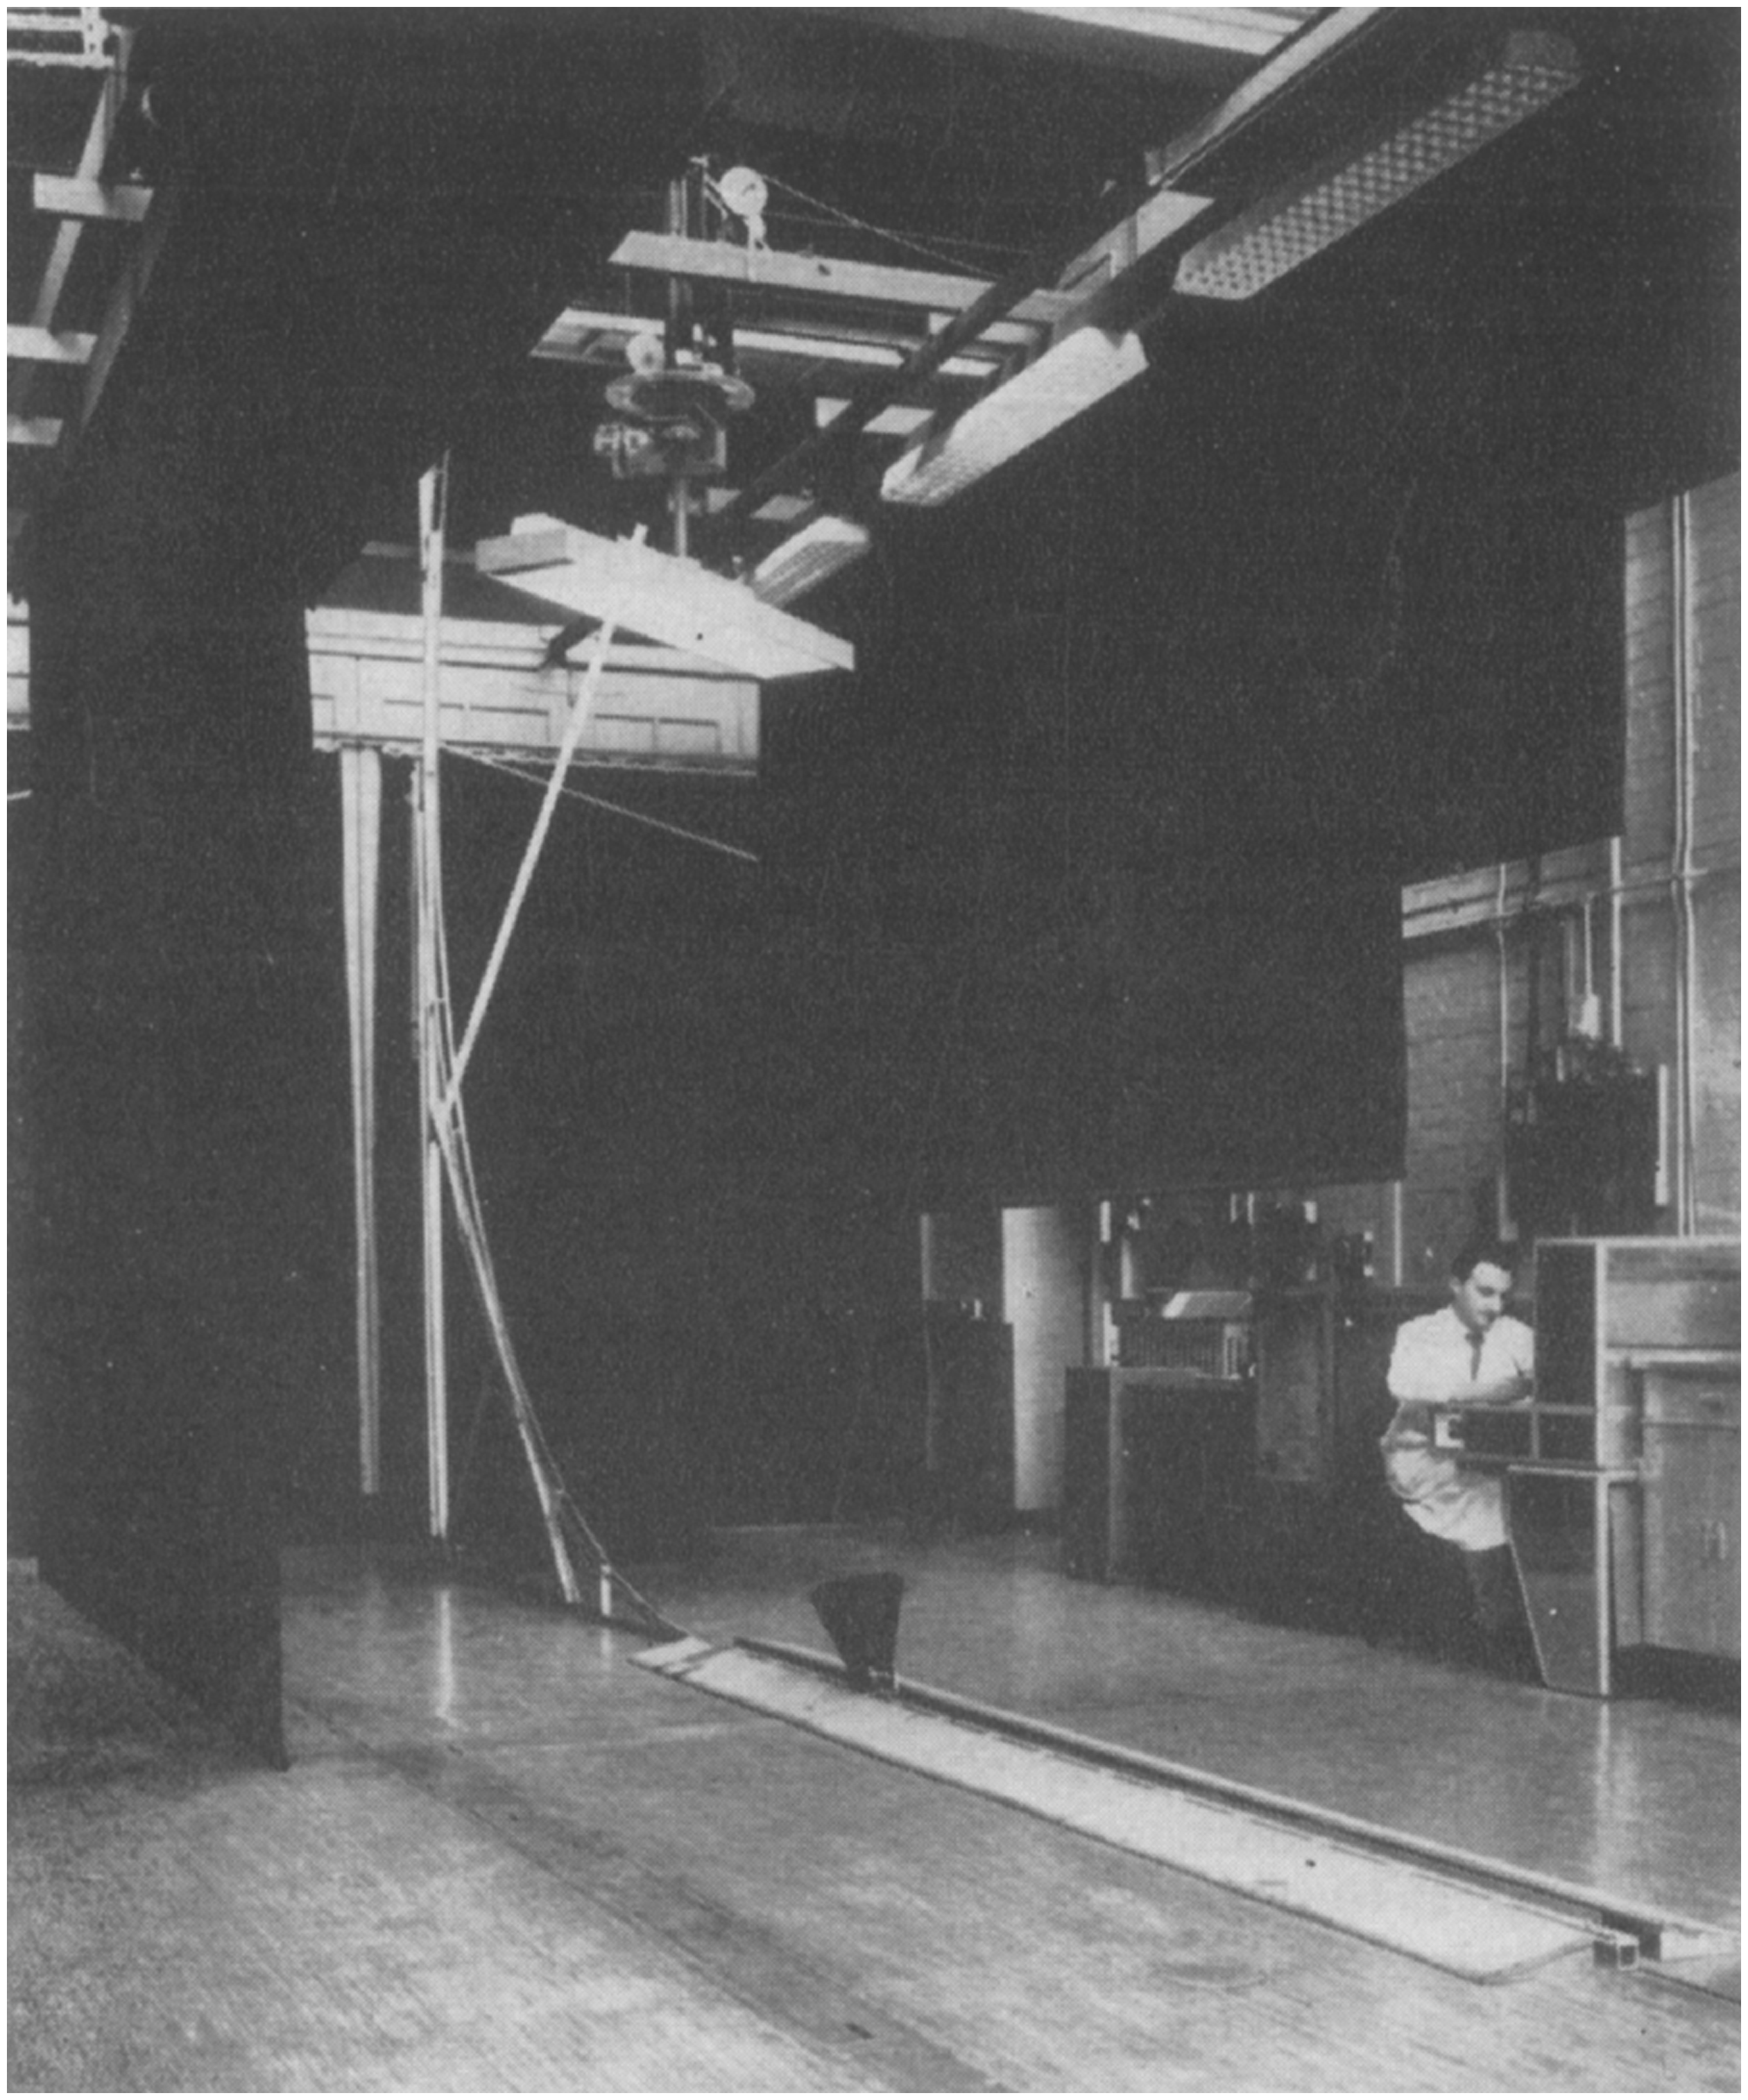
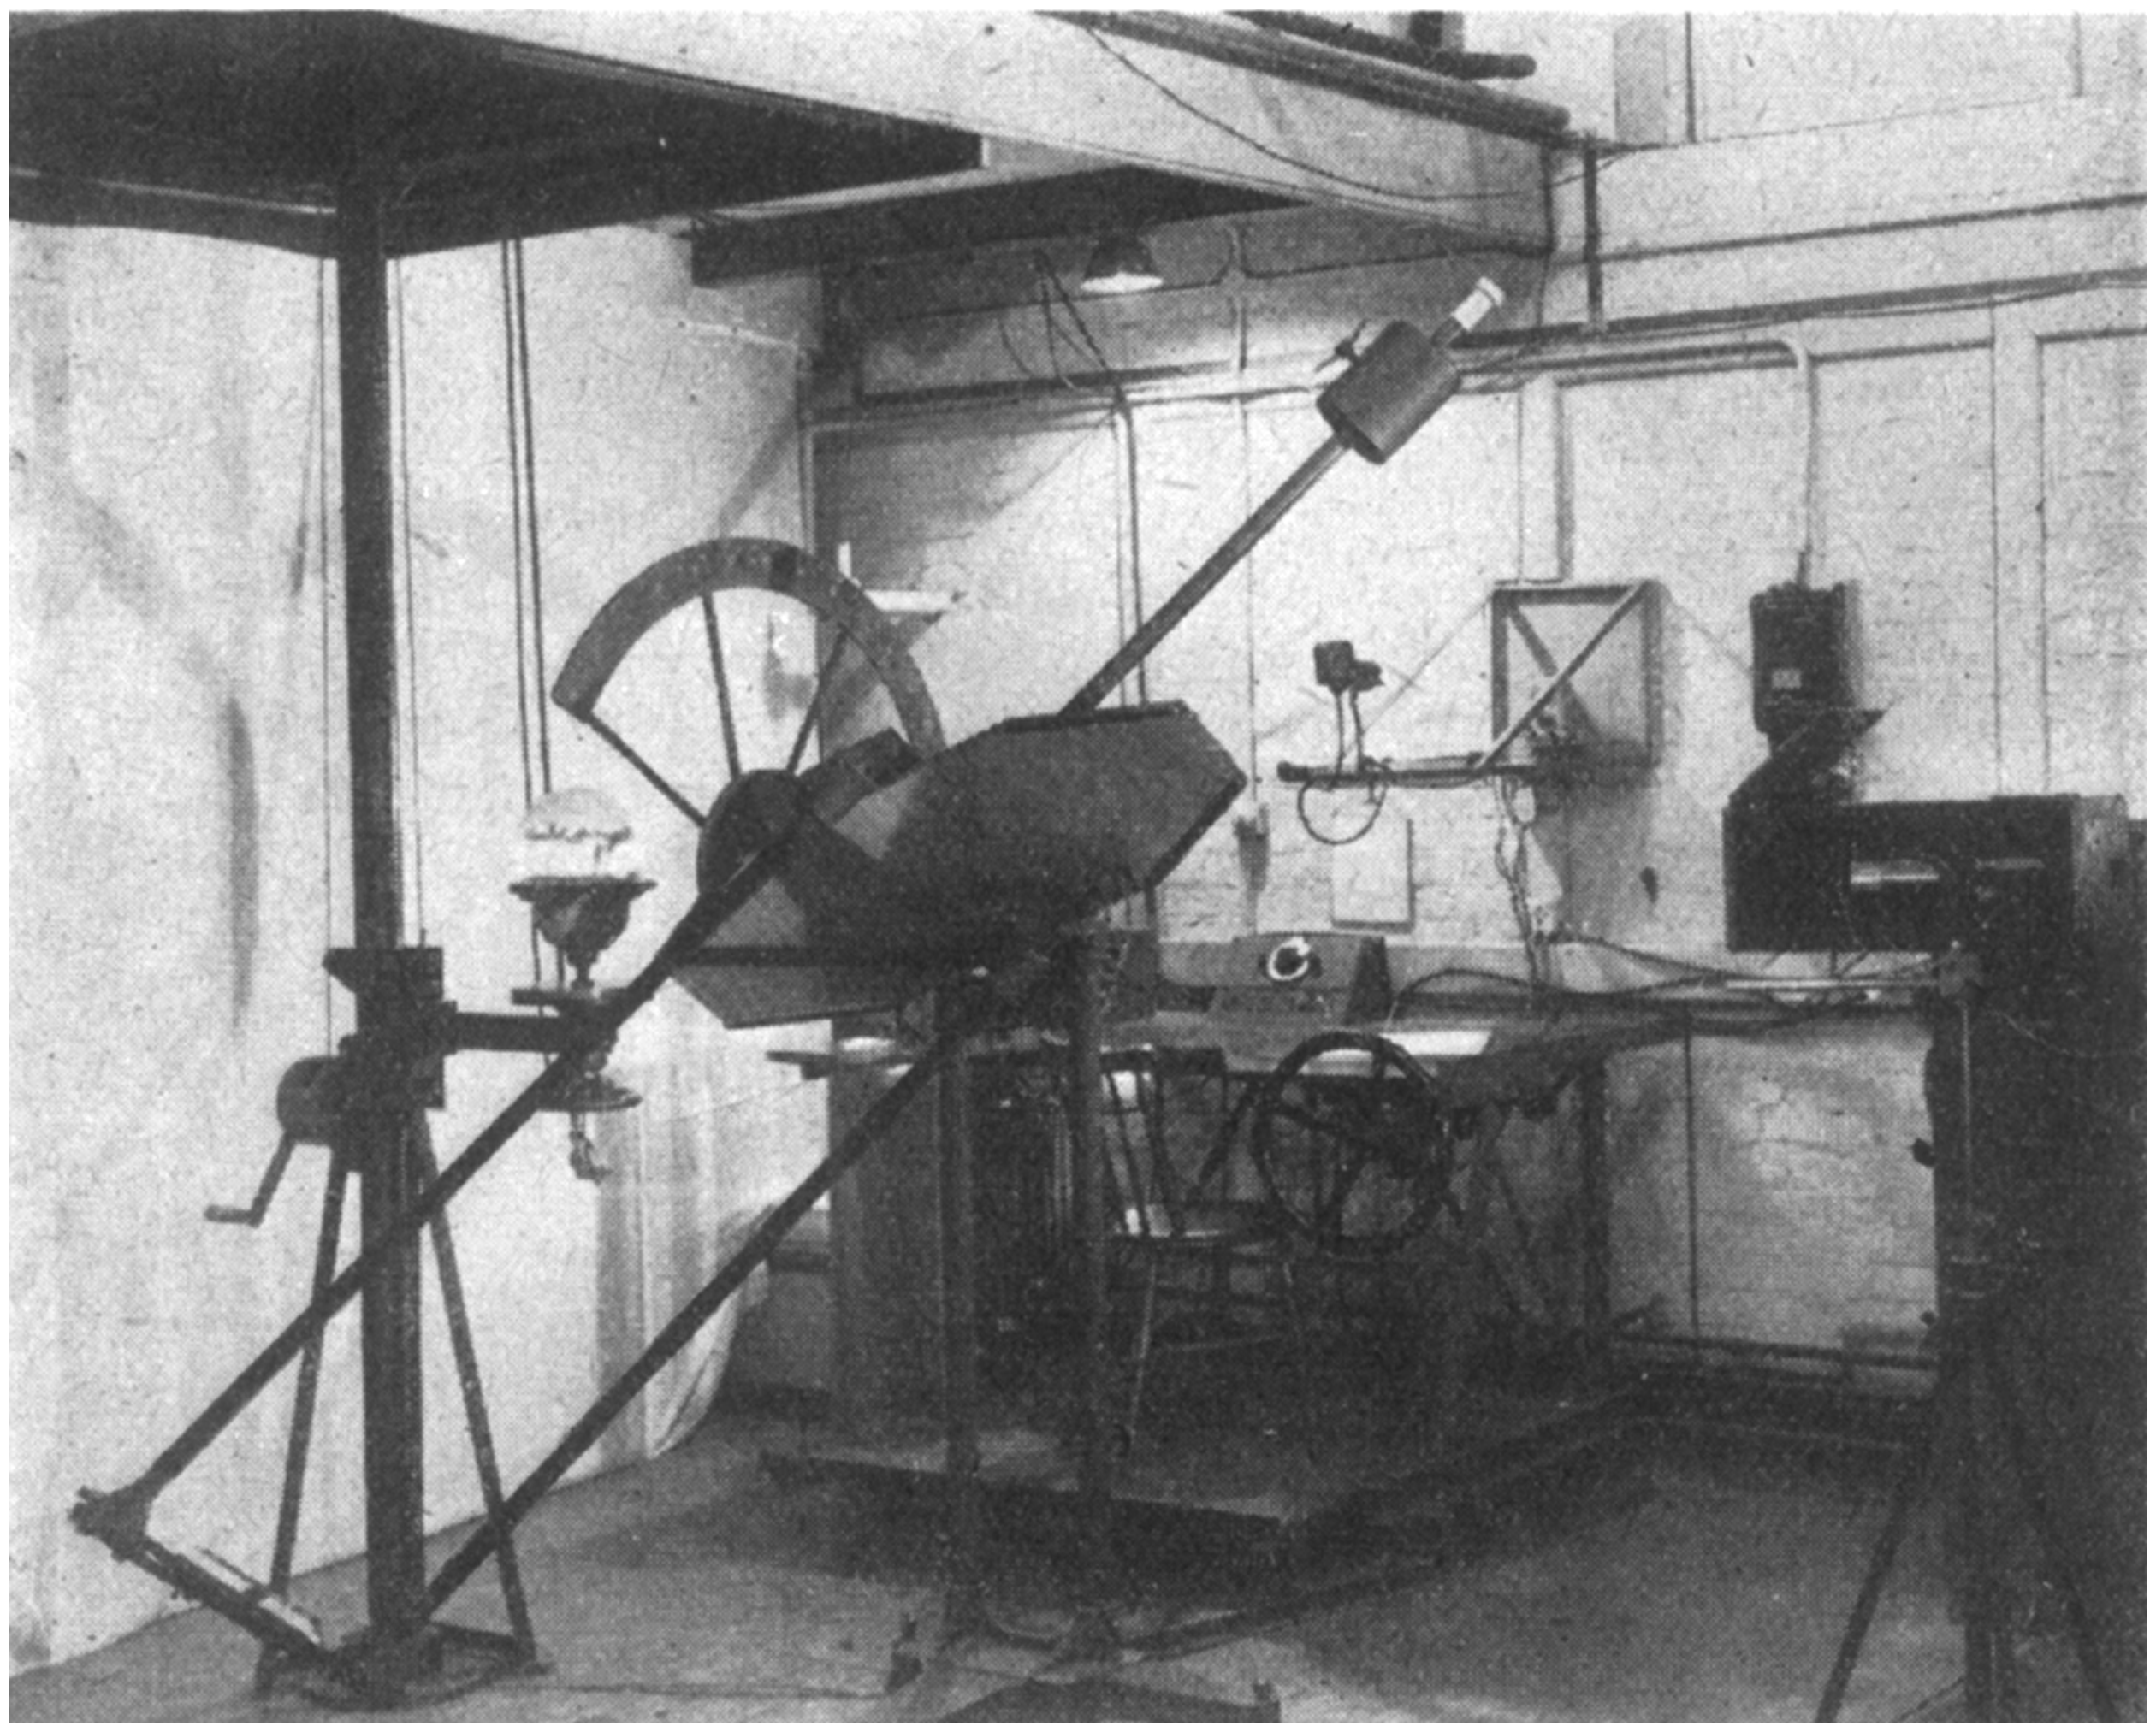
Diffraction gratings were now available commercially at reasonable prices due to replication and holographic processes. This decreased costs and led to an expansion of monochromator development. If equipment required moving parts, such as a goniometer or monochromator, this was usually achieved by the operator manually positioning it or by a constant speed motor (synchronous or DC) to scan a range. During scans, a chart recorder would trace the changes in signals, providing a record that could be read and interpreted later, or the scan would be made painstakingly by moving to a point (angle or wavelength), taking a reading, then moving to the next point and so-on. Mirror goniophotometer systems from this time are shown in Figures 2 and 3. In the system shown in Figure 3, there are two mirrors used in order to avoid a long swinging arm. Handwheels are connected to the light source’s turntable and also to the mirror arm by wire rope drives so that the operator may control the rotation of both axes while sitting at the desk.
Early goniophotometer system with the detector on a semi-circular track
2
Mirror goniophotometer in the mid-twentieth century
1
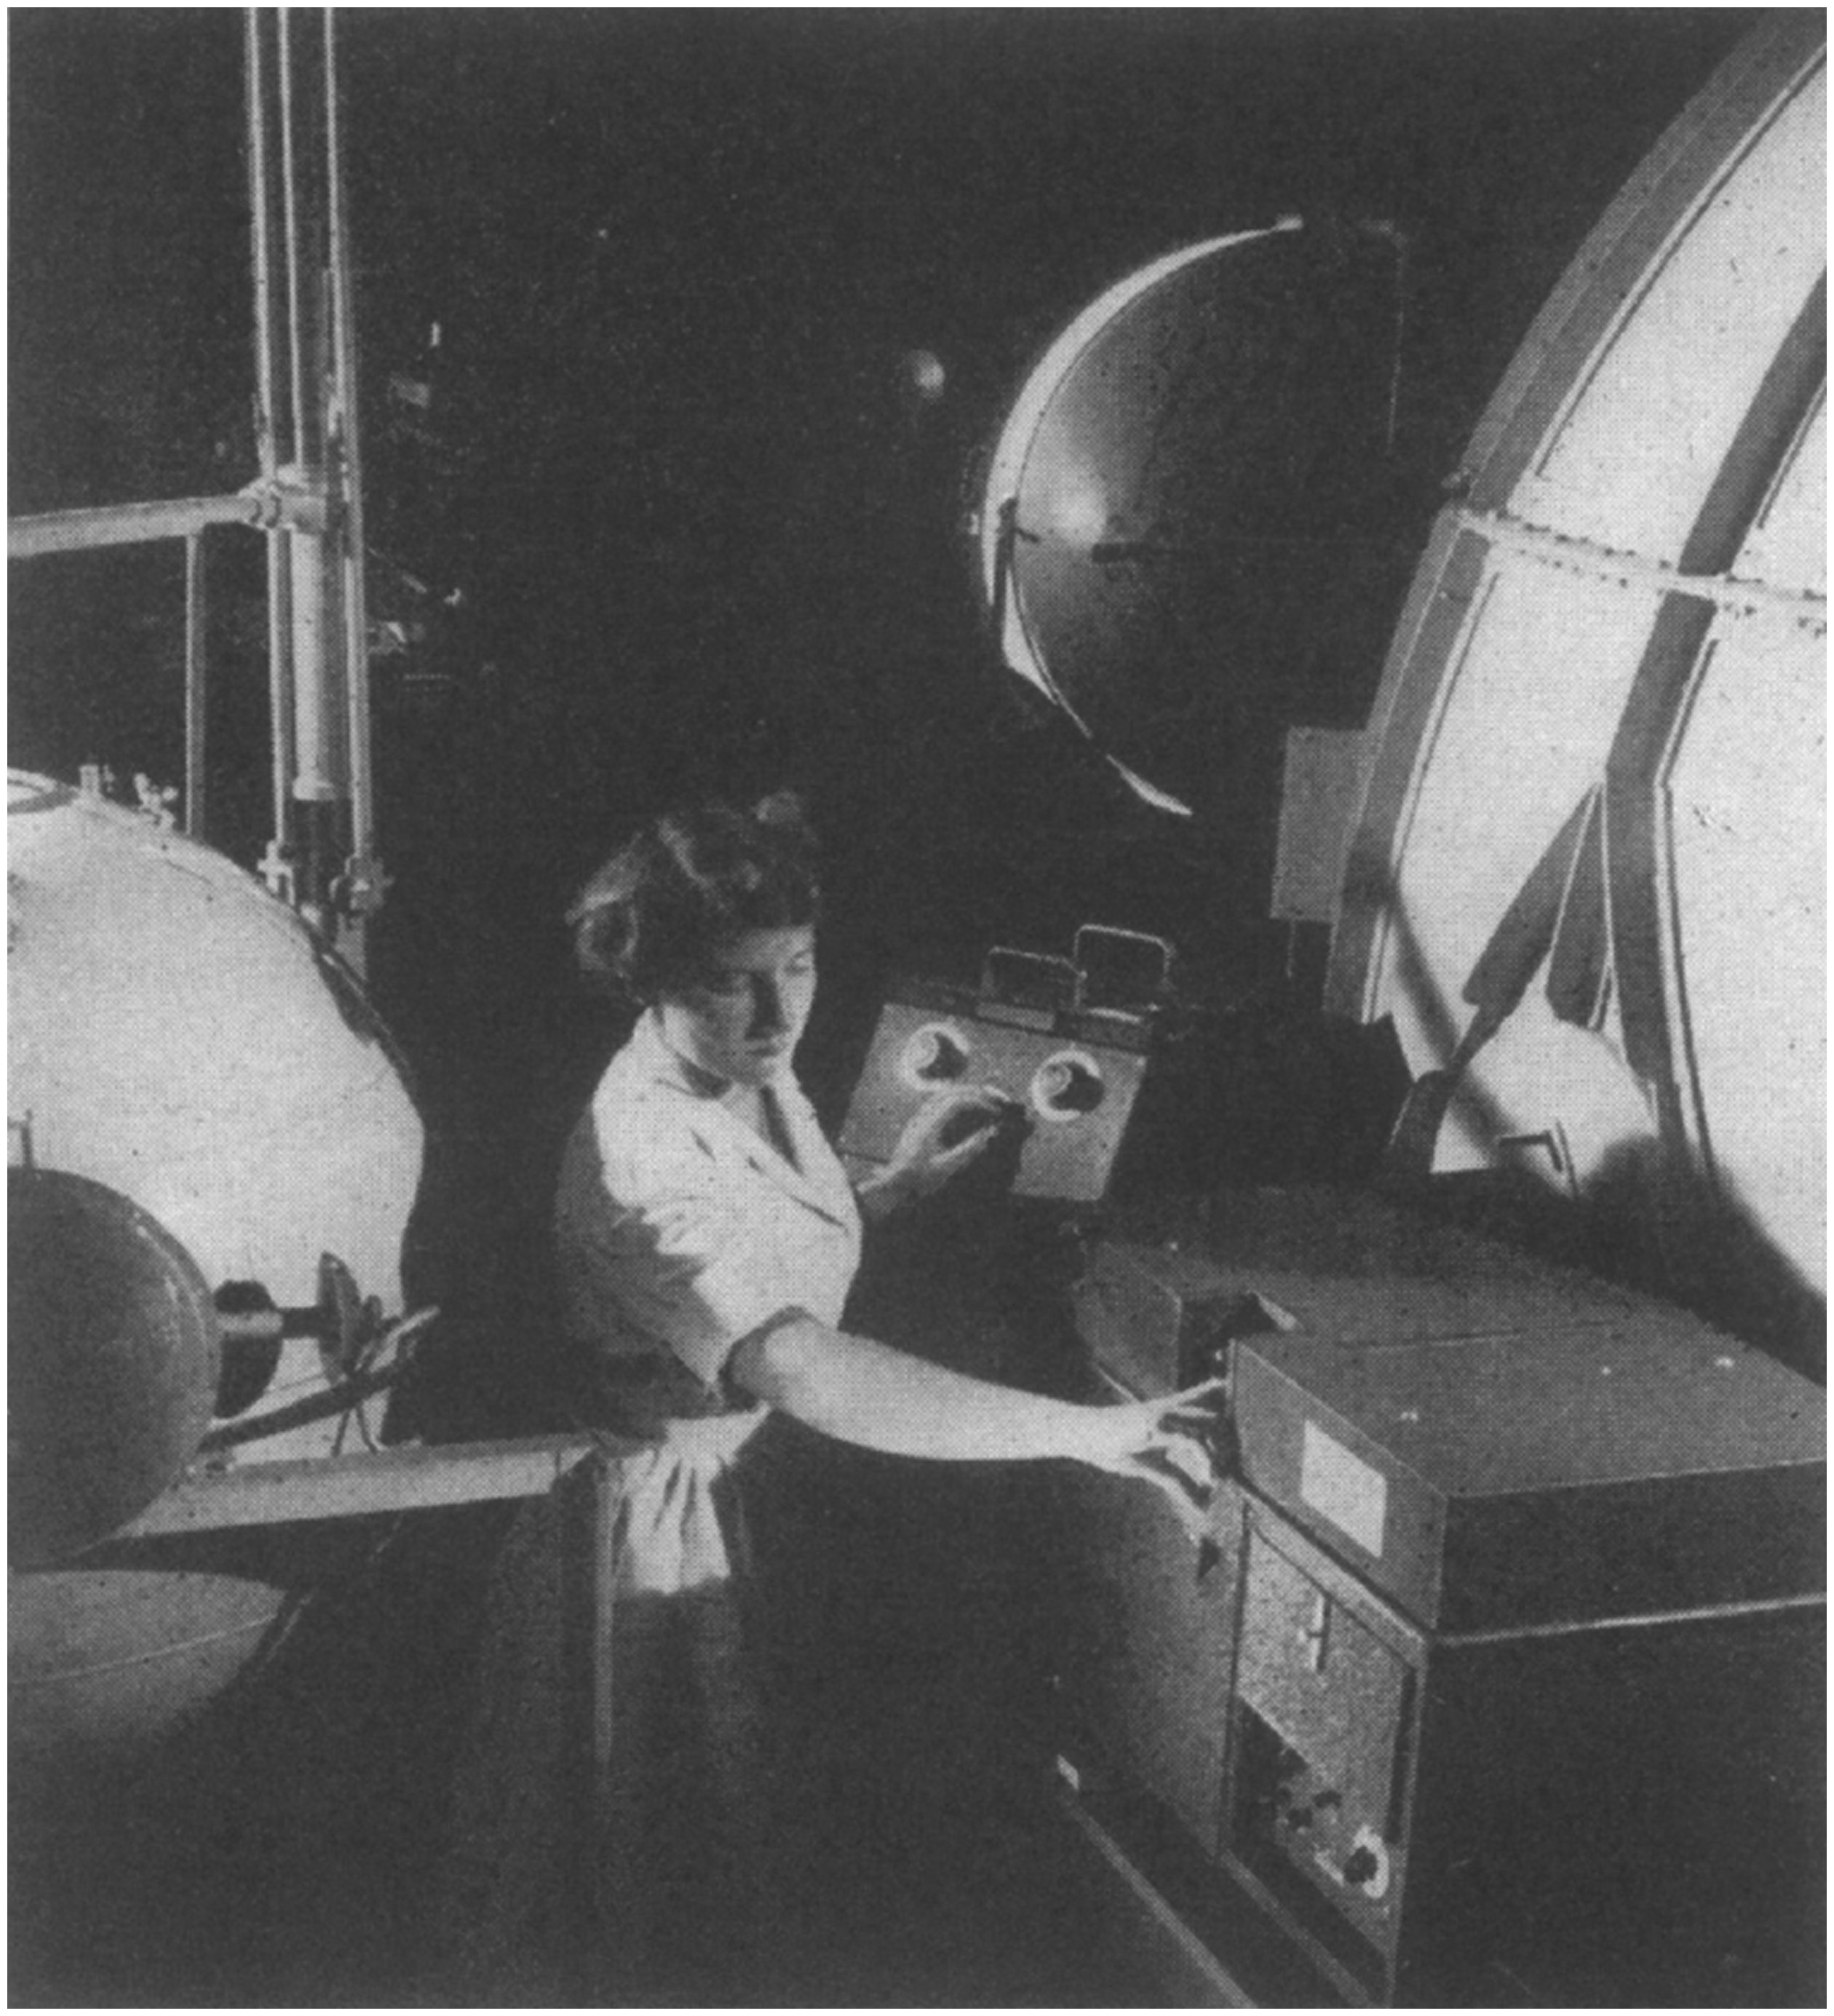
Integrating sphere photometers were already in common use, although the processing electronics looked very different to that of today, as shown in Figure 4.
Integrating sphere photometers and the associated electronics
3
Measurements of fast changes in light, such as TV phosphor persistence, were often made using oscilloscopes and photographing the trace.
Calculations would be made manually or by entering data into a computer. As a result of the manual measurement, data entry and processing, measurements were often very limited. Spectral measurements were often made on instruments with coarse bandwidth and with wide wavelength intervals. Goniophotometric data were made with coarse angular intervals. There was widespread use of look-up tables to assist with the post-processing of data, such as shown in Figure 5.
Chart for zonal flux evaluation of a street lighting lantern
2
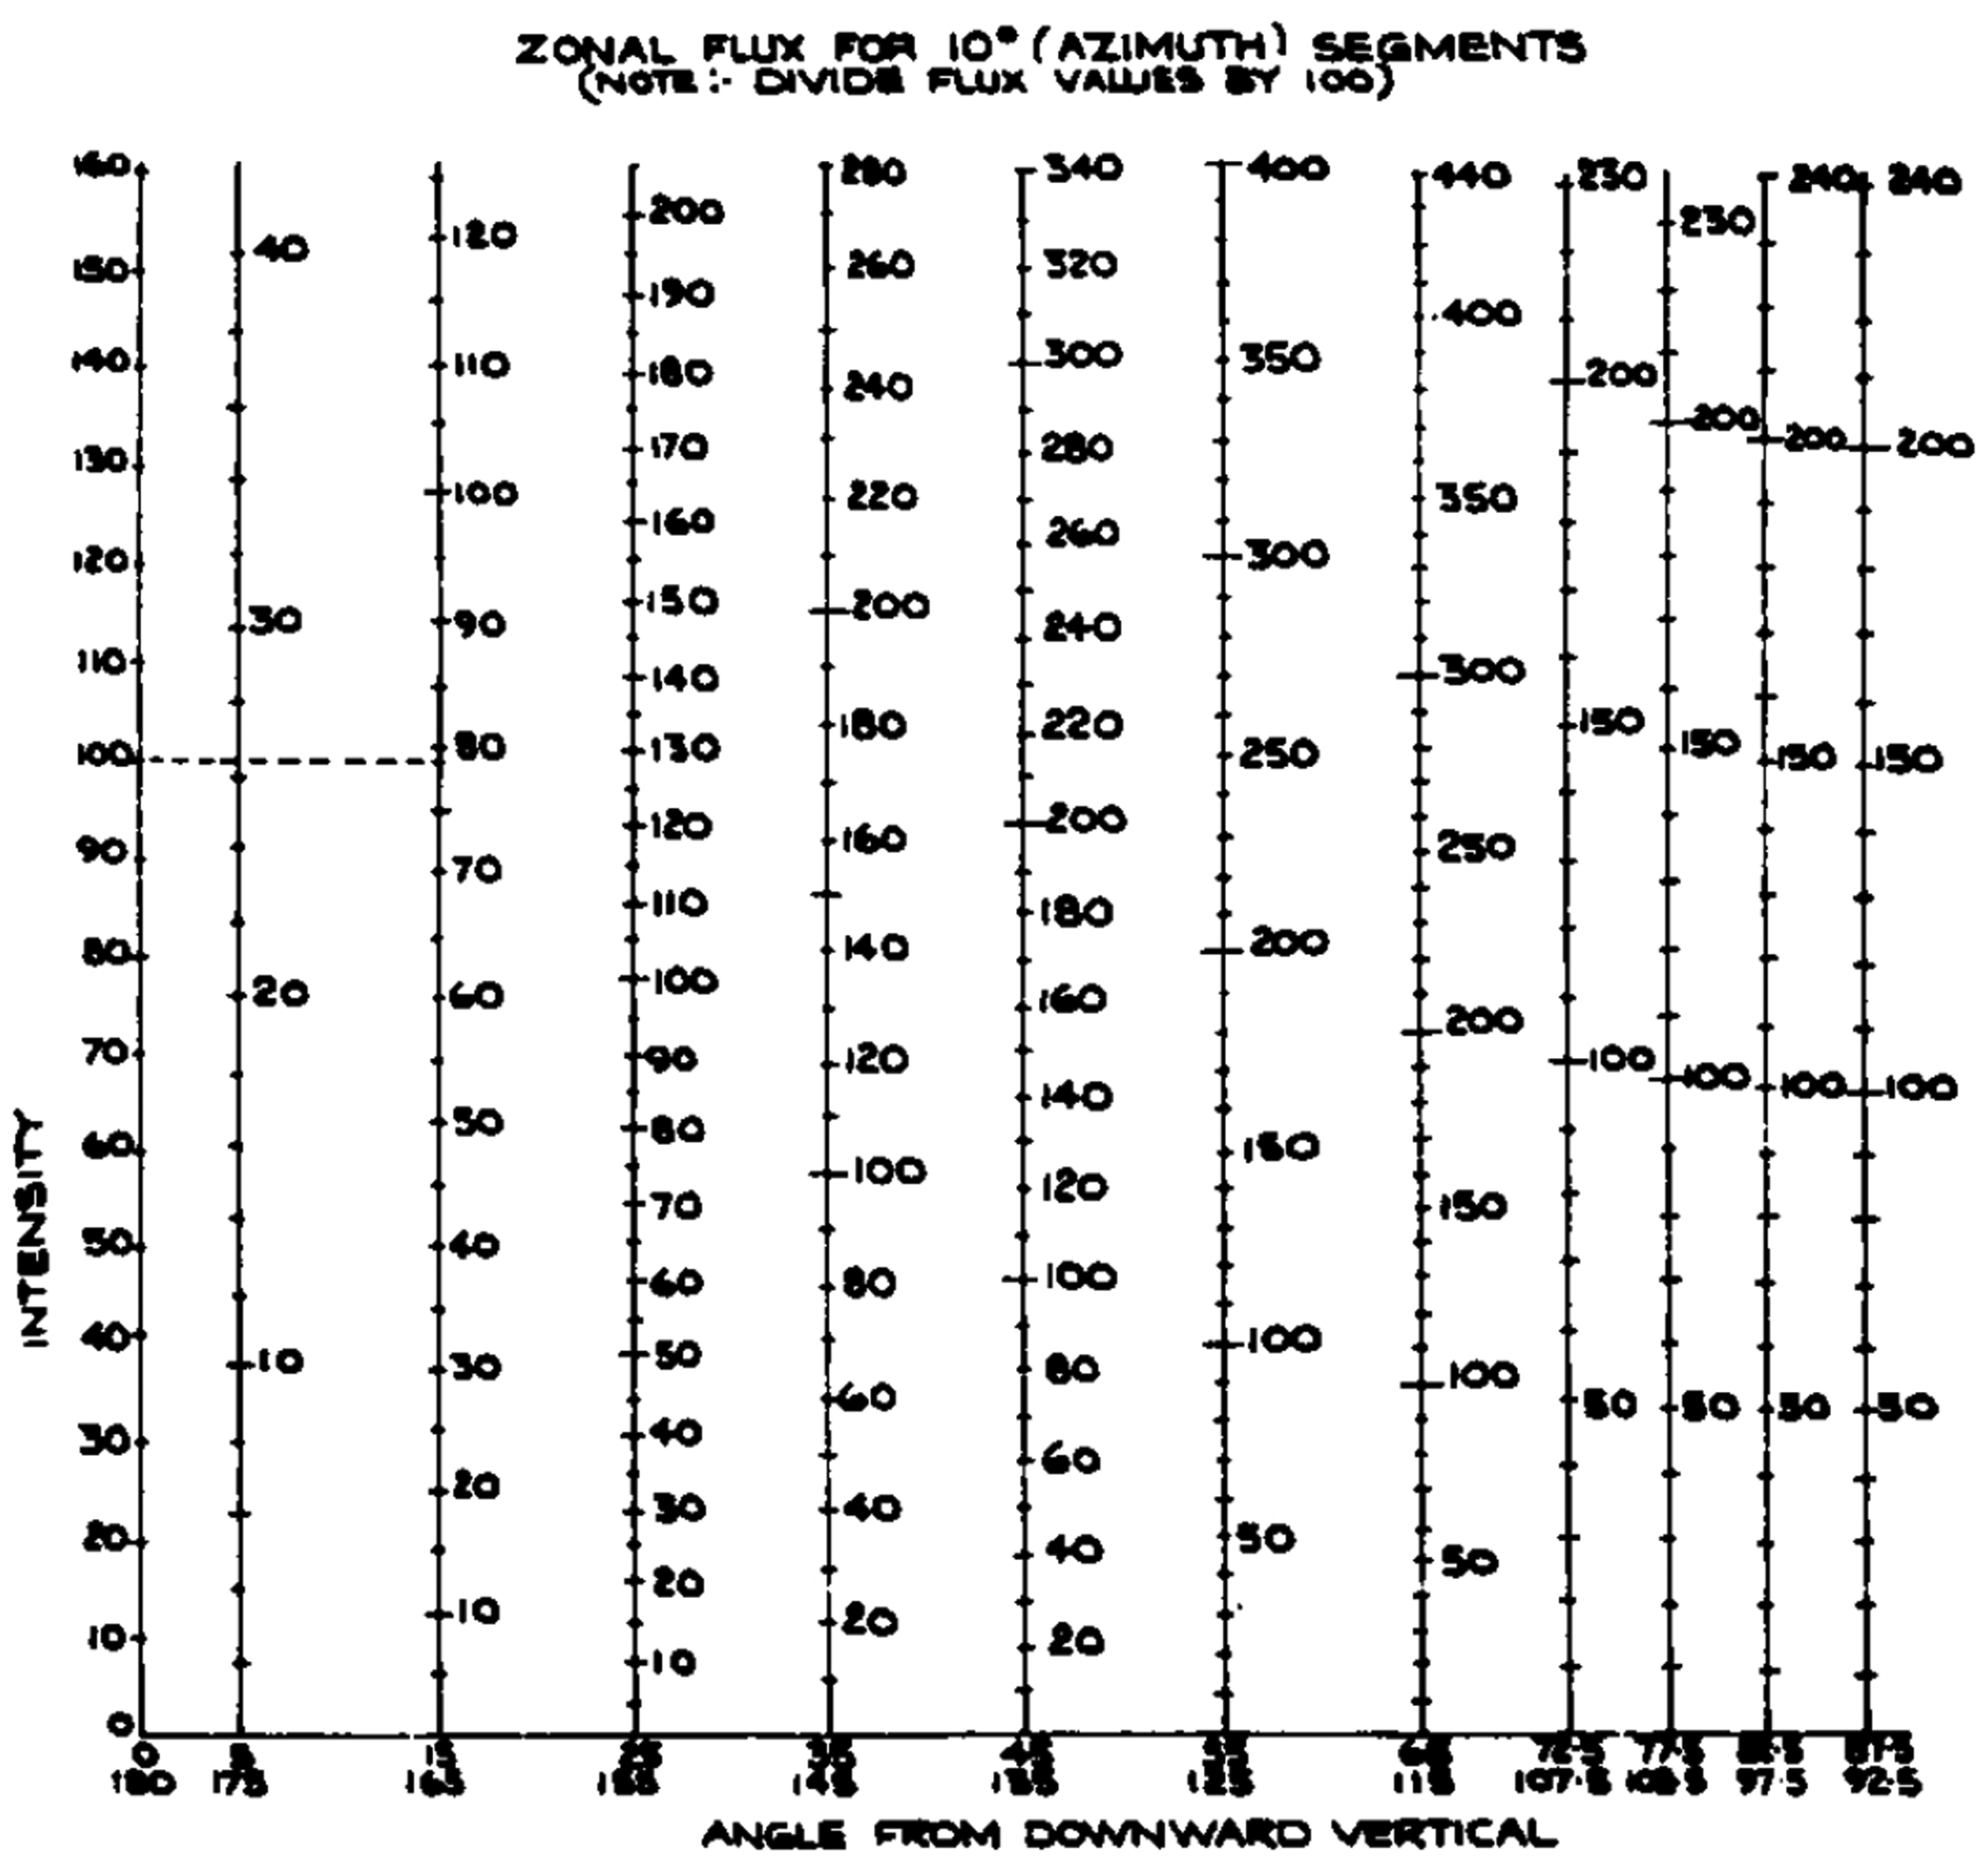
For example, after meticulously recording the illuminance at a range of angles on a goniophotometer, the operator would then calculate the average illuminance at each elevation angle, multiply by the square of the test distance to determine the luminous intensity, then multiply this by a zonal lumen multiplier in order to determine the luminous flux emitted within that cone angle. This would be summed over the elevation angles in order to determine the total luminous flux output of the source. For simplicity, it was common to use a test distance of 3.162 m or 10 m so that the conversion from illuminance to luminous intensity involved a factor of 10 or 100, respectively.
The crudity of equipment and meticulousness of taking measurements meant that the accuracy of measurements was often not up to the levels desired. Winch 4 despaired that ‘Currently the desired accuracy of spectral energy distribution and chromaticity measurements can scarcely be achieved, even with the most expensive forms of precision instruments.’
3. 1970s
The 1970s saw diverse developments that began a revolution in instrumentation. Personal computers became readily available and at a price that allowed one to be dedicated to a single type of measurement. Their relatively small size also meant they could be physically in the same laboratory as the measurement setup, so they could be interfaced and perform the measurements automatically.
During this time, solid state analogue and digital components developed rapidly, allowing the interfacing and control required to quickly and efficiently connect all types of devices from simple photometers to digital oscilloscopes.
Mostly, the computers effectively pressed the buttons and took the readings that the operator would otherwise perform, but even at this stage it marked the beginning of transfer of the required expertise from the operator to the computer programmer. Programs often included data reduction to calculate final quantities and print or graph results. However, as memory was generally limited to just tens of kilobytes, programs were necessarily small and data storage was often a problem.
When physical movement was required, PCs allowed accurate synchronisation of motors and data streams, improving accuracy and eliminating user errors. Stepper motor technology was also adopted at this time to allow both variable speed movement and positioning, giving many options to measurement methods. As a result, goniometers and spectroradiometers increased in sophistication and versatility.
Tubular fluorescent lamps became popular, leading to testing recommendations such as CIE 24-1973.5,6 In this decade, more laboratories converted to automated (computerised) goniometric measurement systems (i.e. goniophotometers, also called distribution photometers at this time), and more companies began developing and offering these products commercially. Because luminaires incorporating these tubular lamps were large and the laboratory space available was small, methods of reducing the test distance by using ‘reverse collimation’ were introduced. This and the automation of goniophotometers are discussed in CIE 24-1973. 6
Luminance measurements were still often performed by visual match with a comparison source. A device for measuring luminance outside the photometric laboratory was proposed by Howell et al., 7 while Fuller et al. 8 introduced a portable instrument for measurement of hemispherical illuminance. People were still experimenting with different materials for use in photometric detectors, see for example the work of Guha. 9
Displays were developing, including CGA colour displays, which were used in presenting results but also as the subject of the measurement themselves. Spot photometers, already existing, were no longer enough and spot colorimeters were becoming common in some applications.
4. 1980s
Photometers and colorimeters were increasing in sophistication; offering higher accuracy and a variety of source measurement types such as DC, AC and pulsed. Visual photometry methods became less frequently recommended or even actively discouraged for most quantities, increasing the reliance on instrumentation, although instruments continued to be introduced which employed both aspects. 10
Computer memory continued to expand, increasing the range of applications and sophistication of measurements. Computer programs controlled most aspects of measurement, decreasing the need for operator knowledge.
Fueled by a user demand for faster and faster measurements, especially in spectroradiometry, instruments featuring continuously rotating gratings appeared on the market. Some of these were very small, introducing issues of stray light, whereas others were full size instruments that simply traded more noise in measurements for an increased speed. This trade-off between speed of measurement, size of equipment and quality of measurement continues to be important today. The need for measurement accuracy in spectroradiometry for determining conformance to standards, amongst other things, was discussed by Jewess, 11 while Moore 12 discusses sources of error in spectroradiometry and Wharmby 13 discusses some spectroradiometer configurations and applications.
Another approach to fast measurements was to use photodiode arrays, developed originally for other applications. Coupled to spectrographs originally designed for photographic film, these exploited the multiplex advantage of measuring all the wavelengths at the same time, rather than scanning through them, and led to the development of today’s array spectroradiometers, but at this stage their resolution and poor sensitivity severely restricted their use.
The practices of goniophotometry and integrating sphere photometry continued to be developed, with much effort spent in refining and improving the techniques for best practice and in analysis of measurement uncertainty. Frederiksen 14 looked at issues with the consistency of measured luminous intensity distributions, while research continued on determining the optimum test distance for goniophotometry of focused luminaires.15,16 Gentile et al. 17 studied the uncertainty of luminous flux measurement on a goniophotometer. De Visser and van der Woude 18 used mathematical modelling to optimise several aspects of the construction of an integrating sphere.
Commercial software became available to read in the luminous intensity distribution data obtained from a goniophotometer and create simulations of lighting installations.
CCD cameras started to be used to provide two-dimensional maps of luminance distributions. This could be used for analysis of lighting systems such as ANSII 9 point or ANSII 13 point measurements of projectors, which was tedious to do with a spot meter, and camera flash systems, which enabled a far more accurate method of measuring spatial uniformity because all locations were measured for a single flash as opposed to measurements over multiple flashes when using a spot photometer.
The introduction of absolute cryogenic radiometers (although only in the domain of National Measurement Institutes (NMI)) enabled a dramatic improvement in the accuracy and consistency of absolute scales of measurement and lower measurement uncertainty.
5. 1990s
CCD arrays, developed for astronomy and space applications, began to be used in place of photodiode arrays. Cooling, sometimes using liquid nitrogen, was required for high performance so these continued to occupy specialist markets. However, a parallel development of CCDs for use in digital cameras and document scanners gave a rapid phase of performance improvement and price reduction so that by the end of the decade some cheap systems entered the market. Still lacking in the accuracy provided by spot photometers and scanning spectroradiometers, they nevertheless hailed a rapid expansion of use of such instruments.
The introduction of CCD cameras also gave rise to a new goniophotometric technique called near-field goniophotometry. With this technique, digital images of a source (lamp or luminaire or other source) are taken at many angles in space. Using a mathematical relation between the 2D luminance map produced by the digital image and the position of the camera, the individual pixels in the images can be converted into corresponding individual rays of light that project into an imaginary sphere around the source. By accumulating these rays over many measurement points around the source, a far-field luminous intensity distribution can be obtained by a system with a very compact size, compared with the long test distances and large rooms required by traditional far-field goniophotometers. Furthermore, the distribution of rays generated by a near-field goniophotometer can be used to simulate an illuminance distribution at any area in space near to or far from a source.
Other techniques of far-field goniophotometry continued to be introduced, including systems employing multiple (many) photometers fixed at the required elevation angles and having a single axis of rotation, as described by Pritchard et al. 19 Chander et al. 20 cautioned on the need to keep sources in their designed burning position or make the necessary corrections.
CCD cameras also started to be used in production-line testing of lighting products. A light source, such as a car headlamp or a traffic signal, would be imaged onto a screen using a Fresnel lens. A CCD camera would take an image of the light distribution on the screen and, using a dedicated calibration that took into consideration the geometric relation of the source, lens, screen and camera, convert these luminance data to a corresponding luminous intensity distribution of the beam.
PCs became even smaller and more powerful, enabling a complete computer to be incorporated into a small, portable instrument. Software became readily available for advanced data analysis and processing, enabling more complicated modelling to be performed and Monte Carlo techniques for uncertainty analysis. 21
The concept of absolute measurement of luminous flux in an integrating sphere was introduced at NIST in the USA. Here, a beam of light of known luminous flux is introduced into the sphere from outside, and this beam is used to calibrate the luminous flux response of the sphere rather than relying on reference lamps inside the sphere. 22
6. 2000s
Array spectroradiometers continued to develop into all areas of light measurement except for the highest accuracy requirements. Performance-limiting issues such as stray light were beginning to be addressed in a constructive way and correction techniques developed.
CCD cameras, combined with high-accuracy filter formulations, provide accurate luminance and chromaticity images. These are used to great effect in applications previously dominated by scanning spot photometers and revolutionise measurements of complex scenes such as road and tunnel lighting 23 and bidirectional reflectance (transmittance) distribution function (BR(T)DF) applications.24,25 Cheaper alternatives, such as using commercial digital cameras, start to be used for lower accuracy requirements.26,27
Accreditation and uncertainty issues, raised in the 1990s, increase in importance as international markets open up. Mutual Recognition Arrangements (MRAs) between many NMIs are established. 28 Laboratories become increasingly aware of the importance of traceability; of uncertainty budgets; in maintaining a laboratory quality system; and in having well-established test procedures and laboratory accreditation.
Light emitting diode (LED) transfer standards, consisting of a temperature-controlled, current-controlled LED fixed in a housing and requiring only a non-regulated DC voltage input became available. These have very repeatable output and could be measured in one laboratory (usually luminous flux or on-axis luminous intensity) and then used to calibrate equipment in another laboratory.
In goniophotometry, more complex systems are introduced both for increasing the accuracy or functionality of the systems and for brand differentiation. Rosemann et al. 29 developed a system for performing photometry of hollow light guides which could not be performed on a normal goniophotometer or integrating sphere due to the size. Array spectroradiometers were used in conjunction with photometers for real-time spectral mismatch correction and for mapping the colour spatial uniformity of light sources. Robots were introduced; most famously in the robot goniophotometer at PTB Braunschweig (see Figure 6), but also 6-axis industrial robots started to be used to move the source and/or detectors in relation to each other in space.
Robots also found their way into gonioreflectometer systems for measuring diffuse reflection and BR(T)DFs. Using a robot to move and rotate a sample in space allowed for a simpler source and detector arrangement and reduced the mechanical complexity of such systems. By combining such a system with a spectroradiometer, the spectral reflectance of materials can be measured. 31
Near-field goniophotometers improved in speed and accuracy and became more commonly used.
LED luminaires became more common, leading to new standards, techniques and testing procedures. Rotating source goniophotometers, where the device under test is rotated to burning positions other than their designed burning position during measurement, became more and more popular because the output of LED luminaires is invariant to their position in respect to gravity (notwithstanding thermal effects, which are generally small and can easily be corrected for, and assuming that the luminaire is robust enough that it doesn’t physically deform as it is rotated). This technique was not so easy in the past with discharge sources, where the output of the lamp can vary by many percent as the lamp is tilted to different angles and hence it is much harder to correct and to produce accurate measurements.
Integrating spheres developed in several ways. First, the concept of a ‘2π port’ became more common, where directional (forward-emitting) sources would be placed external to the sphere and aimed in through a ‘window’ in the sphere. Second, spectroradiometers started to become the preferred detector for measurement of absolute luminous flux in a sphere. Prior to this a photometer would normally be used for absolute luminous flux measurements and spectroradiometers would only be used for integrated chromaticity measurements, however the spectral mismatch errors in photometers, particularly as the sphere paint aged and particularly for LED sources, could be significant and spectroradiometers had become stable enough to use for absolute measurements. Third, an integrating hemisphere concept was introduced, which consisted of a half-sphere and flat mirror. Fourth, advanced techniques for sphere characterisation and performance were introduced: sphere scanners to measure the uniformity of reflectance 22 became more commonly used; chopped auxiliary lamps for real-time self-absorption measurement; multiple-detector systems to correct for sources with significantly different spatial distribution to the calibration source, etc.
7. 2010s
Array spectroradiometers, now fast enough to measure in production environments while giving a complete range of optical quantities, provide a key component in intelligent manufacturing of LEDs and displays. Work continued to improve the accuracy and widen the range of applications of CCD cameras for high dynamic range luminance mapping.32,33
Miniaturisation continued, with full PCs reduced to the size of a credit card, enabling integrated detector/PC systems of very small sizes.
34
Cuttle
35
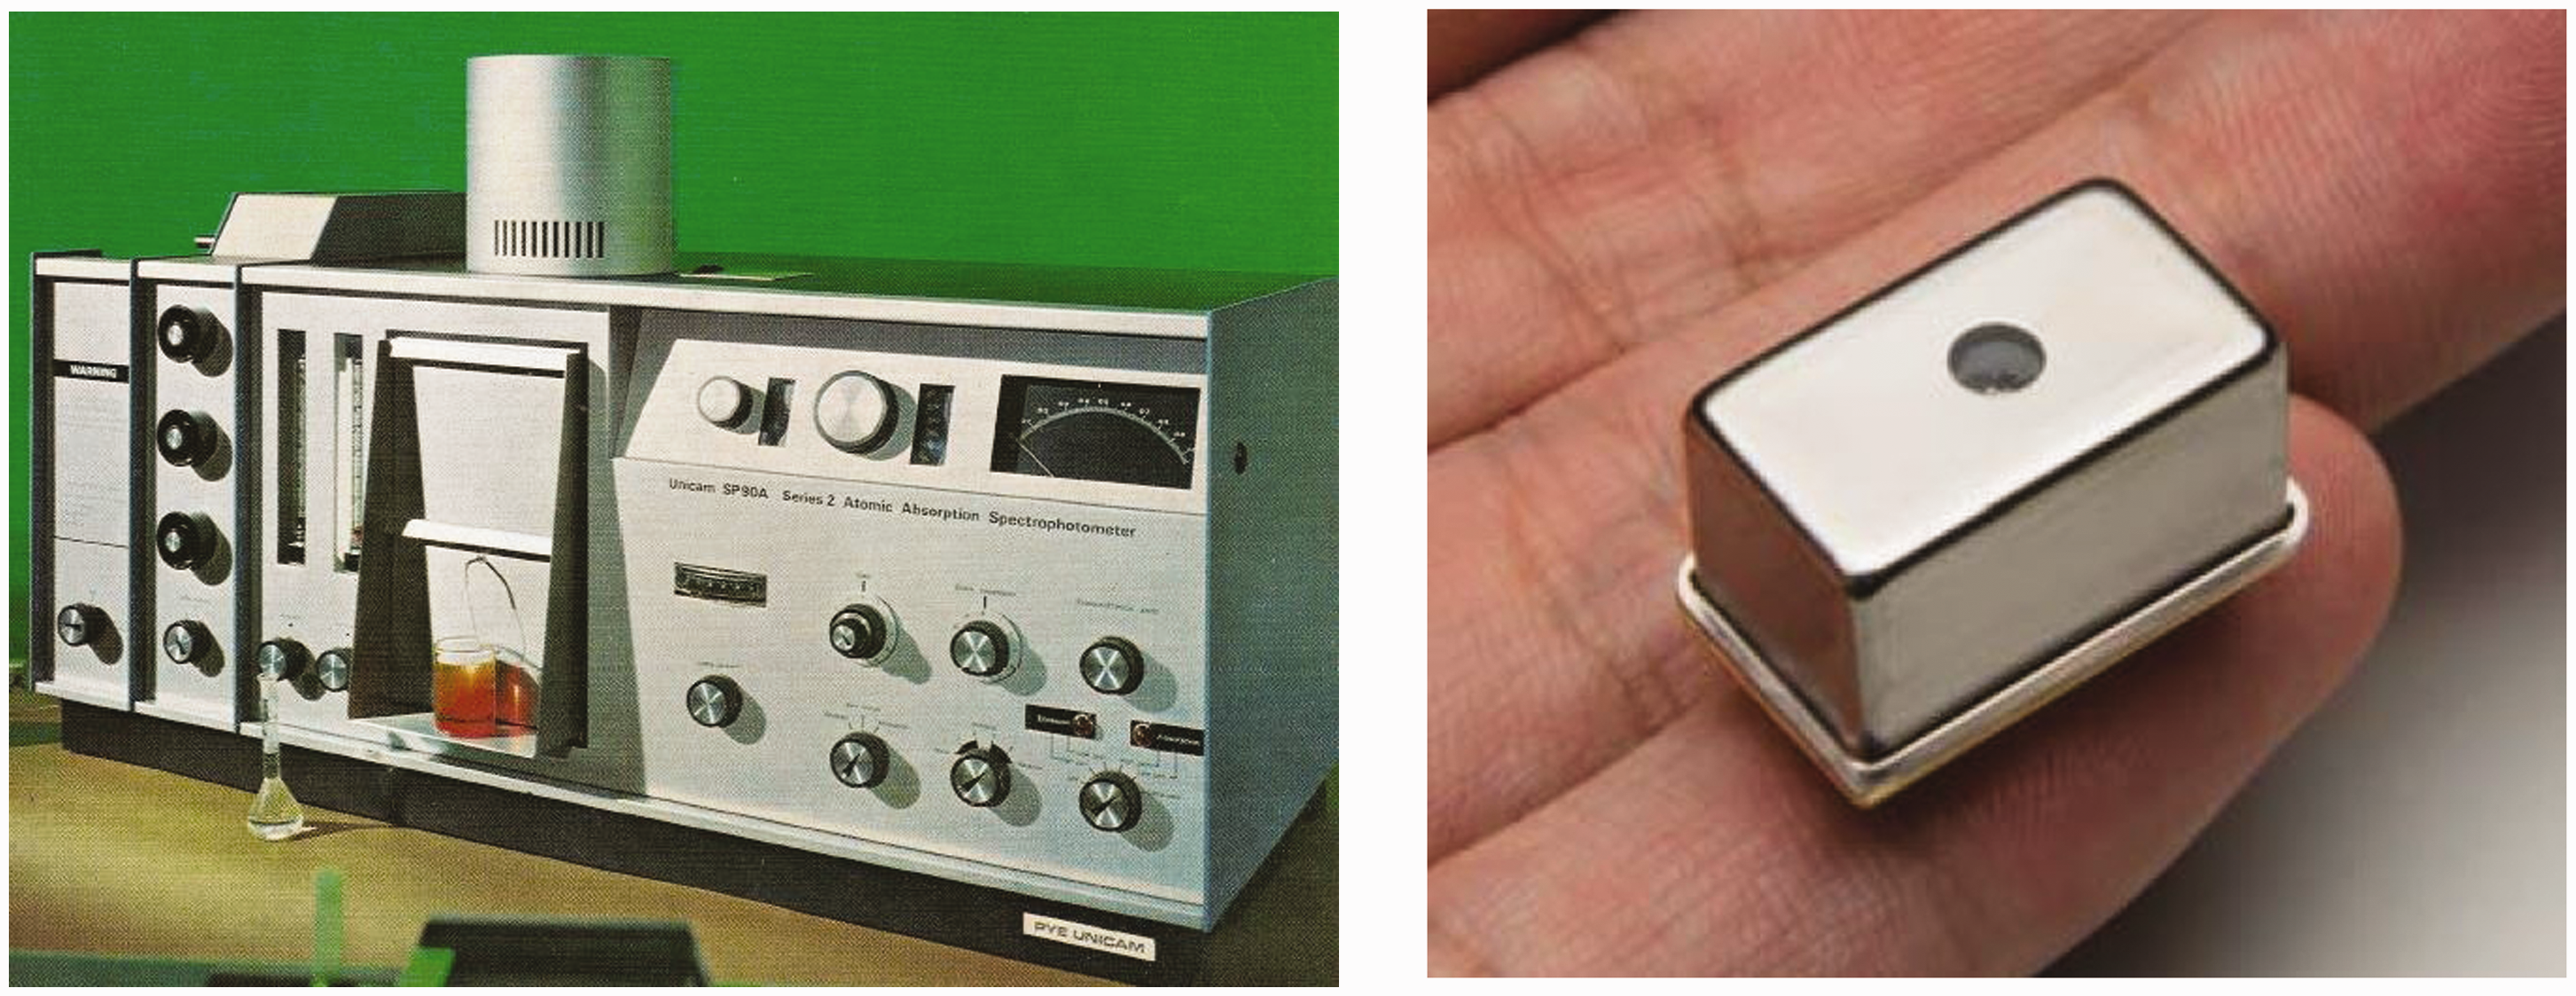
introduced a cubic illumination meter featuring illuminance meters on six orthogonal faces of a virtual cube. A spectrometer from the 1960s is compared with a miniaturised spectrometer from the current day in Figure 7.
The robot goniophotometer at PTB Braunschweig
30
Comparison of a spectrometer from the 1960s (left) with a current-day miniaturised spectrometer (right)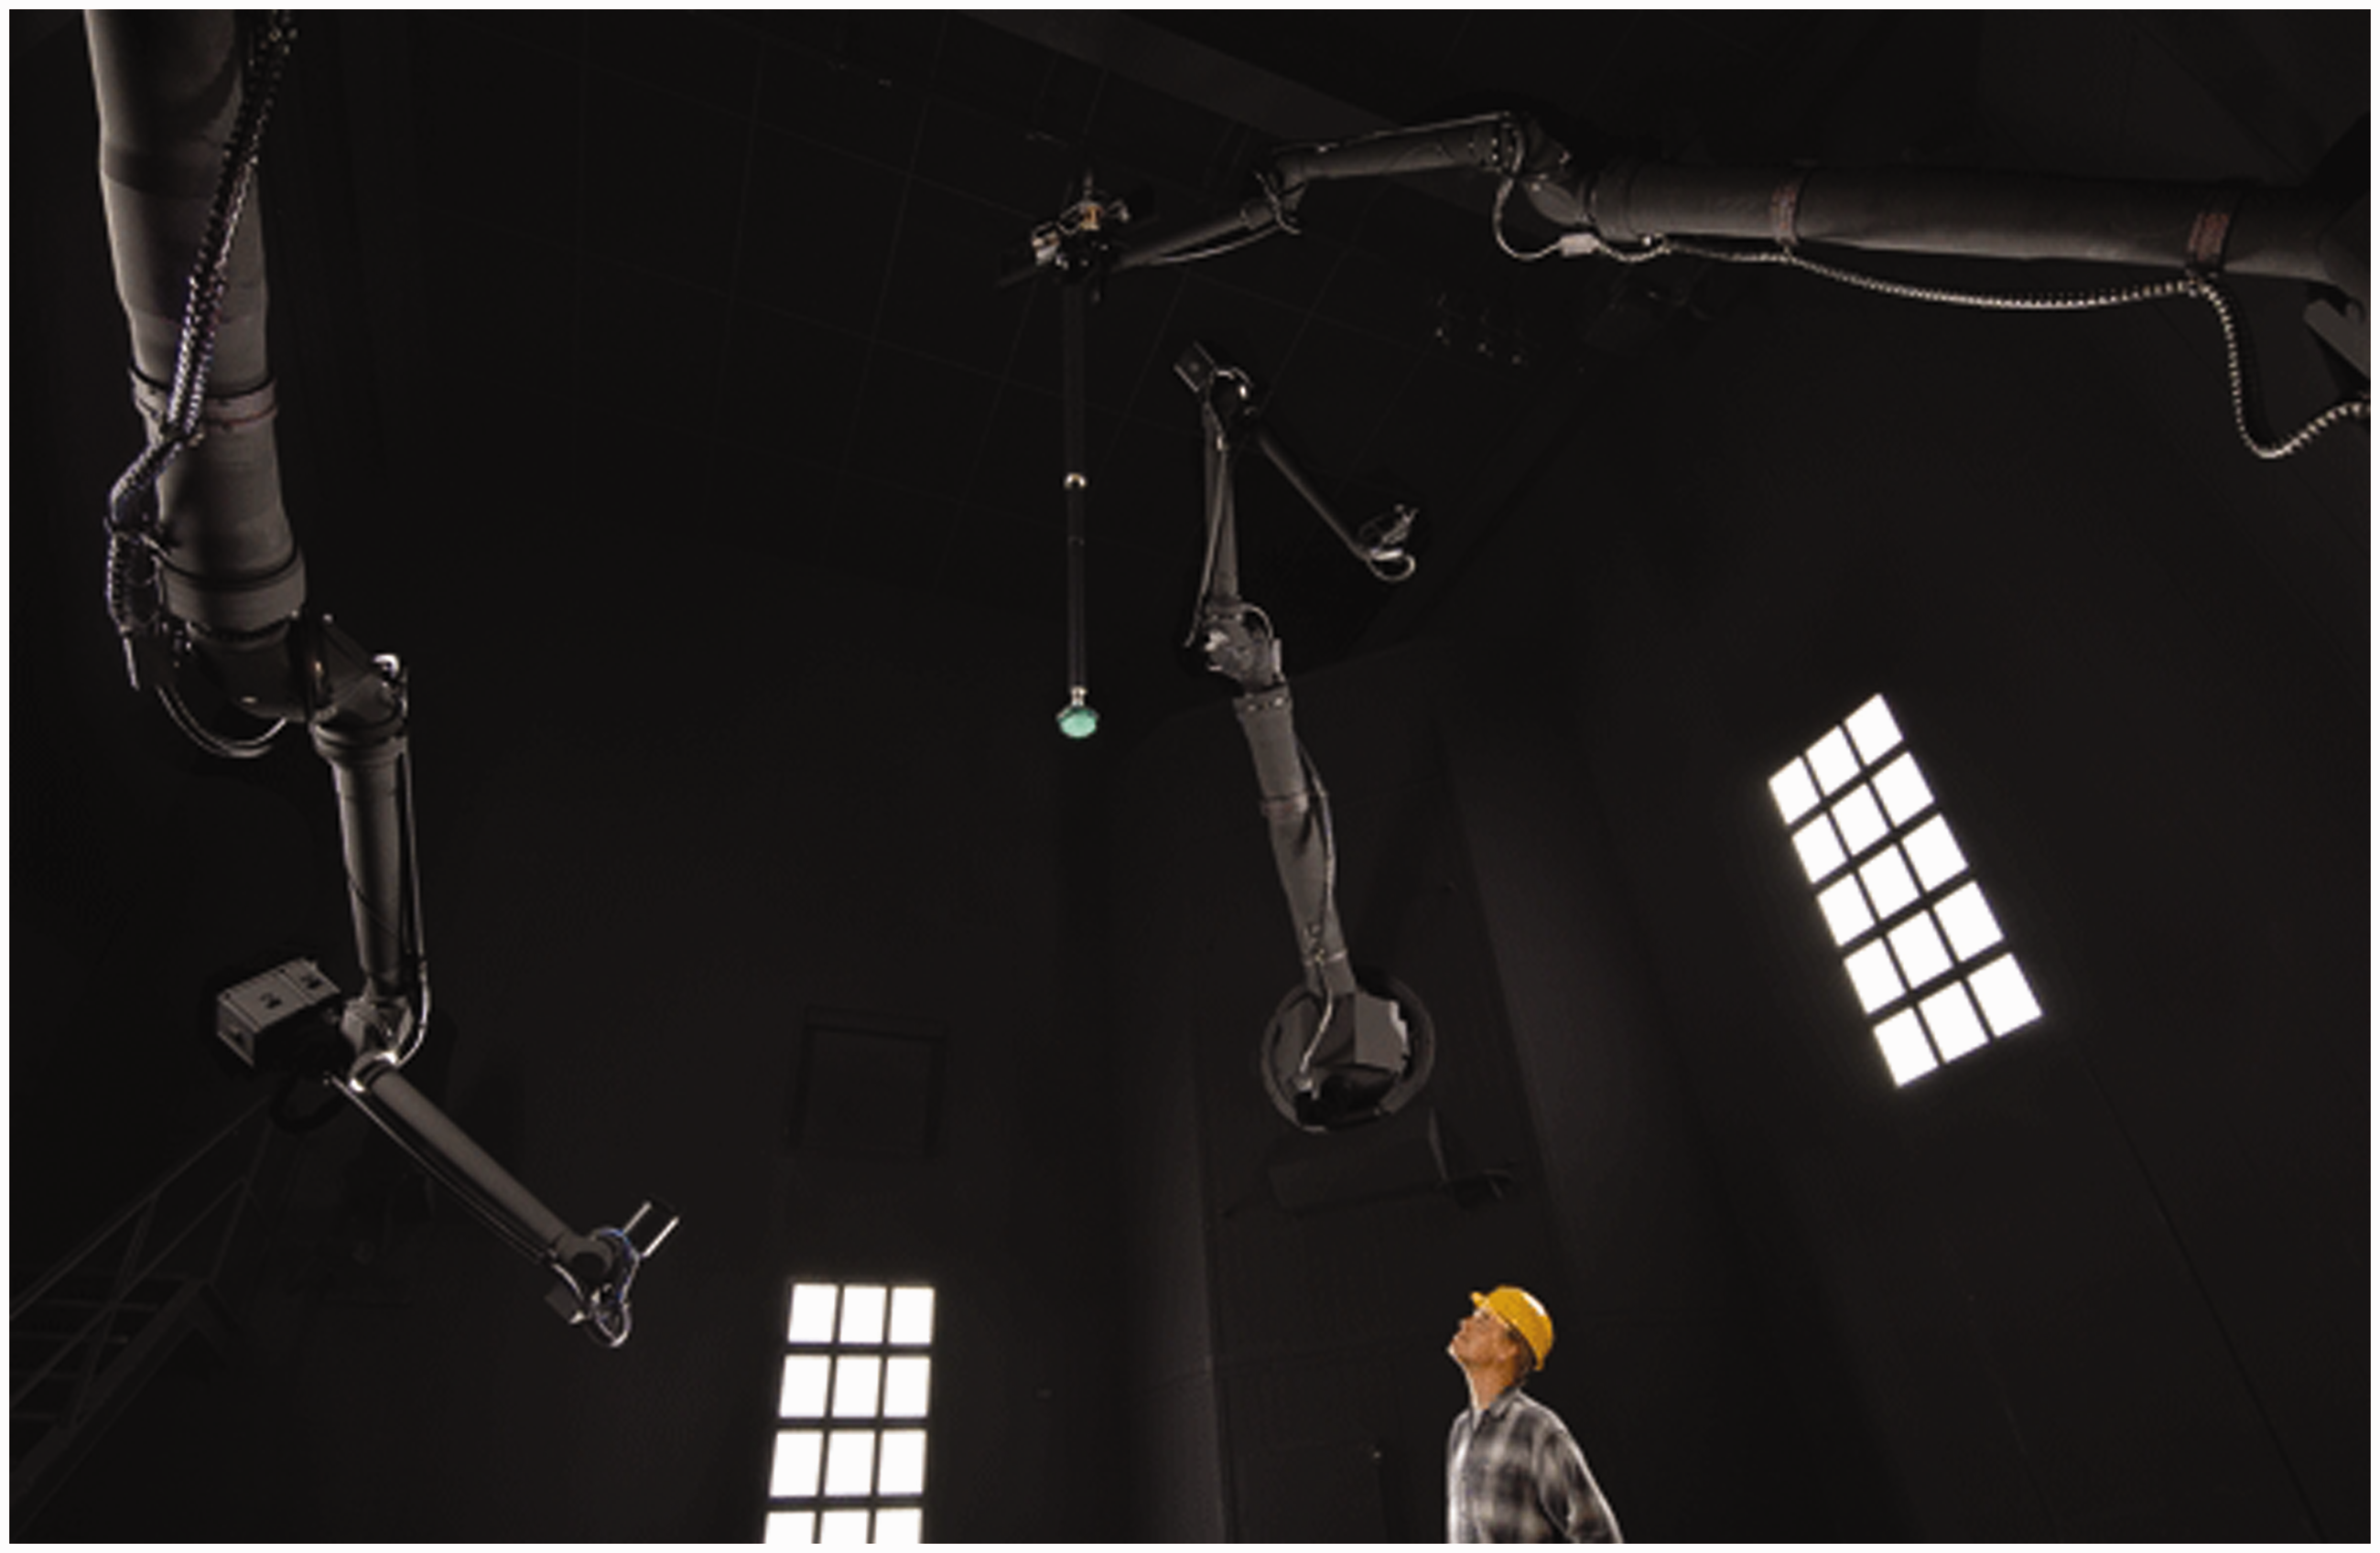
Hyperspectral imaging systems, which produce spectrally-resolved images of spatial scenes, have been introduced onto the market. Products which combined a photometer and a spectroradiometer were introduced onto the market. This enabled the fast, high-dynamic range and highly linear measurements made using photometers to have a real-time spectral mismatch correction and also provide measurements of chromaticity.
In 2010, the CIE published a recommended system for Mesopic Photometry. 36 This enabled the development of photometers which combined photopic and scotopic detectors in order to provide a direct reading of a mesopic quantity.
The CIE published a standard test method, CIE S 025, for measurement of LED lamps, LED luminaires and LED modules in 2015 which was the first CIE standard to mandate the reporting of measurement uncertainties. 37
8. Current gaps and future directions
Narrow-band sources, such as LEDs, continue to be a driving force for product development. The spectrally broader organic LEDs and narrower quantum dot LEDs are gaining momentum and commercial products are already widely available. These sources present measurement challenges that future instruments must meet.
Colorimeters are still not as accurate as spectroradiometers but are currently still faster. In the last decade, the speed of measurement and processing using spectroradiometers has increased and results can now be available in sub-millisecond timescales. As the speed of instruments increase, eventually we can expect that many roles of photometers and colorimeters might be taken by spectroradiometers. It is unlikely however that all roles would be taken and measurements of flicker and other time-based quantities will still require photometers or colorimeters.
Hyperspectral imaging devices are currently limited by speed, cost and the massive amount of data that they produce. Over time the speed will increase, costs will come down, and the data produced by them will be more manageable with advances in computer technology.
As each instrument has its strengths and weaknesses, and production costs decrease, we can envisage a new generation of hybrid instruments that work together. For instance, we know that the timing of measurements of pulsed, modulated or AC sources is critical and accurate measurements can be provided by fast photometers. Spectroradiometers lack this fast response and may produce errors if the timing (sampling) is not appropriate, but they provide spectral information lacking in the photometer. A measurement that includes both a photometer and a spectroradiometer can correct the sampling errors of the spectroradiometer and the spectral mismatch errors of the photometer, leading to a result that is robust and requires no assumptions or user knowledge of the source. We can already see this hybrid technology at work: the market already contains products combining imaging spectrocolorimeters and spot colorimeters or combining spectroradiometers and illuminance meters to improve accuracy and versatility beyond the capabilities of the individual instruments.
It is likely that near-field goniophotometry will become more established as a mainstream technique for measuring luminous intensity distributions as people seek to minimise the space used in the laboratory. Measuring high dynamic range sources such as those with individual small LED elements can cause problems for some of these instruments, and they are currently not fully accepted by measurement standards such as CIE S 025. 37
While it is yet to be seen if OLEDs will become a dominant part of the lighting market, the use of LEDs is becoming more and more universal and this is expected to continue into the future. This continues to provide a challenge to measurement equipment in aspects such as measurement timing (pulse-width modulation), non-uniformity of chromaticity, directionality, use of curved and flexible panels, etc.
While there is still some resistance to establishing measurement uncertainty budgets, most laboratories now undertake uncertainty analysis on a routine basis and use this to improve their measurement quality. Moreover, the idea that some major sources of error (e.g. stray light) can be corrected, at least in part, relatively simply once the instrument has been characterised, should lead to lower uncertainties and better agreement between laboratories. In future, this will be seen as an essential of measurement and laboratory accreditation (e.g. to ISO 17025) will become more common.
Footnotes
Declaration of conflicting interests
The authors declared no potential conflicts of interest with respect to the research, authorship, and/or publication of this article.
Funding
The authors received no financial support for the research, authorship and/or publication of this article.
Acknowledgements
The authors would like to thank Jean Bastie, Jim Gardner and Ron Rykowski for contributing their thoughts and material to this paper.