
Abstract
Residential architecture constitutes one of the largest market segments in the construction sector. However, the attention that it is given in the field of daylight performance simulation is surprisingly low. This poses the question of whether existing daylighting metrics are well suited for residential design. Findings from 79 references are summarized, and a critical review of current climate-based daylighting metrics in the context of residential architecture is provided. It is found that existing workflows often overlook relevant aspects of daylight in residential spaces, such as diurnal and seasonal availability of daylight and access to direct sunlight. Hence, a concept for a new climate-based, annual evaluation framework that overcomes these shortcomings, called the residential daylight score, is introduced.
1. Introduction
Population growth and urbanization promote living in high-density urban areas. Increasing urban density, however, leads to a conflict between space-use efficiency and daylight access. One of the earliest efforts to manage this conflict and to ensure reasonable daylighting in residential buildings can be traced back to the British ‘Right to Light’ from 1832, where an occupant who had access to daylight (through a window) for at least 20 years was given an ‘indefeasible’ right to that light. 1 In order to address sanitary and health-related concerns which arose from densely populated, poorly lit conditions of industrialized cities,2,3 many other efforts to regulate daylight access emerged, implementing geometric ratios such as street width to building height, 4 sky view factors5,6 and norms that regulate a minimum window area per floor area to ensure a visible connection to the outside. 7 More recently, simulation-based compliance paths are suggested 8 in order to exhaust urban space potentials while preserving sufficient access to daylight for urban dwellers.
Daylight is of such interest because it has been recognized by designers and building scientists for its relevance in aesthetics and perception of space,3,9,10 occupant health and well-being,11,12 and energy conservation, particularly in its potential to offset artificial lighting and its impact on heating and cooling loads.13–17 Furthermore, daylighting is an essential connector between the interior and exterior of a space and provides ‘psychological and physiological benefits not obtainable with electric lighting or windowless buildings’.18–20 Consequently, researchers have developed numerous daylight performance metrics (DPMs) that quantify the different aspects of natural light, such as its availability,2,21–25 glare,26,27 aesthetics,9,28,29 as well as non-visual effects of daylight.30–35 These metrics are used to evaluate design ideas on various architectural scales, ranging from façade components that redirect light36–39 to urban design applications.40–42 However, a search through the literature reveals that much of the current daylighting research is primarily focused on work environments, while residential architecture is rarely considered. A keyword search across different academic search engines (International Building Performance Simulation Association conference proceedings, ResearchGate, SAGE Journals, ScienceDirect and Taylor & Francis Online) yields that out of 6865 publications, 65% focus on daylighting office spaces while only 35% focus on daylighting residential architecture. When narrowed down to climate-based metrics (535 publications), the divide between office and residential spaces increases to 73% versus 27%.
Similarly, many rating systems for sustainable architecture, such as Leadership in Energy and Environmental Design (LEED),43,44 treat the issue of daylighting in residential architecture as of ‘no or subordinated relevance’. 45 A notable example is the LEED Version 4 for Home Design and Construction, 44 which does not contain any specific guidelines for residential daylighting, despite the fact that residential architecture usually represents the largest single market segment in new construction. 46
This leads to the question of whether today’s DPMs are well suited for the evaluation of residential spaces. Hence, this paper aims to summarize the capabilities of current metrics and juxtapose them against the architectural discourse on daylighting residential spaces. Further, shortcomings are identified and suggestions for an improved residential daylight analysis workflow are made.
2. Literature review
In the design literature, daylighting of residential architecture has long played a prominent role. Architectural design manuals, such as the Neufert Architects' Data
47
or the CIBSE guide on Lighting for Communal Residential Buildings,
48
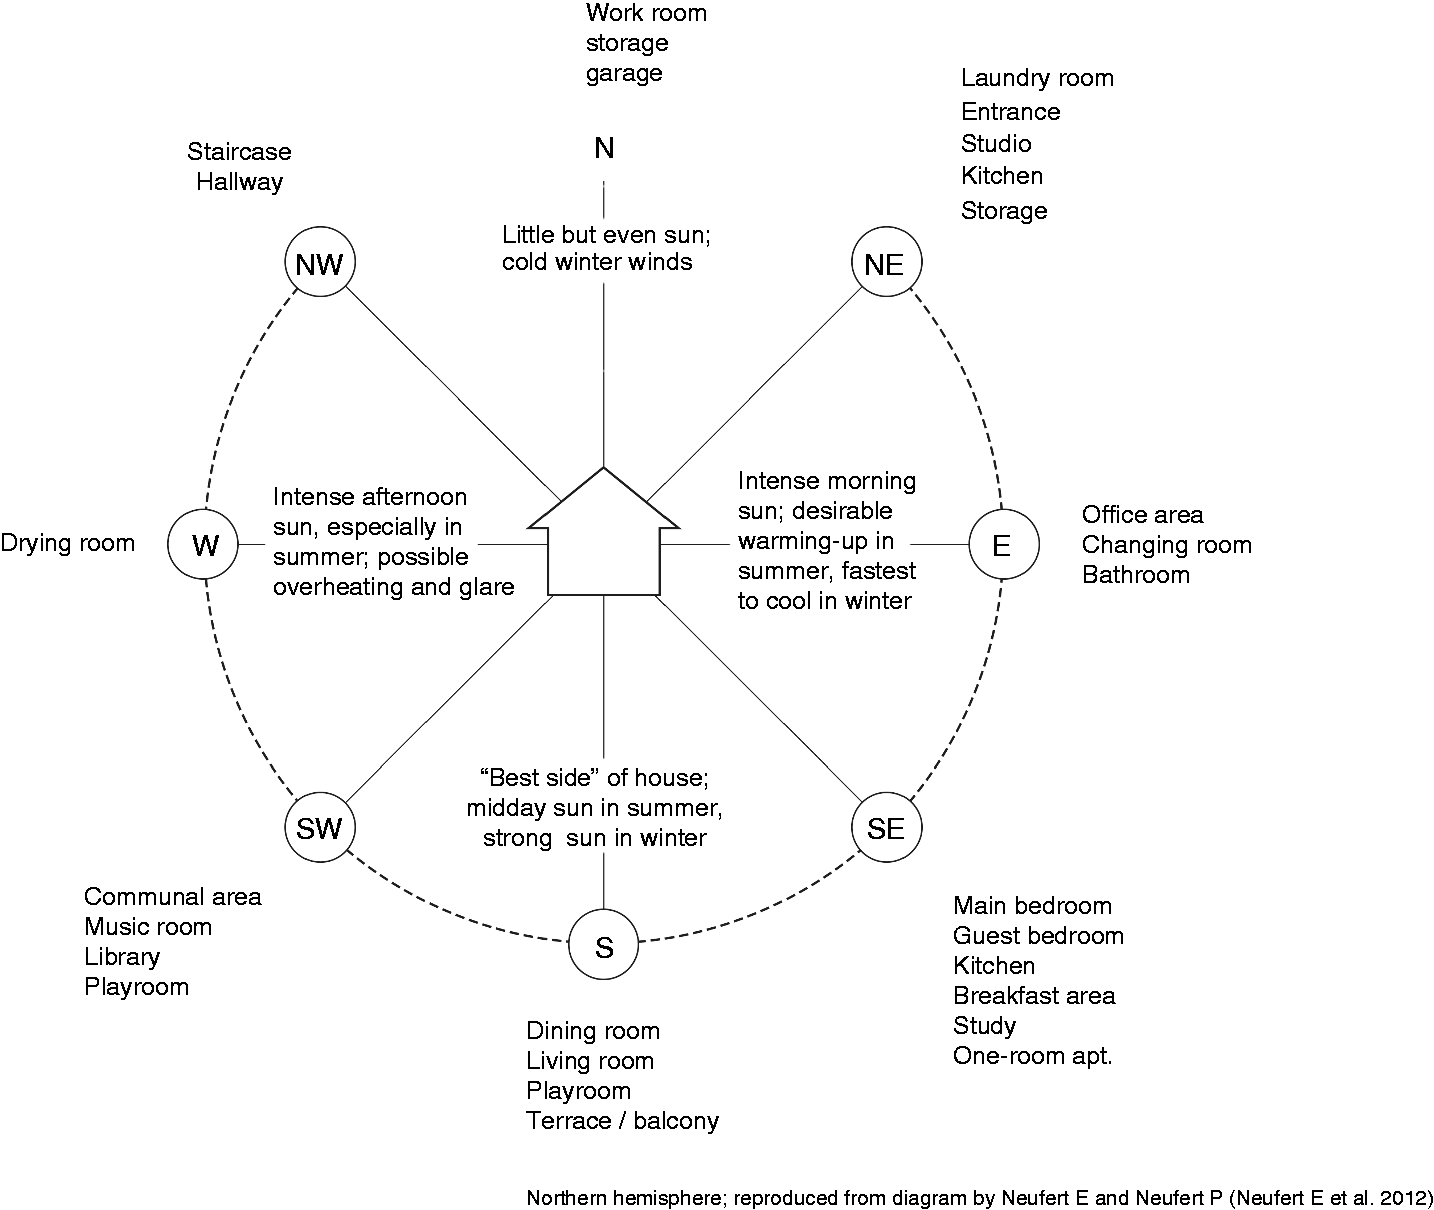
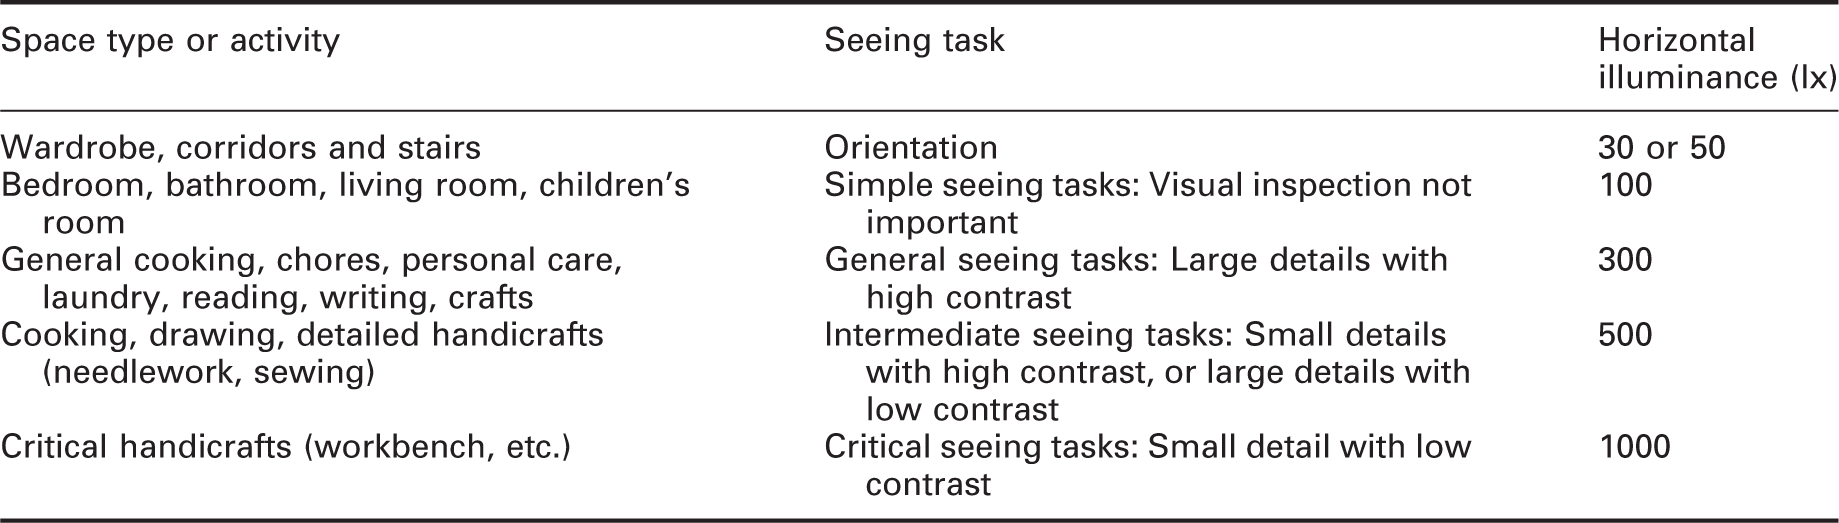
emphasize that the layout of a floor plan and the orientation of a space should be closely linked to the ‘movement of the sun’. In 1930, Schwagenscheidt correlated cardinal directions with specific rooms found in a residential unit (Figure 1). Six years later, Neufert recommended domestic programmes and room types for each cardinal direction, considering the intensity of daylight and its impact on heating and cooling loads (Figure 2). In general, the diurnal variation of daylight in residential buildings is perceived as desirable, as it allows the occupant to perceive changes in weather and time of day.18,20 Drastic seasonal changes in daylight availability, however, should be avoided. For example, a bedroom that receives abundant morning light in the summer months but remains completely dark during winter mornings can promote sleep grogginess32,49 or sleep disorders,50,51 as well as the seasonal affective disorder.52–54 For spaces like ateliers, workshops or libraries, more stable lighting conditions are preferred in order to facilitate study and artistic activities. Further, the Illuminating Engineering Society of North America provides clear recommendations for adequate light levels based on residential space types and activities (Table 1). The suggested target illuminances aim to ensure that a specific task is sufficiently lit for proper ‘colour appearance’ and ‘colour contrast and modeling of faces’.
21
Hence, the use of daylight in residential architecture should be strategic to maximize its positive potentials, such as boosting occupant alertness, mood and productivity.55–58
A diagram by Schwagenscheidt, which suggests the orientation of domestic rooms according to the ‘movement’ of the sun throughout the day A diagram by Neufert that allocates program by orientation and describes qualities of the sunlight that is to be expected. Recommended illuminances for residential architecture, according to the Illuminating Engineering Society of North America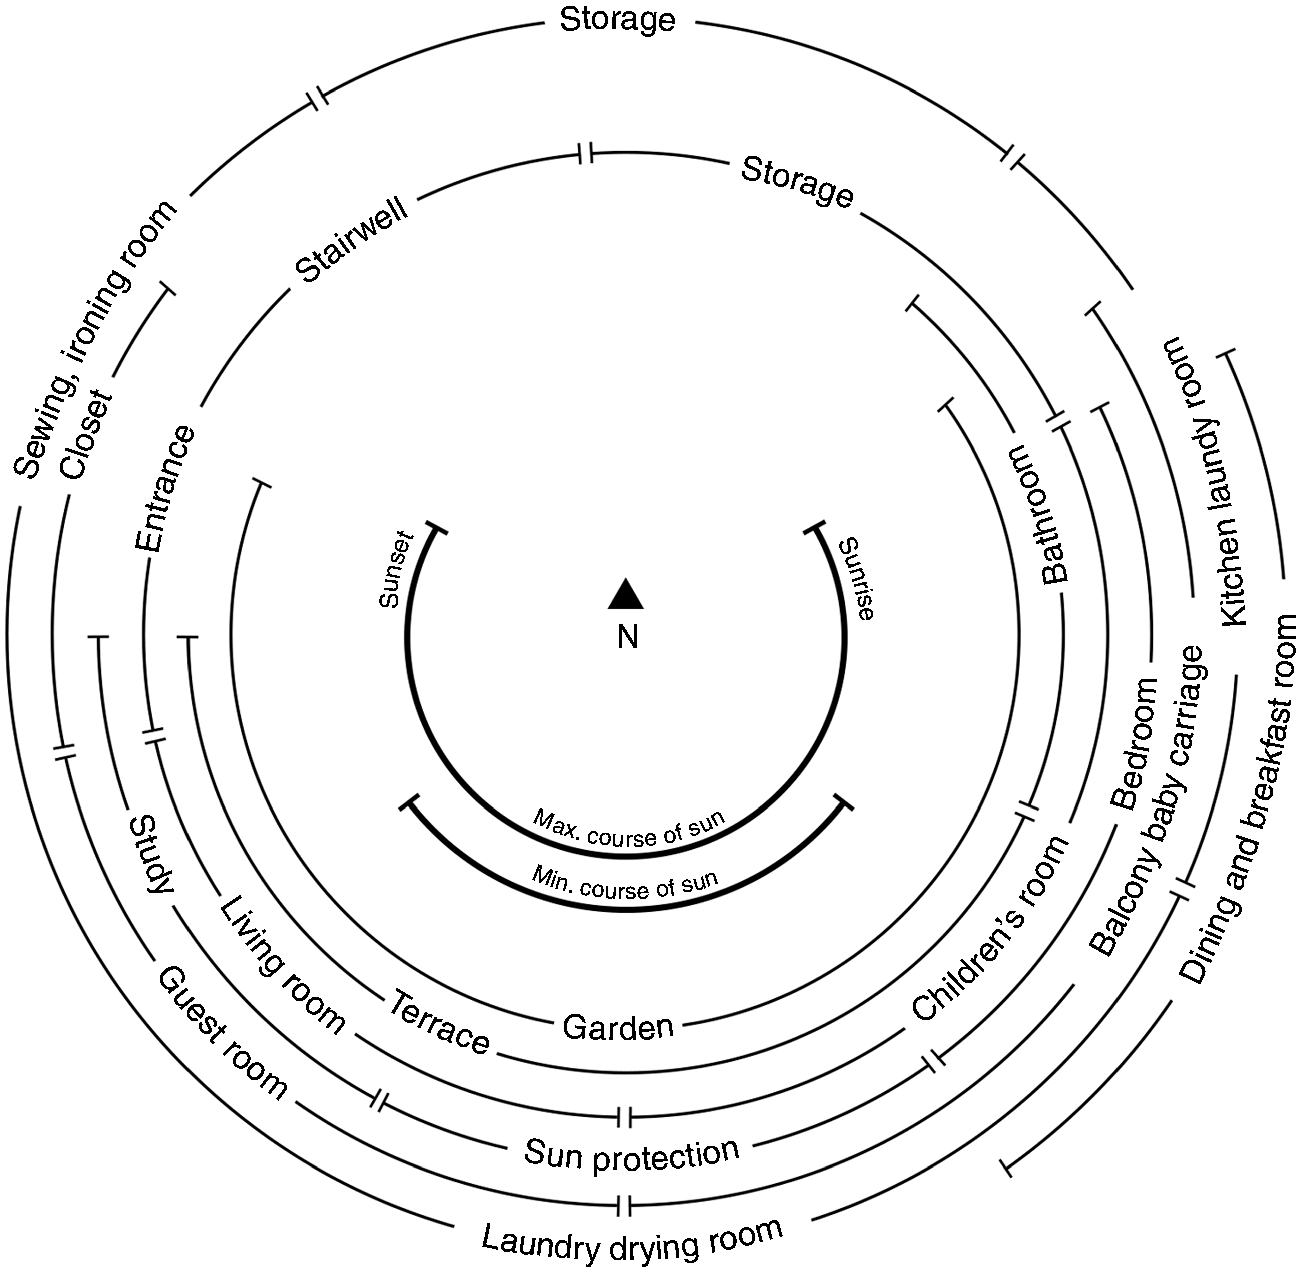
Further, there is a distinction between direct (unobstructed sunlight) and diffuse daylight (indirect sunlight reflected from surrounding surfaces, diffuse light from the sky-dome, or light scattered from the clouds).10,24 Studies on vitamin D deficiency related to low UV-light exposure11,59,60 establish the importance of access to direct sunlight either from the interior or private outdoor spaces, such as balconies, loggias, courtyards and gardens.61–63
Issues of daylight oversupply are also discussed. Beside the potential thermal comfort and energy-related implications of excessive sunlight and high illuminance levels, glare issues are discussed. 64 Effects of glare can range anywhere from mere irritation to the eye, veiling of images on a screen, or serious hindrance to perform a task due to reduced contrast in the field of view. Nabil and Mardaljevic 65 proposed a useful daylight illuminance range from 100 to 2000 lx that aims to define the boundaries of lighting conditions in which a space will be perceived as neither too dark nor too bright. In a later publication, the upper threshold was changed to 3000 lx. 31 However, a clear definition of an upper illuminance threshold as a glare indicator remains difficult, as the perception of glare is largely dependent on the size, location and luminance of the light sources in the occupant’s field of vision 27 as well as user subjectivity.31,66 Further, occupants in residential spaces generally have better control over their environment and can mitigate glare by modifying furniture layout, relocating within a space, or by simply changing their direction of view.24,27,67 A study by Jakubiec and Reinhart 27 shows that incorporating the ability of the occupant to adjust his view or position within a space may significantly reduce the predicted likelihood of glare and its negative consequences. Glare is also less of a concern in the design of residential buildings, as it is assumed that oversupply can be mitigated at the façade level with rather simple measures, such as blinds, curtains or shutters. Insufficient daylighting, on the other hand, is difficult to improve once the design is built.
In order to quantify daylight in buildings, researchers have developed a variety of DPMs. Most existing DPMs aim to determine if there will be sufficient daylight to perform a certain task. Usually, validated ray-tracing tools, such as Radiance 68 or Daysim, 69 are used to compute illuminances on a virtual, upward-facing sensor grid. These readings are then normalized by DPMs to facilitate their interpretation.
One of the most widely used metrics is the daylight factor (DF), which calculates the ratio between the illuminance of a particular point in the interior to that of the unobstructed exterior under the CIE overcast sky. 70 The DF therefore does not consider variable sky conditions, changes in climate, position of the sun, building orientation and location. Thus, it is severely limited in its ability to indicate spatial and temporal variations and location-sensitive phenomena in daylight.23,24 Nevertheless, the DF can provide quick feedback on how much daylight can be expected in a space under worst-case conditions. Therefore, it remains widely used both in practice and national rating systems, such as BREEAM 71 in the UK, DGNB 72 in Germany and TQB 73 in Austria.
More recent, climate-based metrics use annual weather data to incorporate changing sky conditions at a specific geographic location. The daylight autonomy (DA) measures the percentage of occupancy hours throughout the year during which a viewing task may be performed solely with daylight.
23
A percentage indicates how often the minimum illuminance threshold is met or exceeded during the occupied hours. The continuous daylight autonomy (cDA) is similar but awards partial credit to instances in which the illuminance falls below the minimum threshold and thereby softens the ‘transition between compliance and noncompliance’.
23
The spatial daylight autonomy (sDA),
74
used in LEED v4, measures the percentage of the floor area which achieves DA (typically ≥300 lx) for at least 50% of all occupied hours to indicate that a space, as a whole, can be considered daylit. Further, sDA incorporates the use of a dynamic shading system to limit direct sunlight exposure to no more that 2% of the analysis area at any given hour. LEED currently awards points based on an sDA300lx, 50% score of at least 55%, 75% or 90% of regularly occupied floor area.
43
In contrast to the DA metrics, the useful daylight illuminance (UDI) measures the percentage of occupancy hours during which illuminances fall within a range of 100 lx and 3000 lx (UDI combined). It is assumed that illuminances below the range cannot be utilized effectively (UDI-underlit, or UDI fell-short) and levels exceeding the maximum illuminance threshold may cause glare (UDI-overlit, or UDI-exceeded).31,65,75,76 In addition, it is assumed that ranges between 100 and 300 lx will likely require supplemental lighting (UDI-supplemental), while ranges between 300 and 3000 lx will not (UDI-autonomous). A comparative overview of most of the mentioned supply-focused metrics is shown in Figure 3. Radiance parameters and material assumptions for all simulations presented in this paper are provided in Appendix 1.
A comparison of common supply-focused daylight performance metrics (DPMs). Climate: Berlin. Occupancy: 8:00–18:00. UDI: useful daylight illuminance; DA: daylight autonomy; DF: daylight factor; sDA: spatial daylight autonomy; cDA: continuous daylight autonomy.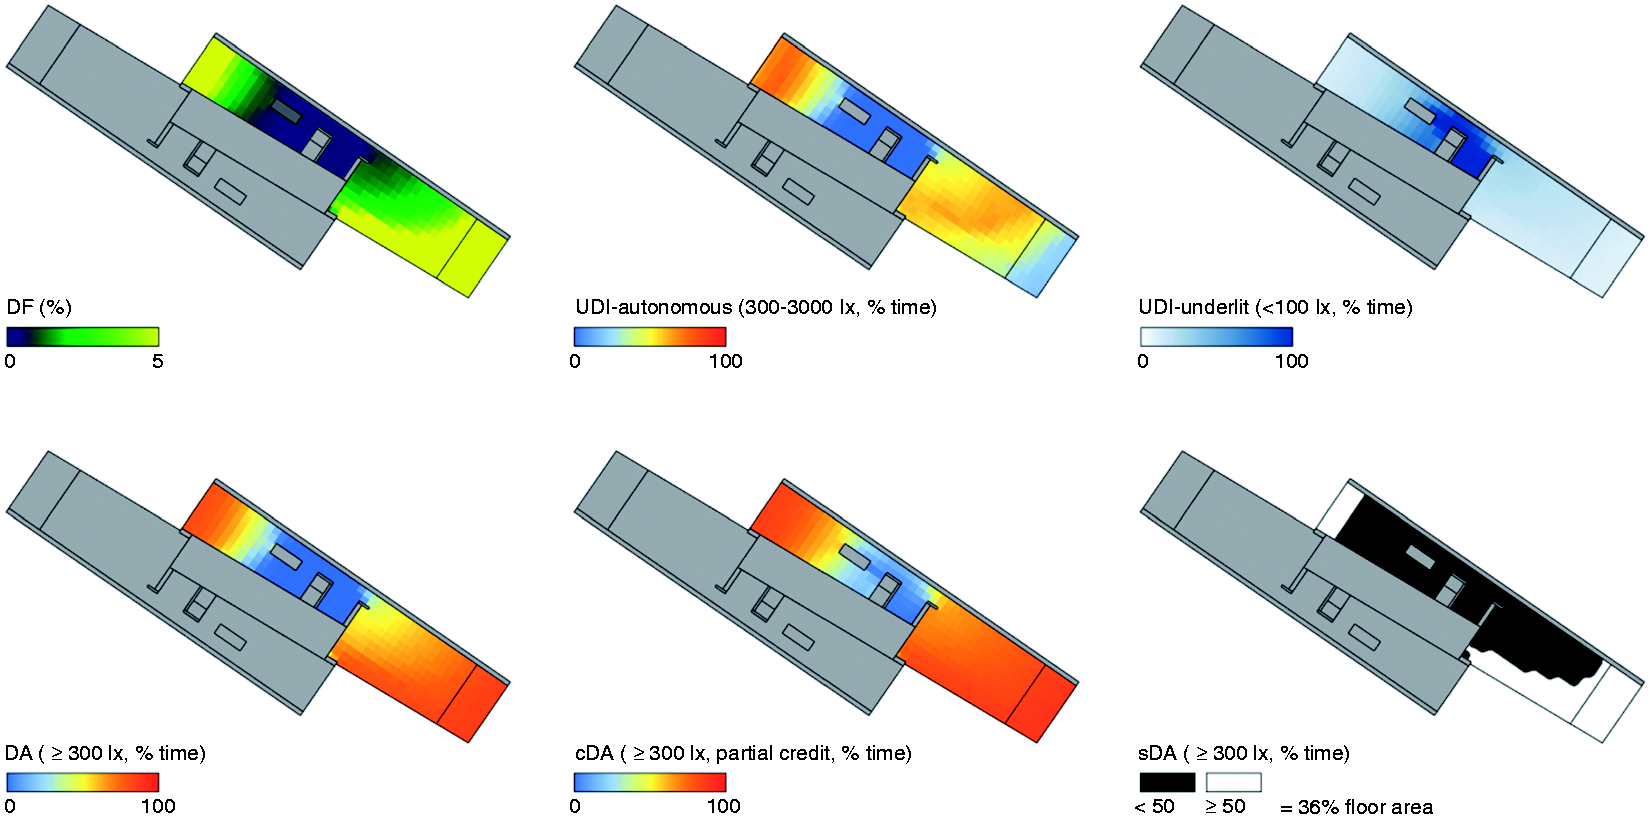
Oversupply-focused metrics assess the presence of excessive daylight that could cause visual discomfort or glare. The spatial daylight autonomy maximum (sDAmax) measures the percentage of floor area which receives daylight above the required illuminance (e.g. 300 lx) multiplied by a constant (typically 10) for more than 5% of occupancy hours.
64
Again, a dynamic shading system to limit direct sunlight exposure is employed. The annual sunlight exposure (aSE) measures the percentage of floor area which receives more than a certain number of annual hours (typically 250) of direct light above a minimum threshold (typically 1000 lx). Along with the sDA, the aSE is used in LEED v4, which requires an aSE1000lx, 250hrs score of no more than 10% for regularly occupied floor areas. A comparative overview of the aforementioned oversupply-focused metrics is given in Figure 4.
A comparison of common oversupply-focused daylight performance metrics (DPMs). Climate: Berlin. Occupancy: 8:00–18:00. UDI: useful daylight illuminance; sDAmax: spatial daylight autonomy maximum; aSE: annual sunlight exposure.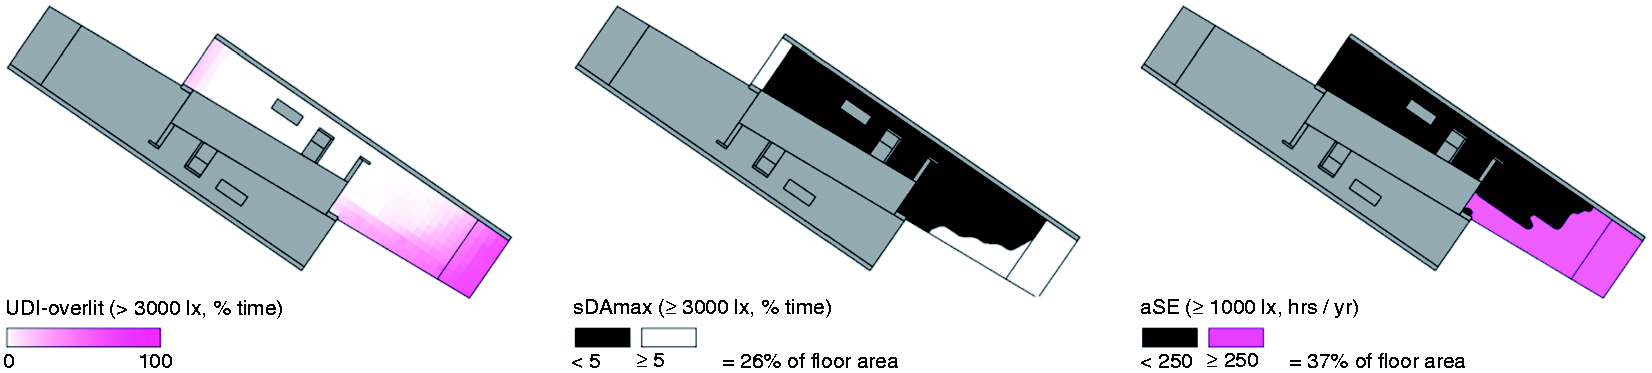
Besides the previously described oversupply metrics, dedicated glare metrics exist. They are typically based on luminance maps rendered from an occupant’s view at a specific point in time. Examples include the daylight glare index, CIE glare index, CIE unified glare rating, 77 daylight glare probability (DGP), 26 and the annual enhanced simplified DGP. 78 These maps are realistic representations of the actual user experience in a space; however, their computational cost poses a challenge for annual space evaluations.
3. Daylight availability in residential spaces
Recommended light levels for various residential seeing tasks are well defined in the literature and could be implemented as target thresholds in existing DPMs. However, accommodating the various thresholds of different activities and programmes that can be found in residential architecture in a single daylight simulation can become a challenging task.
A combination of various different lighting targets into a UDI range hence seems appropriate. However, several disadvantages exist: For example, UDI readings do not distinguish between higher and lower illuminance levels falling within the useful daylight range, meaning that a unit offering only the lower end of the illuminance range would score as high as a unit that also reaches the higher ends of the spectrum. Arguably, the second unit is of higher quality, as the space can provide sufficient daylight for a wider variety of activities and is therefore more versatile. Further, imposing an upper illuminance limit seems questionable given that the tolerance for strong sunlight exposure is greater in residential architecture, as residents have more control over the space and can implement mitigation strategies.
Consequently, metrics like DA or sDA, which impose no upper illuminance threshold, may be more suitable to evaluate whether a space is considered well-lit for a certain activity. In the case in which activities cannot be located precisely on a floor-plan, a repeated analysis with different thresholds may be used to identify areas that are most suitable for a given programme. For practical reasons, however, a daylight analysis for general seeing tasks is most likely sufficient, as it still allows modellers to identify the regions that score below and above the basic threshold. Hence, the authors suggest adopting the widely used target illuminance for general seeing tasks of 300 lx measured on a 50–80 cm spaced sensor grid at desk height. The mandatory use of a dynamic shading system as in the case of the sDA, however, is not suitable for modelling residential spaces, as it automatically and indiscriminately rules out the consideration of direct light that may be perceived as tolerable or even desirable by occupants.
Further, daylight needs to be witnessed by the occupant to be perceived as beneficial. Accordingly, current climate-based DPMs employ schedules to indicate when a user is present and daylight should be evaluated. Theoretically, it is possible to apply the same methodology to residential architecture. However, the diversity of residential activities, as well as social, cultural and personal factors that determine how often and how long each space is occupied, make formulating accurate and universal occupancy schedules a difficult task. For example, the single urban dweller may witness only early morning and late evening light in his apartment, while an occupant who works from home will witness daylight conditions throughout the day. In addition, the departure of modern residential architecture from mono-functional room types toward multifunctional spaces with overlapping programmes further complicate the task. It thus seems overly prescriptive to utilize rigid occupancy profiles in residential daylight analysis. Nevertheless, Figures 1 and 2 suggest that most residential activities can be grouped into loose diurnal timeframes, such as morning, noon and evening. Instead of an occupancy schedule, these timeframes may be used to formulate generalizable times of interest for daylight evaluation.
Similarly, seasonal fluctuation in daylight is of interest for the occupant. While seasonal differences are difficult to avoid, especially in northern climates, conditions in which daylight availability drops significantly or is even entirely absent during certain parts of the year will negatively impact the occupant’s satisfaction within a space and therefore should be investigated in residential daylight analysis. However, such diurnal and seasonal details are very difficult to detect with currently available DPMs, as hourly results are often integrated over an entire year.
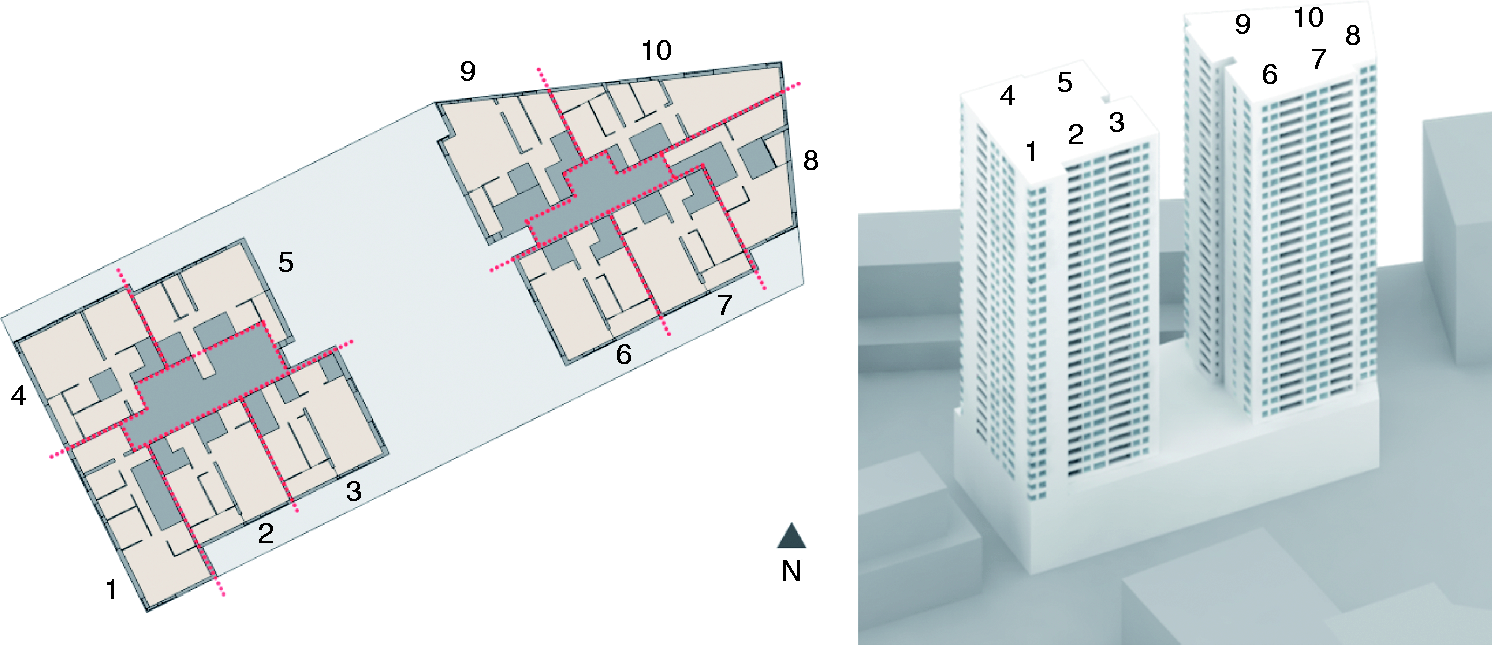
In order to understand how relevant diurnal and seasonal differences are for residential design, a multifamily residential building in Berlin (Figure 5) and a twin high-rise in Rotterdam (Figure 6) are used as case studies to juxtapose the typical annual analyses with several short-term analyses. For the short-term analysis, the year is divided into 12 time-bins, a combination of three diurnal and four seasonal timeframes as given in Table 2. The diurnal timeframes are defined as Morning (sunrise–11:00), Noon (11:00–15:00), and Evening (15:00–sunset), excluding all hours during which the sun is below the horizon so as to focus the analysis solely on building- and context-specific performance implications and exclude potential geographical and climate-specific disadvantages. To detect seasonal fluctuations, the year is subdivided into Spring, Summer, Fall and Winter timeframes, each collections of three months which being centre around the equinoxes and the solstices.
Floor plan (left) and 3D model (right), including apartment numbers, of the example in Berlin, Germany. Floor plan (left) and 3D model (right), including apartment numbers, of the example in Rotterdam, Netherlands. Diurnal and seasonal analysis timeframes that produce the 12 proposed analysis bins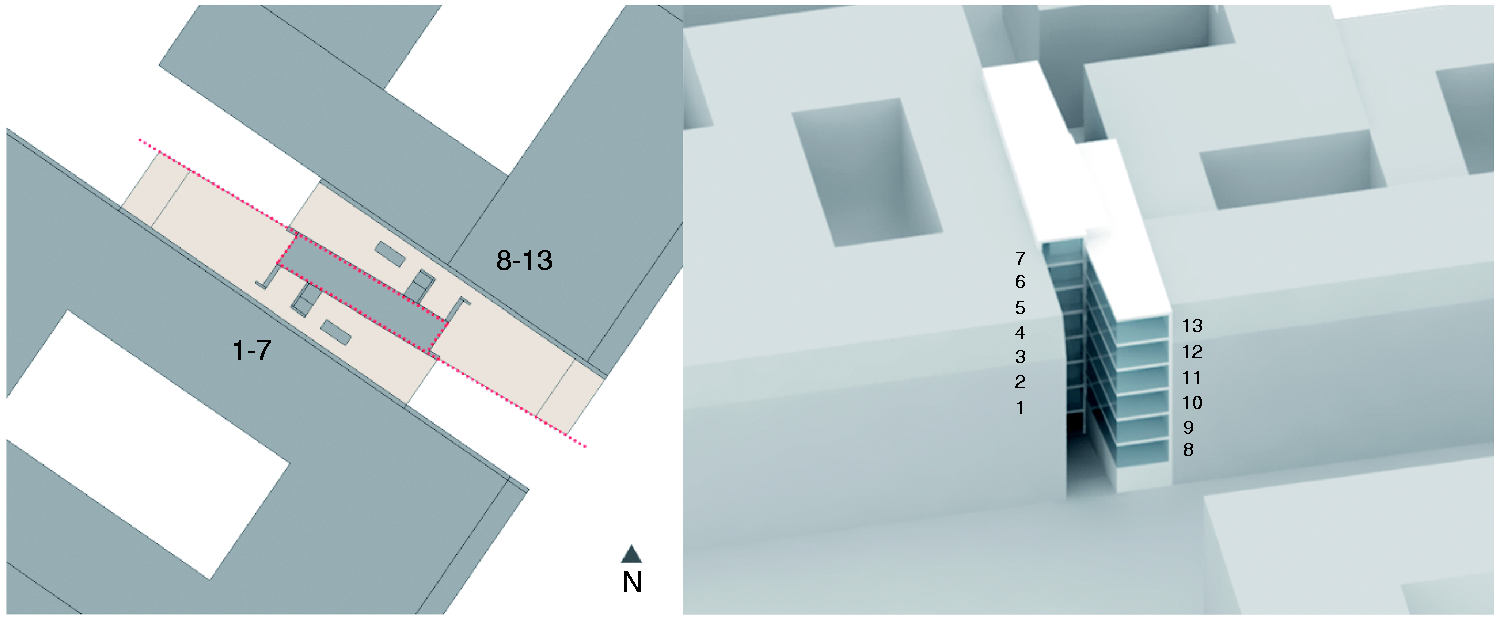

With an annual average DA300lx of 60%, Unit 11 from the Berlin example (Figure 7, top) appears to be fairly well lit. However, the diurnal and seasonal analysis reveals that the performance of the apartment varies greatly throughout the day and the seasons, in particular performing well below expectation in winter mornings and evenings (31% and 10% average DA respectively) but reaching up to an average DA of 79% in summer noontimes. For Unit 1 from the Rotterdam example (Figure 7, bottom), the diurnal breakdown clearly shows that the annual average DA of 46% is mostly related to poor daylight access in the mornings due to the apartment’s western orientation.
DA300lx assessment: Annual vs combinations of three diurnal and four seasonal timeframes. The average DA is reported in text for each time bin. Unit 11 from the Berlin example (top) and Unit 1 from the Rotterdam example (bottom) shown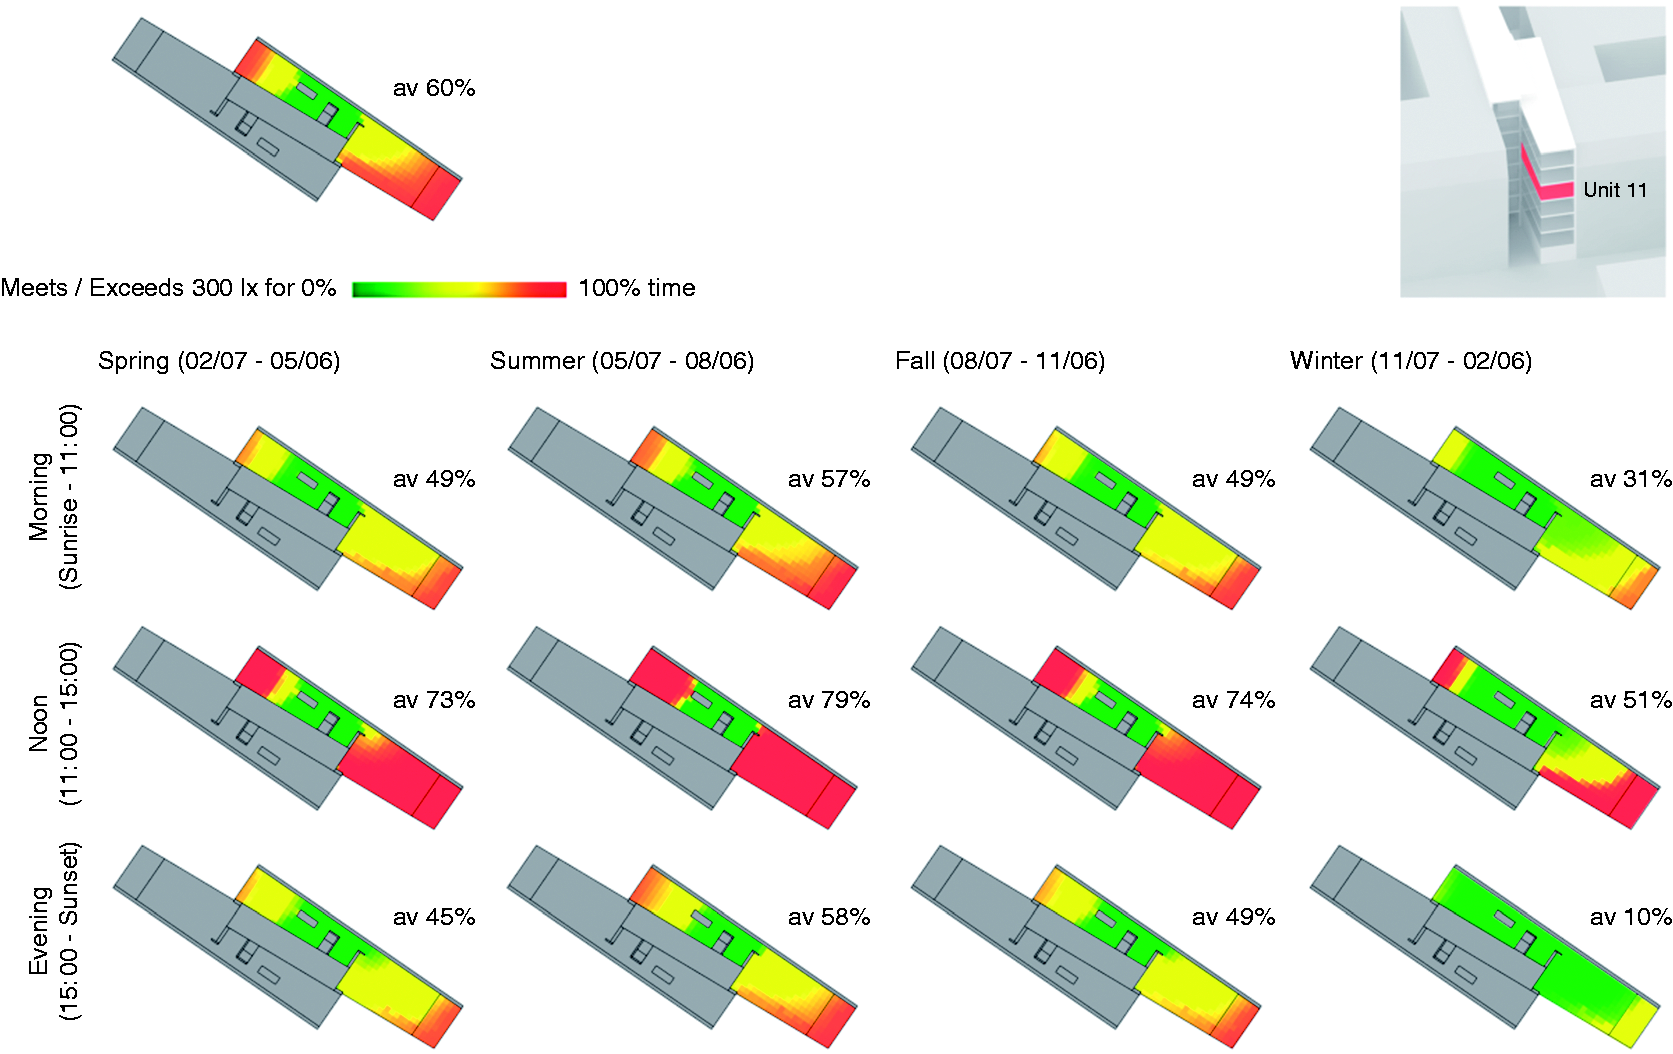
A diurnal and seasonal breakdown of average DA300lx Berlin
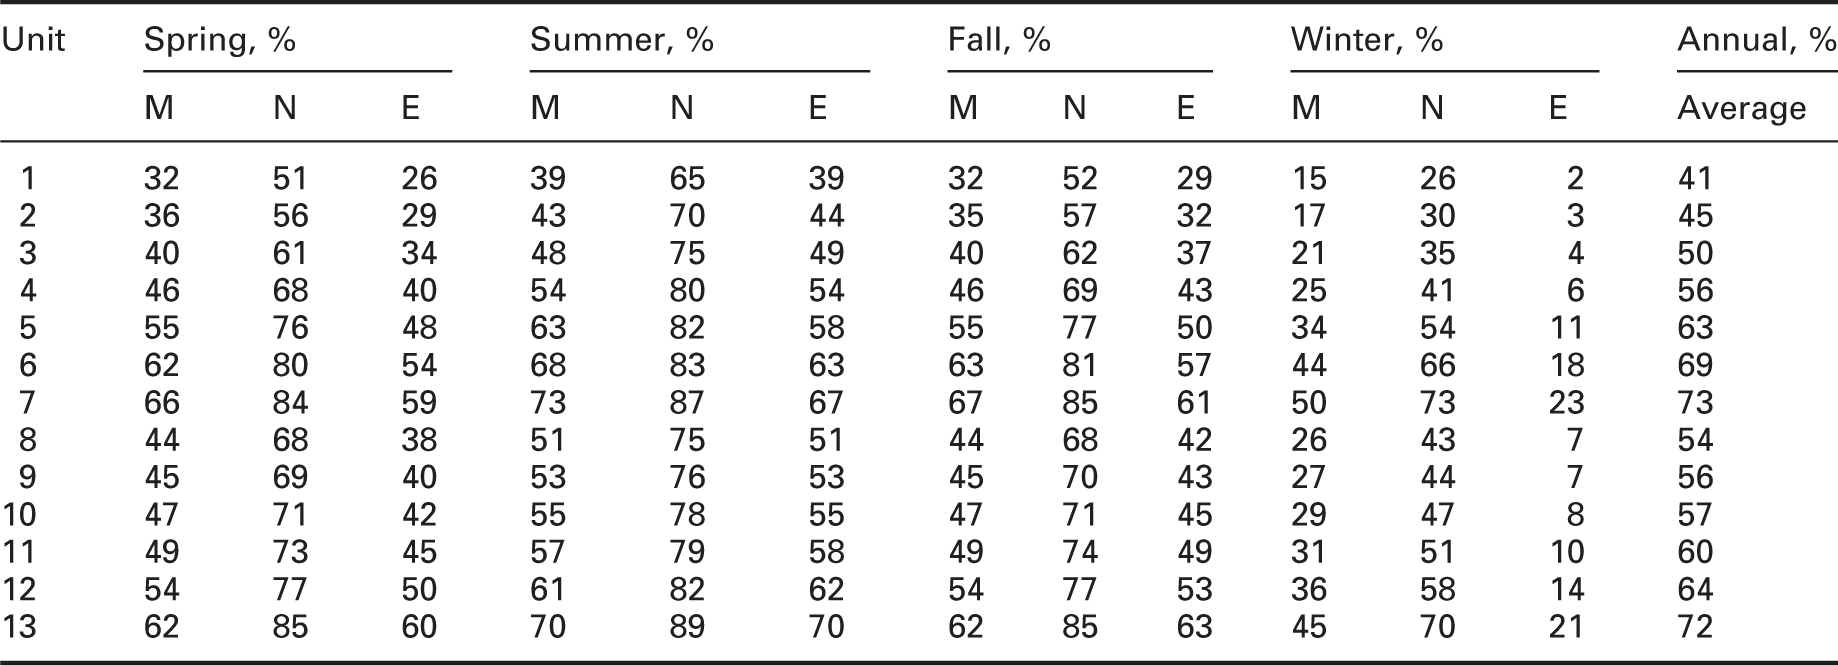
M: morning; N: noon; E: evening.
A diurnal and seasonal breakdown of average DA300lx Rotterdam
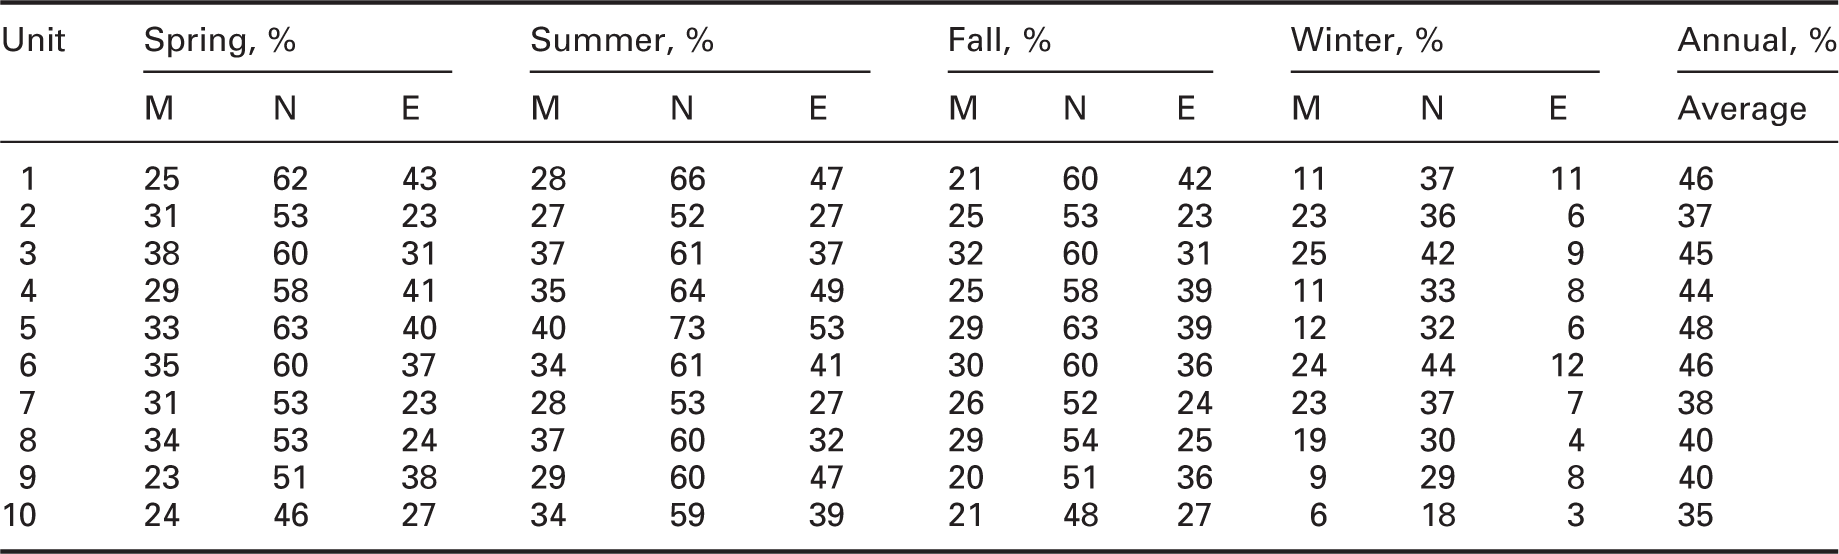
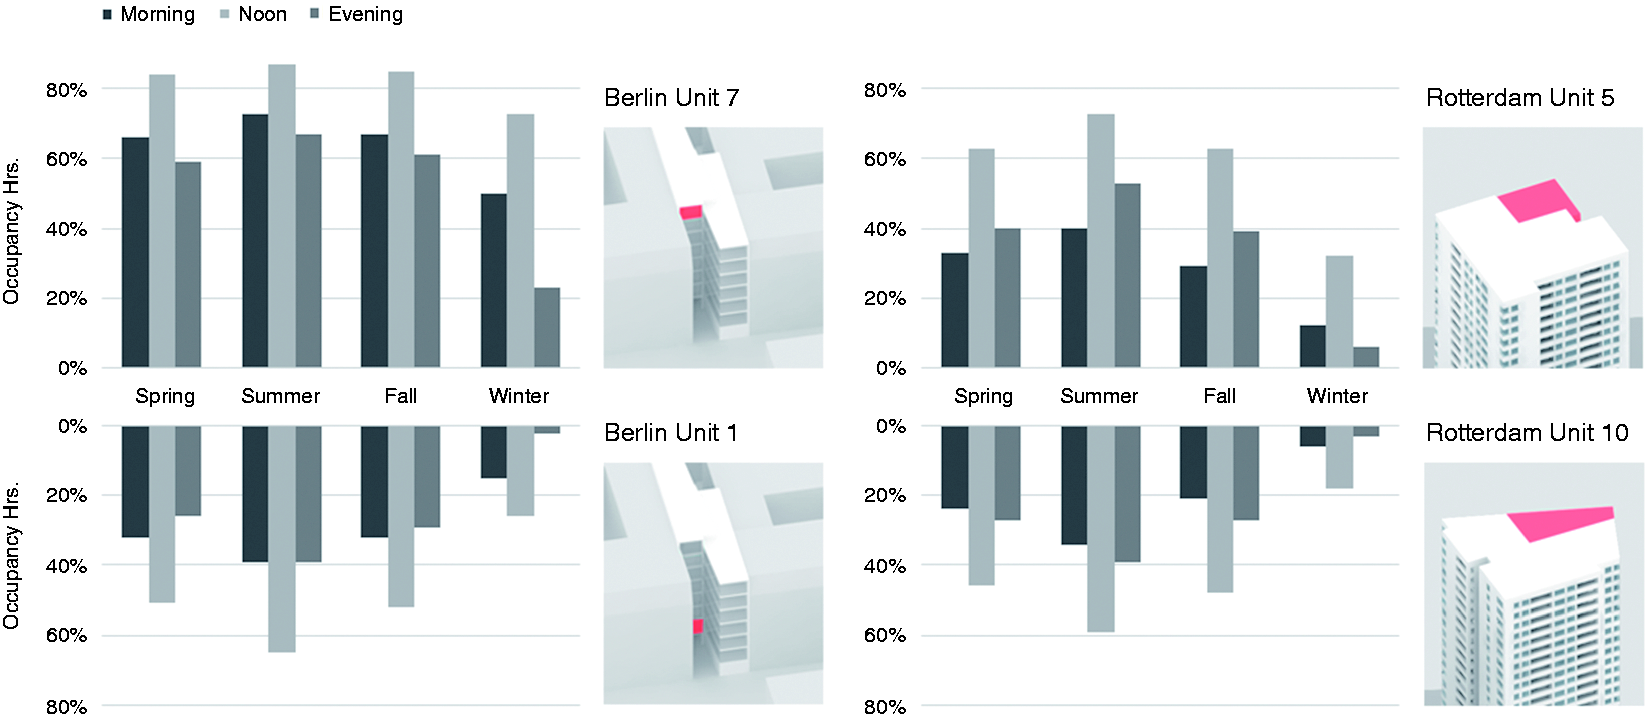
A diurnal and seasonal breakdown of average DA300lx. Highest and lowest performing apartments from the Berlin (Units 7, 1) and Rotterdam (Units 5, 10) examples, based on annual average DA300lx, are shown
4. Direct light access
Another limitation in the use of current DPMs in residential architecture is the absence of a climate-based daylighting metric that evaluates access to direct light. In most existing norms and building codes, such as the DIN 5034-1, 7 access to direct light must be demonstrated on at least one window of a residential unit on specific days and for a specific duration (17 Jan | 1 hour, 21 Mar | 4 hours). However, such analysis is purely geometric and does not take climate conditions into account.
Certain Climate-based metrics, such as the aSE, are designed to raise warning flags if a space exceeds a certain number of hours of direct light exposure. By simply reverting to this metric, one could begin to predict how well a certain space can access direct light (Figure 9). Further, when implemented at the early design stage – i.e. before the placement of partitions within each unit – this information may support the strategic allocation of both interior and exterior spaces that favour the presence of sunlight, such as balconies, living rooms and bedrooms.
Using aSE1000lx,250hrs to assess which spaces have good access to direct light throughout the year. Units 7 and 13 from the Berlin example (top) and all units from the Rotterdam example (bottom) are shown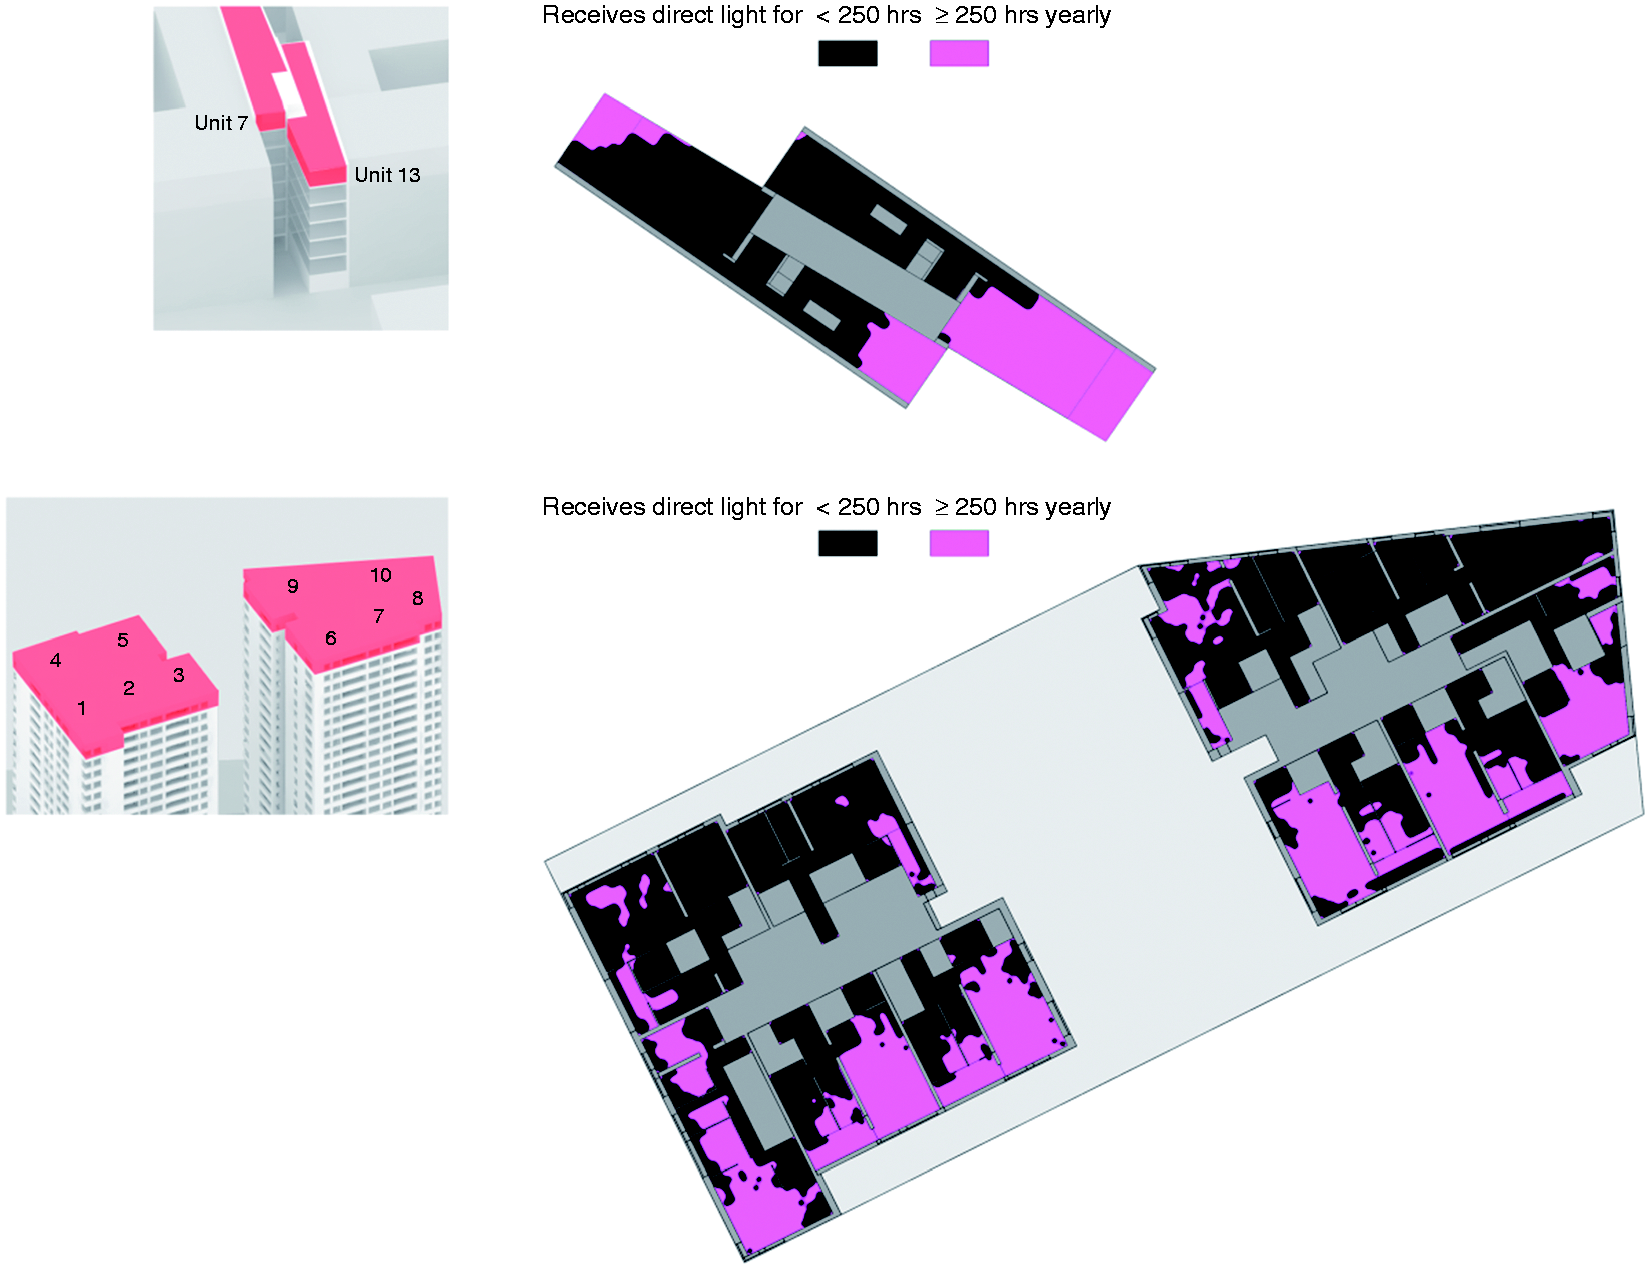
However, an assessment of the accumulated annual presence of direct light still seems insufficient, as direct light is also subject to diurnal and seasonal fluctuations. Architects often consider these diurnal differences while arranging residential floor plan layouts. For example, a bedroom would preferably face east to make use of the morning sun, whereas a dining space would face west to receive the late afternoon or evening sun. Unit 7 from the Berlin example clearly illustrates such temporal variation in Figure 10 (top) by showing accumulated direct sunlight access using the 12 previously suggested timeframes. Accordingly, it would be reasonable to place the bedroom on the south-eastern end and the living room or the dining room on the north-western end, in order to ensure that both spaces receive direct light when they are most likely occupied.
Accumulated direct light access using the 12 suggested timeframes. Unit 7 from the Berlin example (top) and Units 6, 8 and 9 from the Rotterdam example (bottom) shown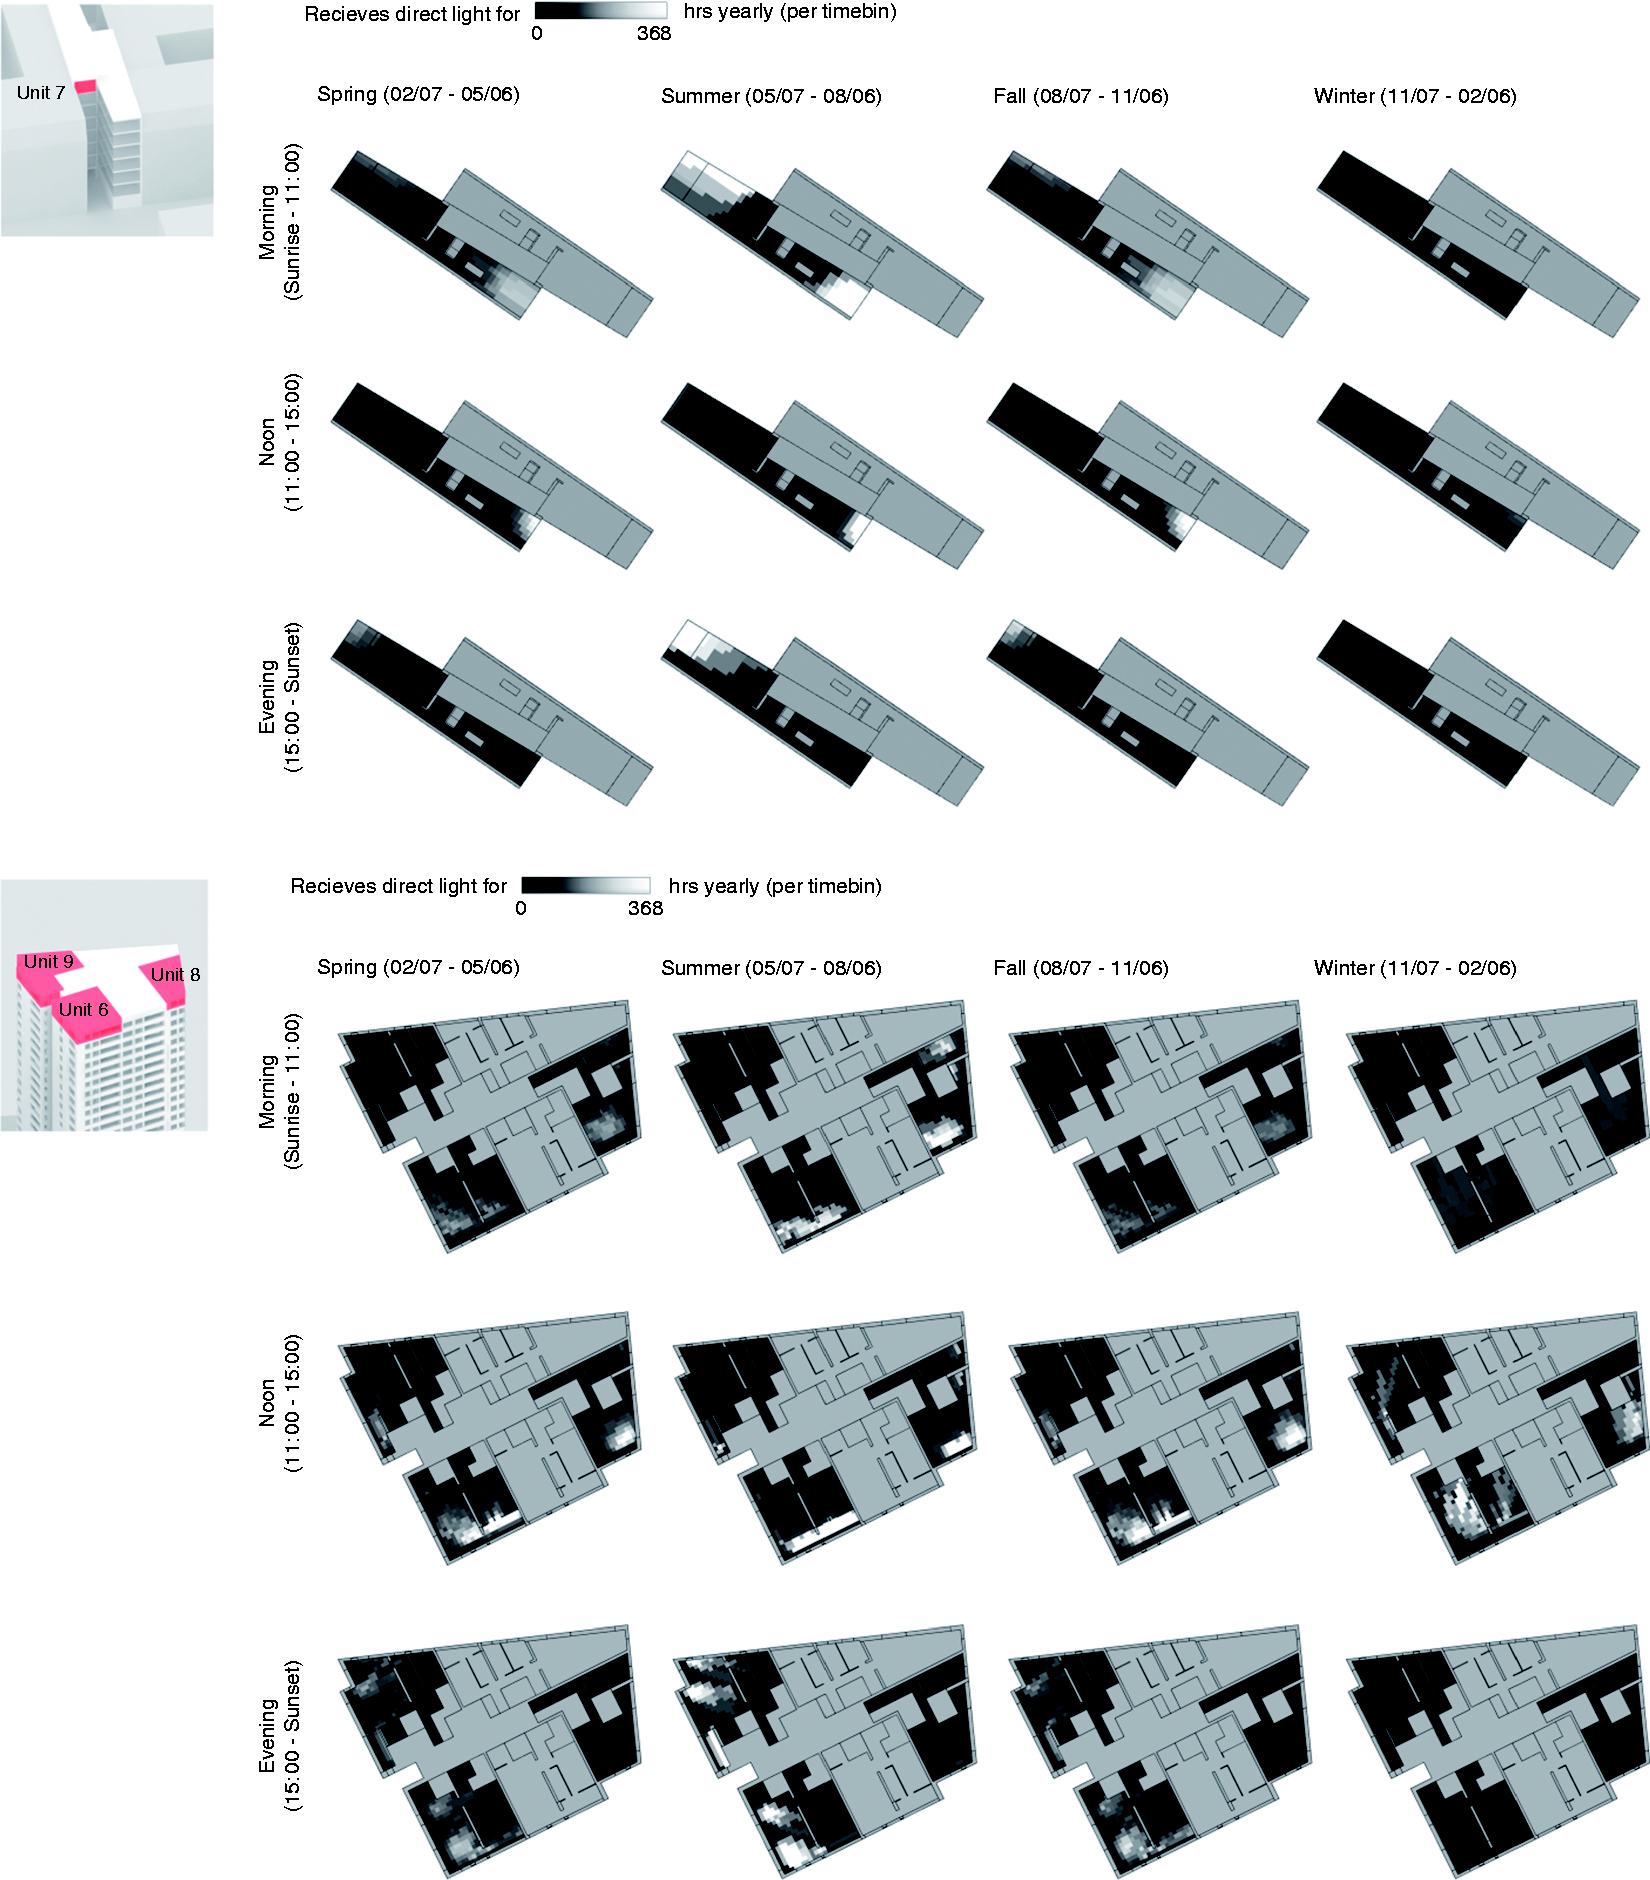
Further, an apartment which has access to both morning and evening sunlight is arguably of higher versatility and quality than one which only receives direct light during one specific time of the day. While Units 8 and 9 from the Rotterdam example (Figure 10, bottom) each generally receive direct light from morning to noontime and noontime to evening hours respectively, Unit 6 receives direct light throughout the entire day and is hence the most versatile of the three.
5. Toward a residential daylighting metric for cold and temperate climates
The previous findings illustrate that daylight evaluation of residential spaces using available DPMs remains challenging. Further, the typical annual, climate-based metrics often fail to highlight relevant aspects of natural light in residential spaces, such as diurnal and seasonal availability of daylight and access to direct sunlight. To overcome these shortcomings, a concept for a new climate-based analysis framework is proposed for further interrogation by the research community. The new framework aims to provide the following improvements:
Both daylight sufficiency and access to direct sunlight are monitored. Diurnal and seasonal analysis bins are used to detect whether daylight sufficiency and sunlight access fluctuate drastically. Results can be visualized at different levels of detail. Spatial maps provide useful feedback for the interior, while overall apartment scores are employed at the building and neighbourhood scale.
The proposal consists of two sub-metrics for residential daylight autonomy (RDA) and for direct light access (DLA) that are then summarized in a residential daylight score (RDS). The first sub-metric, RDA, is largely based on the concept of the spatial daylight autonomy sDA300lux50%time.
74
The major difference between sDA and the proposed RDA is the analysis period and the waiving of the dynamic shading specifications from LM-83,
74
as daylight oversupply is less of a concern in residential architecture. Both time and illuminance thresholds are adopted to maintain consistency. However, it should be noted that further research regarding their adequacy in residential spaces should be undertaken. It is proposed to conduct the analysis for the 12 timeframes that are given in Table 2. As a result, the percentage of floor area that is daylit for 50% or more of the time is calculated for each analysis bin. At the sensor level, one can determine if the sensor is daylit in the morning, noon or afternoon over the whole year or only for a specific season. An example that visualizes the RDA300lx,50%time is shown in Figure 11.
Seasonal and diurnal residential daylight autonomy plots (RDA300lx,50%). The percentage of floor area that meets or exceeds 300 lx for at least 50% of the time is reported in text for each time bin. Unit 11 from the Berlin example (top) and Unit 1 from the Rotterdam example (bottom) shown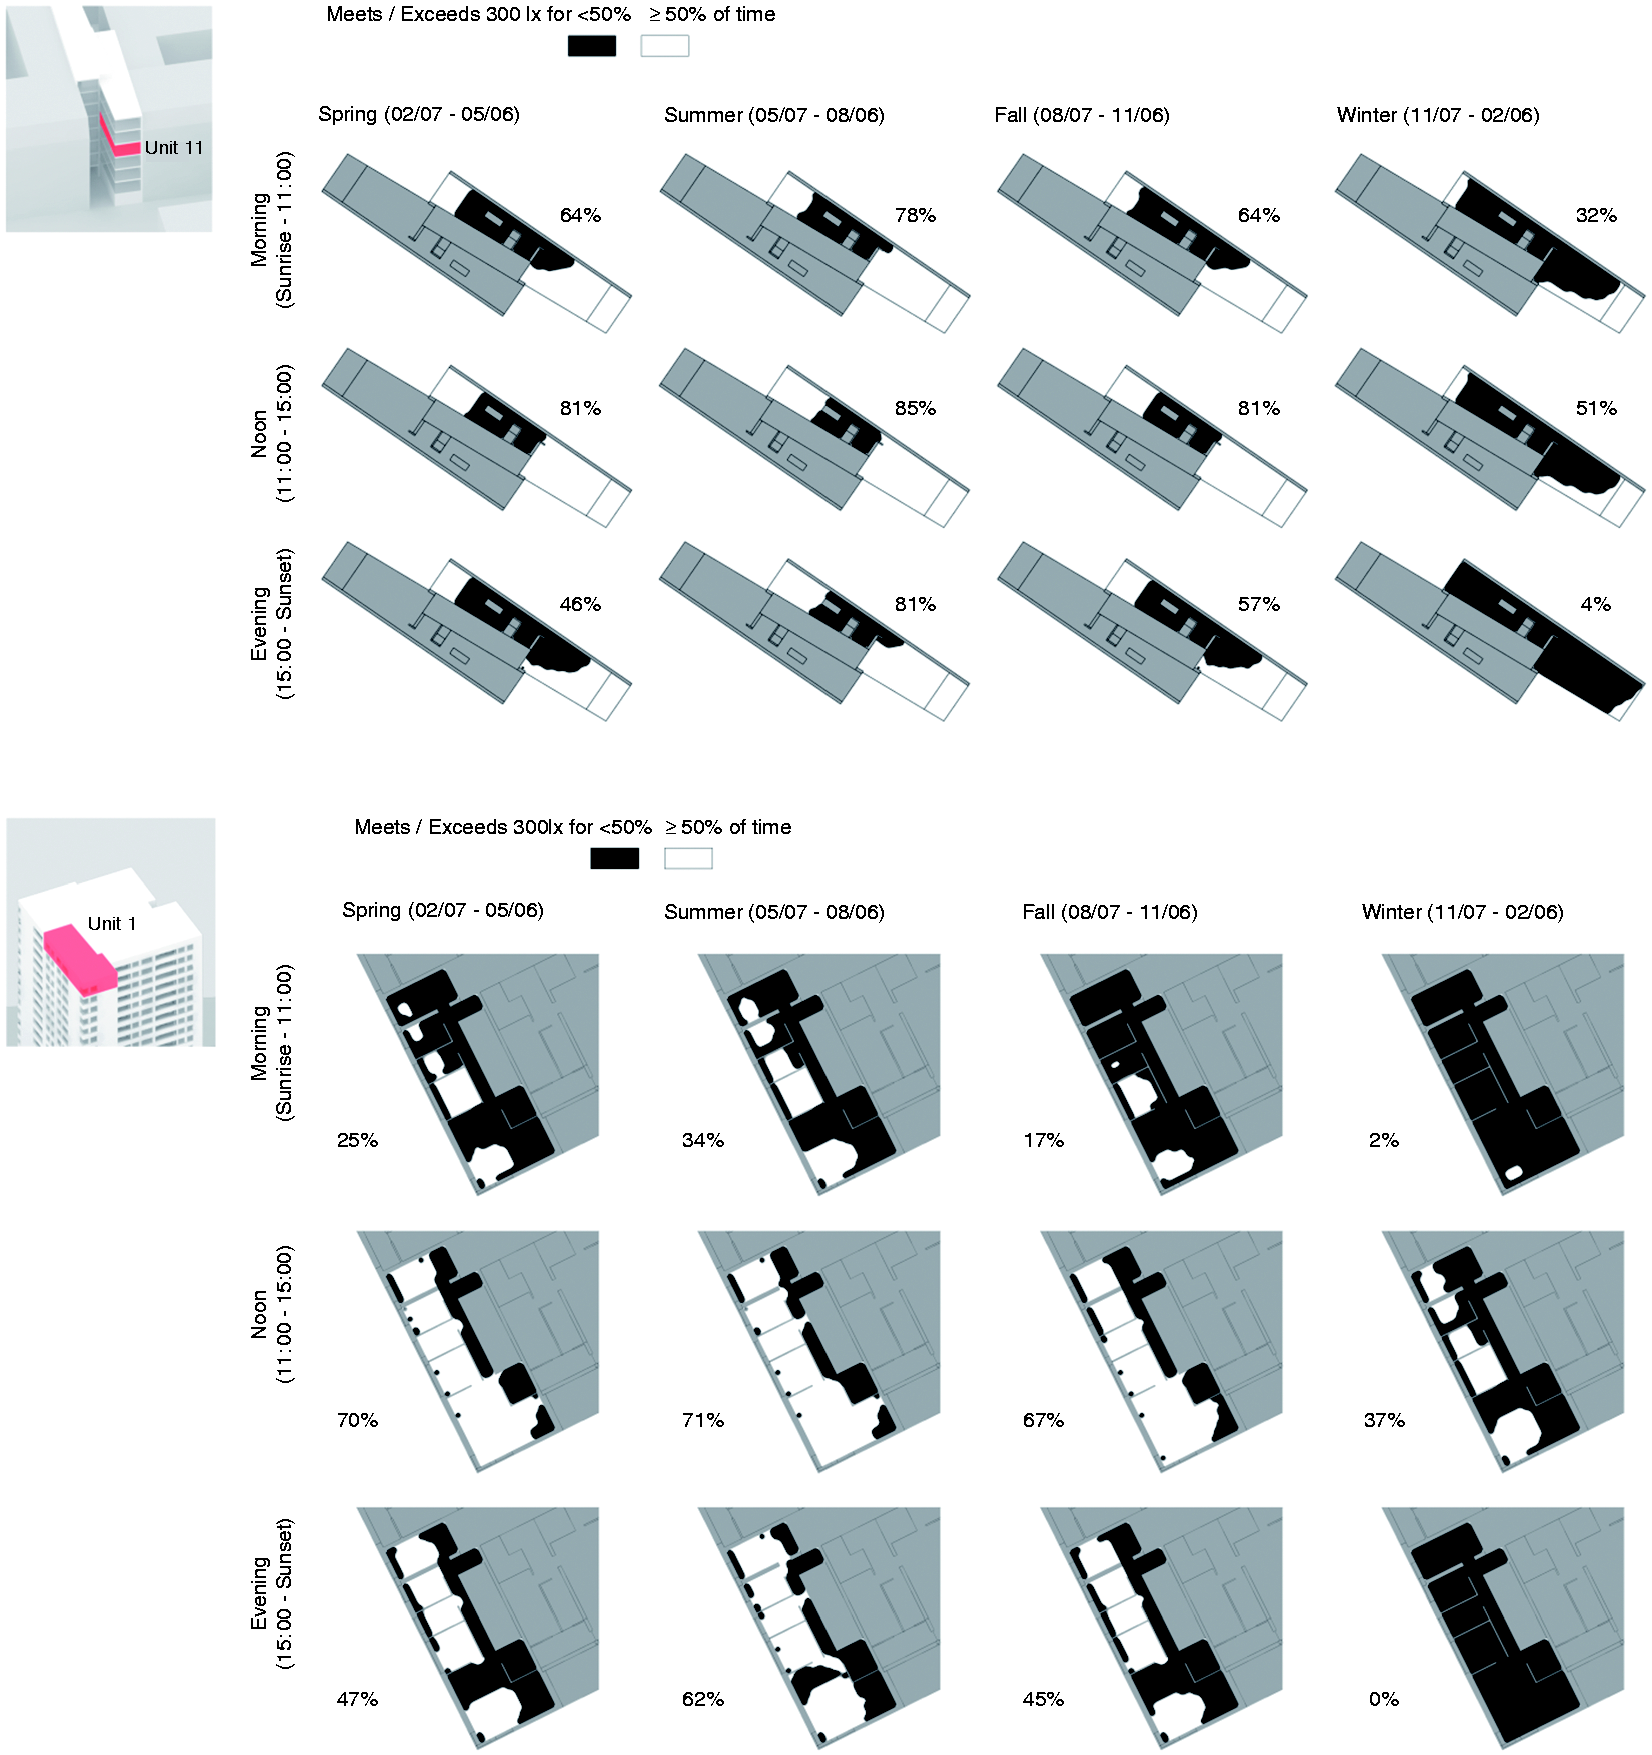
Like the above, the proposed DLA metric can be broken down into 12 timeframes to highlight seasonal and diurnal characteristics (Figure 12). To summarize the apartment’s DLA performance, a consideration of all sensors is not as meaningful, as one cannot expect every sensor in the apartment grid to be exposed to direct sunlight. It is instead more interesting to report the number of hours during which the apartment receives direct sunlight for each analysis bin. Therefore, the DLA uses a simulation without ambient contributions to monitor whether there are at least 2 m2 of floor area within the residential unit that receive any direct contributions on an hourly basis. If so, the apartment is considered to have access to direct light during that hour. This takes into account that direct light moves through a space rather quickly and that the sunlit area does not remain static. The requirement of 2 m2 aims to ensure that a usable sunlit area is provided. Finally, the daily average hours for each of the 12 time bins are reported.
Seasonal and diurnal Direct Light Access plots (DLA). The average number of daily hours during which at least 2 m2 of the floor area receive direct light is reported in text for each time bin. Unit 11 from the Berlin example (top) and Unit 1 from the Rotterdam example (bottom) shown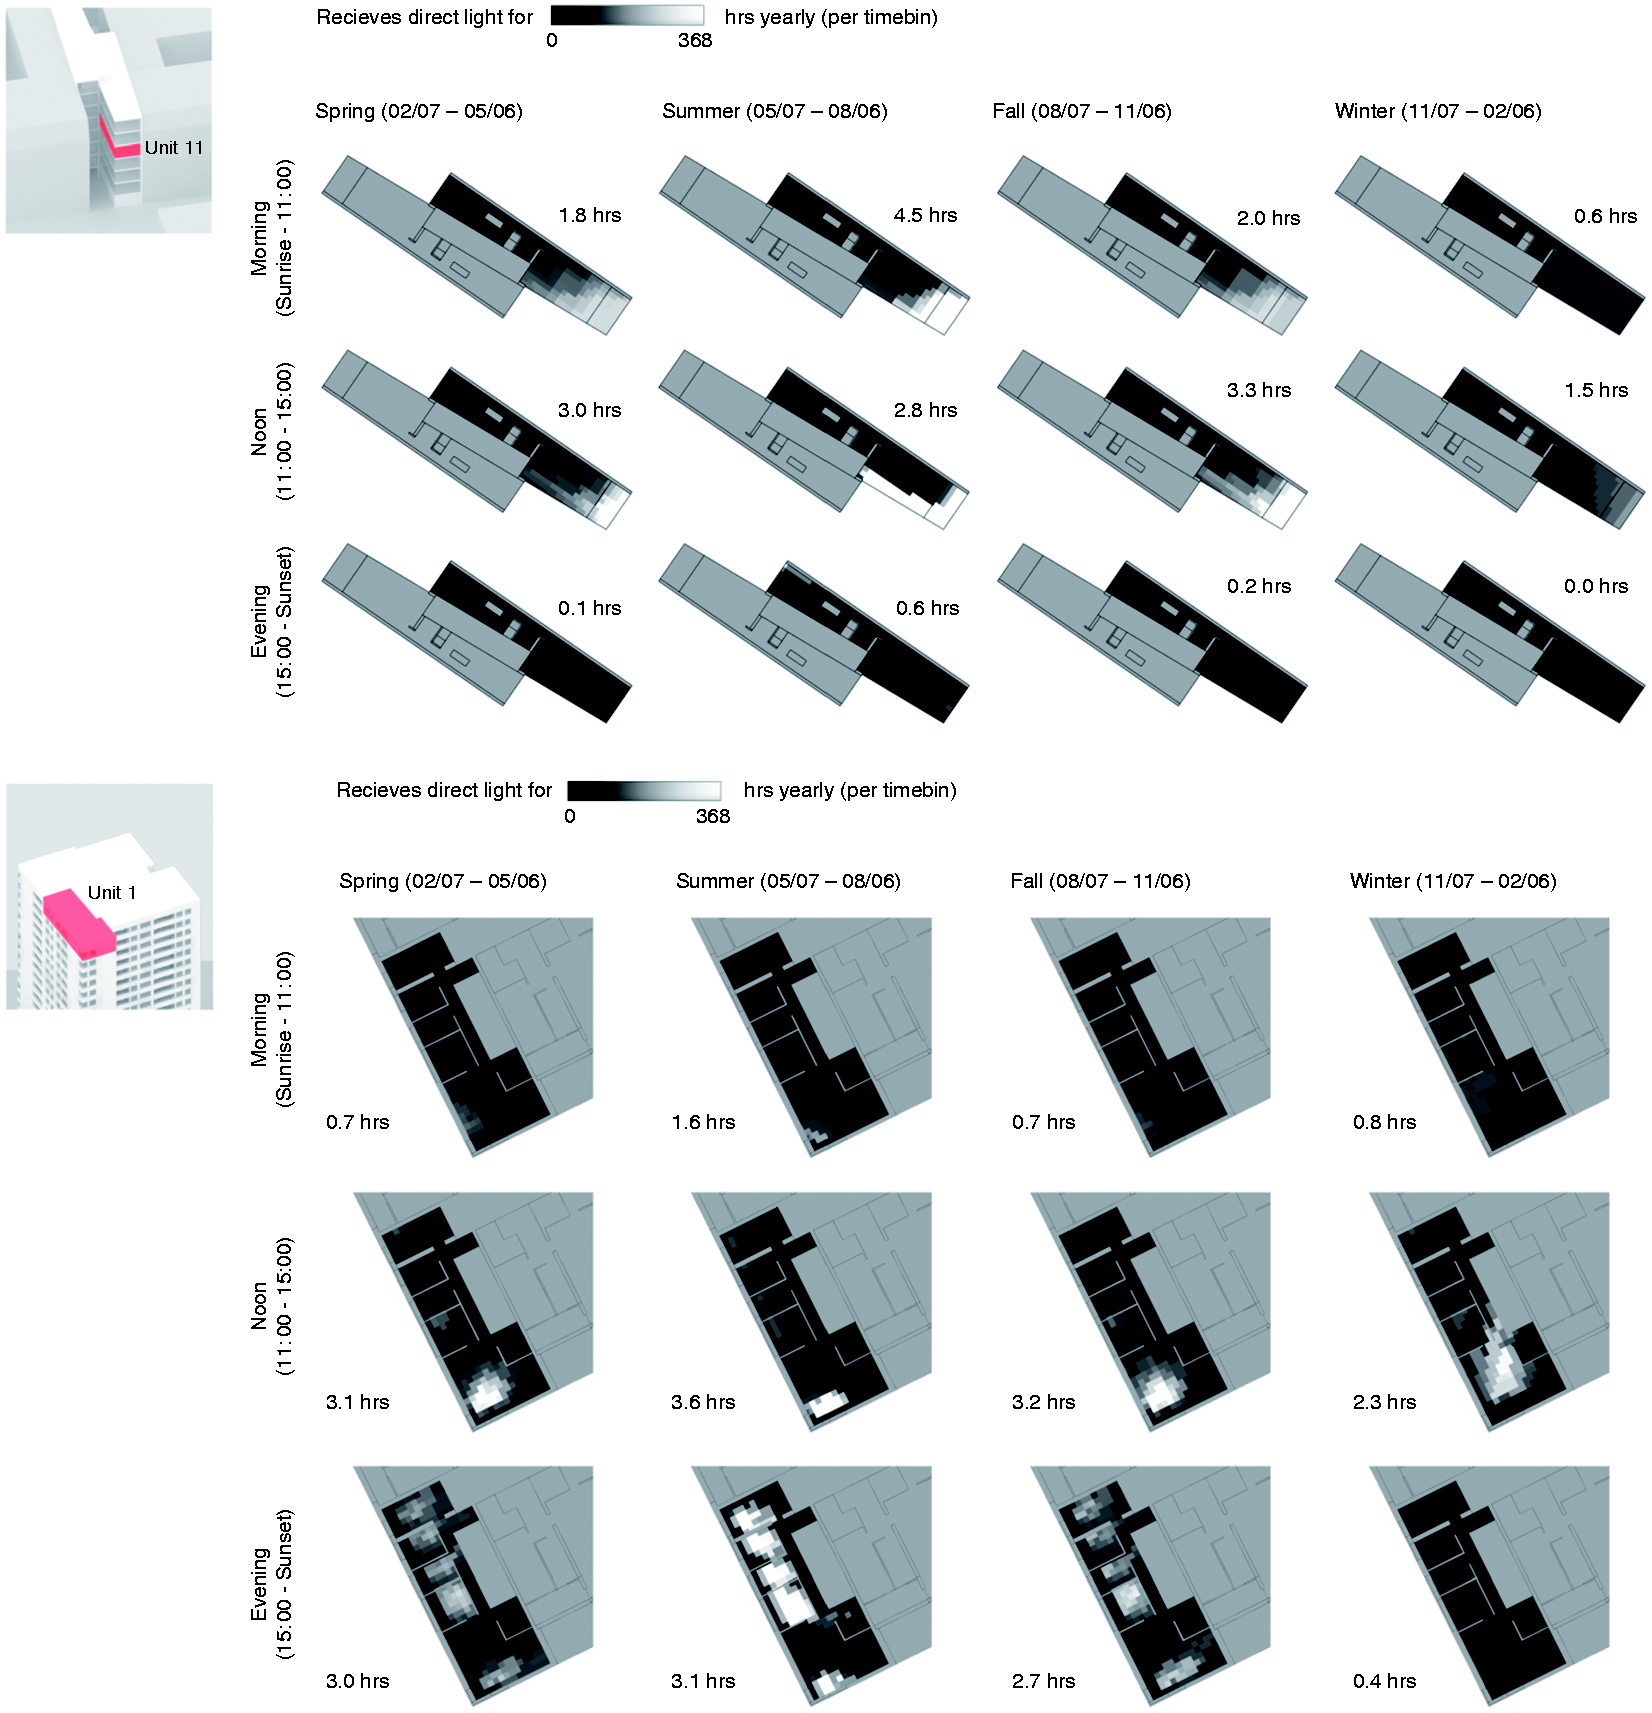
This assumption, however, leads to the question whether it is appropriate that such a strong emphasis on the availability of direct light should be made in certain climates. The provided test cases are from temperate European locations. In such climates, it is reasonable to assume that most people would perceive access to direct light as a desirable amenity. In hot and arid climates, in which people tend to favour protection from the sun, it may not be justified to optimize dwellings for direct solar access. In such climates, different targets need to be defined, and further research must be conducted to determine them. Further, it should be noted that Daysim in hourly time step mode is not the most accurate approach for direct sunlight evaluation. Nevertheless, it was used in this proof-of-concept study to keep workflows consistent.
The RDA and DLA sub-metrics are necessary to capture the different characteristics of daylight in residential spaces. The RDS is then introduced as an all-in-one, easy-to-understand point summary of the previous two sub-metrics. It aims to facilitate succinct comparisons of daylight performance per apartment unit at the building or neighbourhood scale. The RDS awards one point for every analysis bin: To score a full point, a certain performance threshold must be met, although partial credit is also given. For RDA, the target percentage of the floor area for the apartment to be considered well daylit is set to 60%. In the two case studies, this threshold was an achievable goal. However, wider use of the proposed metric requires further research regarding achievability and user preference. If this criterion is met for the morning, noon and evening across all four seasons, a maximum score of 12 points is awarded. The methodology is similar for DLA: A point is awarded when at least 2 m2 within the apartment receive a daily average of 2 hours of direct sunlight for each diurnal and seasonal bin. Therefore, the maximum score for DLA is also 12 points. Summing both scores allows one to express the RDS as a single score of maximum 24 points per unit. This single score can then be used to compare the overall daylight performance of apartment or dwelling units. Figure 13 shows how this comparison can be visualized in a 3D model using a false-colour scheme. Further, score-cards with two-point matrices per unit can be used to visually indicate the seasonal and diurnal daylight performance.
RDS (RDA300lx, 50%time, 60%area + DLA2sqm, 2h) shown as false-colour visualization, along with the RDS score-card for the highest and lowest scoring units for each building example. (Available in colour in online version) RDA: residential daylight autonomy; DLA: direct light access.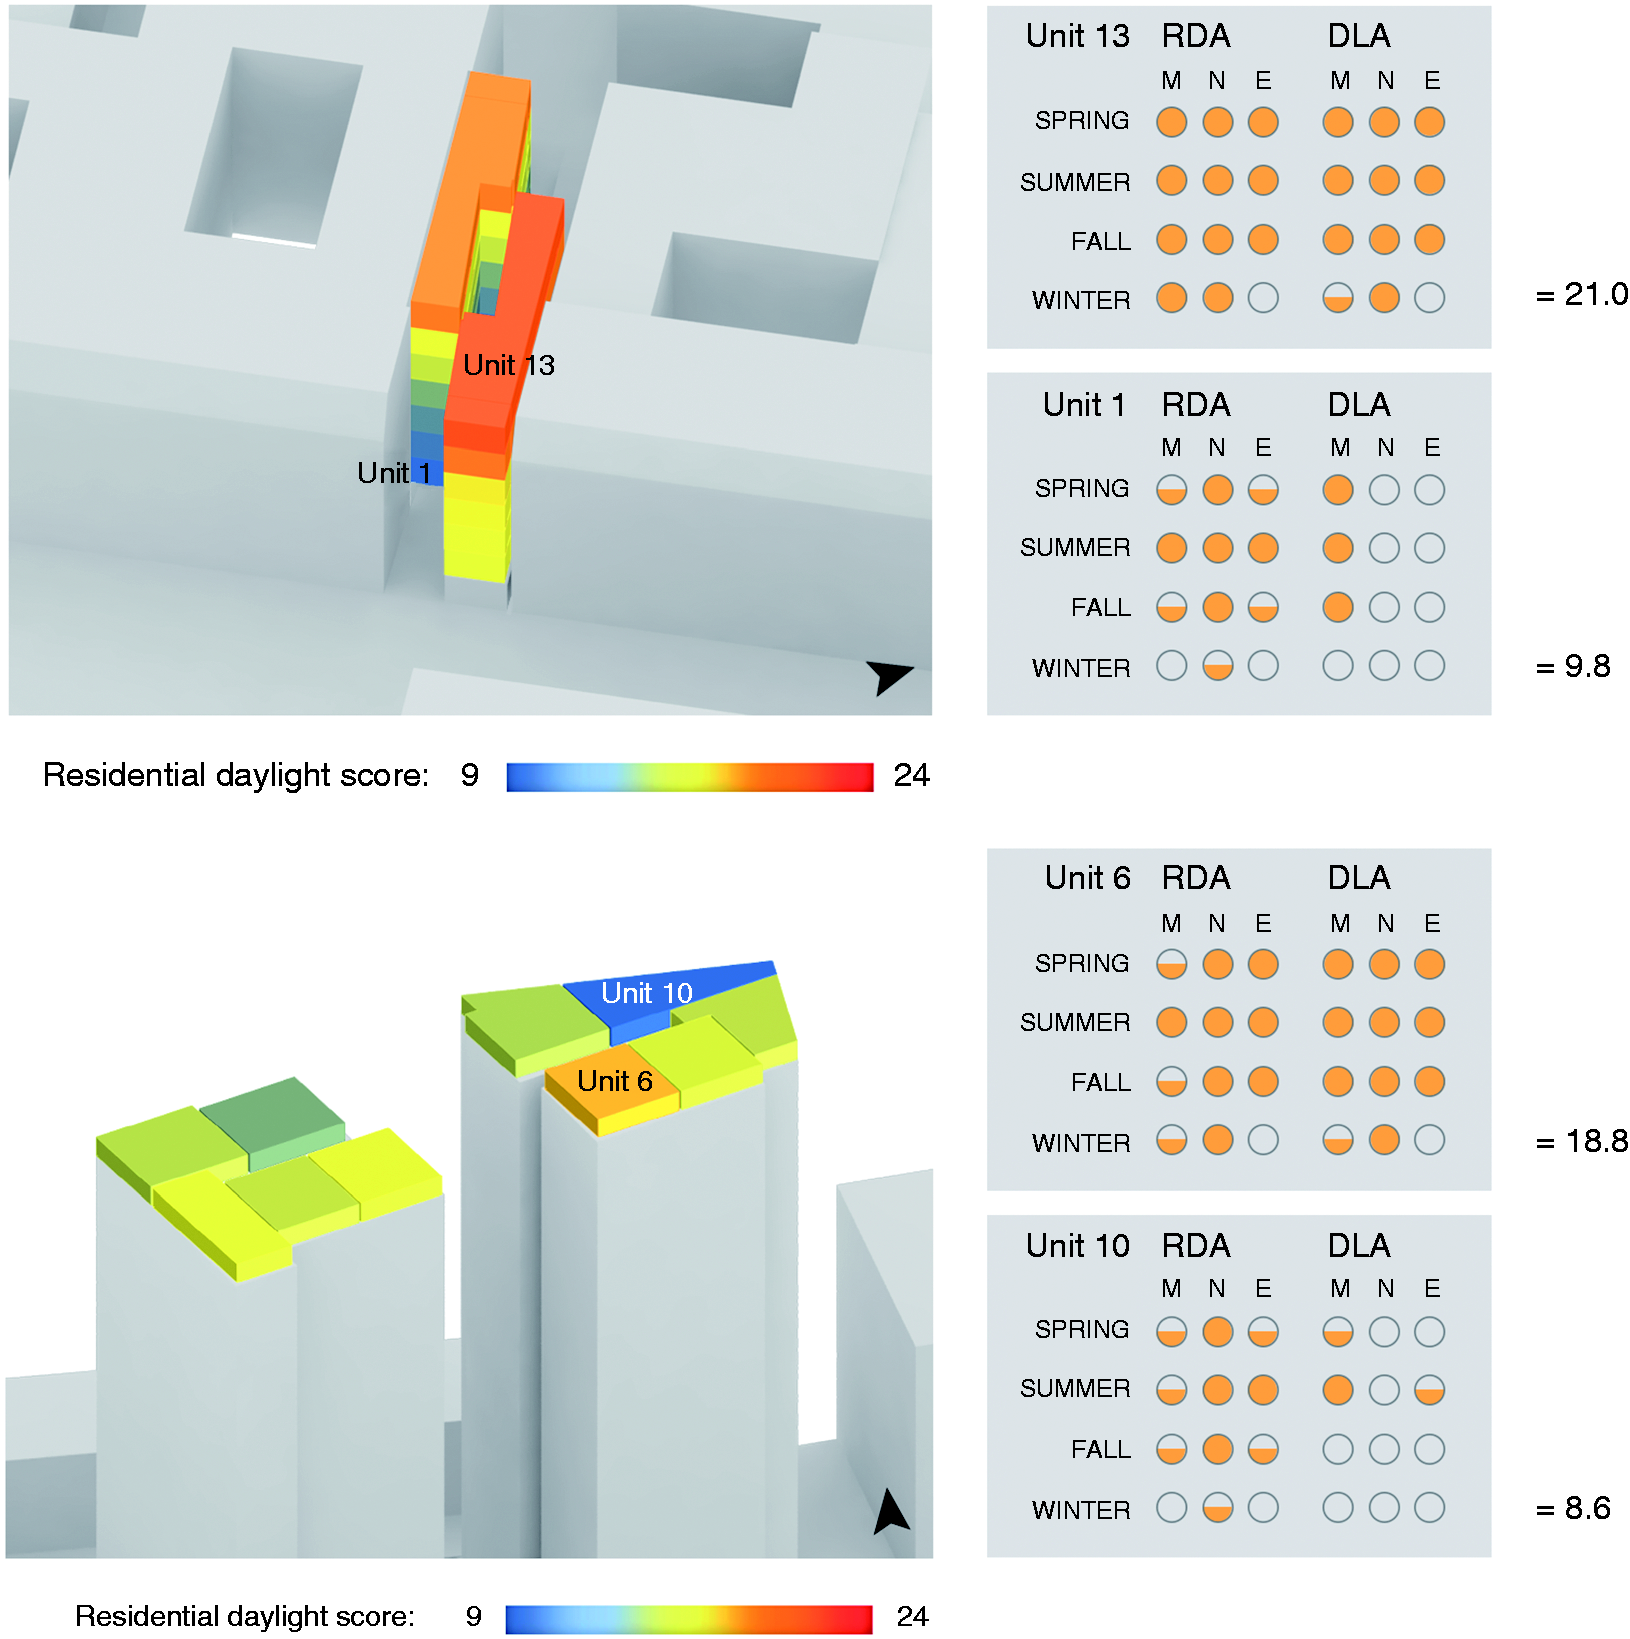
Finally, the proposed score and sub-metrics are compared to the existing body of daylighting metrics. Table 5 and Figure 14 provide DA300lx, cDA300lx, UDIautonomous, sDA300lx,50%time as well as LEED credit point ratings for all apartment units in this study and juxtaposes them with the proposed RDS and its sub-metrics RDA and DLA. As expected, the overall trends in both existing and proposed metrics are similar. Apartments that score high in the existing climate-based metrics also receive high RDS scores. Especially if apartments are less obstructed by context and have access to multiple cardinal directions, like B8-B13, RDS and DA as well as cDA correlate well. UDI scores are comparable to RDS in the lower spectrum (B1–B3) and then begin to reverse their trend in the higher score ranges (B5–B7) due to the imposed upper illuminance limit. For the more obstructed apartments (B1–B7), RDS articulates relative differences much more strongly. For apartments that see fewer cardinal directions due to obstructions and apartment orientation, the differences between existing and proposed metrics become most apparent. Here, the timeframe based analysis clearly separates units that have universally good access to daylight from those that do well only at specific times.
Comparison of average DA300lx, cDA300lx, UDIautonomous, sDA300lx,50%time and the proposed RDS and its sub-metrics. All units from the Berlin (B1–B13) and Rotterdam (R1–R10) examples are shown. DA: daylight autonomy; cDA: continuous daylight autonomy; UDI: useful daylight illuminance; sDA: spatial daylight autonomy; DLA: direct light access; RDS: residential daylight score; RDA: residential daylight autonomy. Comparison of average DA300lx, cDA300lx, UDIautonomous, sDA300lx,50%time, aSE250hrs,1000lx along with whether each unit passes the LEED v4 threshold of 55% well daylit (sDA300lx,50%time) floor area. In addition, scores for the proposed metric are given. All units from the Berlin (B) and Rotterdam (R) examples shown DA: daylight autonomy; cDA: continuous daylight autonomy; sDA: spatial daylight autonomy; aSE: annual sunlight exposure; UDI: useful daylight illuminance; LEED: Leadership in Energy and Environmental Design; RDS: residential daylight score; DLA: direct light access; RDA: residential daylight autonomy.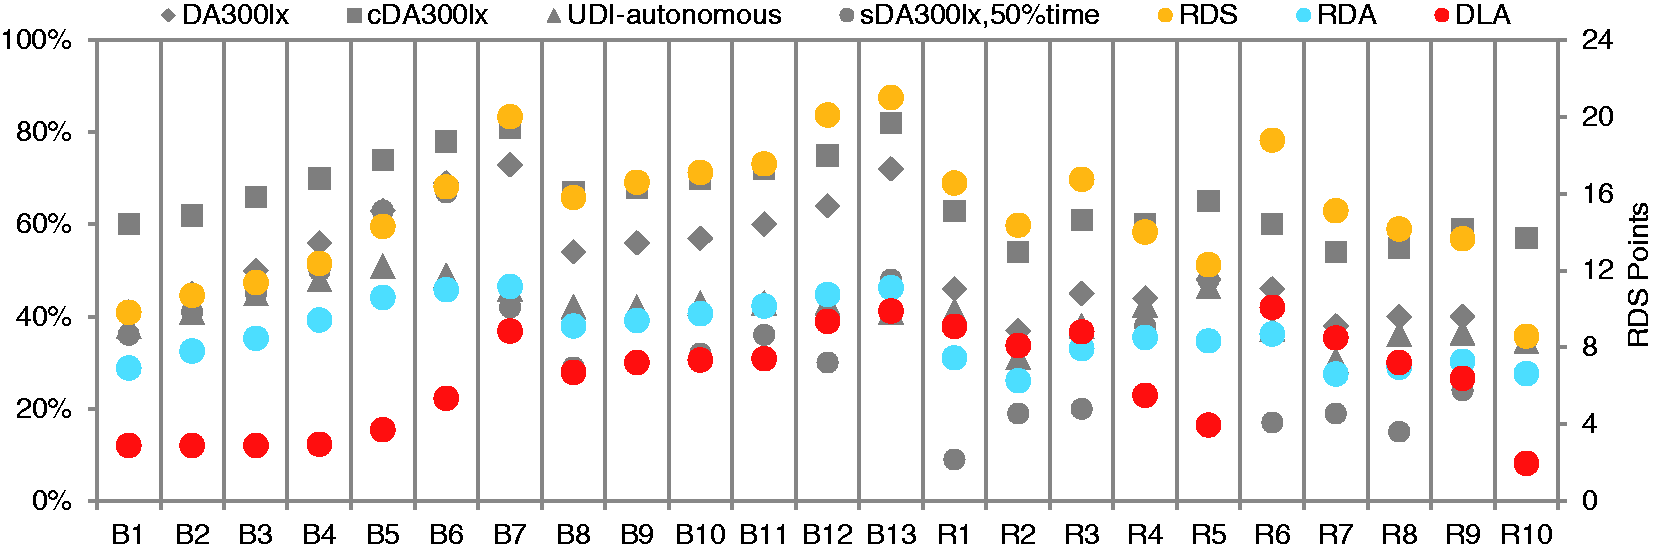
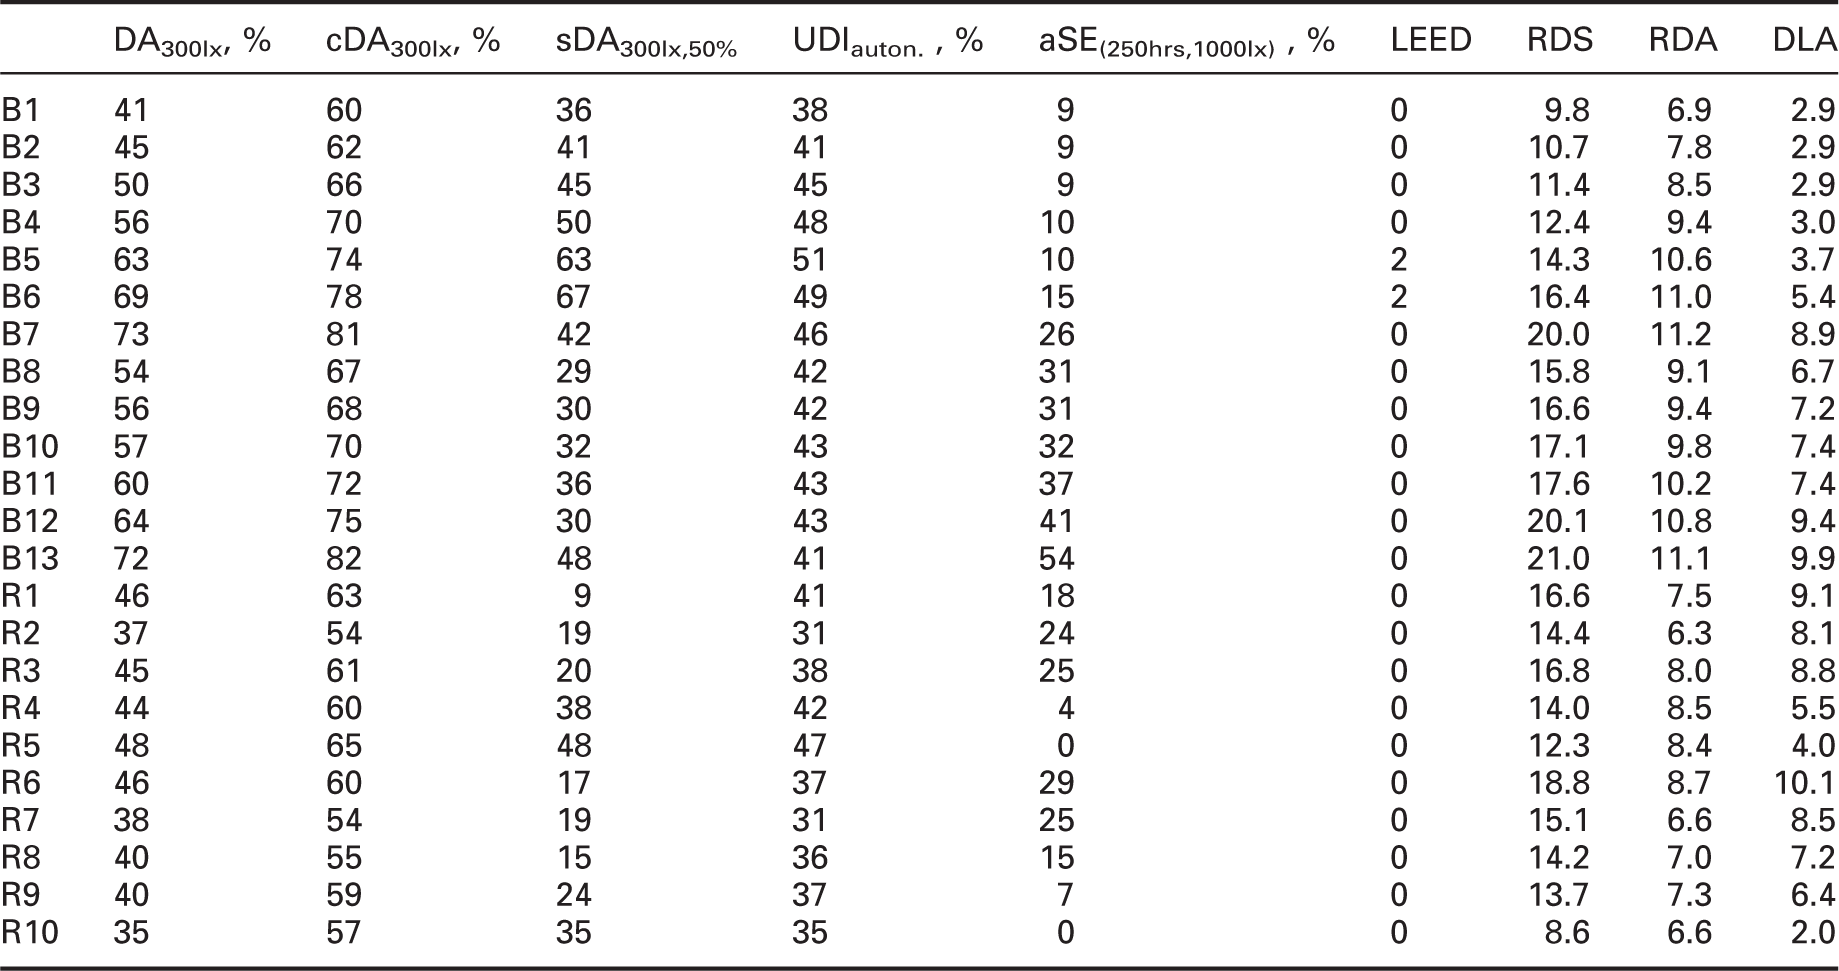
Figure 15 plots the existing and proposed metrics against each other in three graphs to visually compare their correlations. RDS (Figure 15(a)) and even more so RDA, shown in Figure 15(b), correlate with DA. Comparison of the higher scores generate points almost parallel to the identity line. In the lower ranges, the scattering increases, confirming previous observations from Figure 14.
Selected comparisons of RDS, RDA and DLA results against DA300 lx, sDA300 lx, 50%time, and aSE1000lx, 250 hours. DA: daylight autonomy; UDI: useful daylight illuminance; sDA: spatial daylight autonomy; aSE: annual sunlight exposure.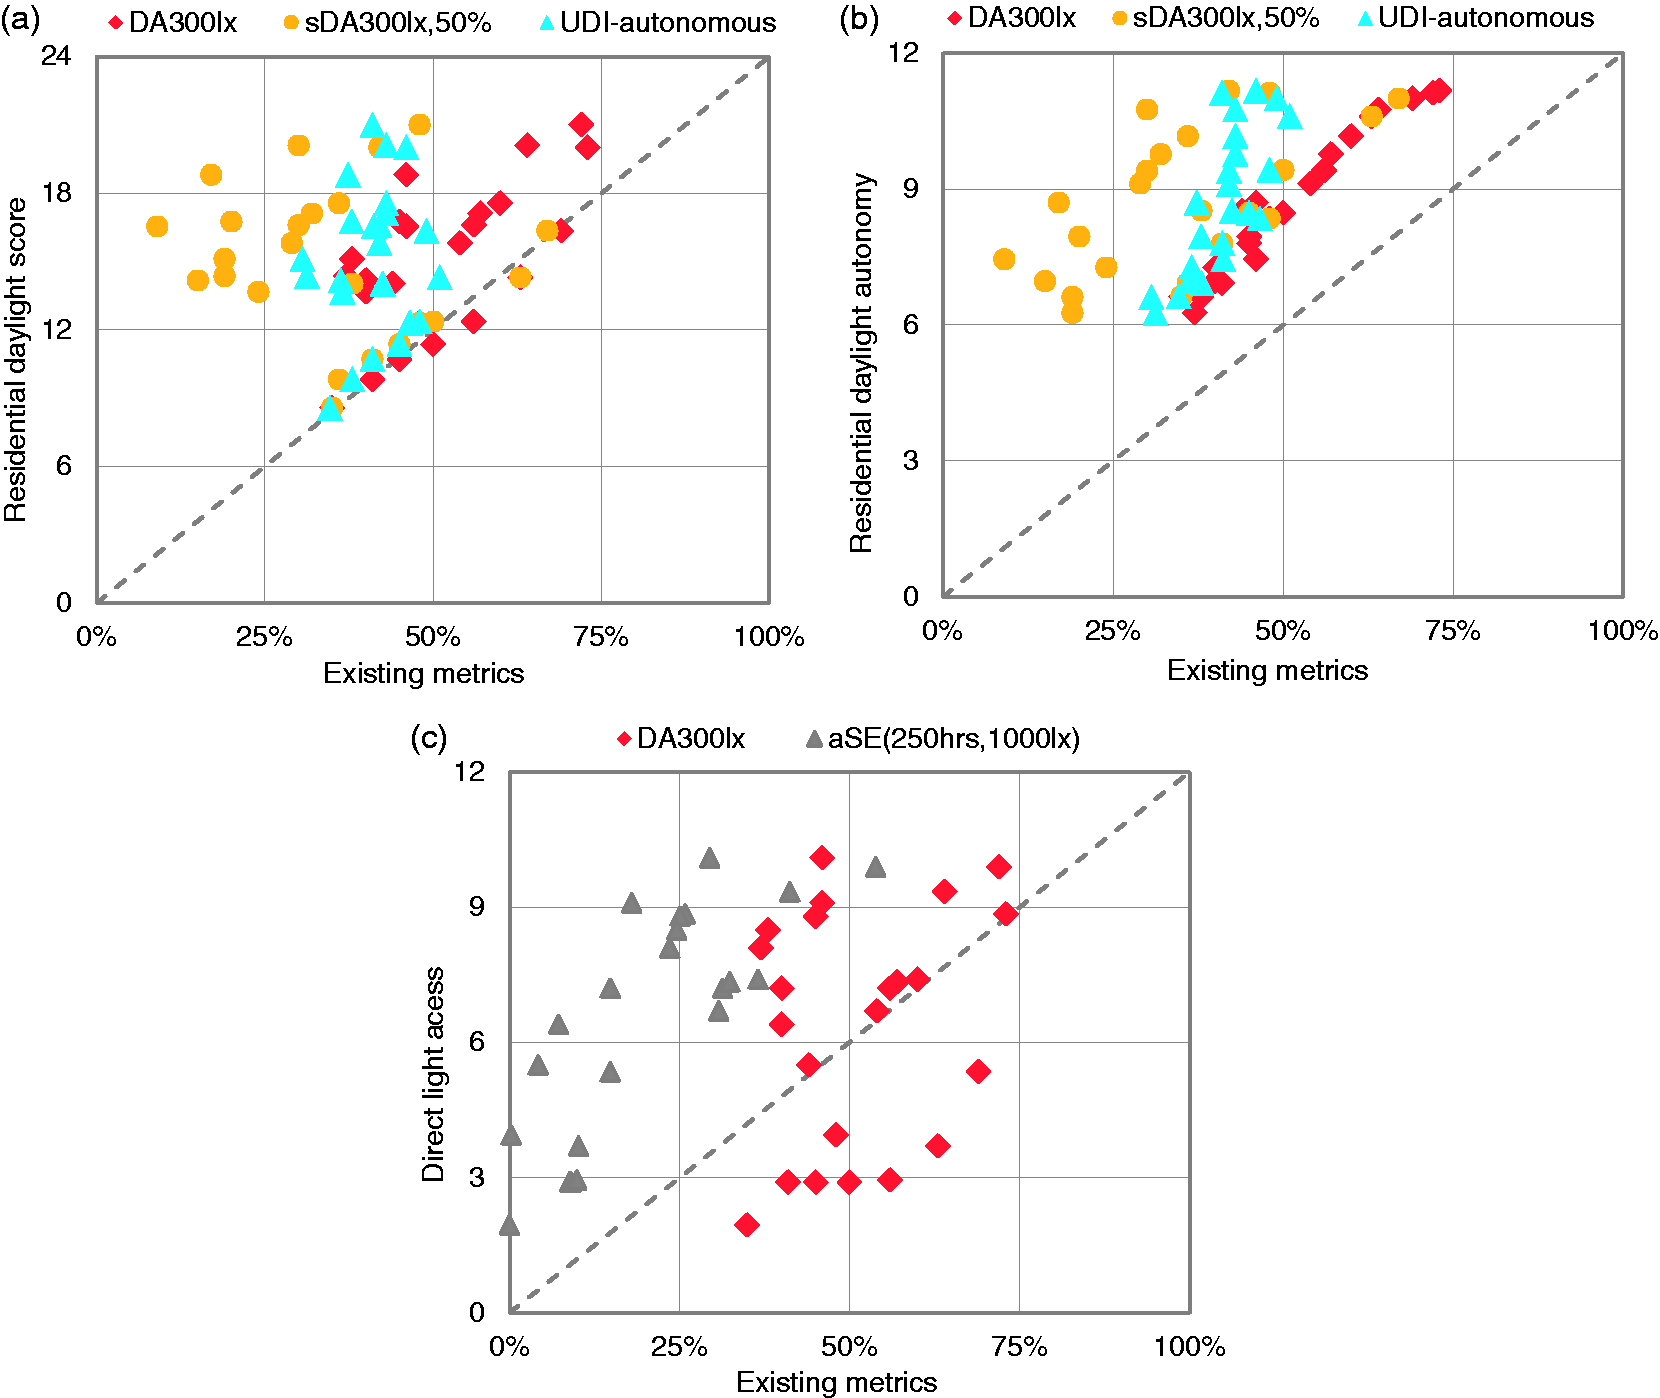
The sDA results are difficult to compare to the proposed metrics due to the use of dynamic shading. Figure 15(a) and (b) shows that it is least consistent with the proposed metrics. As expected, the dynamic shading results in significantly lower sDA readings and therefore only two apartments in this study could potentially receive LEED credit and only one fulfils the aSE requirements. In comparison to the much more differentiated and nuanced results computed with other metrics, using the LEED evaluation schema for residential spaces seems overly harsh and unfit to differentiate residential daylighting qualities.
Meanwhile, Figure 15(c) clearly shows that DA is not good for DLA, highlighting the necessity of DLA. Even when compared against aSE, which was specifically designed to address the incidence of direct light, DLA shows a relatively weak correlation. This signifies that the consideration of diurnal and seasonal timeframes provides a meaningful, new approach to assess access to direct sunlight.
Decoding these rather significant qualitative differences in daylight availability and direct sunlight access of the different apartment units seem to be an important task that residential daylighting metrics should be able to fulfil. In general, this poses the question whether the temporal daylighting characteristics of spaces are not interesting for all kinds of daylight analyses. Having the same information for the design of other programme types may be equally useful, as it may convey the expected daylight experience in a more straightforward manner.
6. Conclusion
A meaningful application of currently available DPMs remains challenging for residential architecture. Aspects of daylight that are mentioned frequently in the design literature, such as access to direct sunlight as well as daylight availability for timeframes of interest, cannot be sufficiently assessed with existing DPMs. This paper hence proposes a concept for a new daylighting analysis framework for residential architecture. It consists of two sub-metrics that capture diurnal and seasonal daylight availability, as well as the average duration of access to direct sunlight. It is shown that through the use of the proposed framework, significant and actionable qualitative differences between apartment units can be identified that would otherwise remain unnoticed during the design and evaluation process. The framework also provides several levels of detail that range from a simple score to spatial plots that allow modellers to understand and optimize the daylighting characteristics of a room, apartment building or neighbourhood.
Footnotes
Declaration of conflicting interests
The authors declared no potential conflicts of interest with respect to the research, authorship, and/or publication of this article.
Funding
The authors disclosed receipt of the following financial support for the research, authorship, and/or publication of this article: The authors would like to thank the Hunter R. Rawlings III Cornell Presidential Research Scholars fellowship programme, Cornell University David R. Atkinson Center for a Sustainable Future for funding this research with an Academic Venture Fund, as well as NVIDIA for supporting the project with a hardware grant.