
Abstract
The scotopic/photopic ratio (S/P) is a parameter that may be considered in the design of road lighting. This paper compares the S/P ratio and correlated colour temperature (CCT) for 297 light source spectra identified in IES Technical Memorandum TM-30-15 to test the assumption that higher S/P ratios demand higher CCTs. The results suggest that, for a given lamp type, there is a strong association between S/P ratio and CCT, and hence that for a given CCT only a small variation in S/P ratio is available. However, the results also suggest that a larger variation in S/P ratio is possible if the lighting designer is able to consider a change in lamp type.
1. Introduction
Correlated Colour Temperature (CCT) and Scotopic/Photopic ratio (S/P) are two metrics derived from lamp spectrum that might be used to characterise lighting, the latter becoming more commonly used in recent years in association with road lighting.1–3 CCT is the temperature of the Planckian radiator having the chromaticity nearest the chromaticity associated with the given spectral distribution 4 : it is a metric of colour appearance. The S/P ratio is the ratio of the luminous output of a light source evaluated according to the CIE scotopic spectral luminous efficiency function to the luminous output evaluated according to the CIE photopic spectral luminous efficiency function 5 : it describes the relative stimulation of the rods and foveal cones.
On minor roads, pedestrian needs are the primary target of road lighting. Following evidence of the benefit of a higher S/P ratio for the visual tasks of pedestrians,6–9 road lighting guidance in the UK allows a lower photopic illuminance to be used when using lighting of a higher S/P ratio, 10 with the degree of illuminance reduction specified by the CIE system for mesopic photometry. 5 Lamps of higher S/P ratio permit a greater reduction in photopic illuminance for the same mesopic luminance. Using a lower photopic illuminance may lead to a lower demand for energy (although that depends on many other parameters 11 ) and thus those authorities responsible for paying the costs of road lighting have good reason to prefer lamps of higher S/P ratio. A lighting designer might therefore pay attention to both CCT and the S/P ratio, the former for describing colour appearance and the latter for visual performance and hence light level and overall efficiency.
It is common to associate higher S/P ratios with a higher CCT; that is a reasonable assumption to make given that both CCT and S/P ratio are spectrum-derived measures associated with the relative proportions in the short wavelength and long wavelength regions of the visible spectrum. Within the UK, the demand for a higher S/P ratio has contributed to a rise in the CCT of lighting used in minor roads. In turn, this has led toward a reaction from the public against the replacement of sodium lighting with lighting of higher CCT and hence cooler appearance [e.g.12–16]. While such public criticism may be a reaction against change, or a reaction to changes such as the better optical control associated with the change from traditional to LED light sources, colour appearance is the focus of the criticism and is therefore something local authorities seek to address.
Is it correct to associate higher S/P ratios with higher CCT? An early pioneer of the S/P ratio was Berman. In one article
17
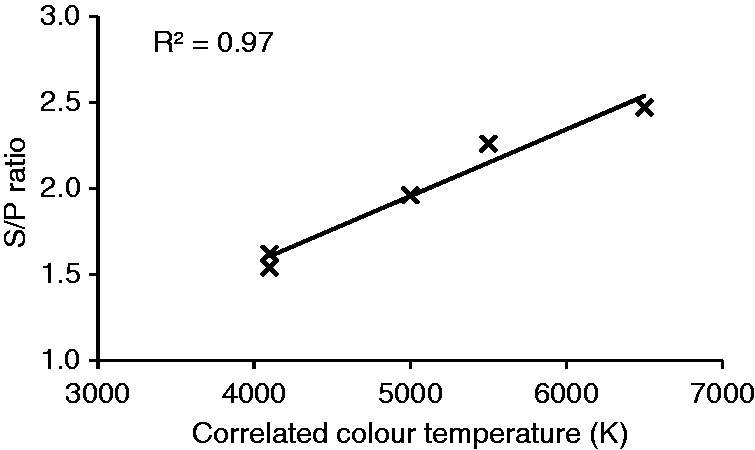
he listed the S/P ratios for 16 common types of light source and illuminant (Figure 1) and these give the impression of a positive association. For five light sources/illuminants, the CCTs were also reported, and plotting S/P ratio against CCT for these five lamps reveals a strong association (R2 = 0.97, n = 5) (Figure 2).
S/P ratios of some light sources as reported by Berman
17
S/P ratio plotted against CCT for those light sources of Figure 1 where CCTs were reported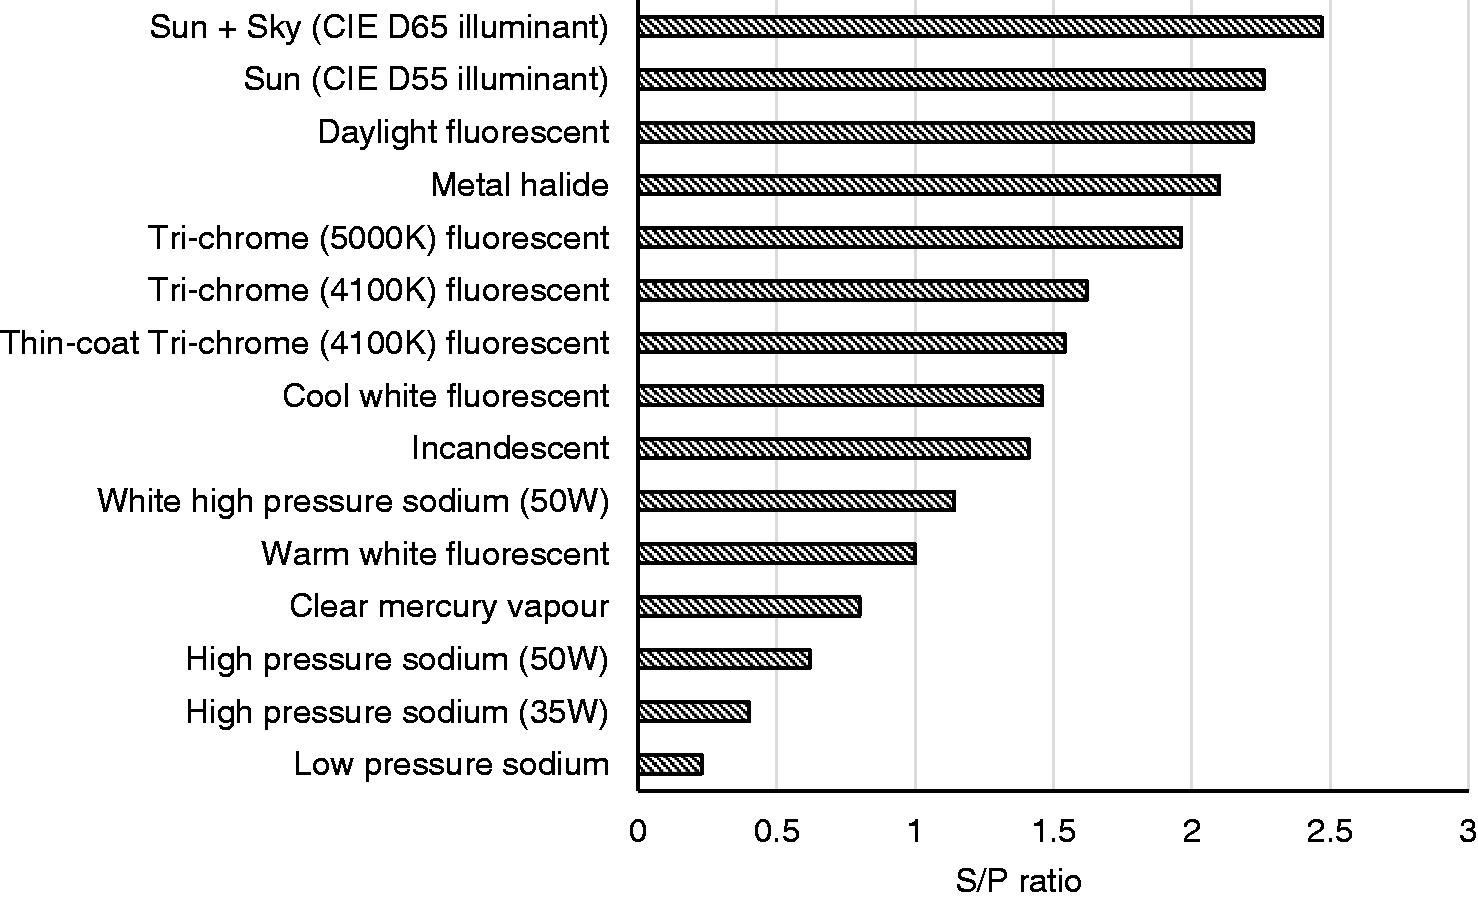
A further comparison was drawn by Ashdown
18
who analysed the spectra of 90 ‘LED-based roadway and area lighting luminaires’ collected for performance testing. Plotting S/P ratio against CCT for these LEDs again suggests a strong association (R2 = 0.83, n = 69) (Figure 3). As was noted by Ashdown, a limitation of this finding is that the sample was limited to only one type of light source (white LEDs).
S/P ratio plotted against CCT for LEDs as reported by Ashdown.
18
Note: included here are 69 of the 90 cases, these being the ones determined by digitising the graph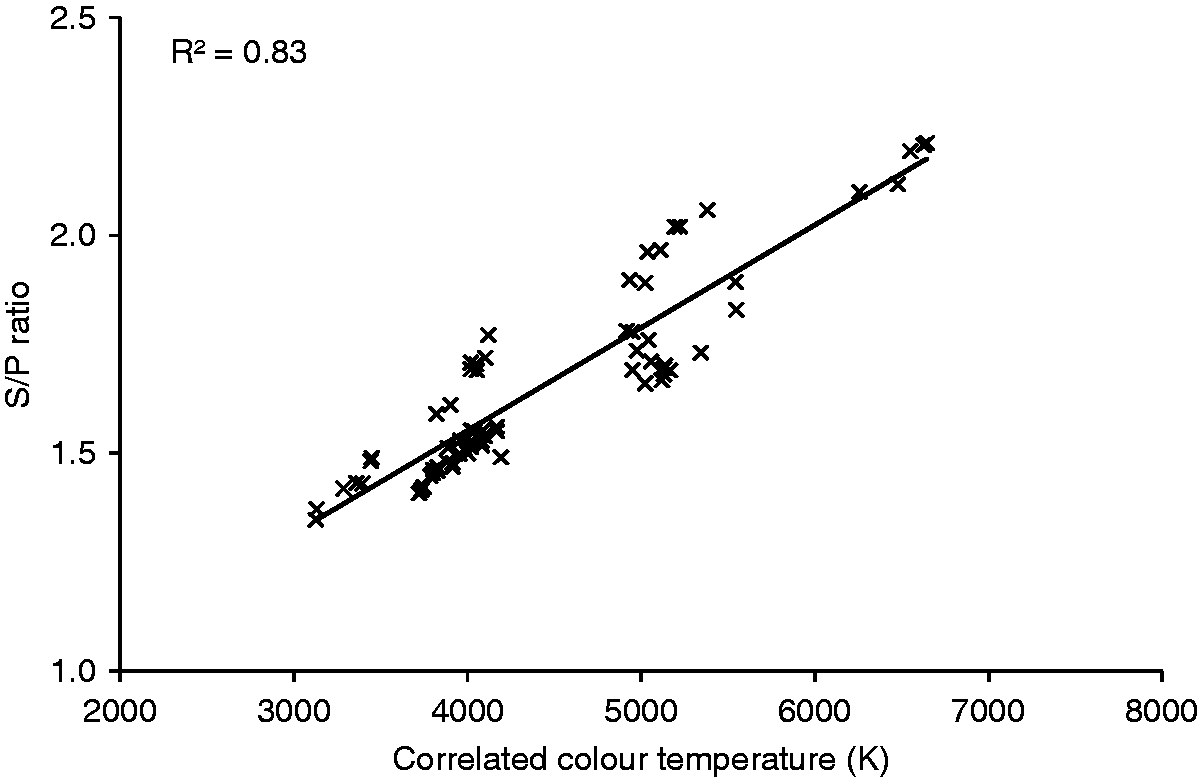
Chromaticity coordinates, S/P ratios and approximate CCTs of the LED spectra and blended fluorescent lamps used in investigations of spatial brightness and hazard detection
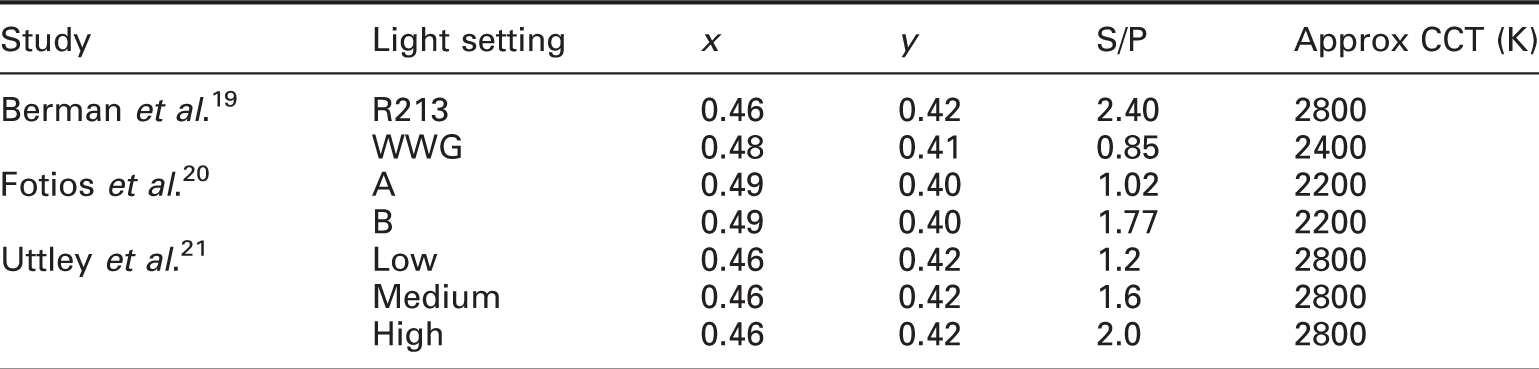
Note: Fotios et al and Uttley et al. derived lamp properties from SPDs measured from the observer's view of the test apparatus. Berman et al did not report S/P ratios: these were determined from the photopic and scotopic luminances reported in their Table 2.
While it is possible to vary S/P ratios whilst holding CCT approximately constant, previous comparisons of commonly used lamps suggest that this is not usually the case, and an increase in S/P ratio tends to demand an increase in CCT. In this paper, we report a further comparison of CCT and S/P ratio but using a much larger set of light source spectra and a wider range of light sources than have been considered in previous comparisons.
2. Data source
The analysis was carried out using the library of sample light source spectra included in IES Technical Memorandum TM-30-15. 22 These spectra were collated for a document associated with the colour rendering characteristics of light sources and not for the comparison of S/P ratios and CCT; they may, therefore, be considered as an unbiased data set for the current analysis. We have used the first 297 of the 318 spectra in the library, omitting the final 21 which are labelled as theoretical spectra. The light sources are categorised into different types, of which 55 are labelled fluorescent lamps (FL), 14 are high intensity discharge lamps (HID), 14 are incandescent lamps, 15 are hybrid LEDs, 64 are mixed LEDs, and 129 are phosphor LEDS. The CCTs of these spectra were reported in the TM-30-15 library. S/P ratios were not reported, and for the current analysis were determined by calculation. The spectra are reported at 1 nm intervals in the range of 380–780 nm.
The sources from where these spectra were gathered are described by Houser et al. 23 The library includes three types of LED (phosphor, mixed, and hybrid) according to the manner in which the narrow band spectra emitted by LEDs are manipulated to create white light. 24 Phosphor LEDs (also known as down-conversion phosphor) use a phosphor to convert short wavelength light to a broader distribution, in a similar manner to the phosphor coating of fluorescent lamps. Mixed LEDs take advantage of additive colour mixing of two or more types of LED chips of different colours. Hybrid LEDs employ both mixed LEDs and one or more phosphors.
3. Analysis
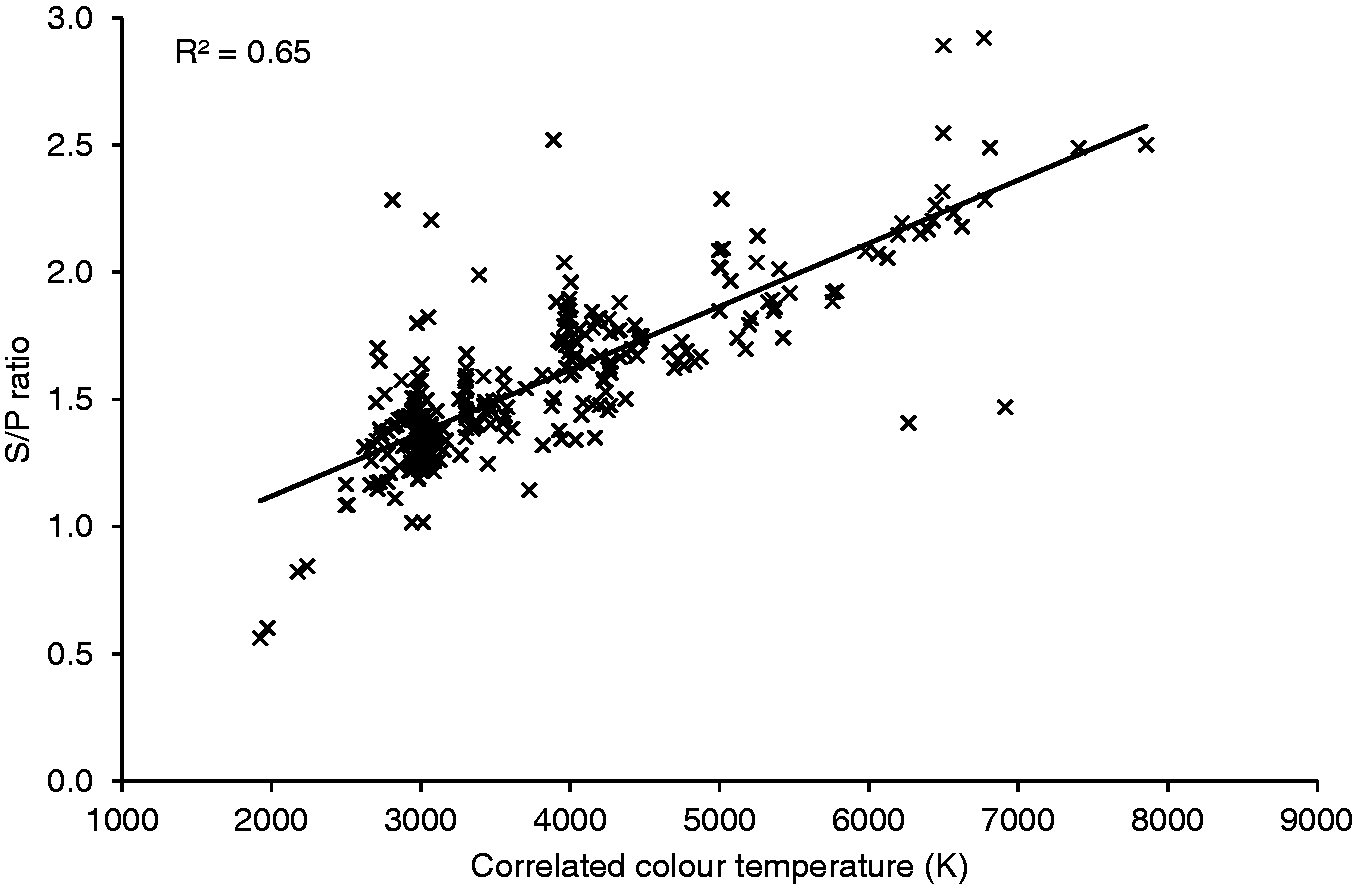
Figure 4 shows the S/P ratio plotted against the CCT for all 297 spectra. There is a reasonable degree of association (R2 = 0.65, n = 297, p < 0.001) but it is clear that some spectra do not follow the trend.
S/P ratio plotted against CCT for the 297 spectra included in the library of IES TM-30-15.
22
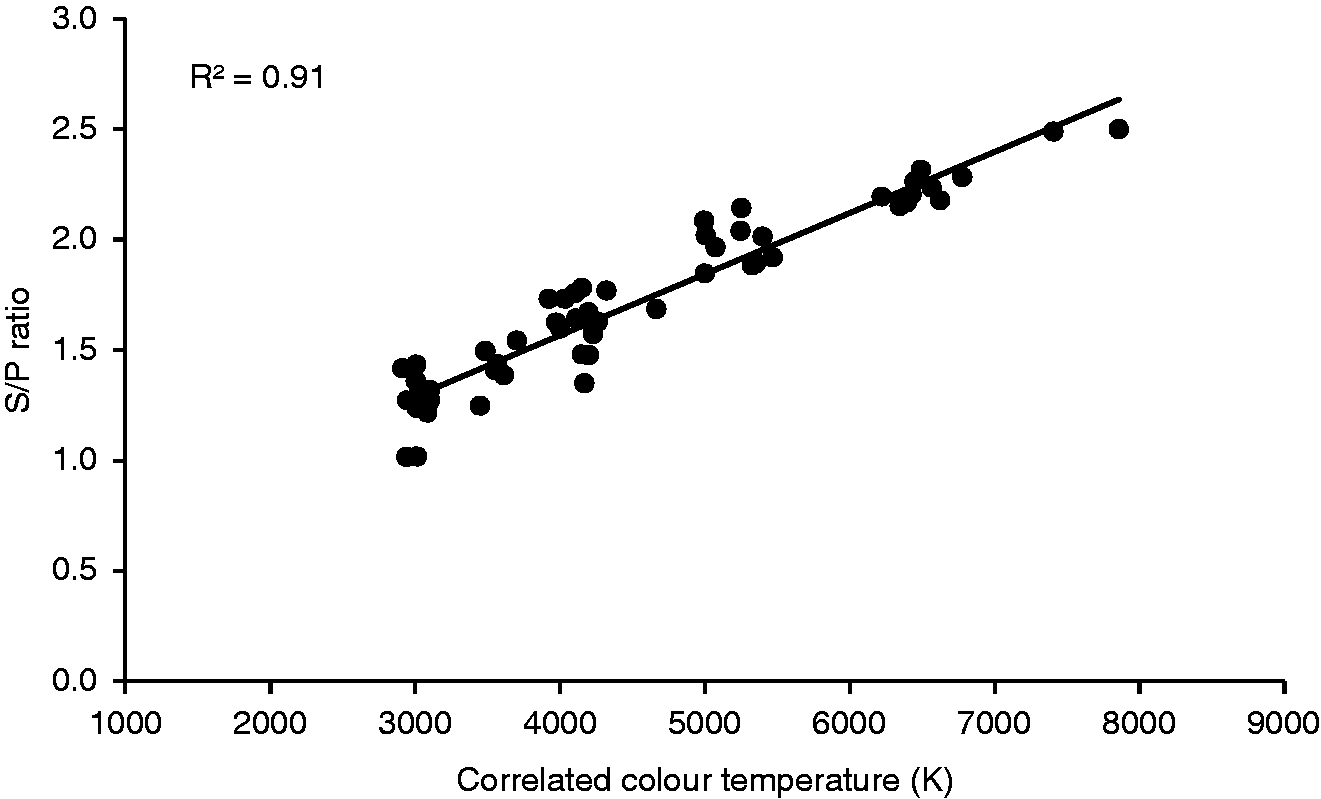
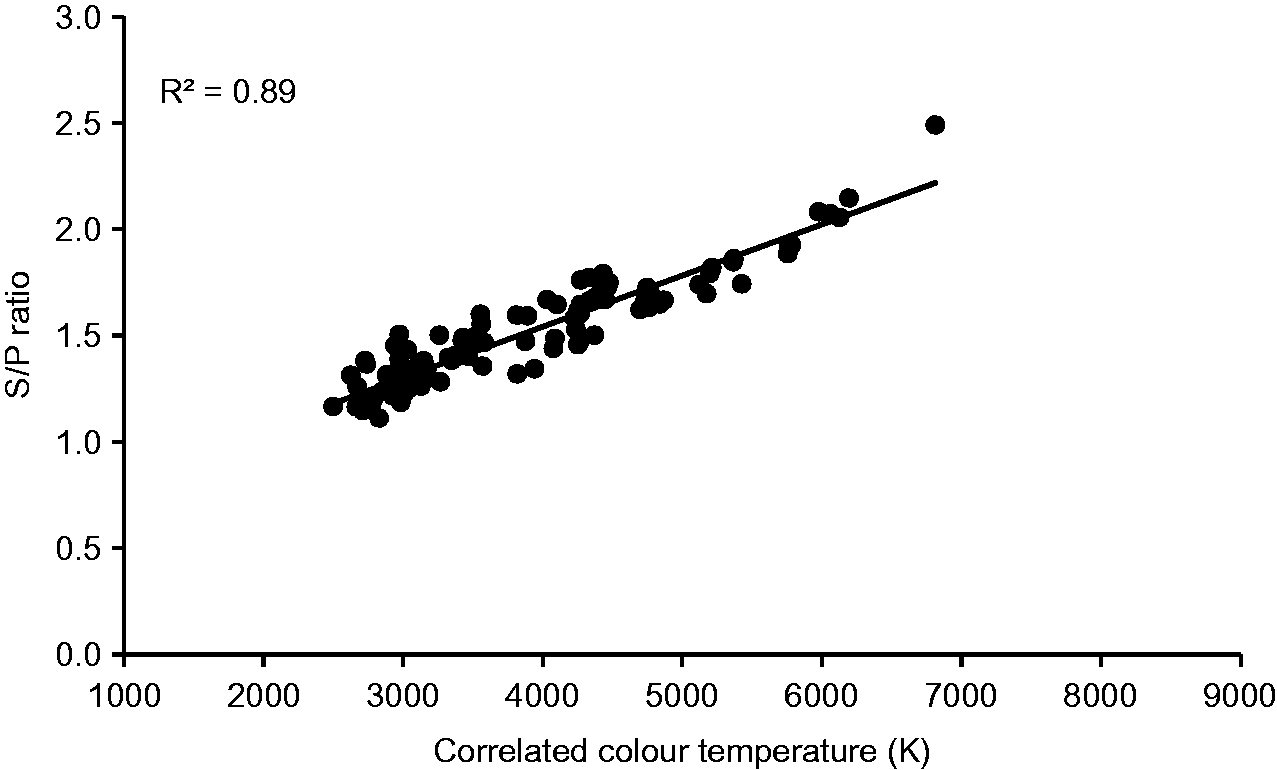
The source of variance was investigated by considering separately the different types of light source, and this was done following the light source names given in the TM-30-15 library. Figures 5 and 6 show florescent lamps and phosphor type LEDs. For these two types of light source, there is a strong association between S/P ratio and CCT (fluorescent, R2 = 0.91, n = 55, p < 0.001; phosphor LED R2 = 0.89, n = 129, p < 0.001).
S/P ratio plotted against CCT for the 55 fluorescent lamp spectra included in the library of IES TM-30-15
22
S/P ratio plotted against CCT for the 129 phosphor LED spectra included in the library of IES TM-30-15
22
Figures 7 and 8 show the data for mixed and hybrid LEDs, respectively. The association between CCT and S/P ratio for these spectra is also significant (mixed LED, R2 = 0.63, n = 64, p < 0.001; hybrid LED R2 = 0.66, n = 15, p < 0.001).
S/P ratio plotted against CCT for the 64 mixed LED spectra included in the library of IES TM-30-15
22
S/P ratio plotted against CCT for the 15 hybrid LED spectra included in the library of IES TM-30-15
22
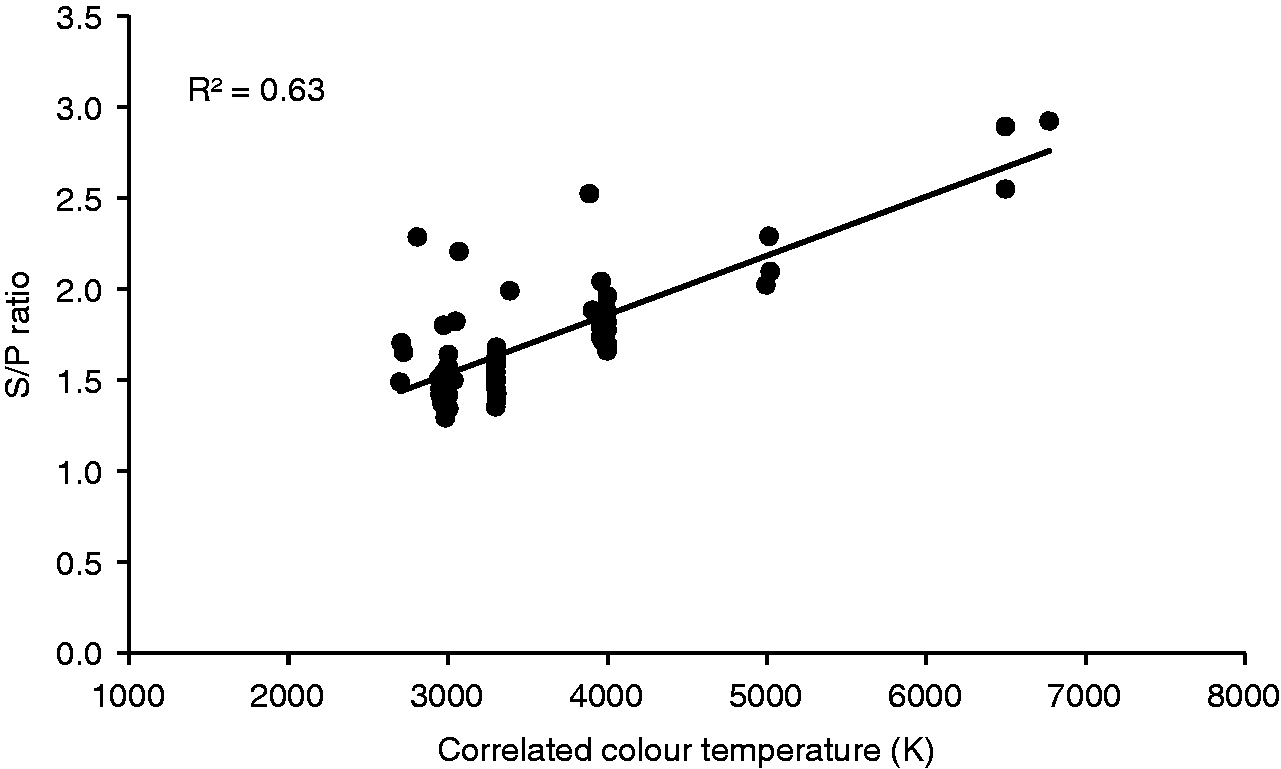
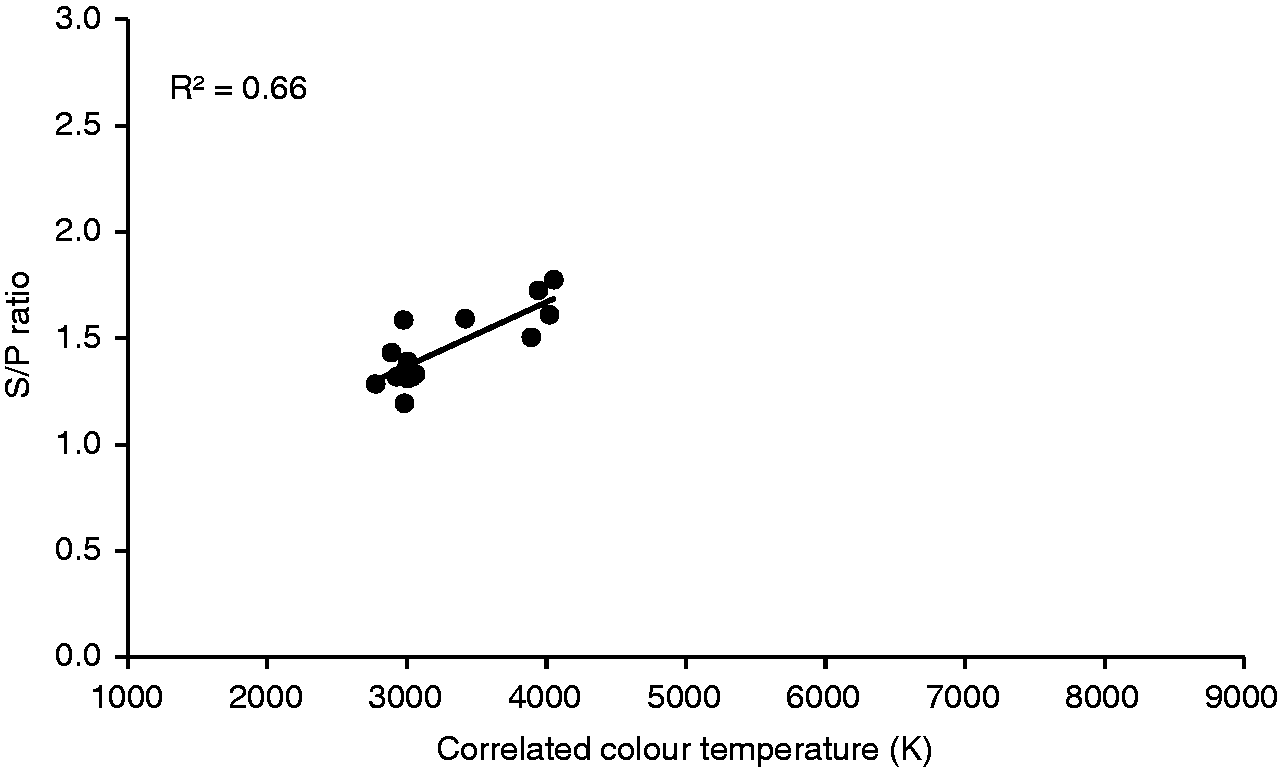
Figure 9 shows the 14 incandescent light sources from TM-30-15. There is strong association between S/P ratio and CCT (R2 = 0.80, n = 14, p < 0.001). There are three outliers in these data (a filtered halogen lamp, and two neodymium lamps, numbers 84, 88 and 89 in the library): if these are excluded the association slightly increases (R2 = 0.88, n = 11).
S/P ratio plotted against CCT for the 14 incandescent lamp spectra included in the library of IES TM-30-15
22
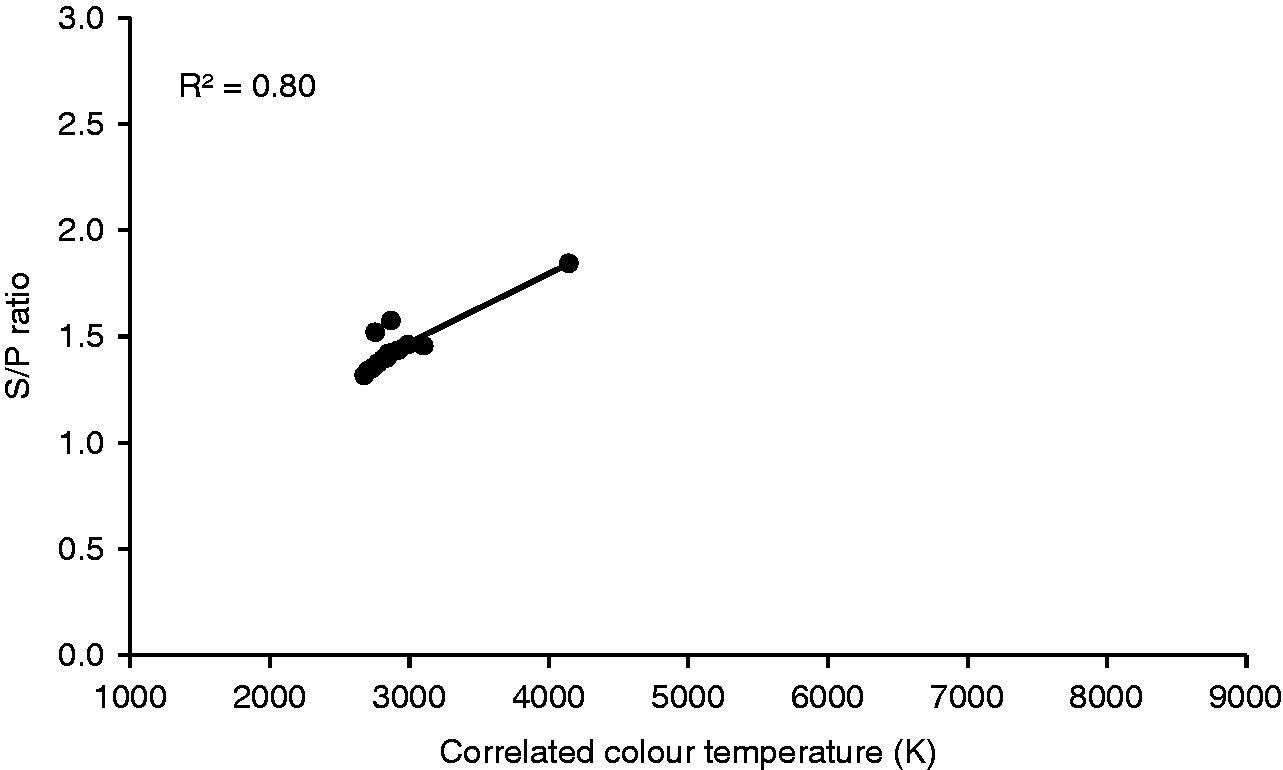
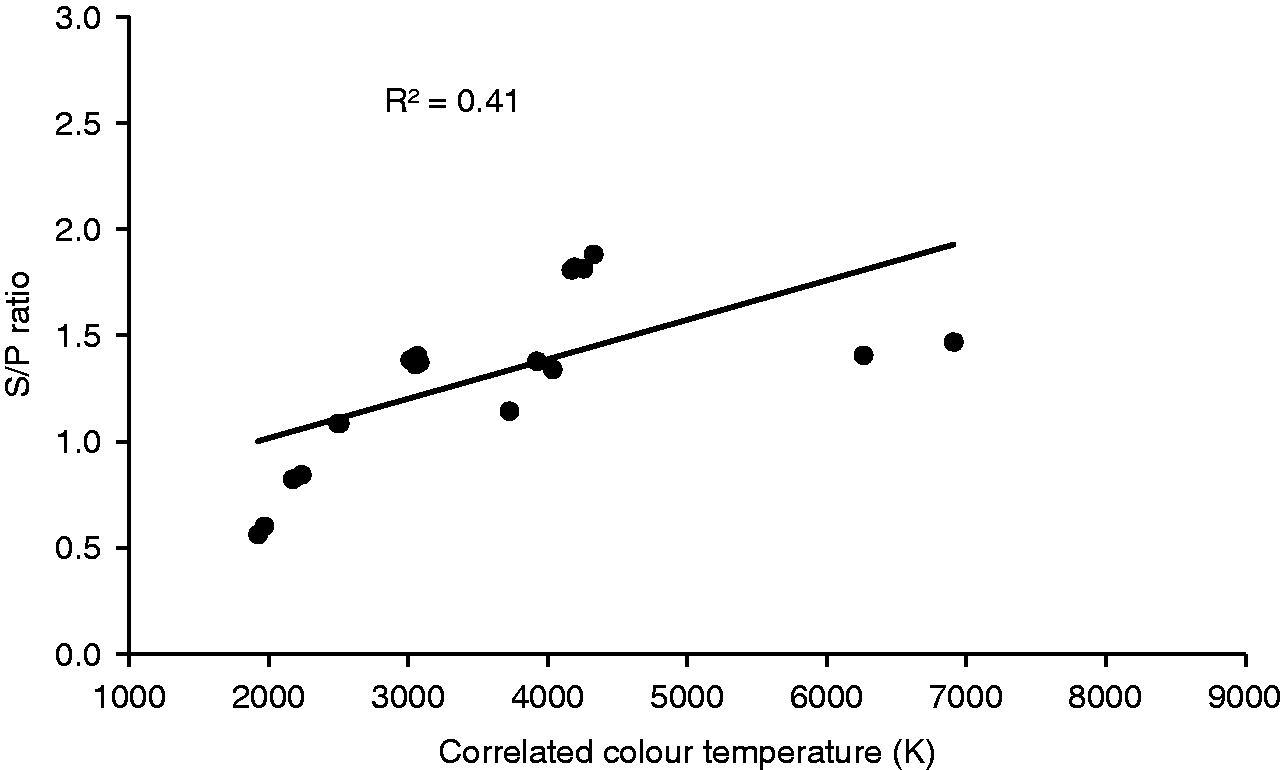
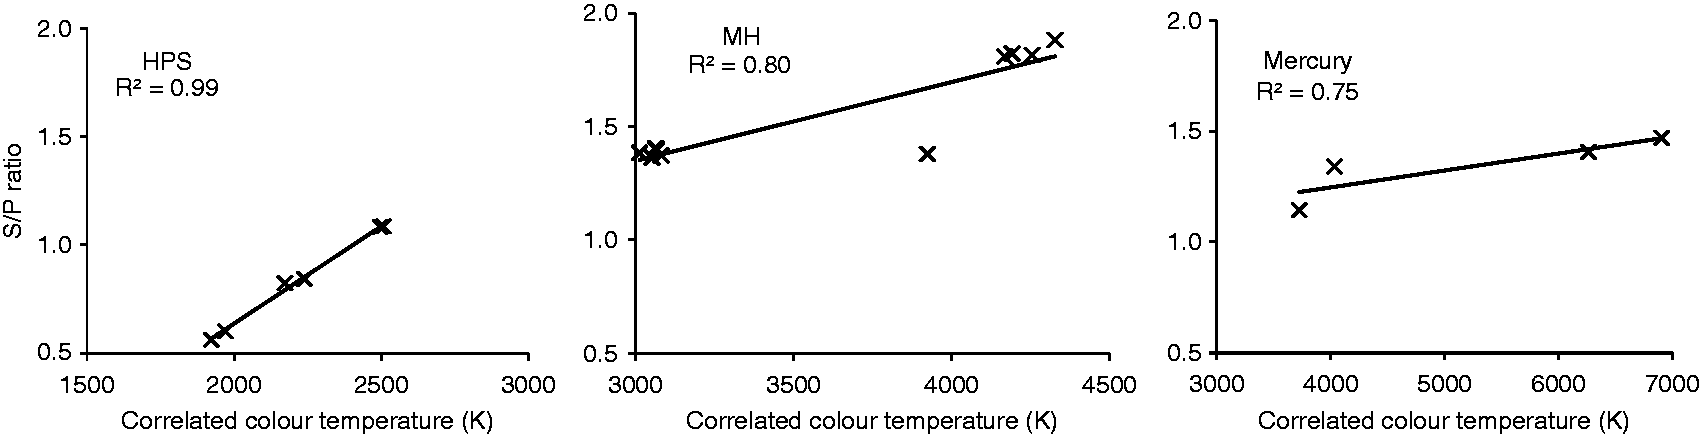
Figure 10 shows the 20 HID lamps from the TM-30-15 library. The association between S/P ratio and CCT is significant (R2 = 0.41, n = 20, p = 0.001) but the graph suggests a large degree of scatter. However, the HID category contains several different types of light source and further analysis by these subcategories of HID lamp shows a strong association between S/P ratio and CCT for two types as shown in Figure 11 (HPS, R2 = 0.99, n = 6, p < 0.001; Metal Halide R2 = 0.80, n = 10, p < 0.001) but not for one type (Mercury R2 = 0.75, n = 4, p = 0.068).
S/P ratio plotted against CCT for the 20 HID lamp spectra included in the library of IES TM-30-15
22
S/P ratio plotted against CCT for the three types of HID lamp spectra included in the library of IES TM-30-15: HPS (left), MH (centre) and Mercury (right)
22
When calculating S/P ratios for this analysis, the two-degree photopic observer was used. It is also possible to use a ten-degree photopic observer, and the two might lead to different S/P ratios for any spectra having significant emission in the short wavelength region. Figure 12 plots the S/P ratios for the 297 spectra calculated using the two-degree observer against those calculated using the ten-degree photopic observer. There is a high degree of association (r2 = 0.99, n = 297) and this is a good fit for all but one spectrum (#166, RGBA LED). For the range of spectra considered, this suggests the choice of photopic observer was of negligible importance.
Comparison of S/P ratios of the 297 spectra in the library of IES TM-30-15 when calculated with the two-degree and ten-degree photopic observers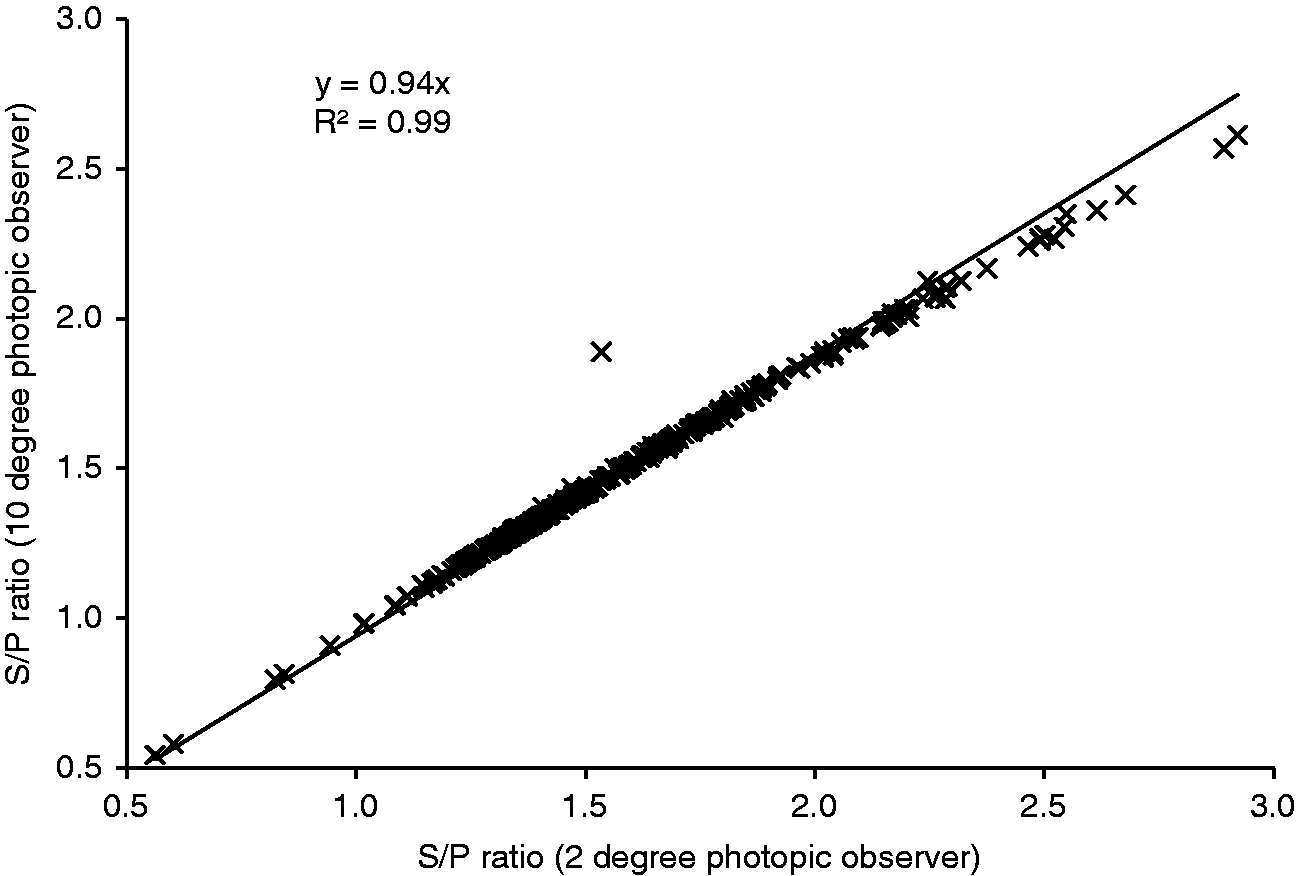
4. Summary
Examples of the range of S/P ratio found at a given CCT according to a sample of fluorescent lamps alone or across all lamp types
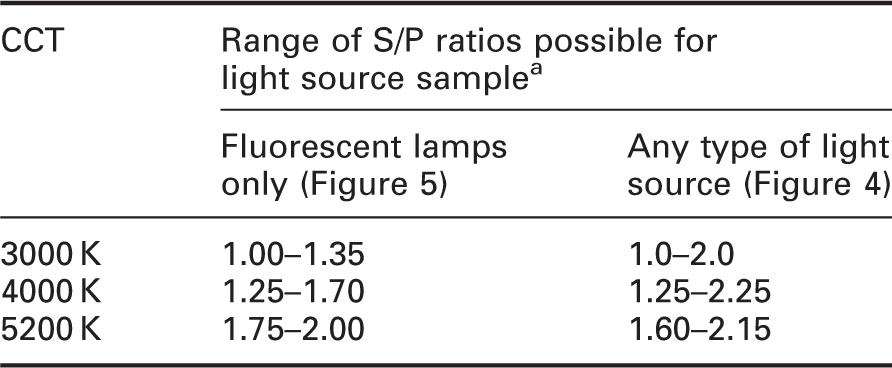
aThese are the approximate lower and upper S/P ratios for the given type(s) of light source at the given CCT.
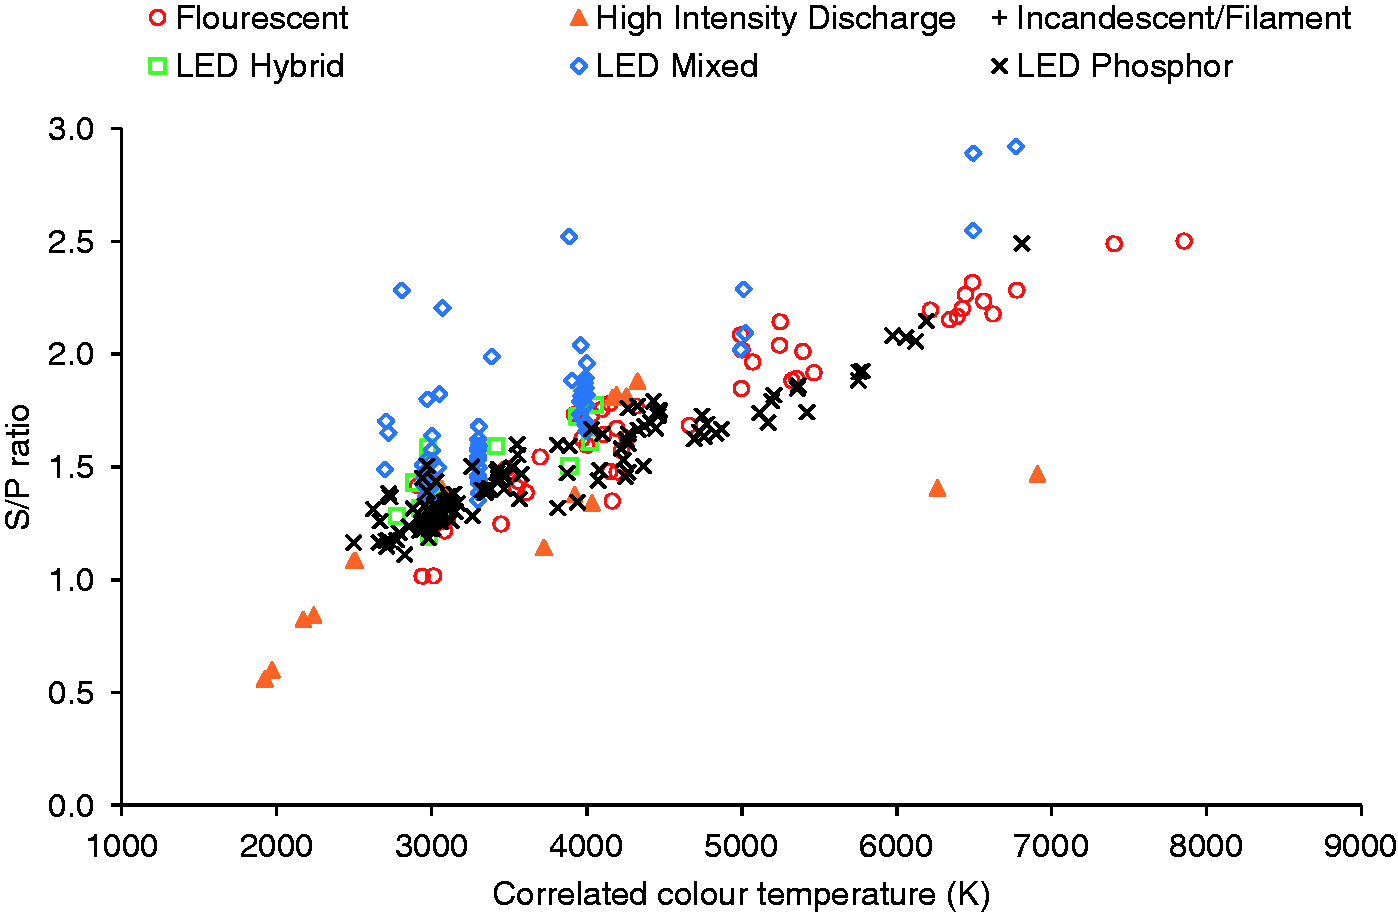
Figure 13 shows the same data as plotted in Figure 4 but with the different types of lamp separately identified. This shows that it is possible to extend the range of S/P ratios available at a given CCT, but that this requires choosing a different type of light source or LED (Table 2), or for manufacturers to give this association some consideration when selecting the spectra for new products. A change in light source type has implications for other design parameters such as optical control, maintenance, and costs, which means it is not a simple consideration. Note also that the future availability of new types of LED which use a different technology may, in turn, require them to be treated as a ‘new’ light source type in the context of this paper.
S/P ratio plotted against CCT for the 297 spectra included in the library of IES TM-30-15
22
Given the public reaction to white lighting, then it is useful to consider other routes by which the reaction may have arisen and may be remedied. When discharge lamps were introduced in the 1930s, it is reported that they ‘gave light of an unfamiliar colour which has strange and unflattering effects on personal appearance’ compared with the filament and gas lighting they replaced. 25 It thus appears that the public now desire to retain the light sources previously thought to be unfamiliar and unflattering. This suggests a reluctance to change rather than a reaction to the lighting, with colour appearance being the most prominent distinguishing feature of the change. In which case, better management of the change is needed rather than placing limits on the technology.
Footnotes
Declaration of conflicting interests
The authors declared no potential conflicts of interest with respect to the research, authorship, and/or publication of this article.
Funding
The authors disclosed receipt of the following financial support for the research, authorship, and/or publication of this article: This work was carried out with support from the Engineering and Physical Sciences Research Council (EPSRC) grant number EP/M02900X/1.