
Abstract
Small target visibility is widely used to evaluate the quality of road lighting. It provides a link between lighting design and driving performance. However, it is based on a strong simplification of the driving task using psychophysical data from laboratory conditions. Using a driving simulator to mimic the real driving environment, the impact of driving workload on target detection performance in mesopic vision conditions has been evaluated. The target visibility level is studied with and without driving workload together with different luminance contrasts and target positions, with reference to the small target visibility scenario. The results show that the driving workload significantly reduces the target detection performance. Consequently, the visibility level value for driving conditions should be much higher (visibility level ≥21) than some currently recommended ones (visibility level = 7) to achieve the same detection rates. Effects of target position and contrast are found in a way consistent with the literature. In addition, results indicate that the small target visibility model used for road lighting is limited and needs to be improved for a reliable prediction of visual performance with driving workload.
1. Introduction
The purpose of road lighting is to create a good visual environment for vehicle drivers and pedestrians. Although the relation between road lighting and road safety is not direct, an overview of field studies made by the Commission Internationale de l’Éclairage (CIE) showed a positive correlation between road lighting quality and road safety 1 with the restriction that a bad design may be even worse than no lighting at all.2,3
The main quality indices in road lighting are related to the concept of visual performance, 4 which are derived from psychophysical studies. Most night-driving accidents are caused by low visual performance, such as the inability of drivers to detect and recognize obstacles at an early stage. 5 Lighting installations should be optimized to ensure drivers can detect obstacles at any point of the road surface and respond properly. Generally, the detection threshold is used to describe visual performance in the experiment. In order to obtain the detection threshold, the CIE proposed a methodology that proceeds through a detailed analysis of the visual task, 6 without taking into account the nonvisual aspects of the task, such as driving workload. The visual task is split into several subtasks, such as ocular fixations, saccadic motions, and the cognitive part of vision, and each subtask is given a specific weight.
Thus far, visual performance has been mainly studied with a small amount of driving workload or it was not related to actual driving behaviour for lighting application. Widely used models such as Rea and Ouelette’s relative visual performance (RVP) model 7 and Adrian’s empirical target visibility level (VL) model 8 have not considered the influence of driving workload either. Both models were based on a set of psychophysical data obtained with simplified conditions, not closely related to the real environment. Meanwhile, the influence of workload has been confirmed in many studies. Hurden et al. 9 proposed that the experiment should be combined with the actual visual working environment. He used search time (ST) to evaluate visual performance in mesopic vision. But the search task he used was not related to actual driving. Mayeur et al.5,10 used a night-driving video to create a driving scene and commented that the spatial context and the apparent motion had a negative impact on peripheral target detection performance. They also found there was a significant difference between passenger and driver status on target detection performances. Patten et al. 11 showed an interesting aspect of the reaction time (RT) for a peripheral detection task. The low mileage drivers’ RT performance did not significantly differ when comparing between the medium and the high traffic environment. The high mileage drivers’ performance did, however, noticeably deteriorate from the medium to the high traffic environment complexity. Brémond et al. 12 used a driving simulator comprised of a steering wheel with force feedback, a gear box and pedals, but no motion system. The software served to run the simulator and to graphically render the virtual environment. They confirmed that the VL threshold (VL = 7) was only relevant for a very simple driving task. They introduced a detection distance index based on the stopping distance, which allows setting the required visual performance in relation to road and vehicle parameters.
Other than workload, factors such as target location have shown an interesting effect on visual performance. Earlier research by Bullough 13 suggested the tracking task location had little impact on RT for the closest targets, but for the more distant and off-axis targets the location of the tracking task did affect RT and missed targets. Lingard and Rea 14 found off-axis detection rate (DR) increased and off-axis RT decreased with increasing background luminance and target contrast. And both of them only changed significantly at the outermost target location. Akashi and Rea 15 designed a difficult off-axis identification task with a flashing target and found that the RTs for the 15-degree target are shorter than that for the 23-degree target. Gibbons et al. 16 found that at a low adaptation luminance, the detection distances decreased with increasing offset from the travel lane as expected. However, at higher adaptation luminances, the relationship between offset and detection distance changed and was less clear and more varied.
Given the above, some of these studies were carried out in the actual field and some in the simulated study. Thanks to the development of computer technology, increasingly more studies make use of a driving simulator as an experimental platform, since the driving simulator provides a more flexible and controllable experimental environment. However, the scene was often too simple and difficult to reflect the actual influence of driving task and environment. For example, one study only contained a one-lane road with some curves and there were almost no other background objects beside the road, 17 or in another study the participants were not allowed to control the car. 5 The scene which Brémond et al. 12 used was much better but it was still a rural road with a very simple driving task. Experimental parameters and conditions that represent more complex situations deserve further study. In addition, the experiments of Alferdinck 17 and Brémond et al. 12 were too complicated and expensive, while that of Mayeur et al.5,10 lacked driving behaviour.
In order to mimic a more realistic and practical experimental environment and investigate the impact of workload on visual performance during night-time driving conditions, we designed an experimental study using a game engine in which visual performance was evaluated with the well-established method described in the next sections.
2. Visibility evaluation methods
The visual performance of night-time driving can be divided into three visual subtasks characterized by the questions: ‘Can it be seen’, ‘How quickly’ and ‘What is it’. 18 ‘Can it be seen’ is determined by the detection threshold, which means the observers could become aware of objects in their visual field. ‘How quickly’ is determined by RT. RTs play an important role for safe driving in night-time driving conditions. ‘What is it’ is determined by recognition and identification of the target. The first two questions are concerned to measure the VL. In addition, one could also ask ‘where is it going’ as a brief summary to describe the whole changing process of visual performance. Most of the studies reported in literature that measure VL use the following two methodologies: (1) field study and (2) simulated study.
In the field study, subjects are asked to drive on a closed-road circuit under night-time conditions and detect targets along the road at the same time. This type of study commonly uses the peripheral detection time (PDT) to study the effects of various factors on drivers. The PDT has been used in several fields and has been proven to be a sensitive measure of cognitive workload, especially where visual demand is high such as in driving.19,20 Usually, three parameters are measured to describe visibility in these studies: detection distance, RT and miss rate. Akashi et al. 21 designed an experiment to create a realistic scenario where the driver of a car must decide a course of action based upon detection and interpretation of movement. The Enhanced Night Visibility Project 22 conducted a series of studies to find out the relationship between road visibility and many factors such as lighting condition, object characterization, weather and age using the Smart Road. Mayeur et al. 23 designed a field experiment to investigate target detection performances, comparing driver and passenger status conditions in order to specify the driver’s visibility needs in a way consistent with state-of-the-art lighting engineering practice. Gibbons et al. 16 designed a mixed-factors experiment to measure the effect of age, overhead lighting type, adaptation luminance, vehicle speed, visual angle and pedestrian position on pedestrian detection distances. All of them measured the detection distance to find the relationship between factors and visibility, and Mayeur et al. 23 further compared the result with VL value. 24 Bullough 13 designed an LED tracking task to explore the role of headlamp luminous intensity and observer viewing location on forward visibility. Patten et al. 11 investigated the driver experience and the cognitive workload in various traffic environments. They used three levels of route complexity: high demands on information processing/high demands on vehicle handling (HH complexity), low demands on information processing/low demands on vehicle handling (LL complexity) and the medium complexity (HL or LH complexity). Bullough 13 and Patten et al. 11 used peripheral detection RTs and peripheral detection miss rate to study the effect of workload and target position on visibility. In general, the advantage of a field study is that it can obtain more accurate parameters and better reflect the night-driving condition. On the other hand, it has three substantial drawbacks. Firstly, the experimental condition is too complicated to build and lacks generality. Secondly, many cases are not suitable for field study due to safety considerations. Thirdly, changes in drivers such as trip motivations or behaviours and the chrono-biological effect have a clear influence in a field study.
In a simulated study, subjects are asked to complete a target detection task under a limited set of well-defined conditions. According to the correlation between experiment design and night-driving condition, the simulated study methodology can be divided into two ranks: with or without driving related workload. Existing visual performance models or visibility models basically do not contain driving behaviour. Rea and Ouelette proposed the RVP model 7 based on the results of two experiments – a flashed target detection task and a numerical verification task. Adrian’s empirical target VL model 8 is based on a set of psychophysical data obtained from simplified conditions. Hurden et al. 9 designed a target search task – detecting a target (a modified Landolt C) surrounded by 48 distractor elements (circles) with different photometric characteristics and established a search time model. In recent years, many researchers have tried to add driving related workload to the experimental design. Bullough and Rea 25 employed a computer-controlled driving simulator apparatus and instructed subjects to play simulated race courses while detecting the peripheral target. In this way, they measured simulated driving performance under mesopic and low photopic light levels, using several spectral power distributions. Lingard and Rea 14 designed a driving simulator apparatus including a driving task. Two computers were used, one for driving task projection, the other one for target control and data collection. Alferdinck 17 performed an experiment in a high-fidelity driving simulator consisting of a fully equipped car body on a moving base and a 120 × 30-degree projection screen. They measured RT and missed targets to study the effect of background luminance, eccentricity, colour and speed on target detection. Mayeur et al.5,10 designed a series of experiments which included the simple control task, background complexity and apparent motion in the experimental design. They replaced the uniform background with still images of a night-time road scene and put targets into a video recorded in an urban area at night to simulate driving scene. Brémond et al. 12 built a virtual night-time rural highway environment using a driving simulator to study the relationship between detection distance and target VL.
Compared to the field study, the simulated study can simulate real life under controlled conditions. The experiment can be designed for any condition that needs to be examined, such as targets appearing on the road randomly. In the field study, targets cannot appear in the middle of the road due to safety factors, but this can be achieved by projection scenarios in a simulated study. However, people may behave in a different way because a simulated study undermines the face-validity, because the task is being done in a different context. 26 For example, the parameters such as visual angle presented in the simulator may be different from field measured parameters and the impact of collisions in a simulator are less impactful compared to real situations. While these two methodologies are very different, they are interdependent. The results of simulated study could be the guide for a field study and the field study could further verify the reliability of the simulated study.
3. Visual performance models
To quantify lighting quality, the link between the driver’s perception and the technical lighting system is operationalized by photometry. This includes the use of psychophysical models of human visual performance in order to select the relevant parameters (contrast, brightness, illumination) and to fix the required performance levels (thresholds). The small target visibility (STV) model and RVP model are two widely used visual performance models.
The STV model is the main model used to assess the lighting quality of road lighting installations. It uses a reference scenario related to the road lighting purpose: to enhance visibility of unexpected objects on the road. In detail, road lighting should allow the driver’s detection of a 50% reflectance square target of 0.18 m height at 83 m within 0.2 s. Based on the study of Adrian, 8 the VL is the most popular theoretical model used to describe STV. It is proposed as a quality index in the American standard 27 and French standard, 28 but not in the European standard. 29 The American standard 27 provides minimal VL values for various road categories under STV criteria. However, the model uses psychophysical data from laboratory conditions, 30 in foveal vision, for uniform targets up to 1° of visual angle. Its main hypothesis is that the accident rate is lower at night if the lighting system is optimized for the visibility of objects on the road: road lighting reveals objects before automotive lighting can do and improves anticipation. The STV model may be applied to road visibility using a standard scenario, considering how well a small target on the road can be detected by a driver, at a distance where the driver uses to pick up information.
The ratio between the actual contrast of a target and its threshold contrast is defined as the VL value in the model. The actual contrast is the luminance difference between the target and its background for the real road conditions and the threshold contrast is the luminance difference needed for minimal visibility, between a target of certain angular size and its background. According to Adrian’s theory, the threshold contrast is computed with following factors: luminous flux function, luminance function, contrast polarity factor, size and background luminance factor, exposure time and age factors.
Adrian’s proposal implies to set a specific VL threshold for a visual detection task, and this threshold leads to a reference illumination level for road lighting. Some authors have used the VL value to compute target visibility, either for road lighting 31 or automobile lighting.32,33 VL was set to 7 as a threshold in the French recommendations for road lighting. This means that the target’s luminance contrast is seven times the contrast needed for object detection in laboratory conditions. However, with various field factors been proposed so far, the VL value ranges from 2 to 30,8,27,28,31,34 for example, Adrian and Stemprok,35,36 suggest that a VL of 4 would account for driver unexpectedness and just allows target detection (without identification). This non-standardized situation shows a lack of consensus and makes the model hard to be used for practical applications.
Many methods have been proposed in the literature, but actual practice and recommendations broadly stand on experts’ agreements rather than on scientific models. 37 This is mostly because Adrian’s model is based on a strong simplification of the actual driving task. It uses data from a single psychophysical task which is only one among the many subtasks of driving. For the development of the VL model, the psychophysical experiments did not take the driving task into account, which involves vehicle control activities and information processing. Other factors such as speed, traffic and task demand would also impact the detection of driver at the same VL level. Another limitation of STV model is it focuses on foveal detection without considering peripheral detection. Besides, the performance criteria based upon detection threshold has a common problem – it does not consider the suprathreshold visibility. 38 The value of 100% performance is a limiting one. In threshold performance measures, no improvement in goodness of seeing beyond this point is often assumed. For this reason, we cannot assess differences in visibility beyond this 100% performance level, which indicate that constant VL values do not imply constant levels of suprathreshold visual performance.39,40
Another visual performance model, the RVP model, is a broadly applicable model of visual performance that can be taken as a reasonable measure of foveal visibility for luminance in the mesopic and photopic ranges. 41 Different from the VL model, it provides a method for determining the speed and accuracy with which suprathreshold visual information can be processed. The model includes several relevant parameters: the size of the target, the background luminance, the luminance contrast, and the age of the observer. Generally, an RVP value ≥0.9 is assumed to represent excellent visibility.
4. Research questions
For our study, we would like to use the Adrian model and test the impact of eccentricity and workload on the VL. A two-condition (static and dynamic) detection task was designed to study the influence of driving workload. Both conditions included a target detection task, the only difference was subjects needed to drive a car in the dynamic condition and that a snapshot of the scene was shown for the static condition. Six contrast levels and three target positions were used, while the other factors were set as close as possible to the international standard and reference STV scenario.
5. Experiment
5.1. Simulation system
For the evaluation of the VL with different driving workloads, a driving simulator was built using the driving game – Euro Truck Simulator 2. It provided a more realistic driving environment at night, including street lights and surrounding scenery. Using existing driving games can reduce costs and make it more convenient to experiment.
Figure 1 shows the schematic layout of the simulation system. Two projectors (NEC:NP-M332XS+) were used to overlay the targets on the background images (video or snapshot) on one projection screen. The projector resolution was 1024 × 768, with a refresh rate of 60 Hz. The screen was 2.69 m in width and 1.6 m in height. The steering wheel and engine pedal were used to control the driving direction and start the car. The response pedal connected to the target computer was used to record data. A luminance meter (CA-2000) was set to measure the luminance of road and targets. An E-Prime program was designed to synchronize the target computer and the response pedal. The time of target’s appearance and pedal responses were recorded with a computer program. In this way, the RT could be calculated accurately.
Schematic layout of experimental setup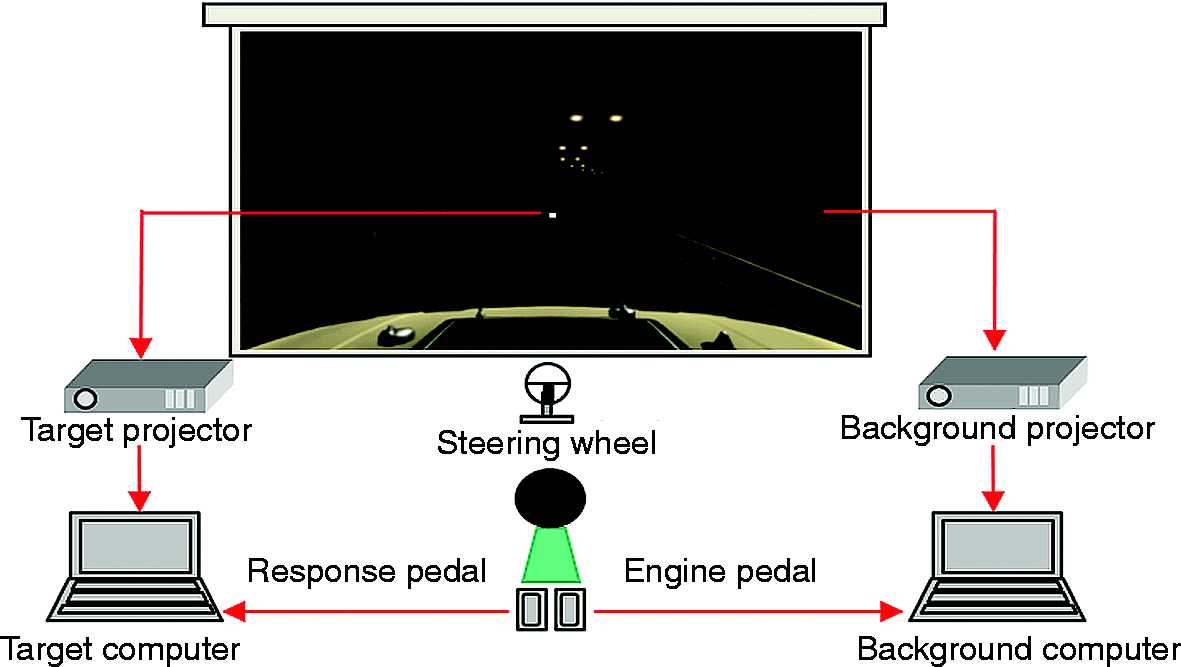
5.2. Experimental design
The purpose of this study was to evaluate the impact of driving workload on target detection performance under mesopic conditions. The dependent variables in the study were RT and DR, which are usually evaluated in simulation studies. They were collected at different workload (two levels), target position (three locations) and luminance contrast of the targets (six levels). The luminance contrast was defined as the Weber fraction
Two conditions were designed to study the influence of the driving workload: a static condition and a dynamic condition. In the static condition, the background was a snapshot of the video environment (Figure 2). In the dynamic condition, subjects were asked to drive in the night-time environment while detecting targets. Subjects could freely explore the environment. They were asked to press the response pedal as quickly as possible if they saw the target on the road. The aim of the dynamic condition was to replicate the actual driving condition as closely as possible. The subjects were requested just to complete the detection task without driving in the static condition. The impact of the driving workload on the detection task can be quantified by comparing these two conditions.
Snapshot of street images at night extracted from the game engine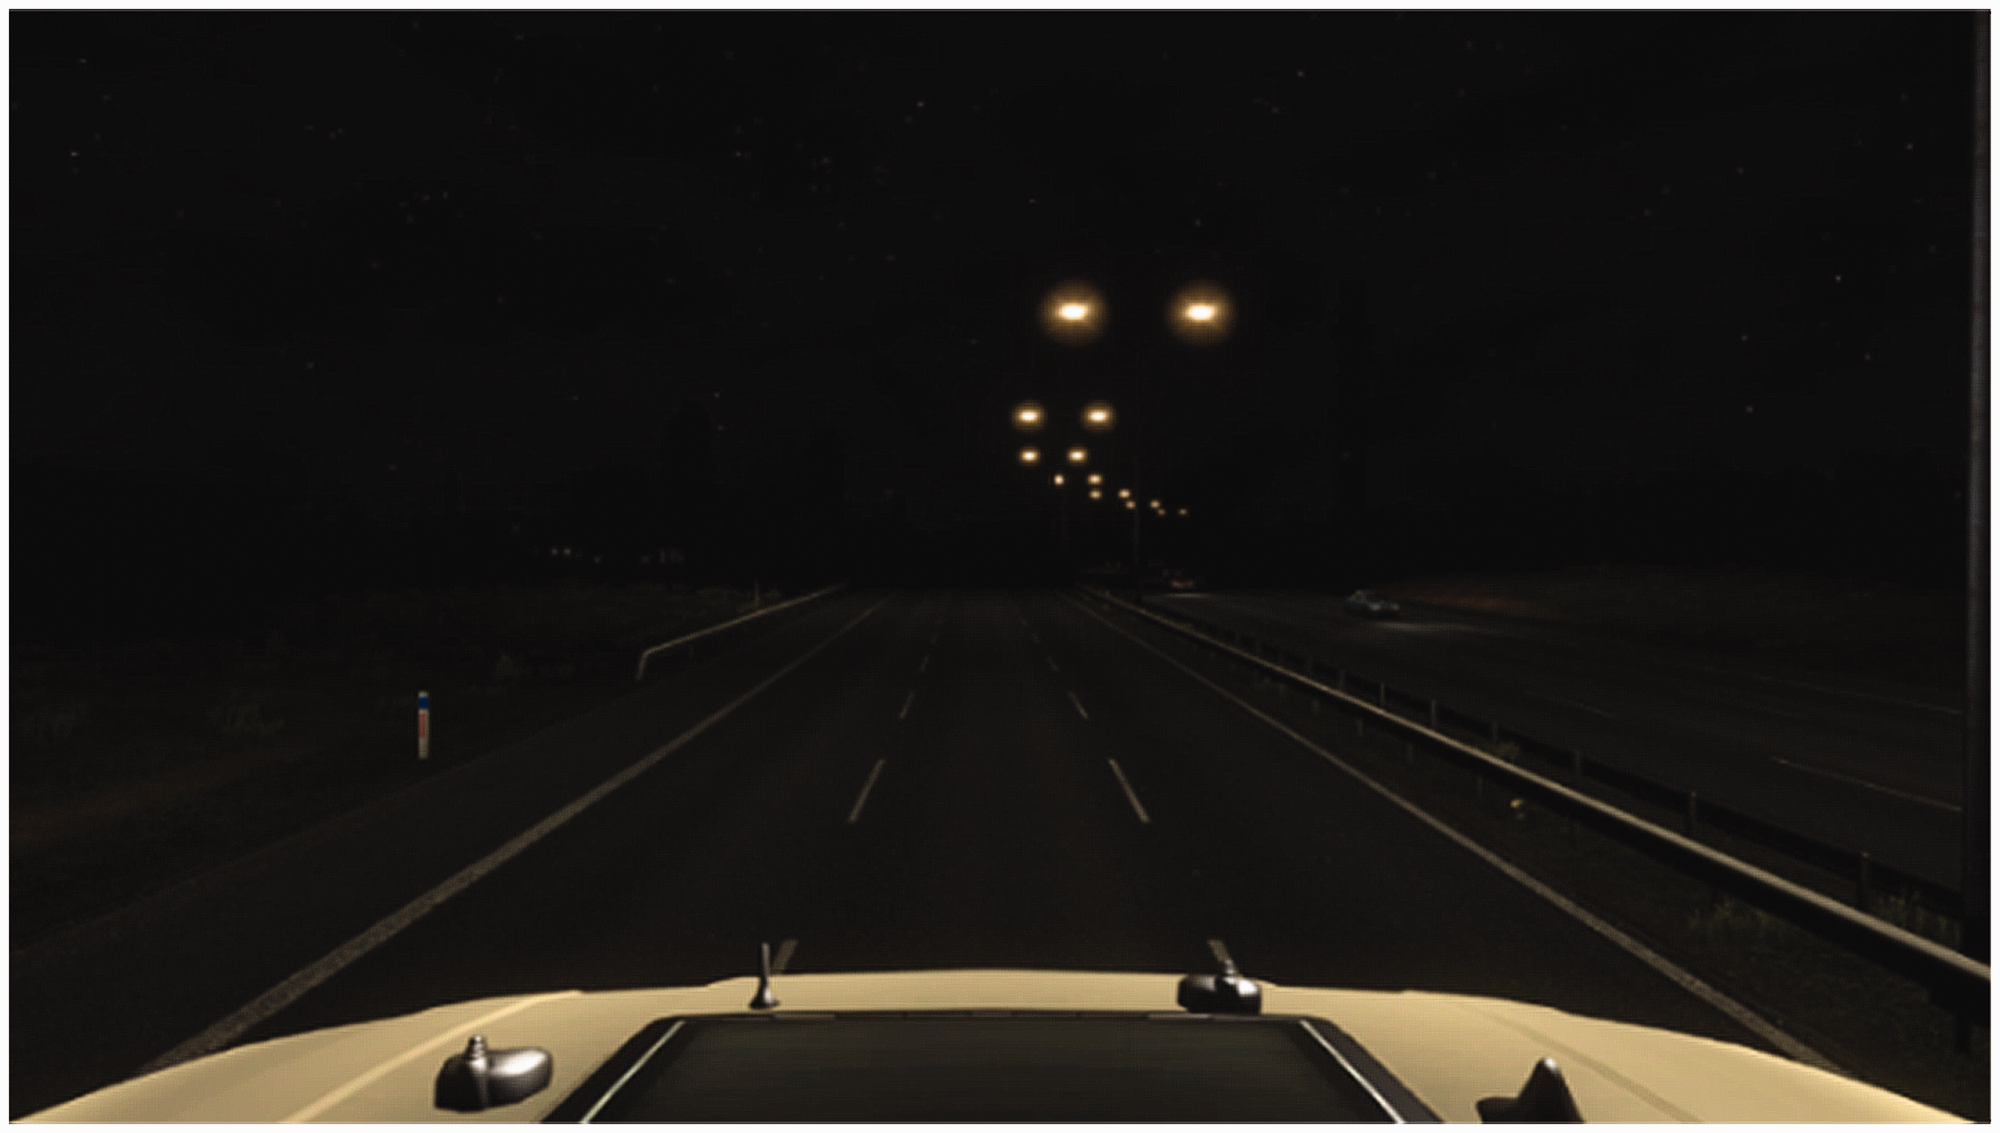
The luminance contrasts between the targets and the near background were nearly the same in the two conditions. The luminance of the road on the screen was obtained by the average luminance of nine points within the target appearance range. The average luminance was 1.0 cd/m2 (mesopic range), with maximum luminance being 1.02 cd/m2 and the minimum luminance being 0.94 cd/m2, which is consistent with road lighting recommendations (e.g. between 0.5 and 1.5 cd/m2). Six contrast values ranging from 0.1 to 3.2 (0.1, 0.2, 0.4, 0.8, 1.6 and 3.2) were used in this experiment, based on the results of a pilot study. The experimental setup with two projectors only allowed positive target contrasts.
A 20-cm uniform square was used as the target according to the American standard. 27 The visual angle of the target was 0.38° at about 30 m in front of the car in the road environment and 0.22° on the screen. Three positions of target (left, middle and right) were defined according to the three vehicle lanes. Targets were positioned in the middle of each vehicle lane and did not move with road environment. In all conditions, a target appeared for 1.2 s. For each condition (static and dynamic), 144 stimuli (6 contrasts × 3 position × 8 repetitions) were presented randomly to each subject. The interval between the stimuli was randomly chosen between 2 s and 4 s.
The speed of the car was set to a fixed value which is suitable for driving. The targets were controlled to appear only in the straight area on any of three lanes by E-Prime to ensure the consistency of background luminance. During the experiment, the program recorded the task performance (number of correct and wrong responses) from the pedal responses. Correct responses were defined as responses occurring with a RT between 200 ms and 1000 ms after stimulus presentation.
We conducted the experiment in a room under controlled photometry. The ceiling and the wall of the experimental room were painted with matte black paint and the floor was covered with black cloth to avoid the effects of surface reflections. The seat could be adjusted to compensate for the height of participants. Participants sat at 2.2 m away from the middle of the screen. The angular field of view of the screen was 40° in height and 65° in width. Two sessions are included in the experiment corresponding to the static condition and dynamic condition. A within-subject experiment was designed, i.e. all participants evaluated all stimuli.
5.3. Participants
Thirteen participants, including four females and nine males with a mean age of 24.5 years (SD = 1.1), took part in the experiment. The observers were mostly students of the School of Electronic Science and Engineering of the Southeast University in Nanjing (China). All participants had normal or correct-to-normal vision. They were all licensed drivers and had experience of driving at night.
5.4. Procedure
Before the experiment, there was a 5-minute adaptation period to the mesopic condition (1.0 cd/m2 on the display screen) and a short training period for participants to make them familiar with the procedure and using the response pedal. In the dynamic condition, the participants were asked to have an additional driving training session of at least 10 minutes until they could drive with the steering wheel skilfully.
The static condition and dynamic condition were carried out separately. Considering the experiment time, the dynamic condition session was divided into two sub-sessions corresponding to the contrast. The order of sub-sessions was randomized and there was a 5-minute rest period between the sub-sessions. Each sub-session lasted about 15 minutes. In total, the dynamic condition session lasted about 50 minutes and the static condition session lasted about 30 minutes per participant.
6. Results
The DR and RT were calculated to determine the VL. The DR is defined as the ratio of correct responses (under the condition 200 ms ≤ RT ≤ 1000 ms) over all responses. It is calculated with the average over the eight repetitions, per participant, in each condition. The RT is computed for the correctly detected targets. The DR reflects whether the target can be seen, and the RT reflects how quickly subjects detect the target. The VL can be evaluated by these two factors.
The DR (% correct detection) is shown in Figure 3(a) for the static condition and 3(b) for the dynamic condition. Figure 3 shows that the DR increases with increasing contrast in both conditions and approaches the 100% DR for both conditions. This is in consistent with the ‘plateau and escarpment’ characteristic of visual performance mentioned by Rea et al.
41
It means once the luminance contrast is sufficiently high, further increases in luminance contrast will not substantially increase visual performance. Furthermore, when comparing Figure 3(a) with Figure 3(b), the DR in the dynamic condition is lower than that in the static condition before approaching the asymptote. This indicates that the driving workload indeed has an impact on the DR and it is worthwhile including the driving workload in the VL study in mesopic vision for the road lighting application. In addition, the results also suggest that our experimental platform based on the driving simulator seems to be appropriate for investigating the influence of driving workload.
Mean detection rate plotted against contrast for each condition: (a) static condition and (b) dynamic condition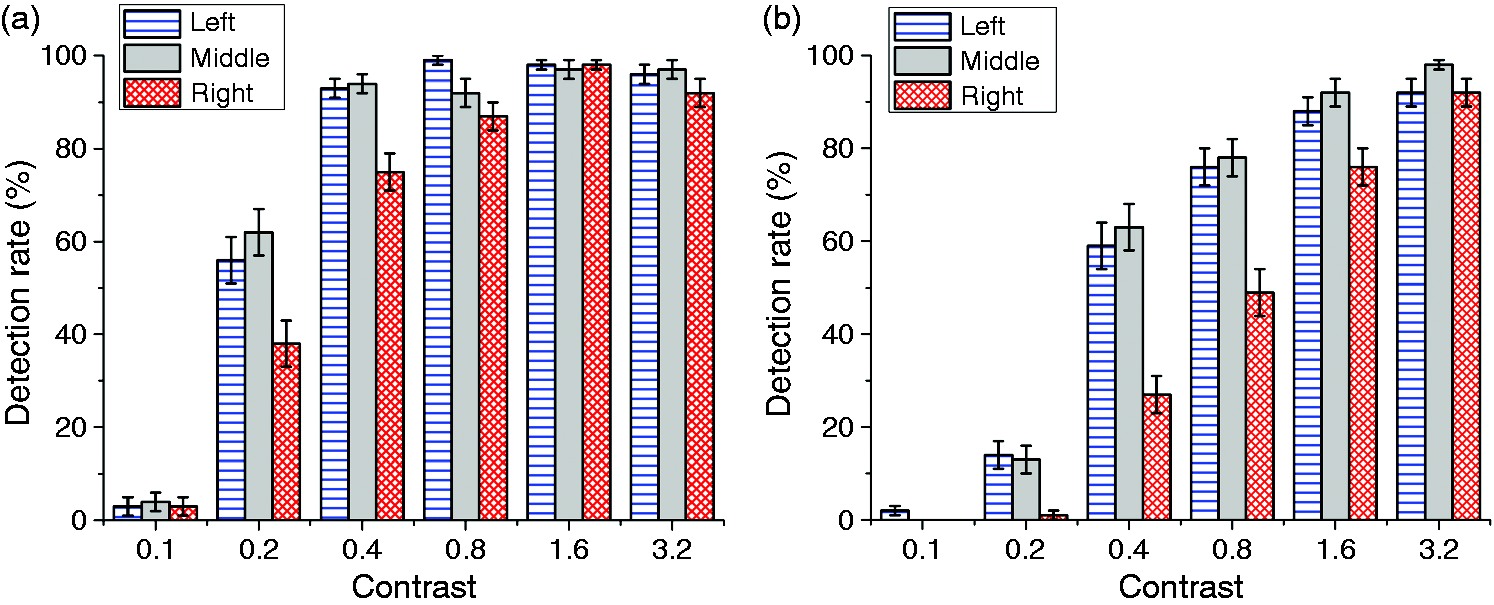
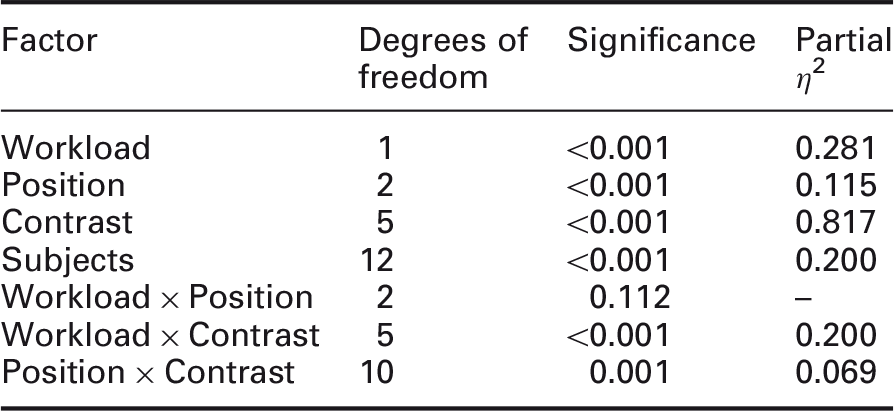
ANOVA results for the detection rate
The interaction of DR is shown in Figure 4(a) for the interaction between contrast and workload and 4(b) for the interaction between contrast and position. The interaction between contrast and workload is related to the difference in the increase in DR as a function of contrast in the static condition compared to the dynamic condition. The interaction between contrast and position is determined by a different behaviour for the right lane, for which the contrast is influenced by the street lights in the dynamic environment.
Interaction of mean detection rate: (a) between contrast and workload and (b) between contrast and position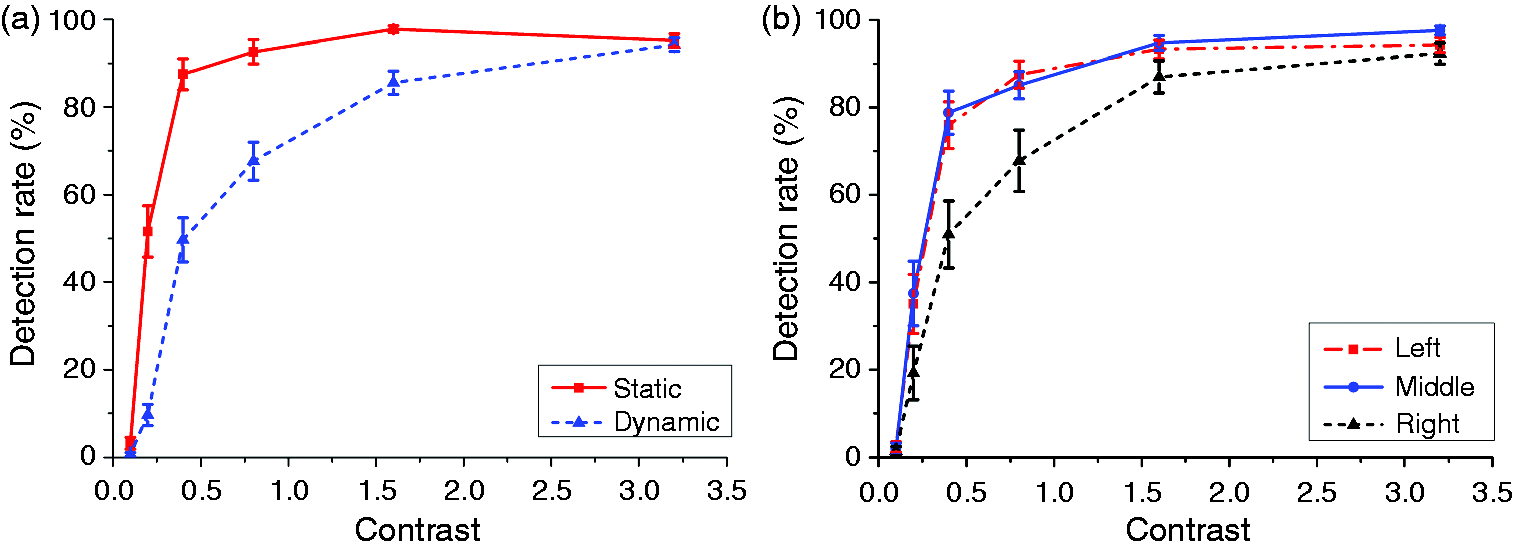
Results of Tukey’s post-hoc test for detection rate
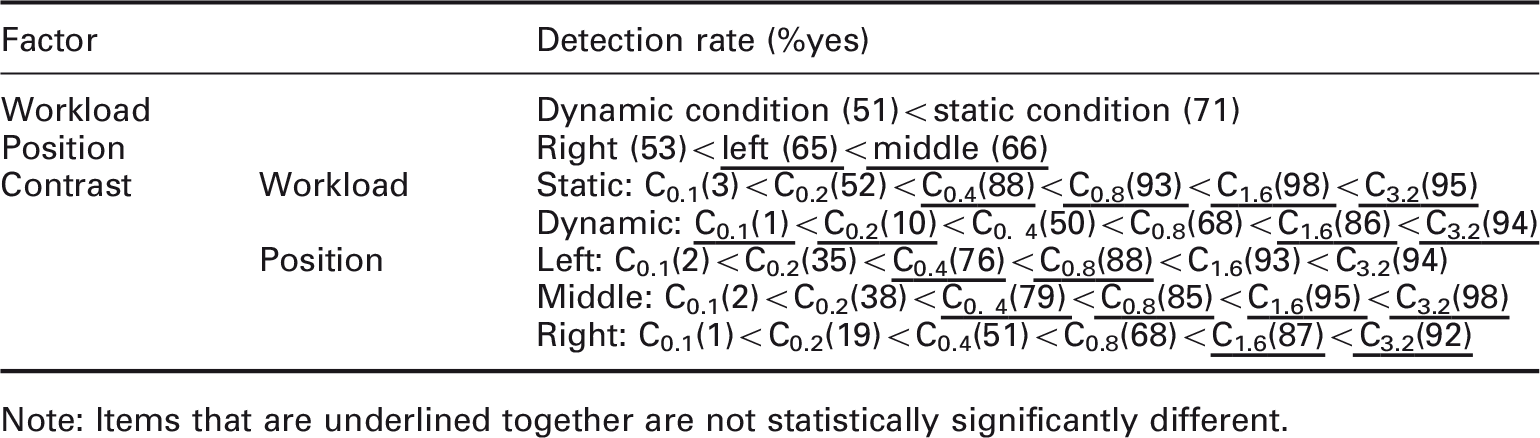
Note: Items that are underlined together are not statistically significantly different.
Figure 5 illustrates the RT for each condition. It shows that the RT decreased as the contrast increases in both conditions and approached an asymptote. It also illustrates that the mean RT for the middle lane and left lane are lower than that for the right lane. Comparing Figure 5(a) with Figure 5(b), we can also find that the RT in the dynamic condition is higher than that in the static condition before approaching the asymptote. This also shows that the driving workload does influence the RT such that the driving workload should be included in the VL study in mesopic vision. It should be noted that the number of samples for contrast level 0.1 was too low to reliably compute a RT. The values for C = 0.1 are therefore inaccurate and will not be included in further analysis.
Mean reaction time for each condition: (a) static condition and (b) dynamic condition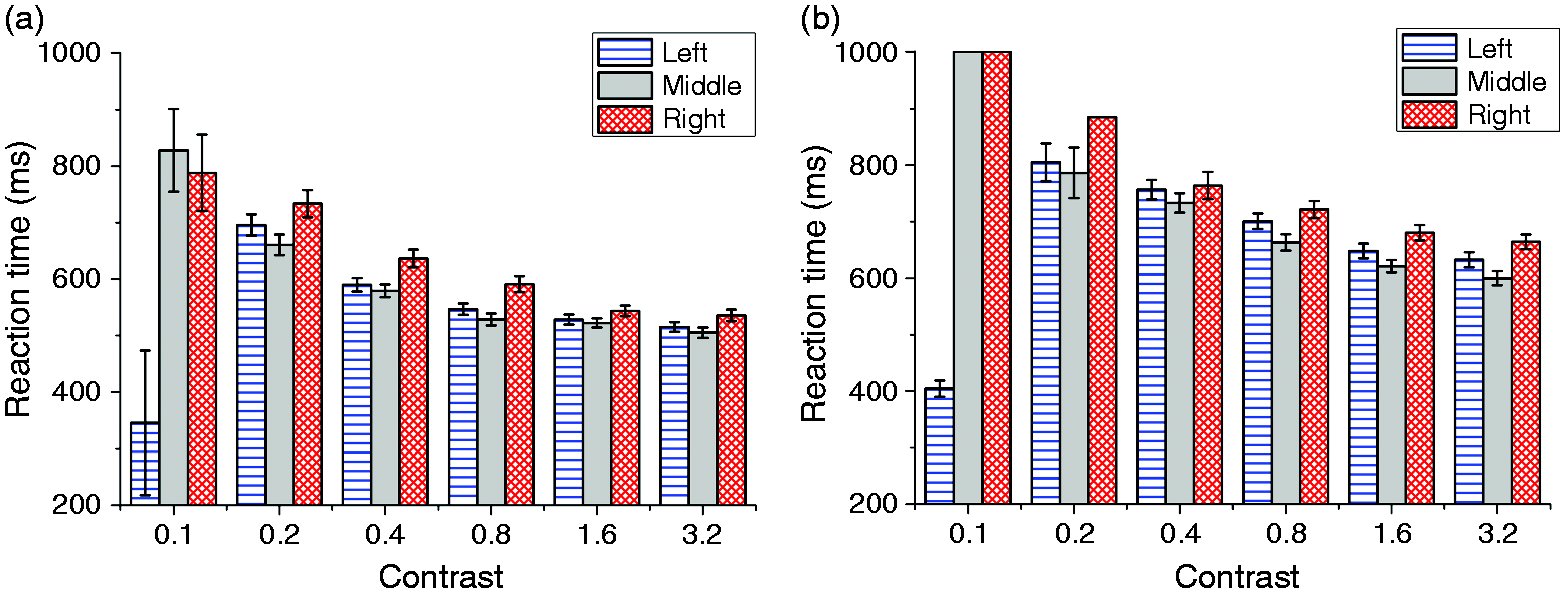
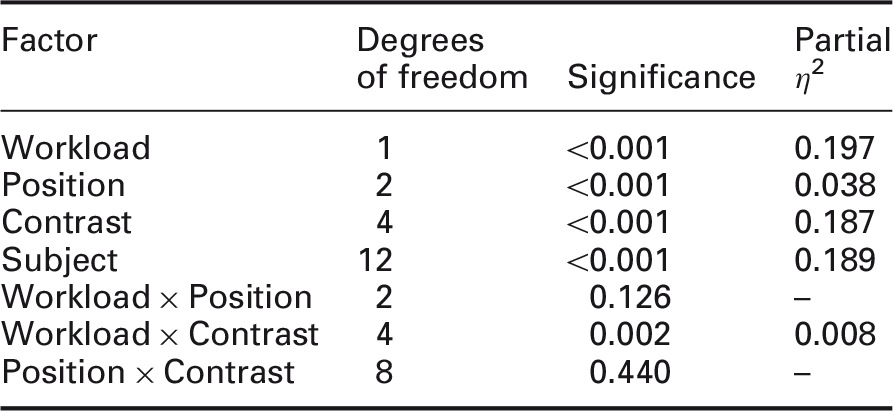
ANOVA results for the reaction time
The interaction between contrast and workload is shown in Figure 6. It also shows that the effect size of the interaction between contrast and workload is trivial.
Interaction of mean reaction time between contrast and workload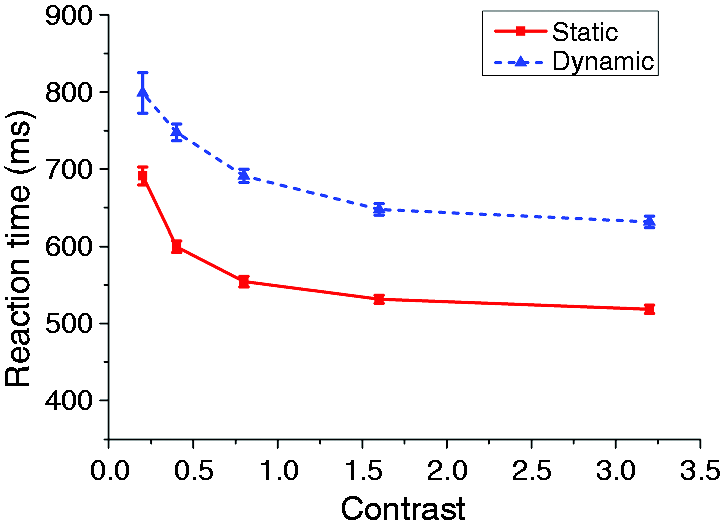
Results of Tukey’s post-hoc test for reaction time
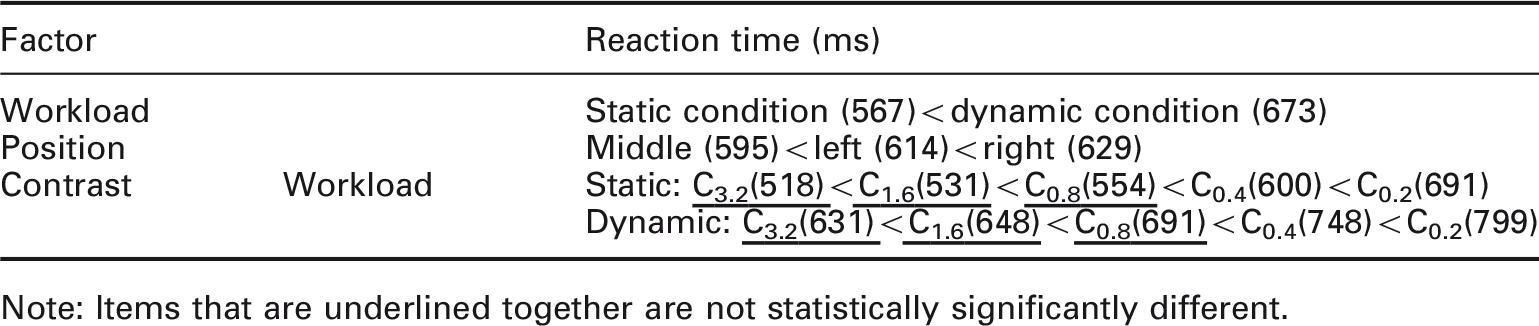
Note: Items that are underlined together are not statistically significantly different.
Plainis and Murray
44
have derived a monotonic function when RT is plotted as function of stimulus contrast. The relationship can be described satisfactory by the following monotonic function:
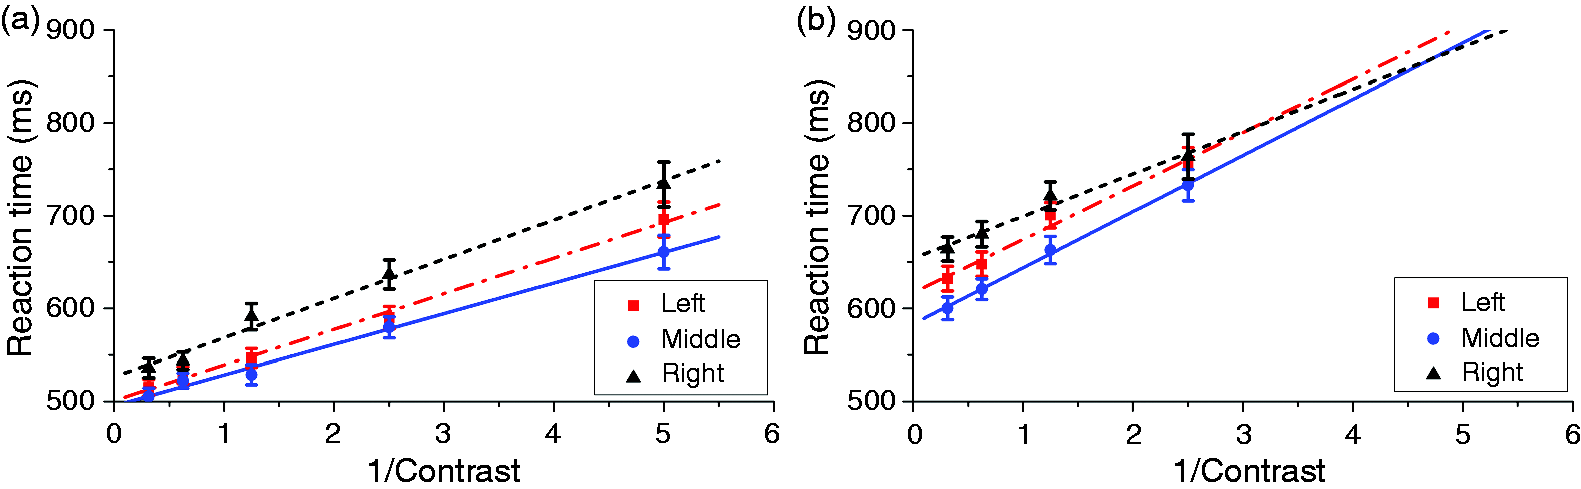
Plots of mean reaction time vs the reciprocal of contrast (1/C) in two conditions: (a) static condition and (b) dynamic condition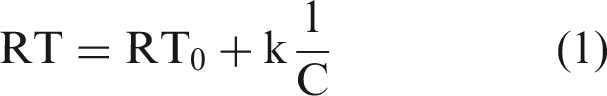
For the static condition:
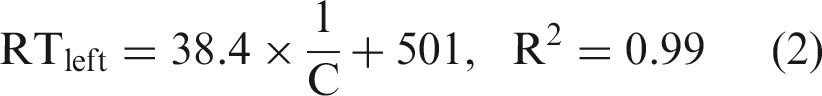
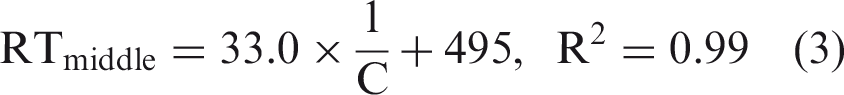

For the dynamic condition:


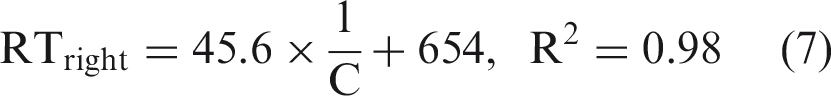
Consistent with Plainis and Murray’s 44 finding, a linear relation between RT and 1/C can be found in both the static condition and the dynamic condition for all lanes. The intercept of the line reflects the value of asymptotic RT, which corresponds to the baseline of ST. The larger intercept in the dynamic condition means it takes longer time to detect the target. It can also be found that the slope in the dynamic condition was steeper than that in the static condition. This means that the dynamic range is relatively narrow in the dynamic condition so that small changes in contrast produce a strong effect on RT.
According to STV model, the DR should be high enough to ensure road safety when VL = 7 according to previous studies.45,46 To compare with the STV model, the VL values of our experimental environments are computed from the contrast and background luminance using Adrian’s model.
24
The VL value is defined as the ratio of the actual ΔL and the threshold ΔL. The threshold ΔL refers to the luminance difference between target and background at detection threshold, and it has no correlation with contrast. The actual ΔL is the luminance difference between target and background in the experiment. Figure 8 illustrates that there is a linear relationship between VL and contrast in our study. The criterion VL = 7 means the target should be detectable at a contrast of 0.3.
Relationship of VL value and contrast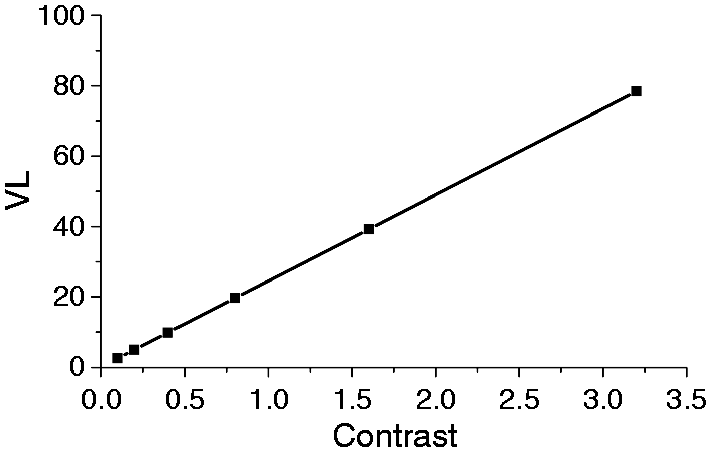
Figure 9 illustrates the relationship between DR and the VL value of the middle lane. The data of the middle lane were chosen because this is the most realistic scenario for an accident. Figure 9 indicates that the DR at VL = 7 is just 38.3% after adding driving workload (dynamic condition). Gallagher and Meguire
31
argued that roadway lighting should allow 85% of the drivers to detect the targets at a safe distance. Based on our experimental results, we can see that VL = 7.5 can reach 85% DR without driving workload (static condition), which is consistent with the standard.
27
While, as driving workload is added, the VL value needs to be 21 if using 85% DR as a visible threshold.
Mean detection rate for the middle lane plotted against the corresponding VL value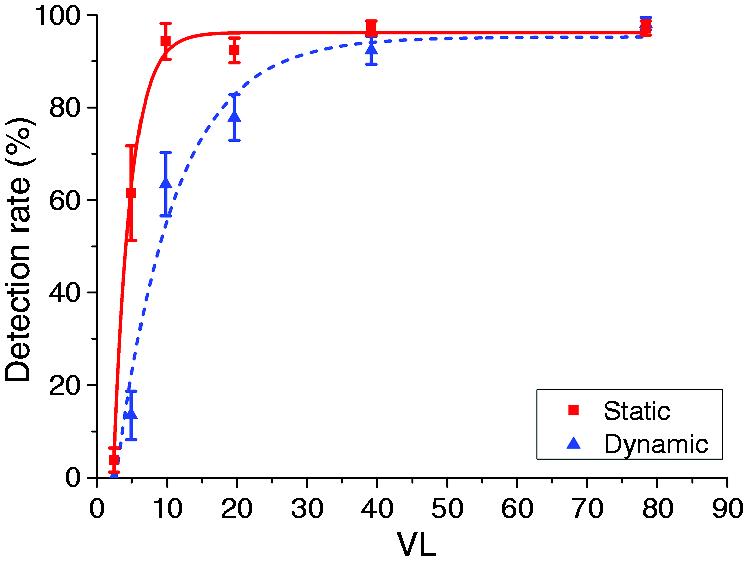
7. Discussion and conclusions
In this paper, we describe a subjective experiment to evaluate the visibility index under mesopic conditions using a driving simulator. The impact of the target contrast, target position and driving workload on target detection performance in mesopic vision was evaluated using the simulated platform to mimic the field study. The results show that our experimental setup is reasonable and can describe the driving workload properly. Driving workload has a negative impact on the target detection performance. It has a large effect size on the DR (partial η2 = 0.281) and the RT (partial η2 = 0.197). The driving workload makes the baseline of ST increase nearly 100 ms and leads to a relatively narrow dynamic range, even small changes in contrast producing a strong effect on RT. In addition, both contrast and target position have statistically significant effects on VL. Contrast has a large effect size (DR: partial η2 = 0.817; RT: partial η2 = 0.187) and target position has a medium effect size (partial η2 = 0.115) for DR and a small effect size (partial η2 = 0.038) for RT. Considering the influence of street lamps, the contrast is lower at the position of the light poles, which resulted in a reduced visibility in the right lane. In general, both driving workload and target position lead to a larger criterion value of VL.
Our study suggests that a VL ≥ 7.5 is needed for static condition, and this is in agreement with the IES standard. 27 And a VL ≥ 21 is needed for the 85th percentile in the dynamic condition. Bremond et al. 12 proposed VL = 7 to be considered relevant for a very simple driving task, but a higher VL threshold should be considered if the drivers were not expecting the targets, which is in agreement with our results. The results of the Enhanced Night Visibility Project showed the range of VL for the white-clothed objects is between 5 and 45 corresponding to different object types and Vision Enhancement Systems. 22 The VL value is also calculated in some field studies. The results of Gallagher and Meguire 31 lead to a value of VL = 8.3 for the 95th percentile at 40 km/h. In the similar condition, Mayeur et al. 23 obtained VL = 10.0 for the 95th percentile, while Bremond et al. 47 obtained VL = 9.4 and VL = 9.2 using different computing methods of luminance. Hills 34 found that a VL up to 30 may be required for unexpected appearance of obstacles. Our results are between the result of Gallagher and Meguire 31 and Hills, 34 we assume it is because the driving game we use may be harder than real driving, some subjects think the steering wheel is a little flexible and the car sometimes passing by made them nervous, which makes the target more unexpected so that subjects must take more effort on searching.
Gibbons et al. 16 found the position of objects does have an effect on the visibility, but the effect is not consistent across all angles of eccentricity. We also find the similar impact of position, but we think this effect is easily disturbed by other factors, for example, the street lamp in our study, and this will lead to some significant interactions.
Anyway, based on this study, we conclude that the STV model needs to be further improved considering the influence of driving workload and field factors such as position (or eccentricity), since these factors have been proved to have a significant effect on visibility in our experiment. The criterion of VL model should also be updated to a larger value, such as VL = 21 in our study. However, just as Brémond and Mayeur 48 suggested, road classification should lead to driving scenarios, where typical parameters should be collected (eccentricity, task load, speed, etc.), leading to VL recommendations in those reference scenarios.
Another problem is that the current VL model cannot explain the significant interaction in our study since it uses a multiplication of independent factors. We think another function should be established to describe the interaction effect. Similar to Weston’s approach,
49
we first define a parameter mesopic visual performance (MVP) to describe the visual performance in mesopic conditions, which is the multiplication of DR and the reciprocal of RT (see equation (8)). It means that a high DR and a low RT lead to a large MVP value and vice versa. Probably, a relationship between MVP and other factors can be found when using a function including the interaction, such as equation (9) for example

This relation will be studied in the next phase of our research. We hope the new model can be used as a safety reference for lighting design. When different conditions lead to the same VL value, it can further evaluate the visual performance. And our driving simulator platform has been useful for creating a more realistic experimental environment and obtaining results related to actual driving conditions. Experiments including more field factors (using a real object as target) and special events (target moving across the road) can be carried-out in the future.
A limitation of the experiment with respect to a realistic situation, however, is that targets only appear at a fixed distance and position on the road, while in a real-life driving condition the obstacle could appear at any location on the road. This will influence the target DR and RT. We will perform a more detailed experiment with multiple distances of targets to better simulate real driving conditions.
A second limitation of our study is that only young university students have been used. It might be interesting to evaluate the effect of age on VL in a more controlled way, since it is known that, in general, visual performance and responsiveness of elderly people degrade with age.
Footnotes
Declaration of conflicting interests
The authors declared no potential conflicts of interest with respect to the research, authorship, and/or publication of this article.
Funding
The authors disclosed receipt of the following financial support for the research, authorship, and/or publication of this article: This work was supported by National Key Research Program of China (2016YFB0401201), Natural Science Foundation of China (61505028, 61405033) and Philips Lighting Research.