
Abstract
In the study of lighting, as the construction of a physical test room is costly and time-consuming, researchers have been actively looking for alternative media to present physical environments. Virtual reality, photo and video are the most commonly used approaches in the lighting community, and they have all been used by researchers around the world. Most such studies have been conducted without discussing what gives the subjects a better sense of realism, presence, etc., and which type of media is closer to the ideal, the physical lighting environment. In this paper, we aim to select the optimal alternative media that can present physical lighting environments. We compare a human’s subjective feeling towards a physical lighting environment and three alternative reproduction technologies, namely, virtual reality reproduction, video reproduction and photographic reproduction. We also discuss the feasibility of using virtual reality in representing lighting environments. The selection of the most optimal media is based on the perceptual attributes of lighted space, and the findings are only related to these criteria. The main results of this study are the following:
(a) The order of the overall presentation-ability of the media is physical space > virtual reality reproductions > video reproductions > photo reproductions.
(b) In terms of subjective rating, virtual reality lighting environments are rated closest to the physical lighting environments, and the order of the approximate coefficient of the media is physical space (1) > VR reproductions (0.886) > video reproductions (0.752) > photo reproductions (0.679).
(c) Virtual reality can present lighting attributes of open/close, diffuse/glaring, bright/dim and noisy/quiet consistent with the physical environment.
(d) Human subjects are most satisfied with VR reproductions.
1. Introduction
Light (and lighting) is very important to human beings. Researchers found long ago that light can impact the vision, mood, circadian rhythm, daily behaviour and health of humans.1,2 While more research is needed to identify the optimal lighting parameters for different applications, massive repeated experiments are also needed. Some authors3–5 believe that the use of a full-scale, mock-up test room is the most precise and reliable method to evaluate lighted environments. However, in most cases, setting up a mock-up test room is expensive.
For many years, researchers have been actively looking for alternative media to present physical environments. Various studies have suggested that photos6–9 and videos 10 are promising media for investigating subjective impressions of space and light. Moscoso et al. 11 compared photos and physically based renderings on several perceptual lighting attributes and showed that the photos convey statistically the same lighting perception as in a real-world scenario. Schielke 10 compared both photo and video reproductions to a real-size mock-up of the same situation. The results revealed a consistency for the lighting characteristics of brightness and contrast.
Besides discussing the feasibility of applying these media in presenting lighting environment, other studies were focusing on improving the technique of computer-generated images (CGI), aimed at an optimal simulation of the physical environment. Since 2001, Drago et al. 12 and Newsham et al. 7 have evaluated the lighting simulation accuracy and rendering fidelity of different algorithm approaches and obtained a high-quality, realistic colour image that provides a perceptual match to the real world. Villa et al. used CGI to present lighting configurations and carried out a series of psychovisual tests to select the most suitable tone-mapping operators, 13 light simulation program and post-production operations 14 for subjective visual comfort.
Although the approaches mentioned above have been frequently used and deeply explored as the subjects cannot get into the space they are unable to accurately immerse themselves and judge the actual experience of the space. Therefore, the presentation-ability of these means is still questioned by the lighting research community.
The goal of this study is to find an alternative media that can present a lighting environment efficiently (and that can replace a physical lighting environment), and test whether it is adequate in presenting physical lighting environments and to measure user’s impressions within various settings.
1.1. Virtual reality and its applications
Virtual reality (VR) is an interactive experience taking place within a virtual environment that incorporates mainly auditory and visual but also other types of sensory feedback like haptic. This immersive environment can be similar to the real world, or it can be fantastical, creating an experience that is not possible in ordinary physical reality. As a new research hotspot, VR is considered to be the most promising media to present the physical world and hopefully may be the best alternative media to replace physical test rooms.
VR can create highly immersive virtual spaces and allow end-users to experience the space from a first-person point of view. VR has been widely applied in the design industry, such as urban and community planning15,16 and architectural design. 17 VR can result in improved design quality, as it allows end-users to identify design issues within the immersive virtual environment (IVE) that could not be achieved using 2D drawings or building information models; and to compare alternative designs, such as differences in spatial geometries, material finishes and lighting. For example, Majumdar et al. 18 used VR to assist design. During the design process, key professionals and decision-makers were invited to meet in an IVE, and to evaluate and provide feedback during the conceptual design phase of a courtroom. This process reduced the decision-making time significantly and allowed for real-time modifications to the design. Dunston et al. 19 used VR in designing a healthcare building. The design team brought end-users, such as doctors and nurses, into the IVE of a healthcare organization and asked them to evaluate different designs and give their feedback. Based on the feedback, the designers made the necessary changes and adjustments according to end-user advice, resulting in an improved and human-centric design.
The abovementioned cases of VR technology being used in assisting designs suggest that IVEs can offer users a similar impression of a physical environment. This also proves that VR technology can be used in scientific research.
By setting up precisely controlled and readily modulated VR reproductions of physical spaces and immersing participants in them, VR technology provides a better approach for evaluating environmental factors, such as lighting environments. For example, Heydarian et al.20–22 conducted a benchmarking study on natural light to compare sense of presence and immersion between VR and a physical space, using VR to explore human impressions towards lighting and their behaviours in an IVE, particularly the influence of personal control on the available lighting options in an office environment. In the experiment, they were introduced to various manual and semi-automatic control options to increase the available lighting in an office environment through the use of either natural or artificial light.
Chamilothori et al. 23 used VR as an alternative environment to conduct subjective assessments on daylit spaces, and investigated its adequacy to evaluate five aspects (the perceived pleasantness, interest, excitement, complexity and satisfaction) of subjective perception of daylit spaces. The study compared the subject’s perception of a real daylit environment and its equivalent representation in VR and tested the effect of the display method on the participants’ perceptual evaluations, reported physical symptoms and their perceived presence in the virtual space. The results indicate a high level of perceptual accuracy, showing no significant differences between the real and virtual environments on the studied evaluations.
1.2. Research purpose
Even though studies have found that human performance, perception and behaviour in an immersive virtual environment are not significantly different from that in a physical environment, 24 VR still faces some criticisms associated with possible discrepancies due to perceptual alterations. Particularly in lighting research, very few studies have focused on the congruence of VR versus a physical lighting environment and on the congruence of VR versus other media (such as photo and video). In this paper, we compare the subjective feelings of humans when subjected to physical lighting environments and the physical lighting environments presented by display media, namely VR, video and photo. This research discusses in detail and quantifies the congruence of using virtual reproductions in representing a lighting environment versus the actual physical lighting environment.
1.3. Perceptual attributes
A large number of studies25,26 have noted that different display media differ in presentation characteristics, resulting in different abilities of the reproduced environment to present the actual physical environment. Different presentation characteristics and abilities affect the end-user’s direct impression of the reproduced environments. Previous studies have shown that the following six subjective senses are of great importance to evaluating the presentation abilities of display media: sense of presence,20,27 sense of realism,28,29 sense of field depth,30,31 sense of stereo, 32 sense of comfort and sense of clarity.3–5 For instance, Whisker et al. 27 noted that sense of presence decides the end-user’s subjective experience of being in one place or environment, even when one is physically situated in another. In Heydarian et al.’s research, 22 a sense of presence was considered one of the key measurements in an IVE through questionnaires. Slater et al. 28 studied the impact of visual realism (geometric and illumination realism) on sense of presence assessed through subjective, behavioural and physiological data in an immersive virtual environment, and showed that a better sense of realism can enhance the subjects’ realistic response.
2. Method
In this study, a physical test room with different lighting scenes was constructed at Tongji University, Shanghai, China. Based on it, VR, photo and video reproductions of the physical lighting scenes were created. The subjects were asked, via a questionnaire, to compare the presentation-ability of the VR environment, photo and video to the physical space, and also to assess perceptual and emotional attributes of the lighted environments in the real-world reference scene and for each virtual reproduction displayed in the three presentation modes.
2.1. Test room
Figure 1 shows the layout of the physical test room. It comprises a ‘reference room’ and a ‘display room’. The reference room was 4.3 m long, 3.6 m wide and 2.8 m high and had two windows on the South wall. However, daylight penetration in the experiment was controlled using shades. In the reference room, a bed, desk, cabinet and computer were arranged as shown (Figures 1 and 2). The area of the display room was approximately 15.5 m2, in which a TV monitor (12176 mm long, 6849 mm wide) and VR equipment were placed to display the reproductions. The ambient lighting of the display room was kept at a relatively low luminance, approximately 3 cd/m2,33,34 to ensure that the space did not interfere with the subjects’ evaluation of the reproductions and to ensure that the subjects’ visual focus was always on the screen.
Layout of the reference and display rooms VR: virtual reality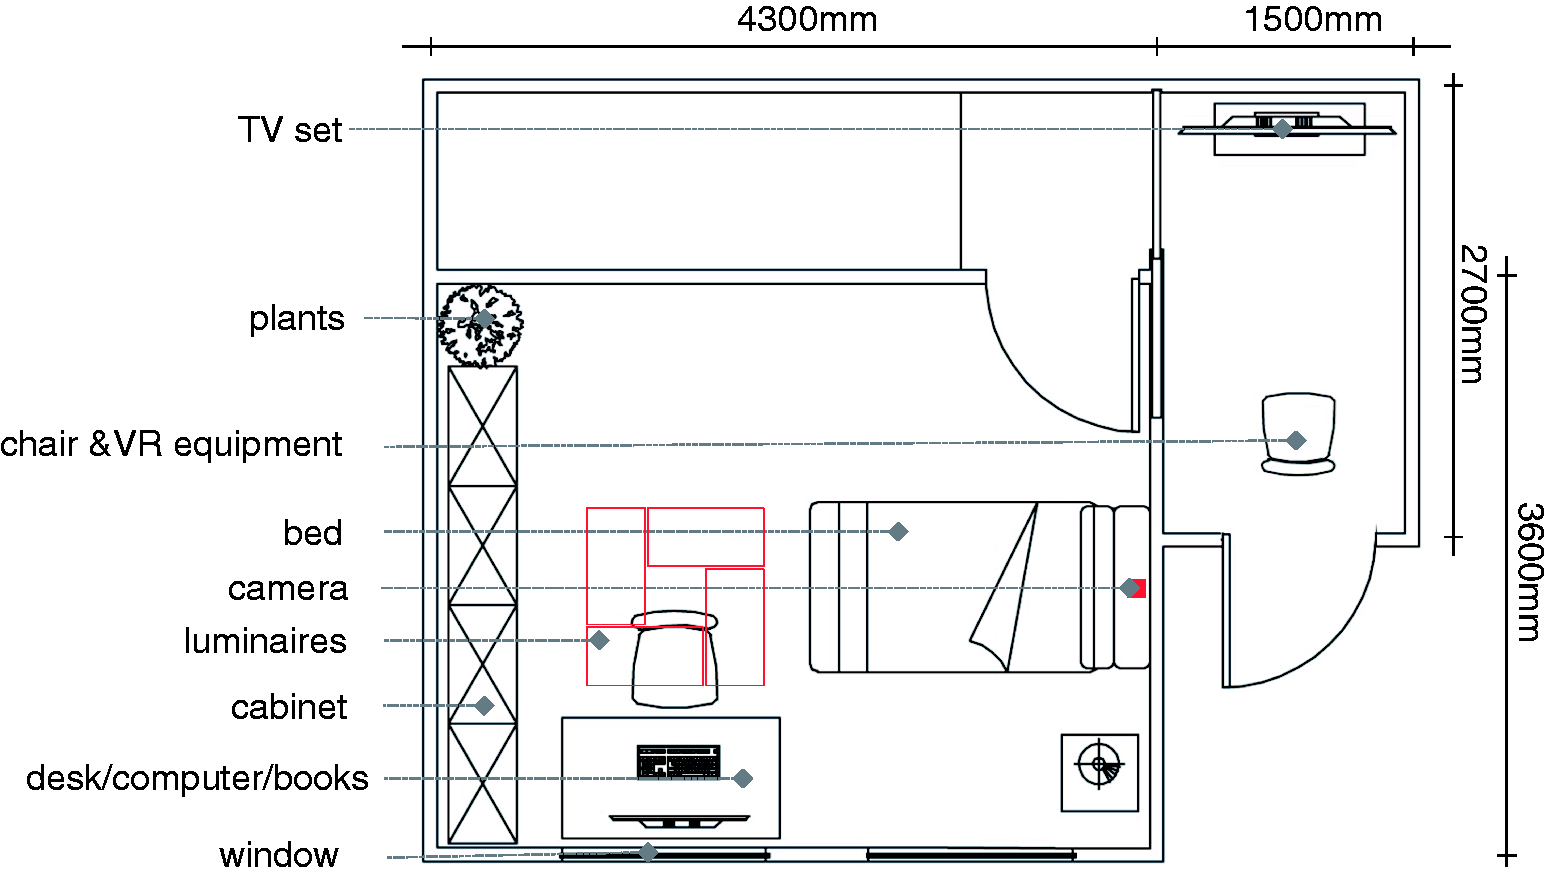
2.2. Luminaires and reference lighting scenes
This experiment used four light-emitting-diode (LED) panel lamps. The LED panel lamps were mounted in the ceiling of the reference room. As shown in Figure 2, all four lamps faced directly down and were dimmable both in correlated colour temperature (CCT) and light intensity via a dimmer. Table 1 shows the parameters of the reference lighting scenes. In this experiment, three CCTs were chosen as reference lighting scenes, including warm white (3000 K), neutral white (4000 K) and cool white (5500 K). In all the reference scenes, the average illuminance on the work plane (75 cm above the floor) of the reference room was set at 800 lux.
Section of the reference room Technical parameters of reference scenes Note: Trial scenes: before the test, a reference scene was chosen randomly to be used as a trial scene. CCT: correlated colour temperature.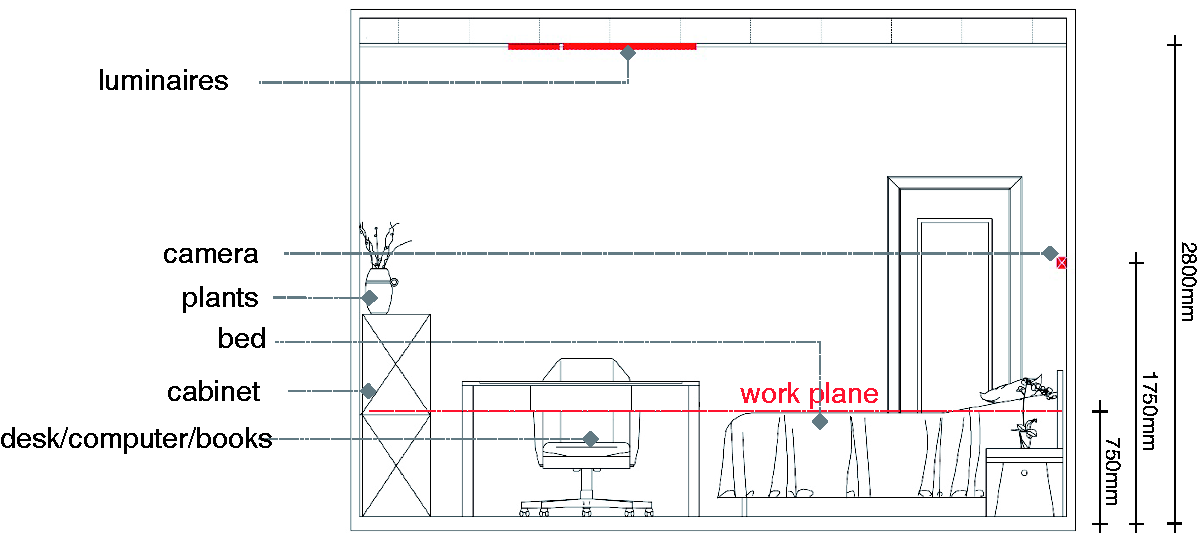
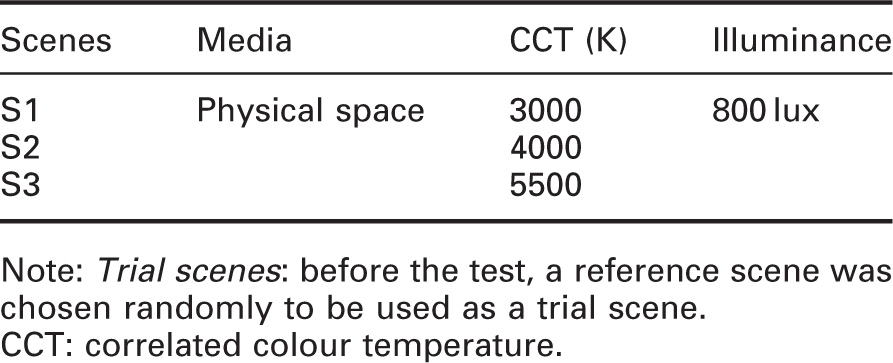
Before the test, a reference scene was chosen randomly as a trial scene for the subjects to go through the questionnaire and to ensure their understanding of the questions.
2.3. Reproductions
Technical parameters of displayed scenes
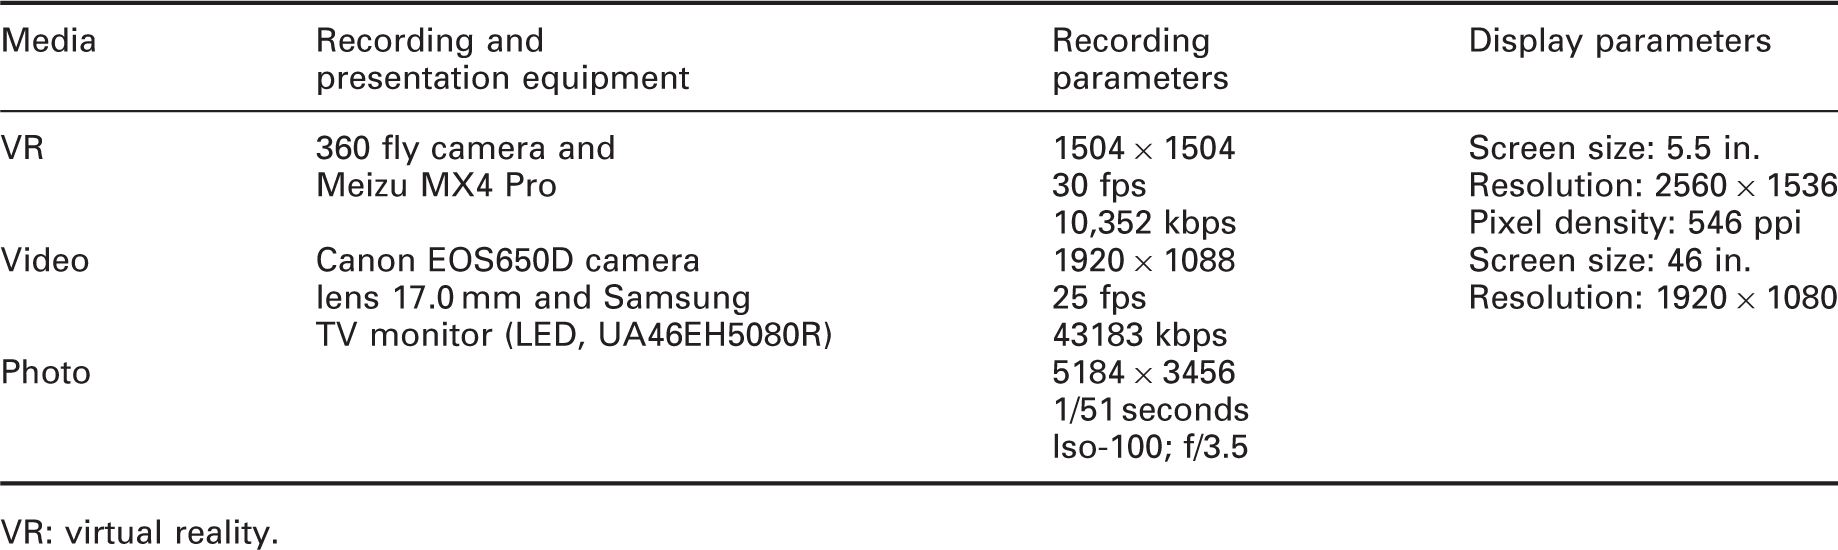
VR: virtual reality.
2.3.1. Virtual reality
In this study, VR scenes were reproductions of the physical test room, which were recorded using a VR camera (360 fly camera) and displayed on a smartphone using an app called 360 fly. When displaying the VR video, the phone was placed in a VR helmet. The procedures to create a VR scene were as follows:
Use the 360 fly camera to record panoramic videos of the reference scenes in the physical test room. During the recording, the camera was mounted on the wall 1.75 m above the floor, as shown in Figures 1 and 2; Import the panoramic videos into a smartphone and convert them to immersive virtual videos with the 360 fly app; Play the immersive virtual video on the smartphone and place the smartphone into a VR helmet. The subjects then put on the VR helmet and immersed themselves in the virtual scenes.
In the VR scenes, the subjects could turn their head and walk forward and backward to get a better sense of presence. Figure 3 shows a typical VR scene.
An immersive virtual reality environment (available in colour in online version)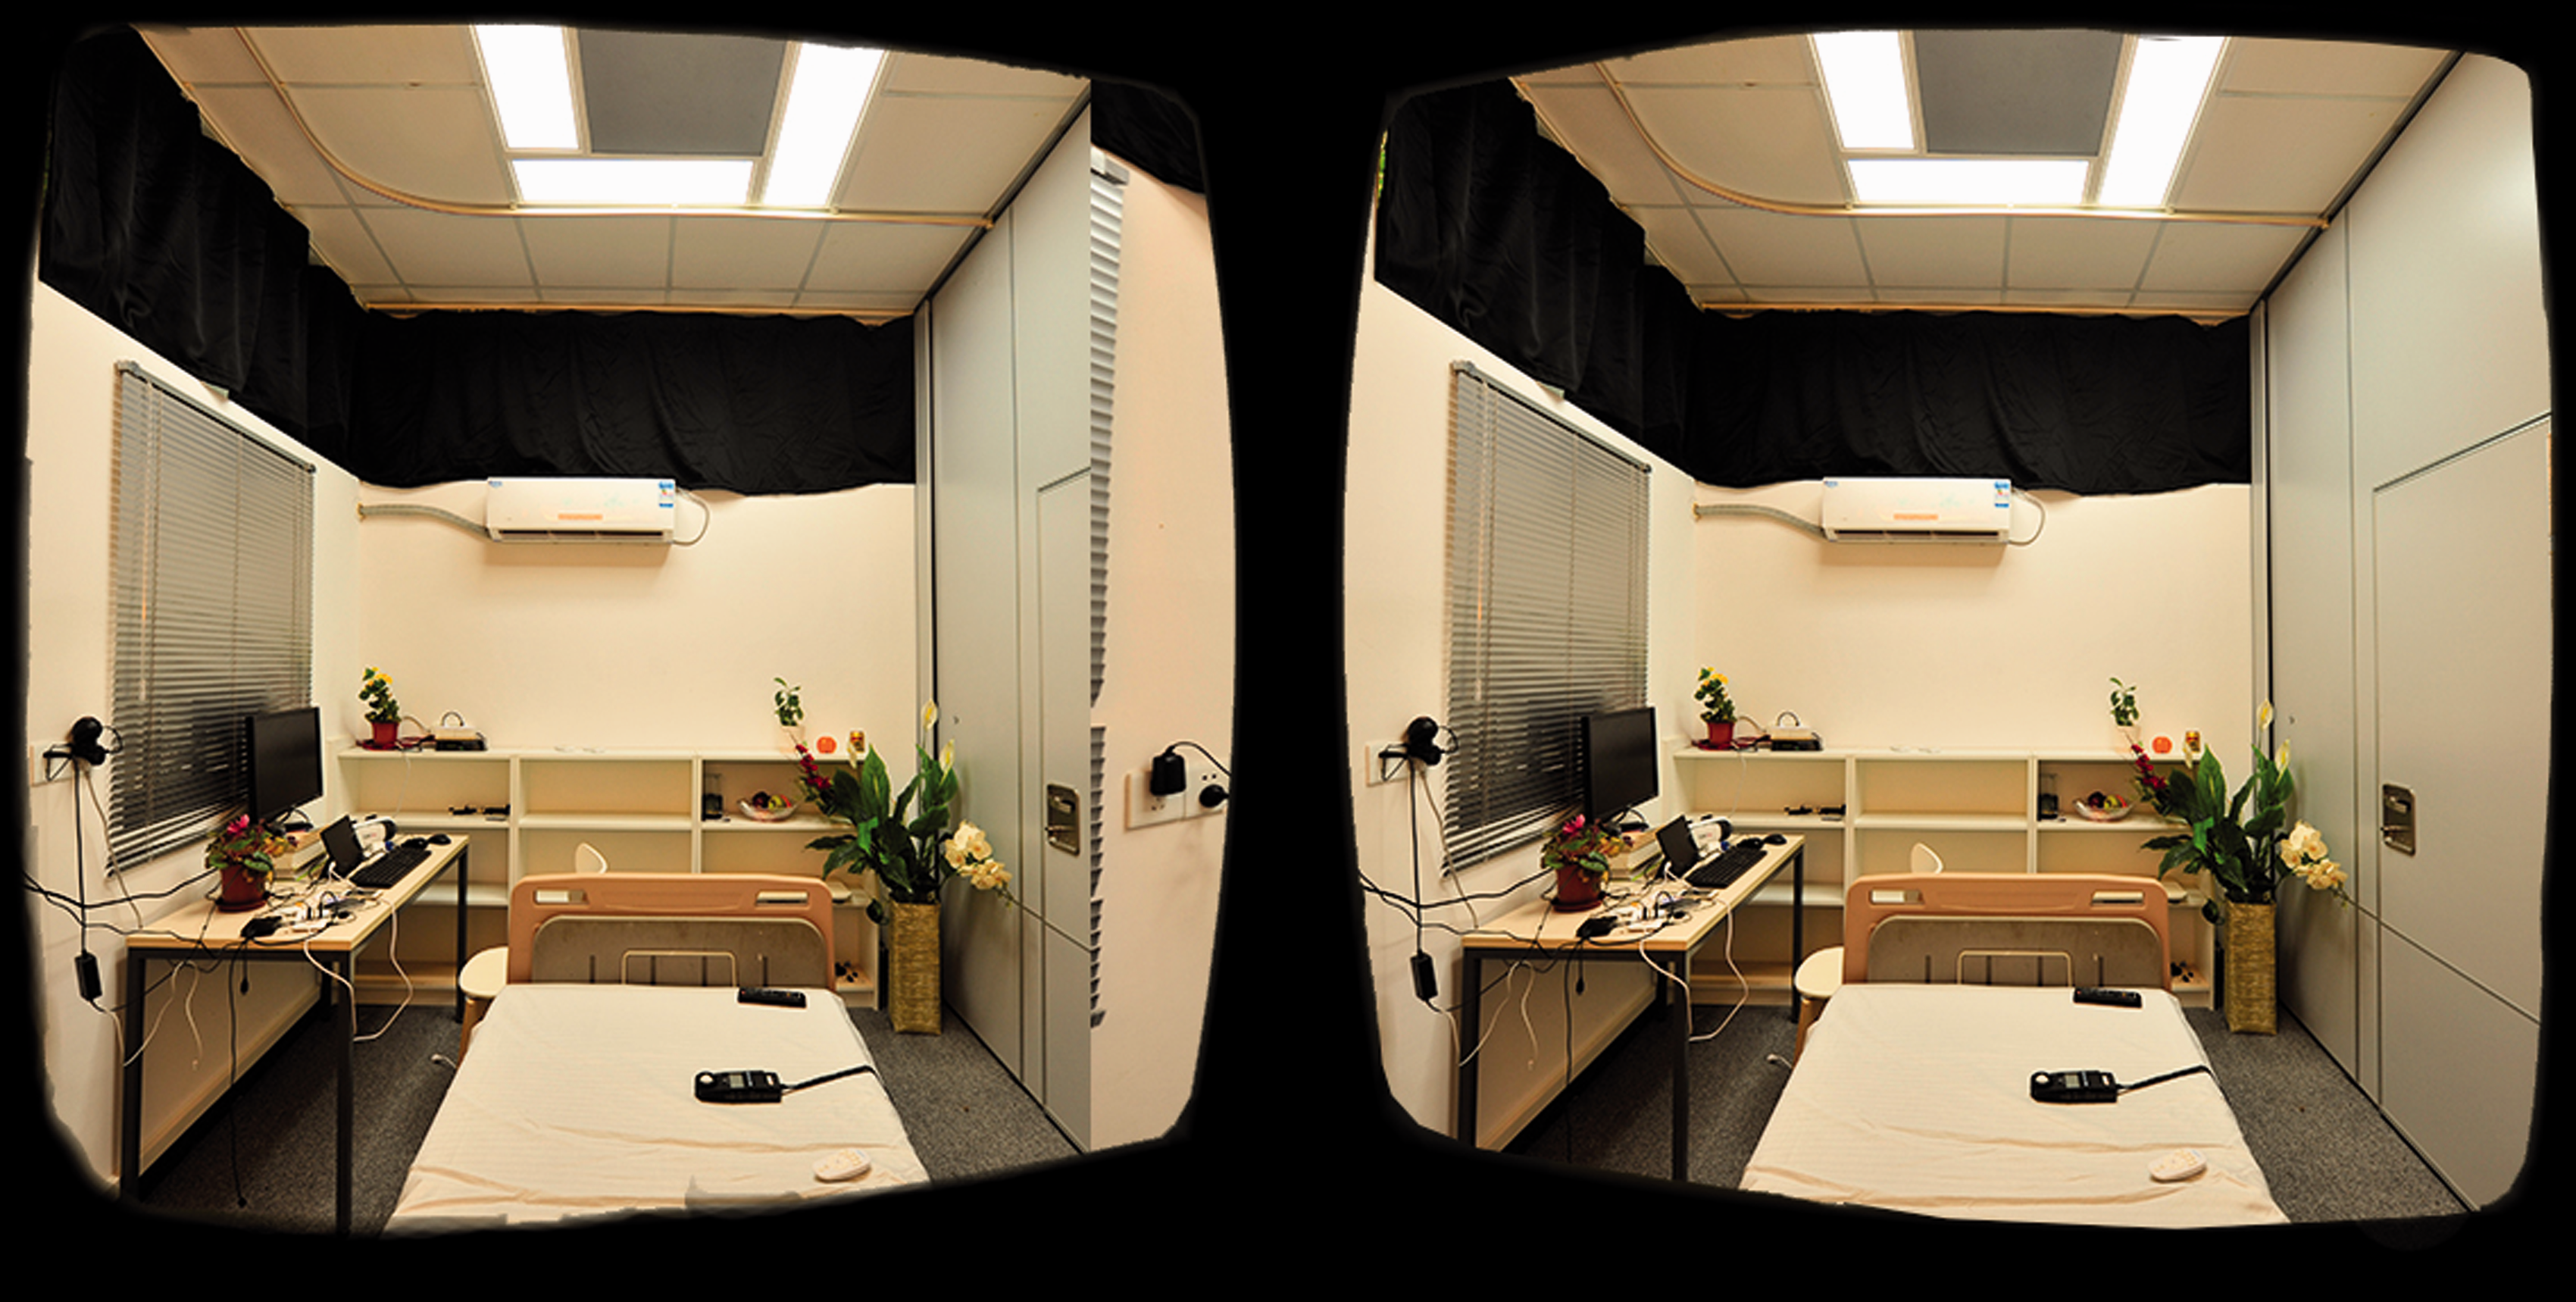
The technical parameters of the 360 fly camera are as follows:
Lens: horizontal 360° and vertical 240° wide-angle
Aperture: f/2.5
Resolution: 1504 × 1504
Camera sensor size: 1/2.3 in.
Frame rate: 30 fps
The display parameters of the smartphone are as follows:
Screen size: 5.5 in.
Resolution: 2560 × 1536
Pixel density: 546 ppi
2.3.2. Video and photo
The video and picture reproductions were both recorded using a Canon EOS650D camera (Camera lens 17.0 mm) and displayed on a Samsung TV monitor (LED, model no. UA46EH5080R). The camera was mounted on the wall (1.75 m above the floor) as shown in Figure 1. The technical parameters are shown in Table 2. Figure 4 shows the typical photo and video reproductions.
Photo and video reproductions (available in colour in online version)
As the photos and VR videos were made by different recording and display equipment, chromatic aberration inevitably occurred between the reproductions. Such differences and deviations were ignored in this study.
2.4. Questionnaire
Questionnaire content
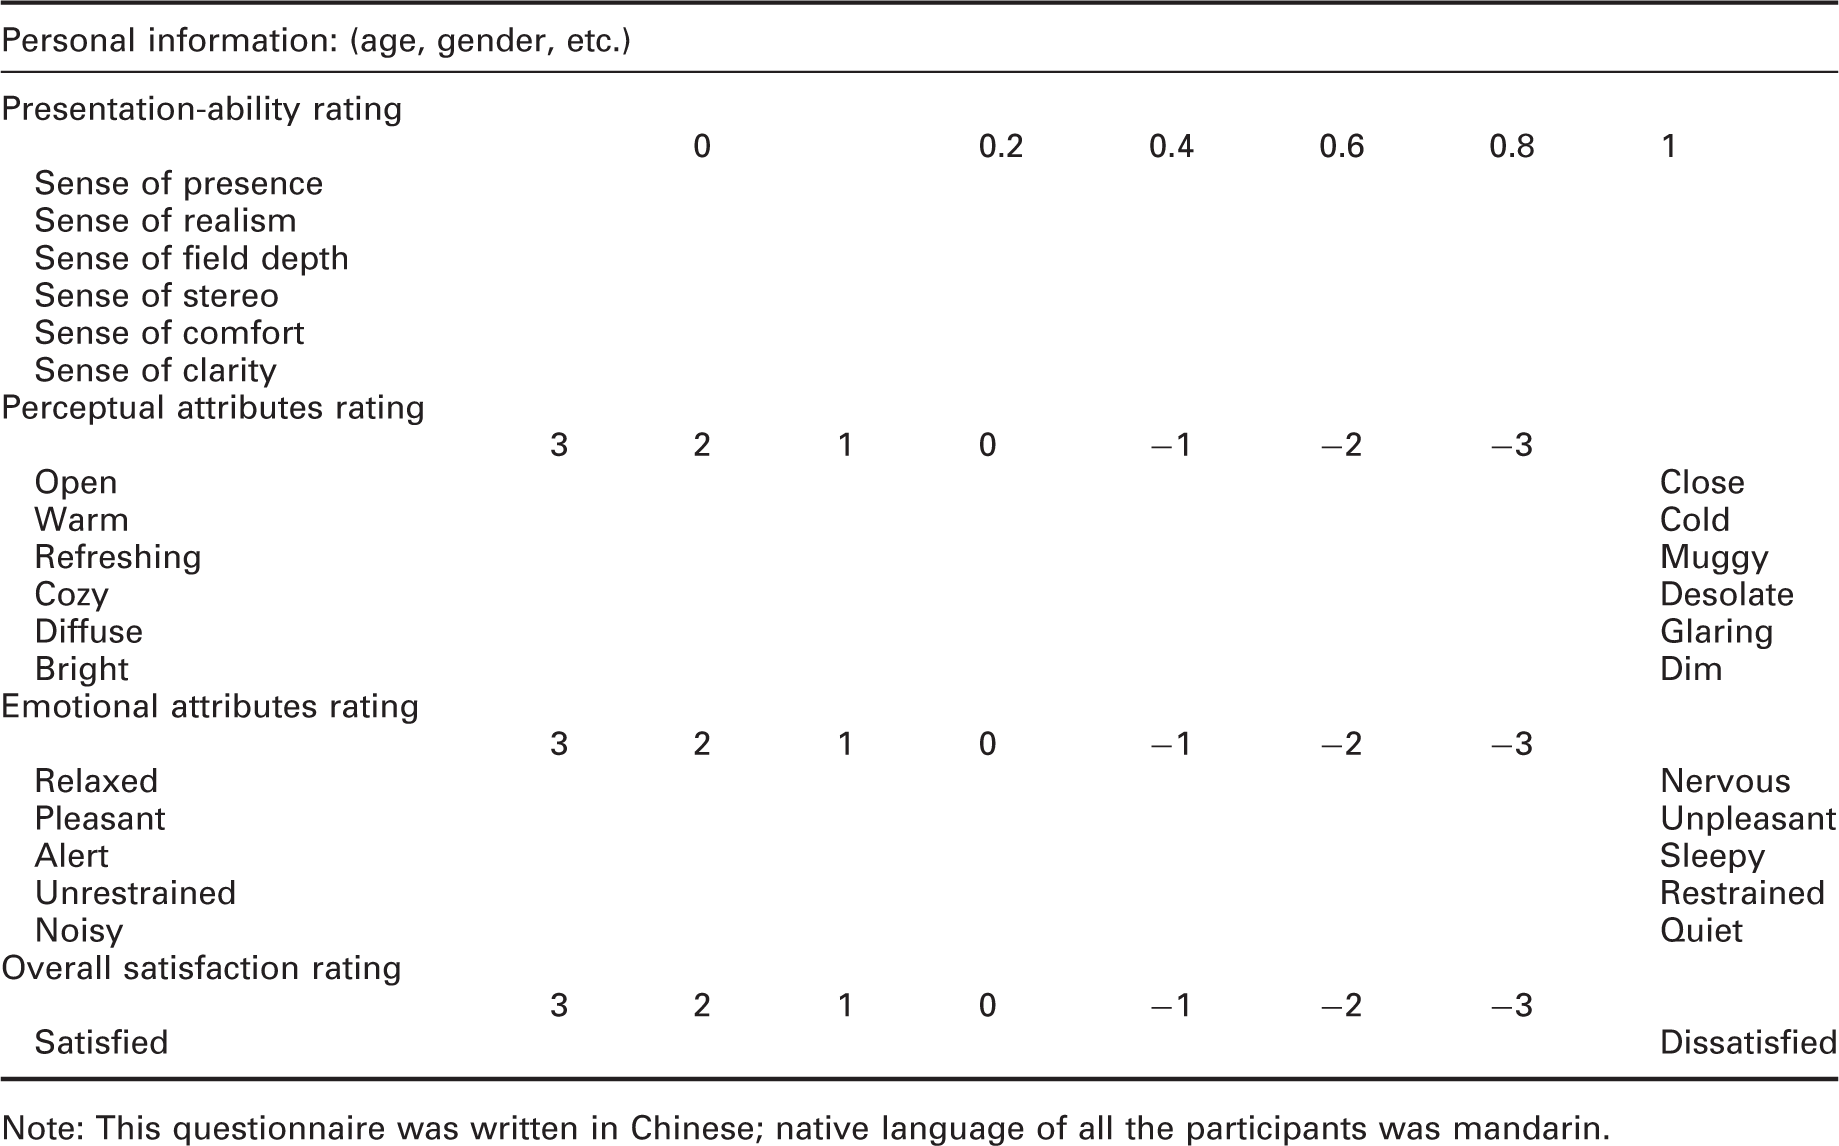
Note: This questionnaire was written in Chinese; native language of all the participants was mandarin.
As described in Section 1.1, the overall performance in giving the subjects a sense of presence, sense of realism, sense of field depth, sense of stereo, sense of comfort and sense of clarity is defined as presentation-ability. Moreover, the sense of presence, sense of realism, sense of field depth, sense of stereo, sense of comfort and sense of clarity were defined as presentation factors.
As shown in Table 3, to rate the presentation factors, a six-point scale (0, 0.2, 0.4, 0.6, 0.8 and 1) was used, 1 meaning the performance of a certain presentation factor was perfect and 0 meaning it was the worst.
In lighting research, semantic differential scales are widely used in subjective evaluation.35,36 In this study, the perceptual attributes, emotional attributes and overall satisfaction ratings all used this evaluation method, and seven-point semantic differential scales (from −3 to 3) were used. Moreover, by using the adjective pairs shown in Table 3, the subjects expressed their impressions of the scenes and lighting environments.
2.5. Recruitment
There were 40 subjects recruited for this study, 21 of which were male and 19 female; 24 of them were undergraduate or graduate students of Tongji University, aged between 18 and 30; eight were aged between 31 and 50; and eight were older than 51 years. Most of the subjects had educational backgrounds in architecture and could understand the questions containing professional technical nomenclature in the questionnaire. Therefore, as there is no need to explain each individual lighting attribute, a single-blind experiment can be easily achieved. All of the subjects had normal visual acuity or wore glasses that gave them qualified visual acuity. As screened at Shanghai Municipal Hospital, all of the subjects were confirmed to be free of ocular defects.
2.6. Procedure
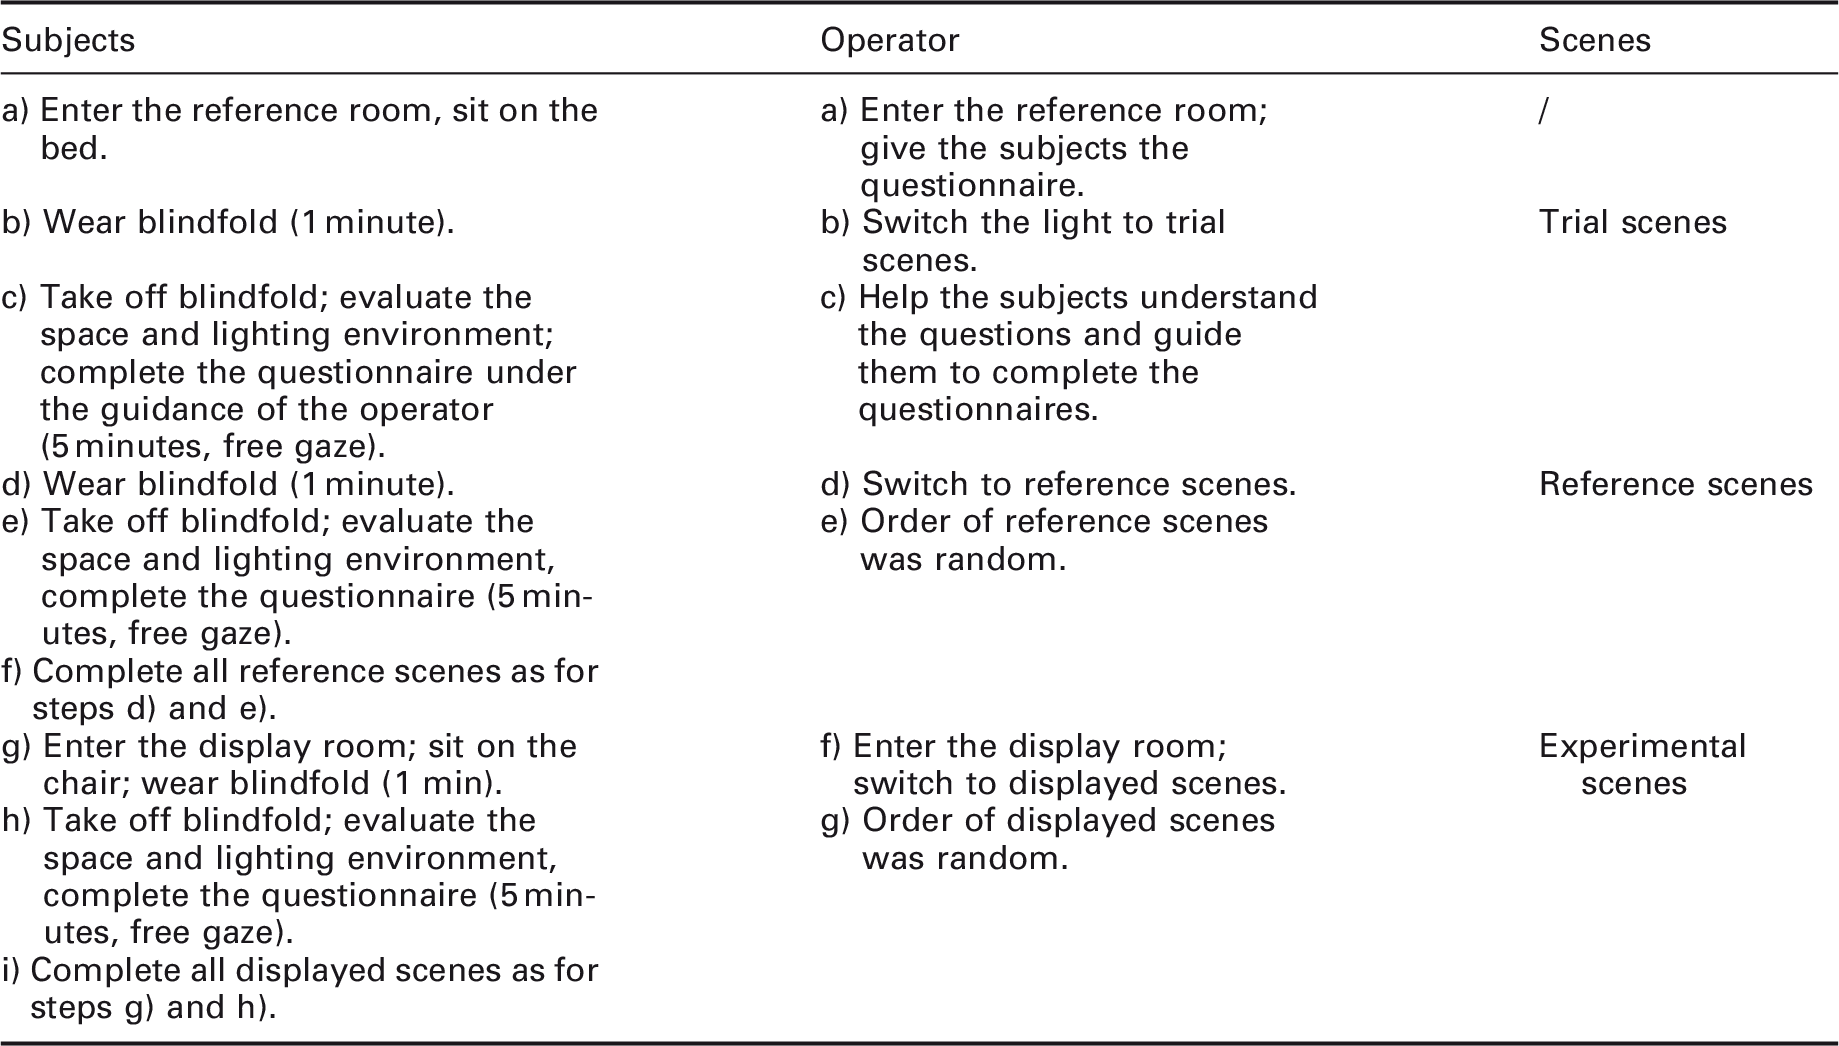
Details of the experimental procedure
3. Data analysis and results
Presentation factors: Mean ratings and standard deviations
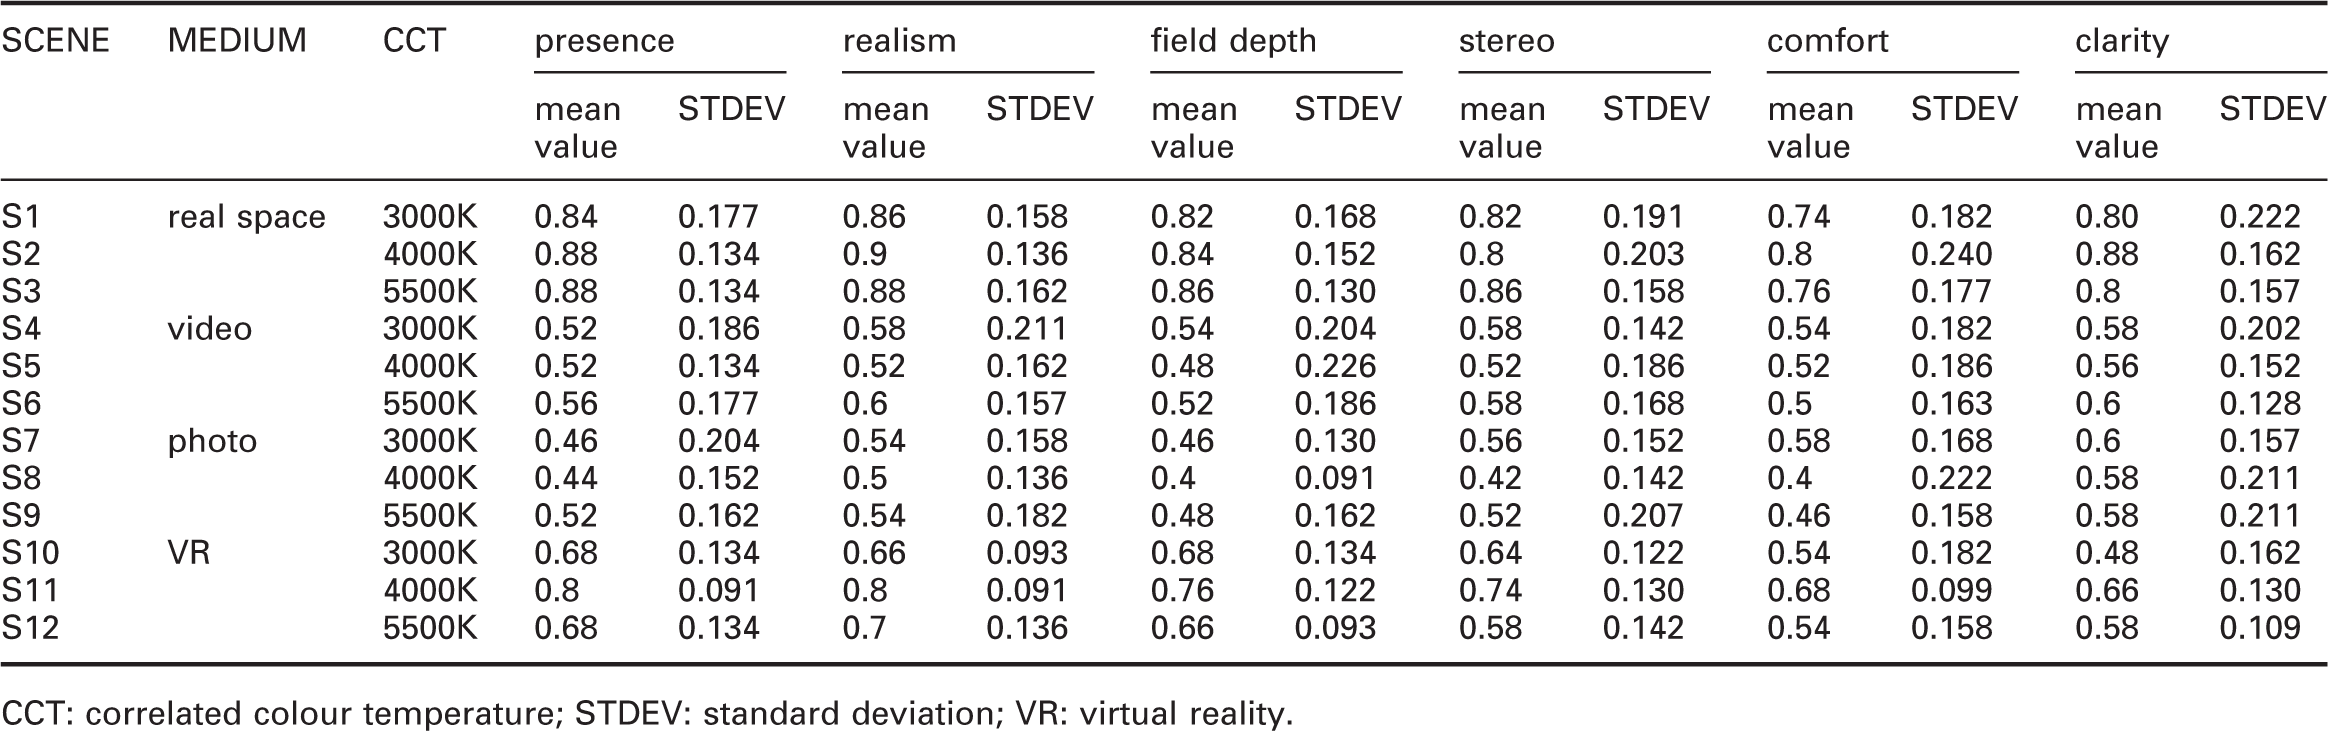
CCT: correlated colour temperature; STDEV: standard deviation; VR: virtual reality.
Perceptual attributes: Mean ratings and standard deviations
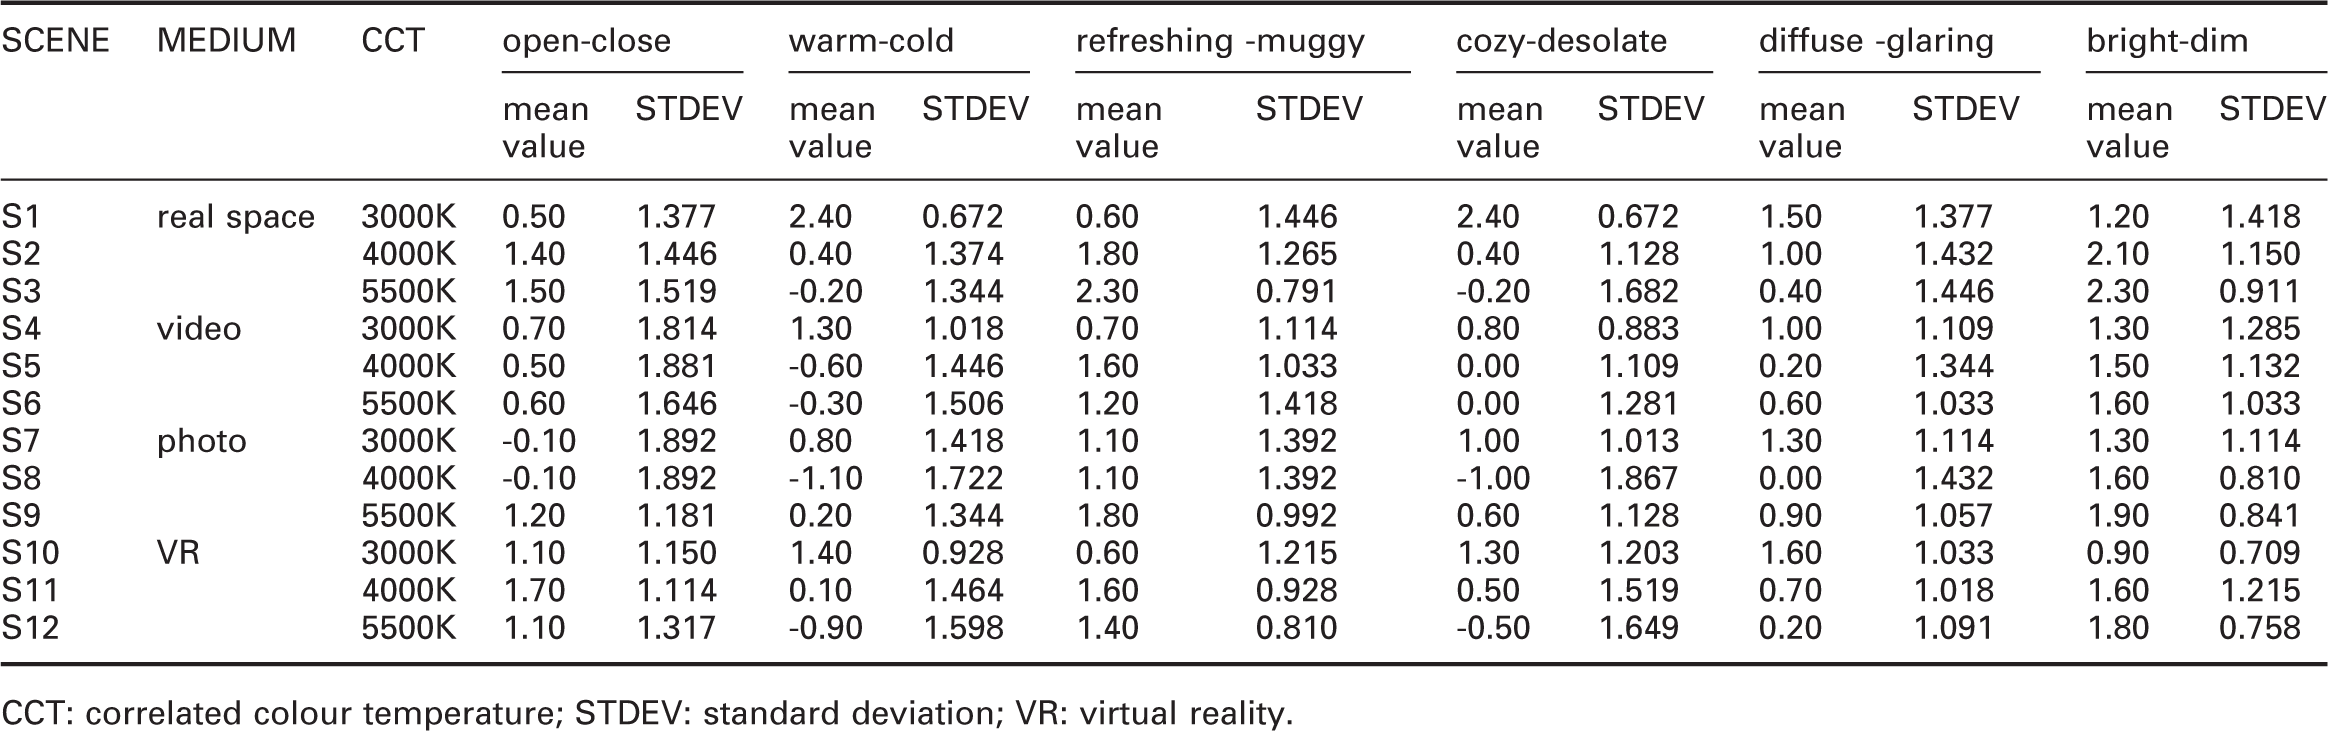
CCT: correlated colour temperature; STDEV: standard deviation; VR: virtual reality.
Emotional attributes and satisfaction: Mean ratings and standard deviations
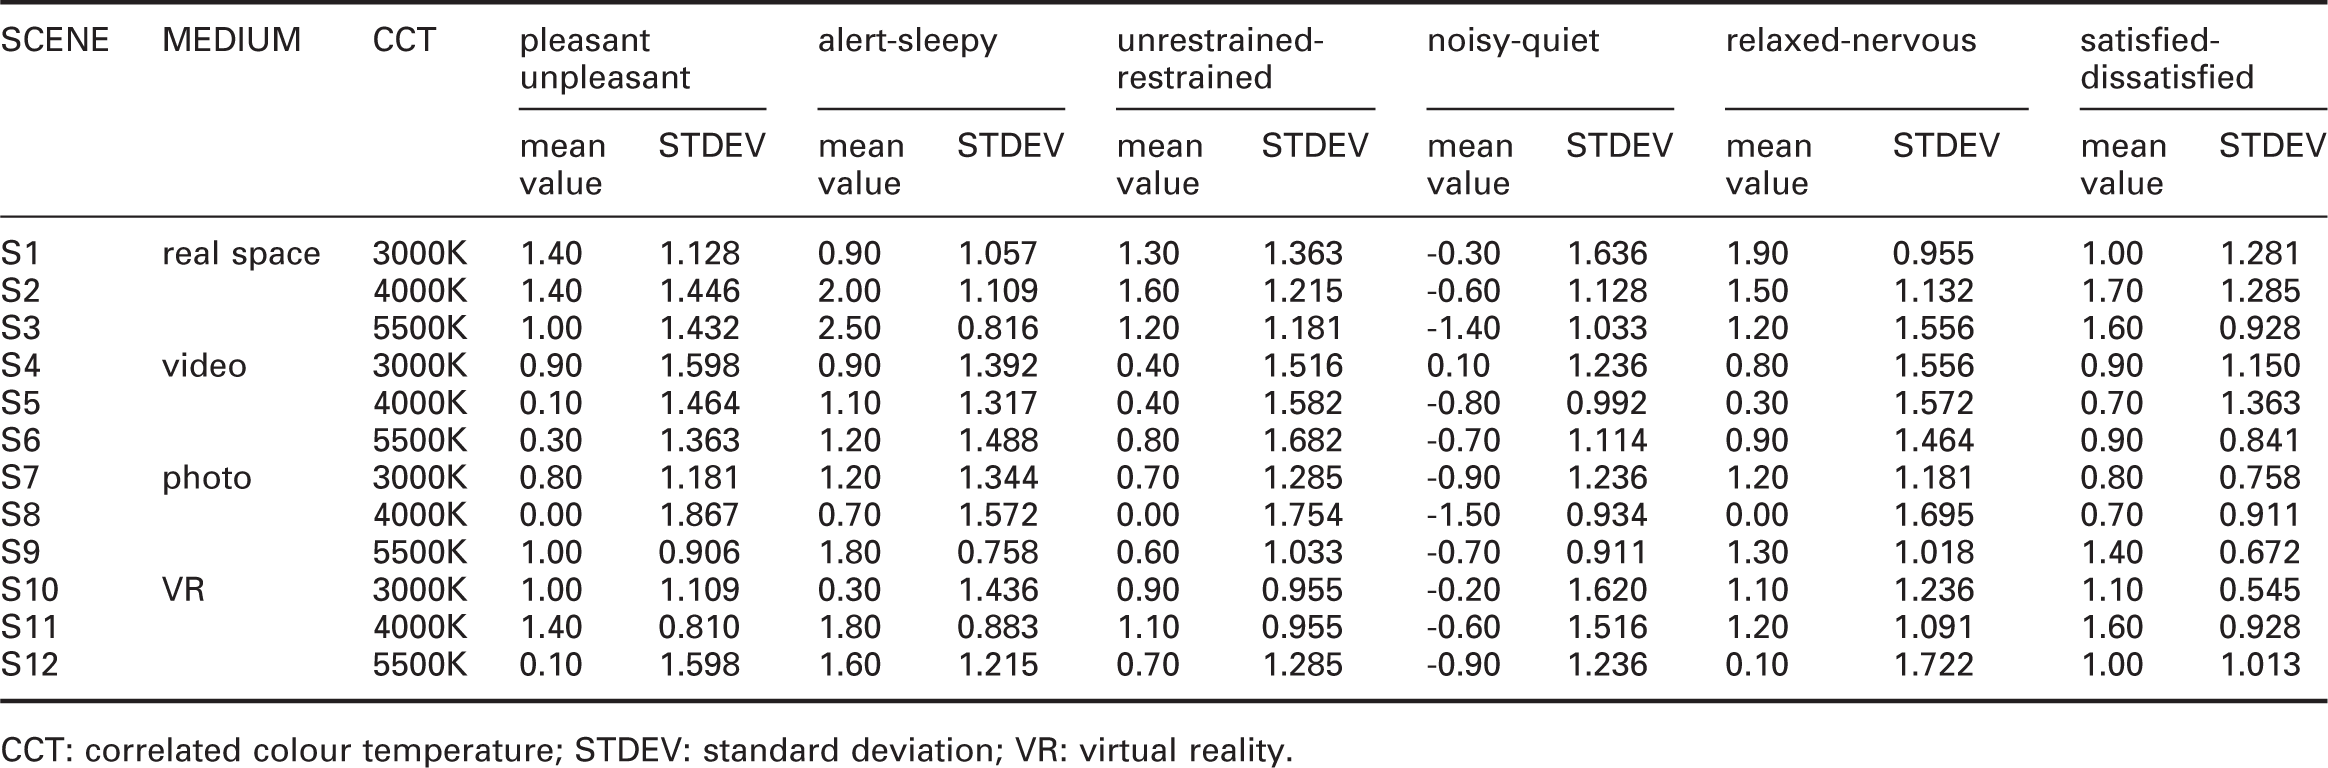
CCT: correlated colour temperature; STDEV: standard deviation; VR: virtual reality.
3.1. Presentation factors analysis
3.1.1. Presentation-ability rating
Figure 5 shows a radar chart that contains the mean ratings of the six presentation factors of the subjective senses, namely, the sense of presence, sense of realism, sense of field depth, sense of stereo, sense of comfort and sense of clarity. The area surrounded by these mean subjective rating scores suggested the presentation-ability of the media, with a larger area meaning higher scores on the rating scale, and hence better presentation-ability. The descending order of the media’s presentation-ability was VR > video > photo.
Mean ratings of presentation-ability of the different media VR: virtual reality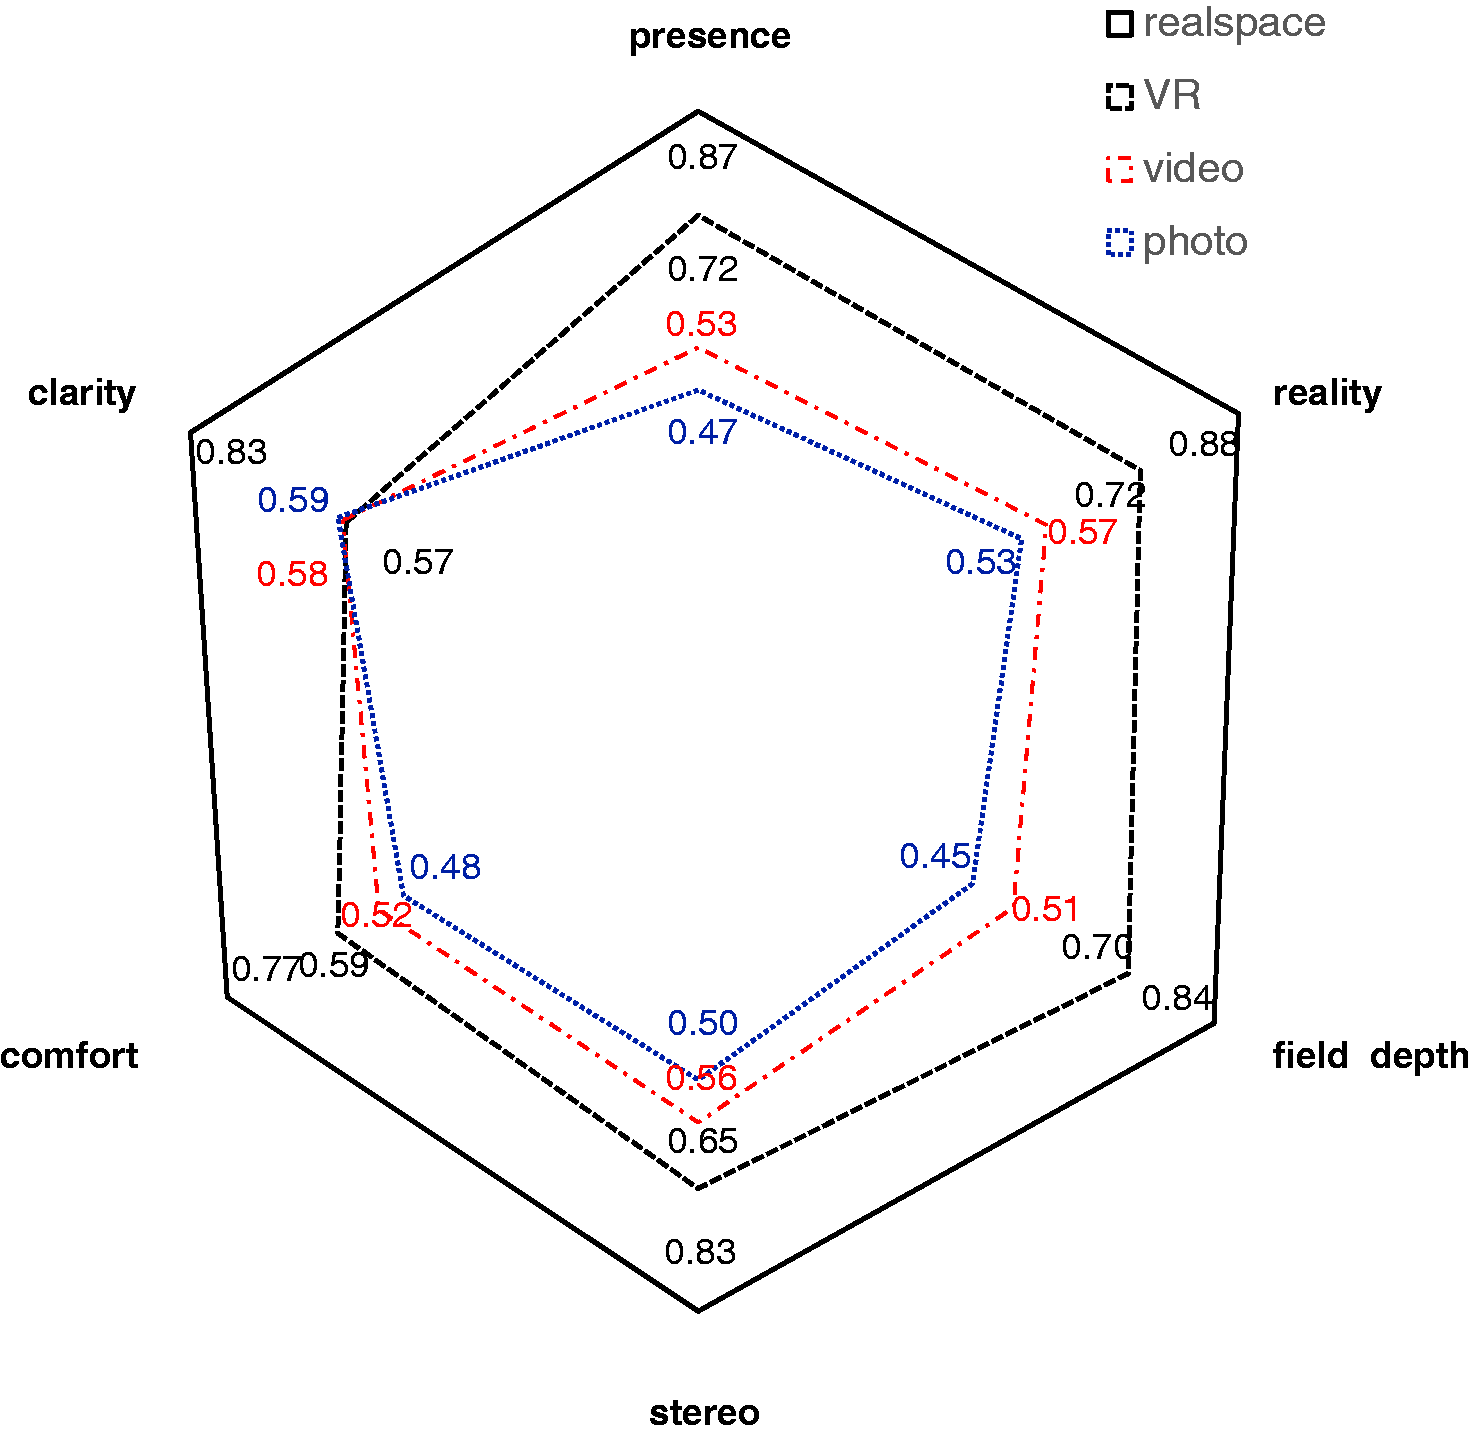
Based on the mean ratings, a Pearson correlation analysis indicated that the rating of the physical space showed a significant correlation with those on VR (p ≤ 0.05), while the correlations with video and photo were not significant (p > 0.5).
The subject-rated VR environment performed the best in five of the six presentation factors, showing high presentation-ability for the factors of presence, realism, field depth and stereo, with average scores of 0.72, 0.72, 0.70 and 0.65, respectively. For the rating of comfort, as the subjects wore a helmet, which was not the normal way they would otherwise experience a space and environment, the score for comfort was relatively low (0.59). In terms of clarity evaluation, VR was rated worse than video and photo (0.57). The reason for this was attributed to the use of less-advanced VR equipment. Nevertheless, the other results suggest that VR would have shown even better presentation-ability if the clarity of the VR videos could have been increased. It should be noted that even though the VR reproductions in this experiment were recorded and displayed in video format instead of a 3D immersive VR model, they still performed better than normal video and photo. This suggests that the display form of VR could improve the subjects’ feeling on presence, realism, field depth and stereo. If more movements and interactions (such as walking and moving objects) were introduced, VR would show higher presentation-ability. In conclusion, using VR to present lighting environments was more effective and reliable than using videos and photos. Furthermore, with the development of VR technology, the feasibility and reliability of applying VR in lighting research are expected to grow in the future.
3.1.2. Correlation among presentation factors
Correlations among presentation factors
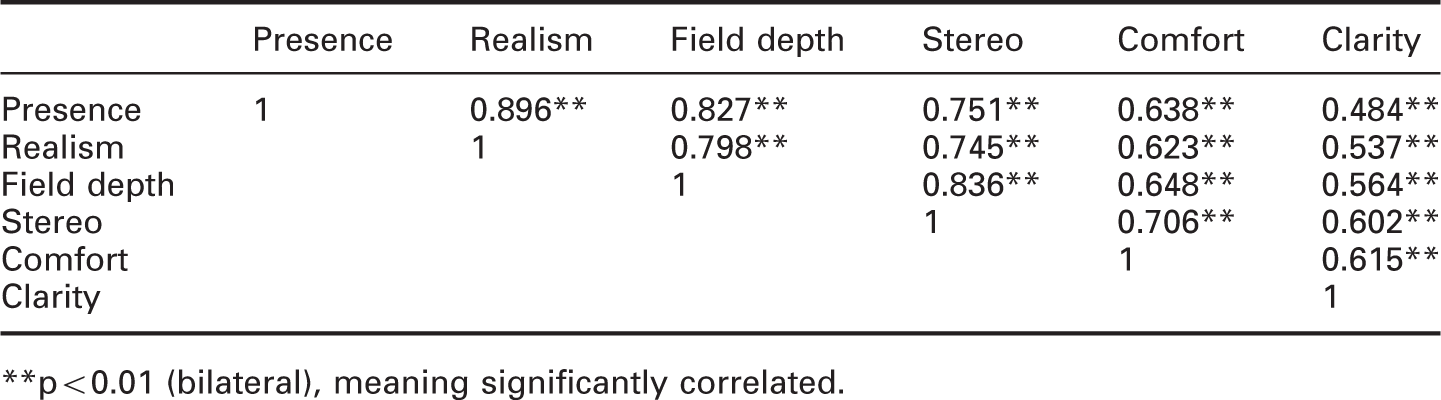
p < 0.01 (bilateral), meaning significantly correlated.
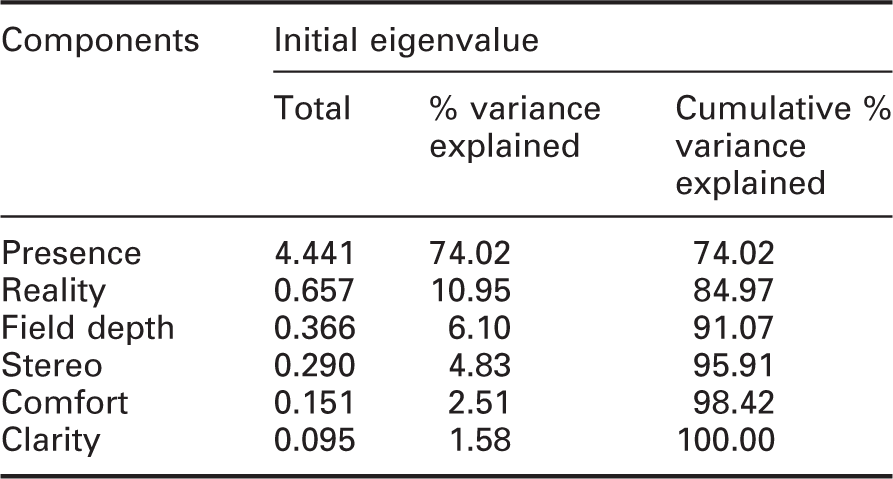
3.1.3. Weight analysis of the presentation factors
Variance explained by different presentation factors
3.2. Presentation modes and lighting attributes
Data were analysed in SPSS. By conducting Friedman non-parametric tests and non-parametric post hoc analyses, the impact of presentation modes on the subjective rating on the lighting scenes was examined. As the p-values for the differences between presentation modes are all less than 0.05, it means that the difference in subjective ratings among the presentation modes is statistically significant. In order to further check the results, non-parametric tests of Friedman analyses were used to compare the paired samples; namely, real space and VR reproduction, real space and video reproduction and real space and photo reproduction. The p-values of these are 0.01, 0.01 and 0.05, respectively. These results indicate that the presentation modes can influence the subjects’ ratings of the lighting attributes.
Statistical significance (p value) of the Friedman test between the ratings of the real space and those given under the different presentation modes
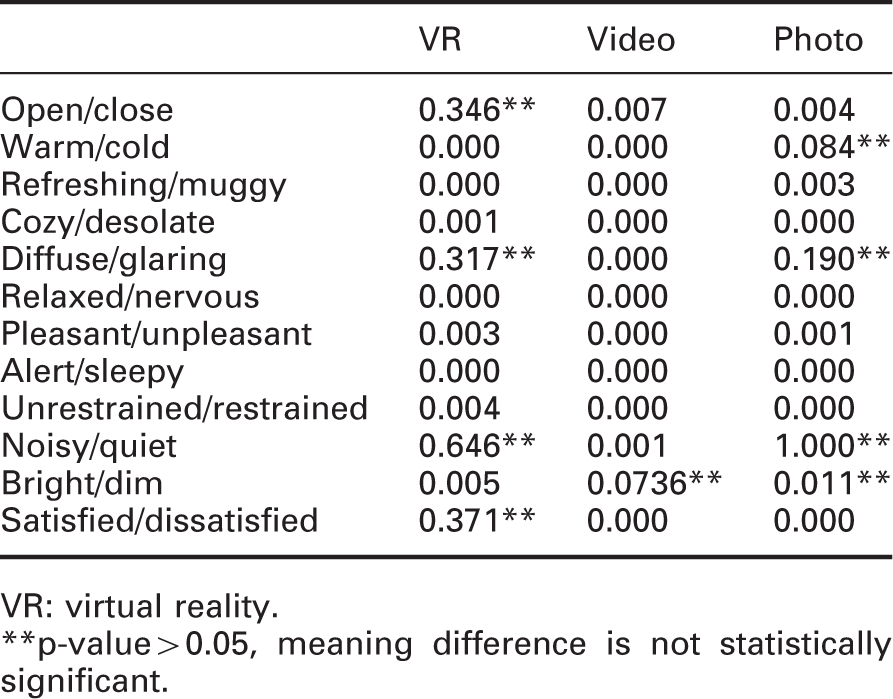
VR: virtual reality.
p-value > 0.05, meaning difference is not statistically significant.
3.3. Congruence analysis
Approximate congruence coefficients for each presentation mode
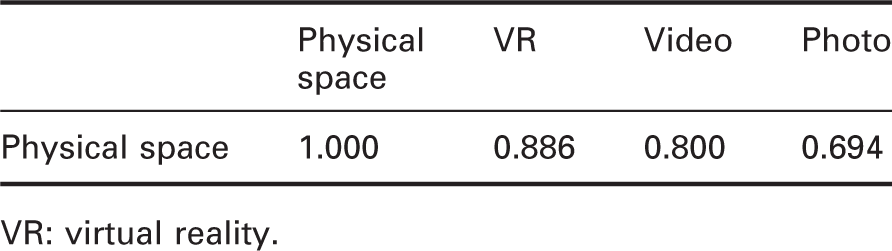
VR: virtual reality.
3.4. Overall satisfaction rating
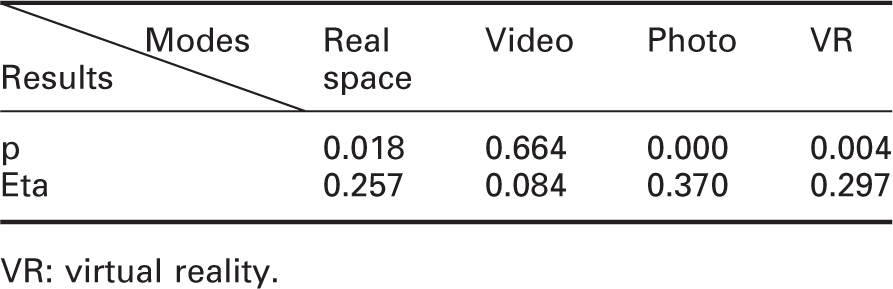
Figure 6 shows the values of mean overall satisfaction rating for the physical lighting scenes and the three reproductions. Among the three reproductions, the subjects were most satisfied with the lighting scenes presented by VR. The mean satisfaction score of physical lighting scene was 1.43, and the mean satisfaction scores of VR reproduction, video reproduction and photo reproduction were 1.23, 0.83 and 0.97, respectively. The mean satisfaction score of VR was very close to those of the reference scenes and far higher than those of videos and photos. To double check the results and analysis above and evaluate the significance of the presentation modes’ impact on satisfaction rating, data were analysed in SPSS, running an analysis of variance (ANOVA). As shown in Table 12, at 4000 K and 5500 K, p-values are both less than 0.05, whereas at 3000 K, the p-value is 0.061, slightly higher than 0.05, meaning that the satisfaction rating difference among presentation modes is significant. These results confirm the previous conclusions on overall satisfaction rating.
Mean overall satisfaction ratings Impact of presentation modes on satisfaction rating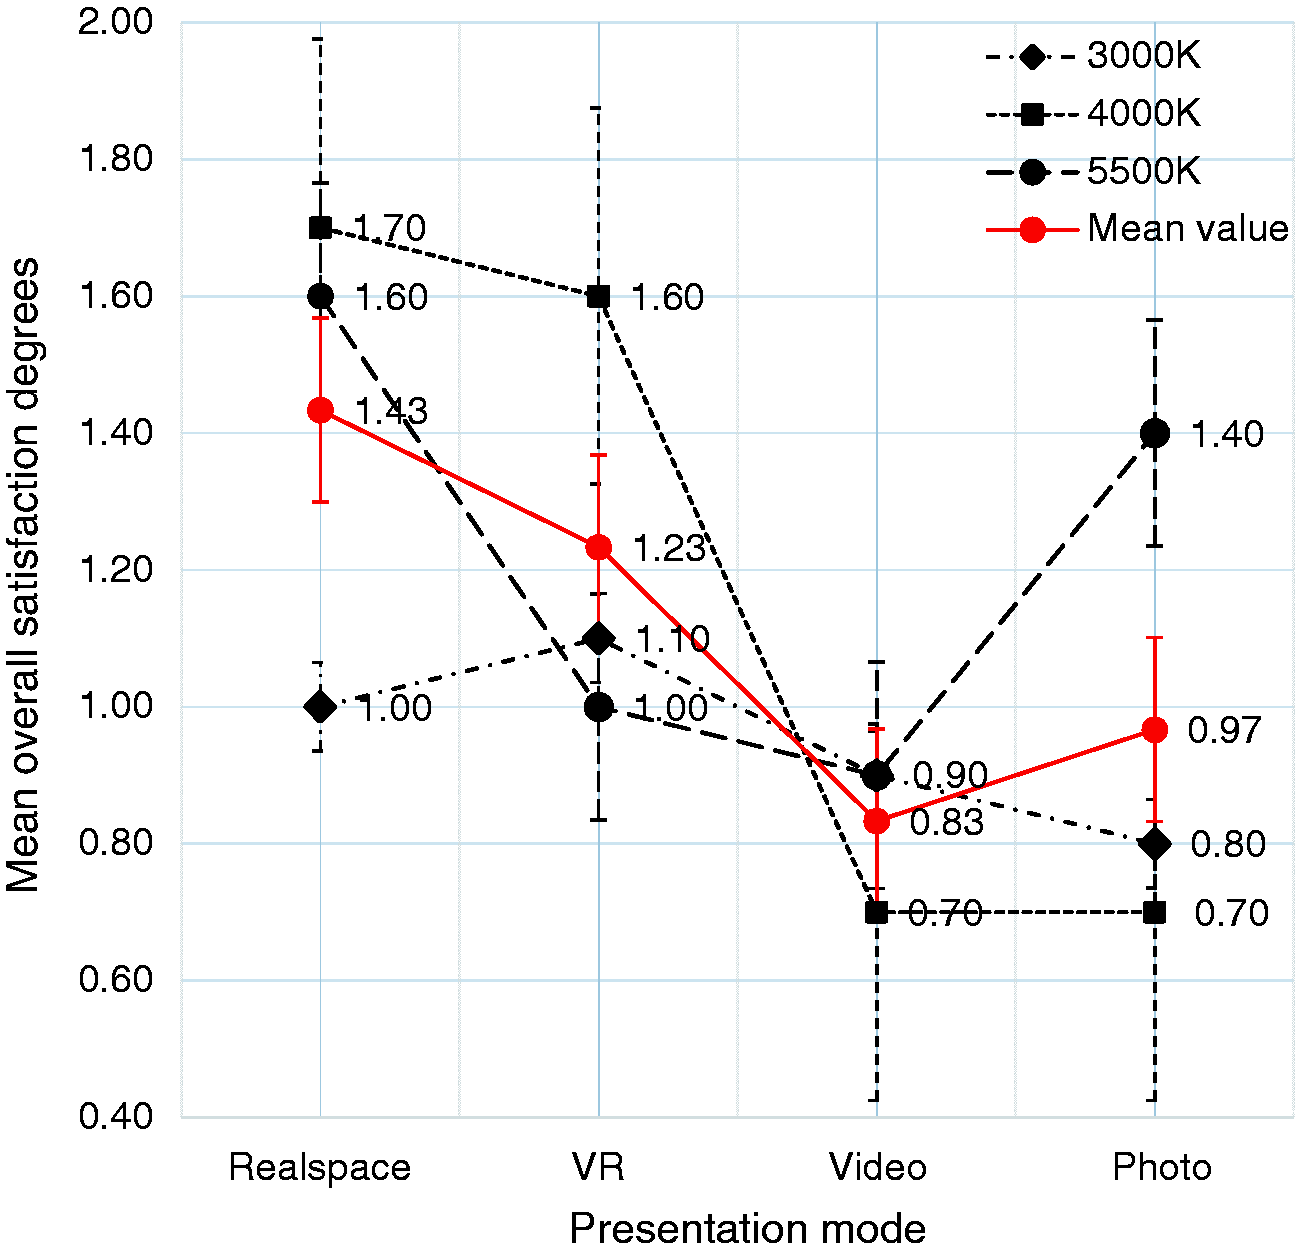
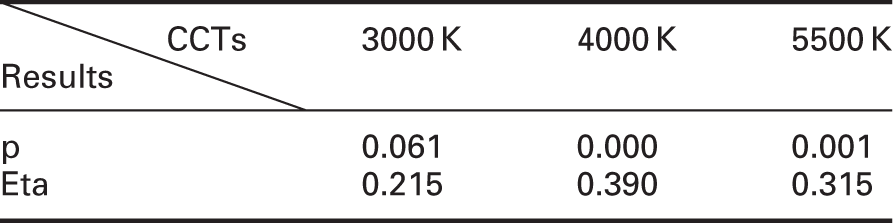
Impact of correlated colour temperature on satisfaction rating
VR: virtual reality.
4. Summary and conclusions
In this study, we compared human subjective feelings towards a physical lighting environment, an IVE lighting environment and a set of video and photo reproductions. Through a variety of data analyses, the following conclusions can be drawn:
The order of presentation-ability of the media is physical space > VR > video >photo; Compared to video reproductions and photo reproductions, an IVE shows higher congruence (approximate coefficient of 0.886) with physical scenes; VR can present the lighting attributes of open/close, diffuse/glaring, bright/dim and noisy/quiet consistently to its counterpart physical environment; the subjects are more satisfied with the VR reproductions.
Since VR can provide a more immersive environment that allows users to experience the environment from the first-person point of view, the novel display form of IVE was able to produce feelings that were very close to the true feelings of humans experiencing the actual physical scenes. The experimental results indicate that it is feasible to apply VR to represent lighting environments when evaluating lighting attributes such as open/close, diffuse/glaring, bright/dim and noisy/quiet. Moreover, to a certain extent, IVE can be used in some scientific investigations. With further development of VR technology, IVE will be able to accurately display a specific lighting scene, and so can be used in studies requiring increased precision.
Even though this study presented the results of a trial and preliminary experiments, the findings are quite reasonable. However, there still are many deficiencies that need to be solved in future studies, including the following.
In this experiment, the VR environment was recorded by a camera. Therefore, instead of a 3D model, the VR was presented in the form of a panoramic video. This surely compromised the rating of stereo and clarity. In the future, experiments can be performed to compare the congruence of different VR reproductions (recorded VR video and 3D immersive VR models) with the physical space. Since the VR equipment was quite simple, the subjects could do only very small movements (such as turning their heads) to feel their presence in the IVE. Moreover, the playback of the VR videos experienced some lagging. All of these technical deficiencies influenced the subjects’ evaluation. Therefore, in the next stage of the study, a 3D immersive VR model and advanced VR equipment can be introduced. Such improvements will allow the subjects to walk in the IVE, and perform other activities that can be conducted in a maturely developed IVE. As the recording and display equipment were not the same among the reproductions, there were differences in the resolution and colour inclinations among them. In the future, the photo, video and VR environments should be precisely designed to reduce these differences.
In conclusion, using VR to present lighting environments is more effective and reliable than using videos and photos. With the development of VR technology, the feasibility and reliability of applying VR in lighting research are expected to evolve.
Author Note
Y Chen is also affiliated to College of Architecture and Urban Planning, Tongji University, Shanghai, China.
Footnotes
Acknowledgements
We wish to thank all of the people who supported this study, including all of the members of the Luminous Environment Lab, Tongji University, Shanghai, China.
Declaration of conflicting interests
The authors declared no potential conflicts of interest with respect to the research, authorship, and/or publication of this article.
Funding
The authors disclosed receipt of the following financial support for the research, authorship, and/or publication of this article: the National Natural Science Foundation of China (Grant No. 51508396).