
Abstract
Substantial efforts have been made to develop new colour fidelity measures that are better correlated to perceived colour fidelity. Such measures minimize the possibility of increasing rated colour fidelity through spectral optimization without improving perceived colour fidelity. This paper reports a psychophysical experiment that was carefully designed to investigate how light sources with different spectral features affected perceived colour fidelity, and whether the effect can be reflected by the two existing colour fidelity measures (CIE Ra and Illuminating Engineering Society (IES) Rf). Fourteen observers evaluated the colour differences of eight physical colour samples under three pairs of light sources, which had similar IES Rf but different Ra values. IES Rf was found to perform better than CIE Ra.
1. Introduction
The Commission Internationale de l'Eclairage (CIE) General Colour Rendering Index Ra (colloquially, CRI) is intended to characterize the average colour fidelity of a light source. 1 First published in 1965 and unchanged since 1974, it has been an important metric in the lighting community. Lighting manufacturers have used it to develop lighting products; specifiers and users have relied on it to evaluate and compare products; and policy makers have included it in various specifications that have influenced the use of lighting products. CIE Ra, however, has been found to not predict perceived colour fidelity,2–6 and is incapable of predicting more subjective aspects of colour perception,2–4,7–12 such as colour naturalness, vividness, or preference. That is, CIE Ra is both inaccurate and incomplete, as acknowledged by CIE. 13 Its limitations have especially been exposed given the opportunities for spectral engineering afforded by LEDs.
In 2015, the Illuminating Engineering Society of North America (IES) published TM-30-15, IES Method for Evaluating Light Source Colour Rendition, which includes the Fidelity Index (Rf) among dozens of other measures. IES Rf is an updated measure of average colour fidelity, conceptually equivalent to CIE Ra,14,15 but functionally different due to improvements in the underlying calculation framework. 16 Later, CIE published 224:2017, 17 making minor modifications to IES Rf. The IES has since unified the measures, recently publishing ANSI/IES TM-30-18. 18 IES TM-30-15 Rf has been used in this work, but no differences would occur if IES TM-30-18 Rf/CIE Rf were used instead, 19 as the only notable difference is the scaling factor.
IES Rf specifically addresses the widely documented weaknesses of CIE Ra, such as the colour space non-uniformity and colour sample spectral non-uniformity.15,16 Nonetheless, some have argued that IES Rf was not significantly different from CIE Ra 20 or not worth adopting. Others have since demonstrated large and meaningful differences between IES Rf and CIE Ra, examining real and theoretical light sources, 19 a small number of real light source possibilities, 21 or numerous real light sources in an experimental setting.3,4 In particular, Windisch et al. 21 noted some of the practical effects of these differences related to LED manufacturing and energy efficiency, calling for extra scrutiny on how each measure relates to perception.
Some of the differences between CIE Ra and IES Rf have been examined by psychophysical experiments. For example, several experiments did not find that Rf was better correlated to perceived fidelity (note: the colour samples used in the experiments were not replaced in the calculation),6,22 while others supported that Rf is a more accurate measure of colour fidelity5,6,22 and that Rf is more useful in combination with other measures for understanding subjective qualities of illumination.3,4,7,23,24
Typical white LEDs utilize a “blue”-emitting InGaN chip with a phosphor coating that converts part of short-wavelength “blue” radiation into longer wavelengths. An additional “red” InGaAlP chip is sometimes added to improve the colour rendition of an LED package. Different blue InGaN or red InGaAlP chips have different peak wavelengths, so the spectral power distribution (SPD) of a white LED can be easily adjusted or tuned to achieve a higher colour fidelity score. For example, it was found that a 13-point difference in IES Rf can be produced by simply shifting the peak wavelength of a blue InGaN LED from 450 to 442 nm. 21 Though the effect of small changes in the SPD of a light source on colour fidelity is important to LED products, only two studies have investigated this issue. Windisch et al. 21 found through simulations that the blue InGaN peak wavelength had a stronger influence on IES Rf than on CIE Ra, while the red InGaAlP peak wavelength had a stronger influence on CIE Ra than on IES Rf. Smet et al. 16 also performed simulations and similarly found that the CIE U*V*W* colour space, which is used in CIE Ra, has a lower sensitivity to short wavelength shifts than CAM02-UCS. However, it is unknown how the effect suggested by these simulations relate to human perception, outside of the composite dataset used to develop CAM02-UCS. This study was carefully designed to experimentally investigate how small changes in the SPD of a light source, causing little changes to IES Rf but large changes to CIE Ra, affected perceived colour fidelity.
2. Method
2.1 Light source SPDs
Seven different light sources were produced using 14-channel spectrally tunable devices comprised of LEDs with peak wavelengths between 350 and 700 nm. The intensities of the 14 channels were carefully adjusted to produce nearly metameric light sources — one reference and six test light sources — with a nominal correlated colour temperature (CCT) of 3500 K and a Duv of 0.000.
The reference light source was designed to simulate a 3500 K Planckian radiator with high CRI Ra (97) and IES Rf (96) values. Three pairs of test light sources were designed to have different SPDs, with very similar IES Rf values (between 0.4 and 4.2 points different) but very different CIE Ra values (between 7.7 and 9.4 points different, with one above and one below 80). Specifically, the two light sources in each pair used LED channels with small differences in peak wavelength in one region: “blue” (445 or 450 nm), “green” (510 or 525 nm), or “red” (640 or 660 nm). The SPD of each light source is shown in Figure 1, and colorimetric characteristics are provided in Table 1. These SPDs were measured in situ with a diffuse reflectance standard and a calibrated JETI specbos 1411 spectroradiometer.
Relative spectral power distributions (SPDs) of the light sources measured in the viewing booth with a diffuse reflectance standard and a calibrated JETI specbos 1411 spectroradiometer. They were scaled to an equal lumen output. Colorimetric characteristics of the light sources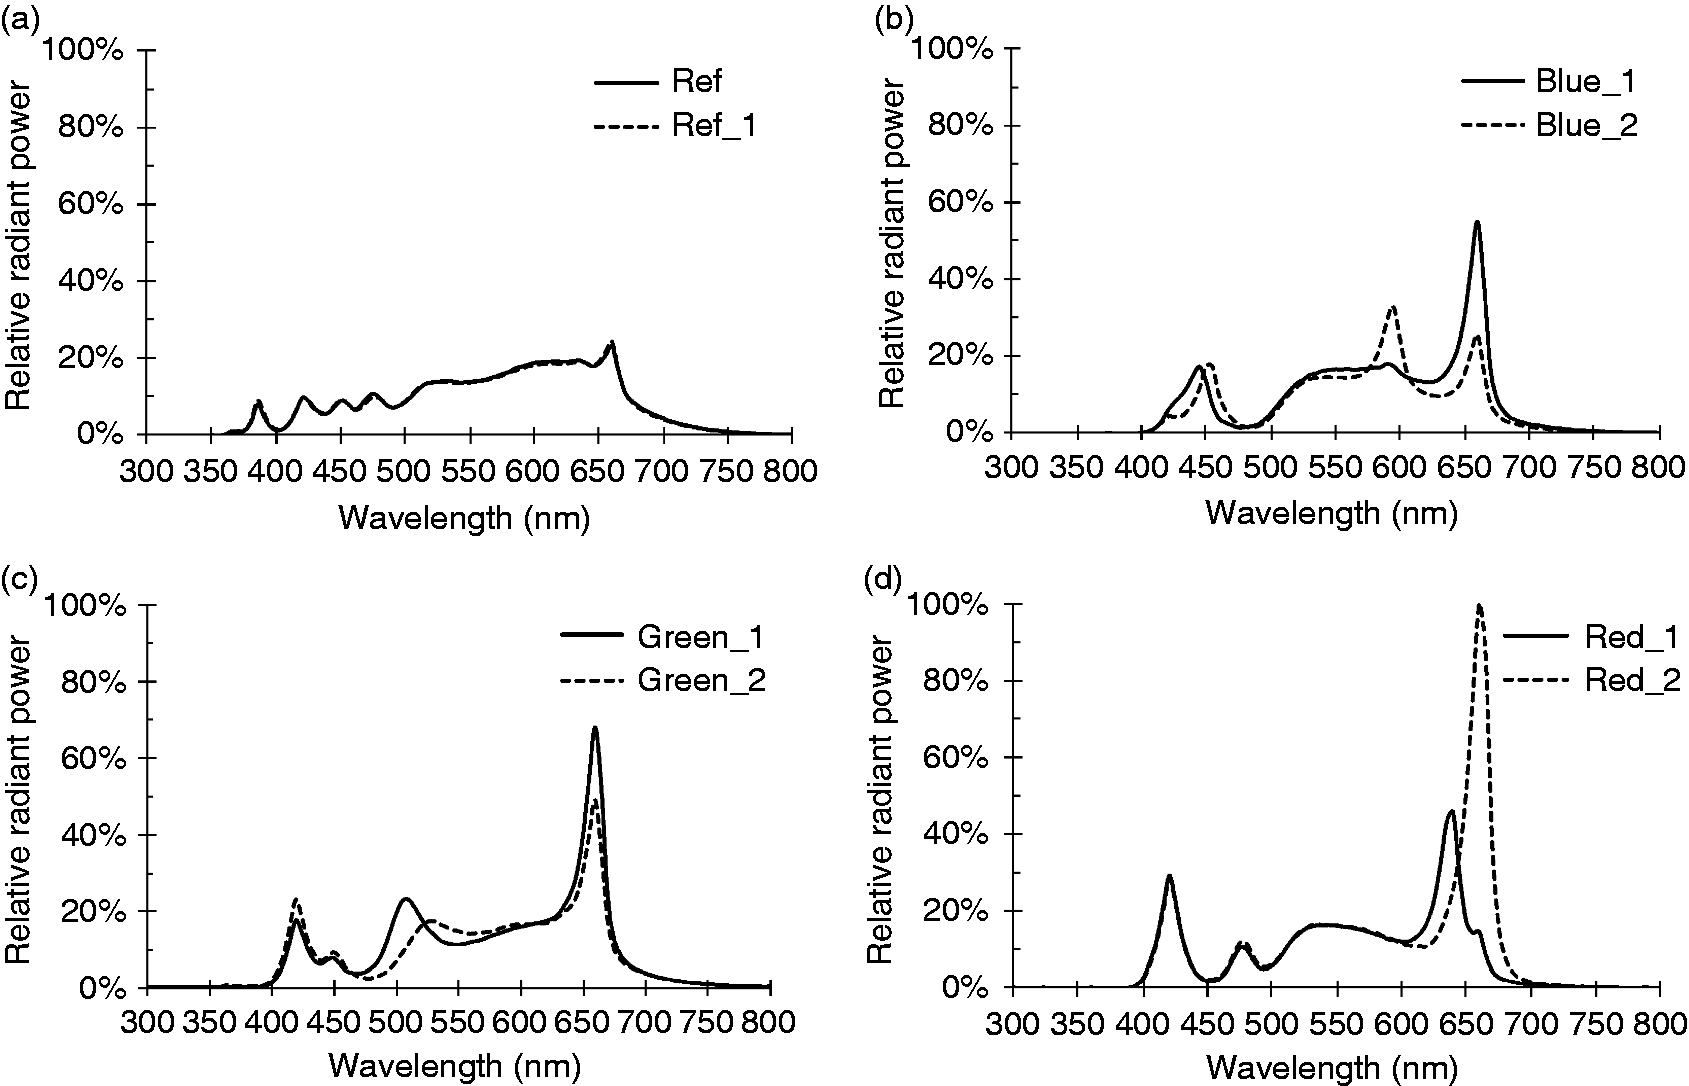
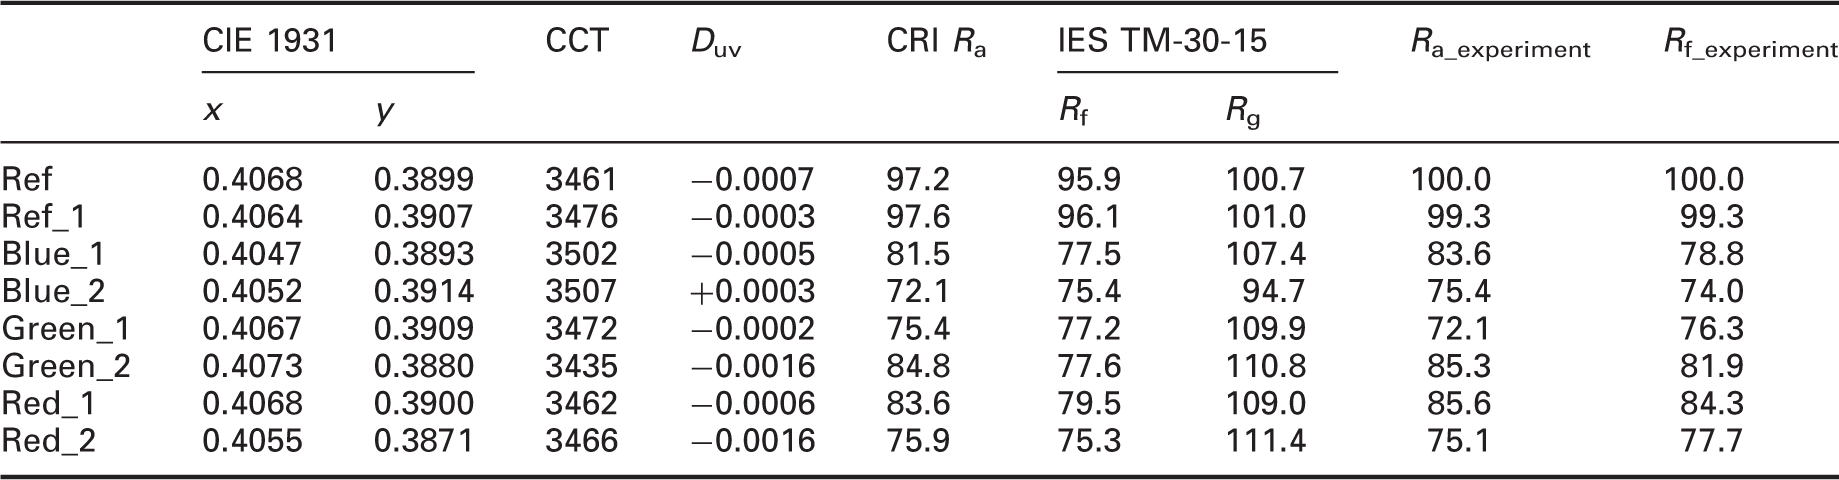
In order to better correlate the colour fidelity values of these light sources to the experimental results, custom colour fidelity values, Ra_experiment and Rf_experiment, were also determined. These measures were calculated by replacing the standardized colour samples and reference illuminant with those used in the experiment, as well as adjusting the scaling factor so that CIE Standard Illuminants F1–F12 had an average colour fidelity value of 75.1 for both measures,1,14,15 following the scaling procedure used in IES TM-30-15.
2.2 Apparatus and colour samples
Two identical viewing booths, with dimensions of 50 cm (width) × 50 cm (depth) × 60 cm (height) and interiors painted with Munsell N7 spectrally neutral paint, were placed side-by-side. A spectrally tunable LED device (described above) was placed above each booth to provide approximately uniform illumination at 1000 ± 20 lux on the bottom surface, with the equivalence of the booths verified with high dynamic range imaging.
Eight pairs of colour samples (denoted HL1 to HL8) purchased from Sun Chemical were presented to the observers. Figure 2 shows the spectral reflectance distributions measured using a calibrated Xrite Pro 1 spectrophotometer and the CAM02-UCS (a′, b′) coordinates of the samples under CIE Standard Illuminant D65. The samples were placed in the two booths symmetrically, as shown in Figure 3.
Colorimetric characteristics of the eight colour samples (denoted HL1 to HL8). (a) Spectral reflectance distribution (SRD) and (b) chromaticities of the eight colour samples, together with the colour samples used in IES Rf, CRI Ra, and CQS Qf calculations, under CIE Standard Illuminant D65 in the a′–b′ plane of CAM02-UCS. Side-by-side viewing booths used in the experiment, with the chin-rest being removed for this photograph. The left booth was always under the reference light source. The greyscale card in the left booth was used to aid the colour difference evaluation (available in colour in online version).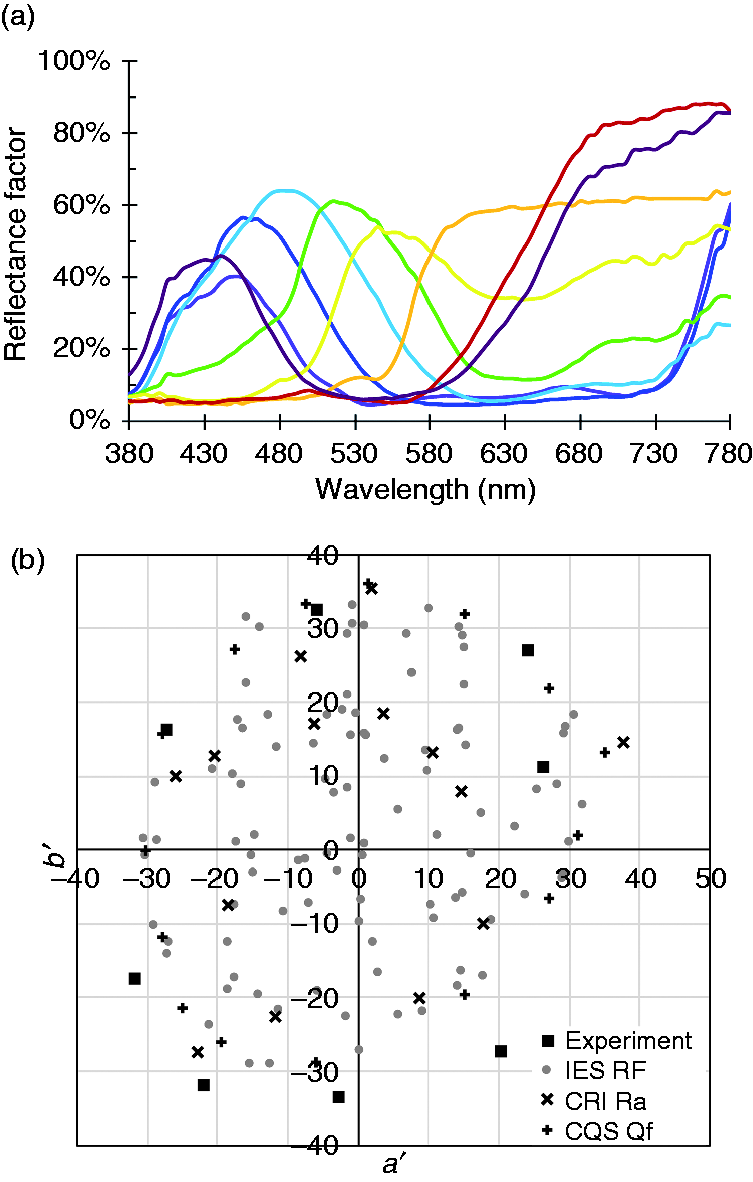
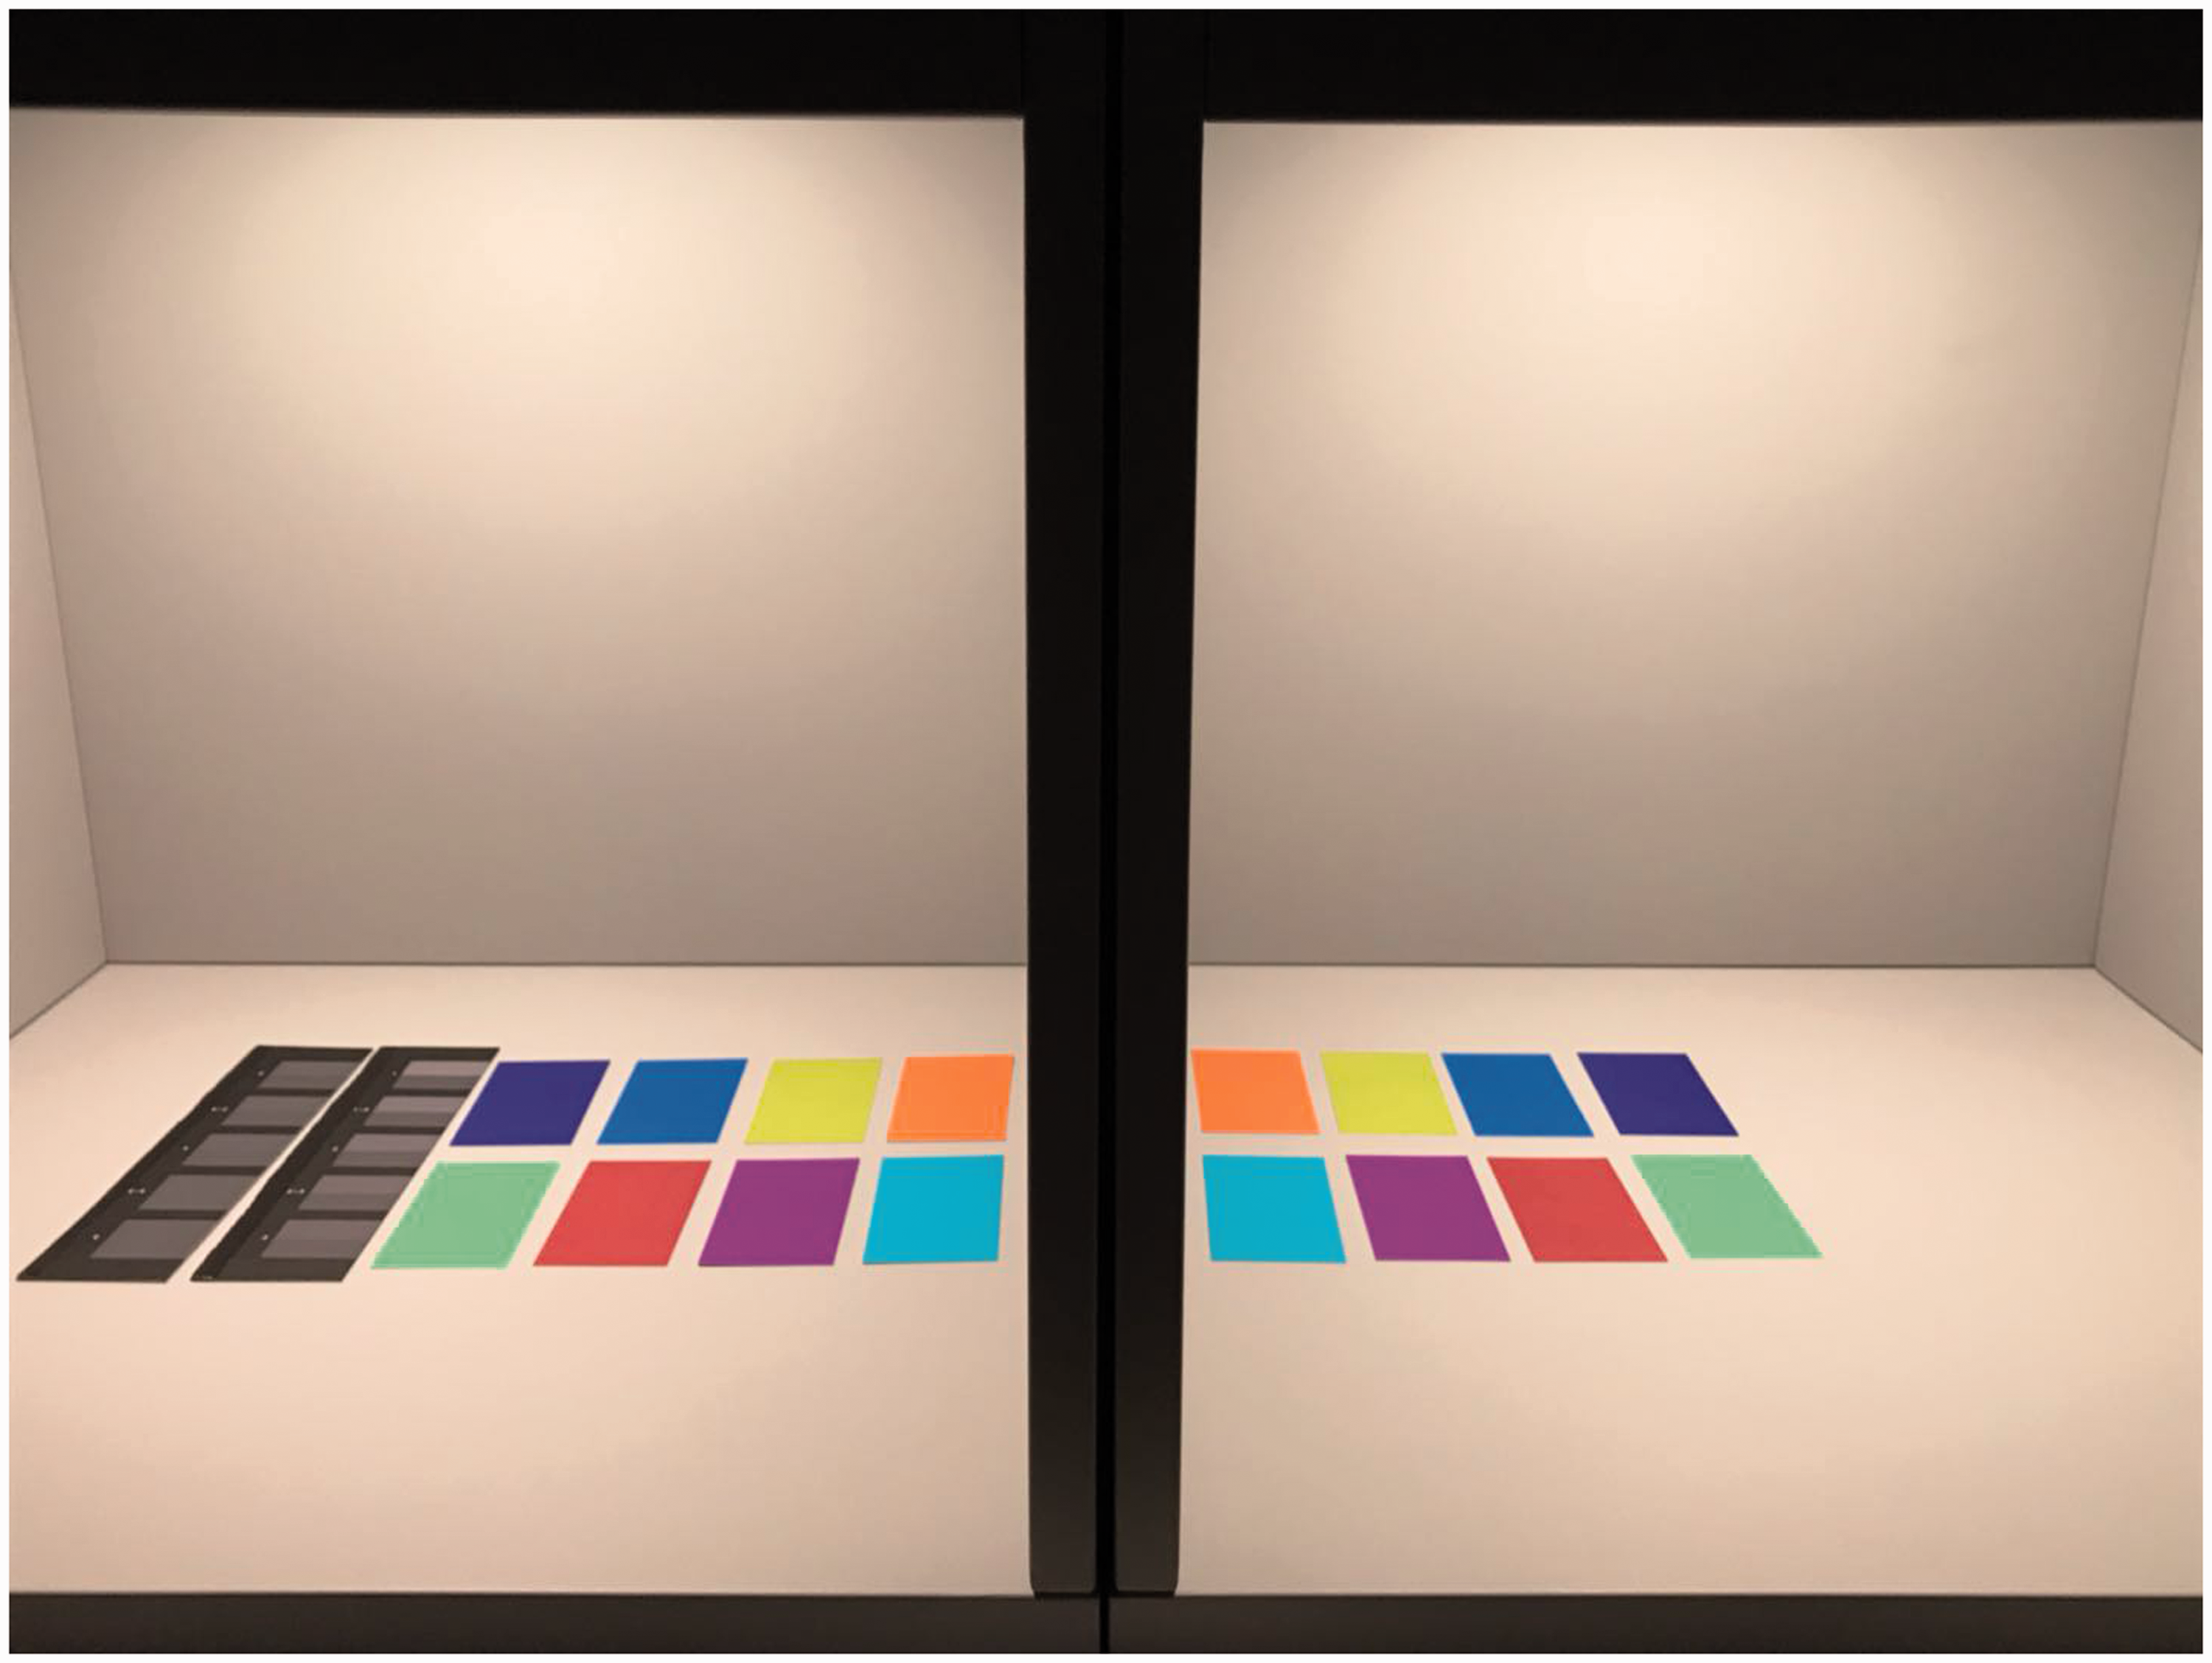
A greyscale card including 10 pairs of samples was placed in the left booth to aid the colour difference evaluation. This technique has been widely used in past studies investigating colour differences.22,25–27 These 10 pairs had different amounts of colour difference, as conveyed to the observers with a numbered scale printed on the card. The ratings ranged from 1 to 5 with a half point interval, with a greater value for a smaller difference. Note that this scale was the reverse of colour difference value in colorimetry, where a greater values indicates a greater difference.
To minimize variations, the test light sources were always shown in the right booth and the reference light source was always shown in the left booth; this also allowed for stable colour appearance and colour differences for the greyscale card. An additional reference light source, labelled as ‘Ref_1’, was created in the right booth for carrying out a null condition evaluation.
2.3 Observers and experimental procedure
Fourteen Chinese observers (12 males and 2 females) between 20 and 28 years of age (mean = 21.6 years, SD = 2.03 years) participated in the study. All of them had normal colour vision, as tested by the Ishihara Colour Vision Test.
Upon arrival, each observer completed the Ishihara Colour Vision Test and a general information survey, and then the experimenter explained the general procedure. After the observer was escorted to the viewing booths, the ambient illumination in the room was switched off, so that only the booths were illuminated by the experimental LED devices. The observer was seated in front of the booths with his or her chin placed on a chin rest. The observers' sagittal plane was aligned with the panel between the two booths to form a haploscopic viewing condition, so that his or her two eyes were individually adapted to the illumination in each booth.
The observer was asked to look into the booths for 2 minutes, with the reference light source in the left booth and a randomly selected test light source in the right booth, to chromatically adapt to the illumination. During this time, the experimenter explained the task to the observer. After the 2-minute adaptation period, the observer was asked to observe the colour appearance of the samples in the two booths, rating the colour difference of each colour-sample pair using the scale established with the greyscale card. Each observer made the colour difference evaluations under nine pairs of light sources, including a practice trial, a null condition trial that had the reference light source in both booths, six trials that had a test light source in the right booth, and a repeated trial that had a test light source in the right booth for evaluating intra-observer variation. After the initial practice trial, the light source pairs were presented in a random order. The entire experiment took 45 minutes for each observer. In total, there were 1008 evaluations (i.e., 14 observers × 9 pairs of illuminants × 8 pairs of samples).
3. Results and discussion
3.1 Inter- and intra-observer variations
Both intra- and inter-observer variations were characterized using the standardized residual sum of squares (STRESS), with the intra-observer variation comparing the evaluations made by each observer under the repeated trials and the inter-observer variation comparing all the evaluations made by each observer and the mean evaluations (i.e., an average observer). The lower the STRESS value, the smaller the variation. The STRESS values for the intra-observer variation ranged between 9.61 and 26.10, with a mean of 18.10; the STRESS values for the inter-observer variation ranged between 9.64 and 26.31, with a mean of 16.48. The range and the mean STRESS values for both intra- and inter-observer variations were much smaller than past studies evaluating colour differences,5,6,22 suggesting that the experimental results were highly reliable.
3.2 Perceived colour fidelity
The perceived colour fidelity of each light source was characterized using the average rated colour difference of the eight samples from all the observers, as shown in Figure 4, with a higher rating indicating a higher perceived colour fidelity (note: the rated colour difference values were not rescaled and subtracted from 100, as is typically done for computing colour fidelity). Figure 5 shows perceived colour fidelity versus the calculated colour fidelity for the six test light sources, using both standard ((a) and (b)) and custom ((c) and (d)) colour fidelity calculations.
Average perceived colour difference, together with the 95% confidence interval, of the eight samples under each light source in comparison to the reference SPD, with a greater value for a smaller colour difference. Perceived colour fidelity vs. calculated colour fidelity for each pair of light sources. (a) Ra; (b) Rf; (c) Ra_Experiment and (d) Rf_Experiment.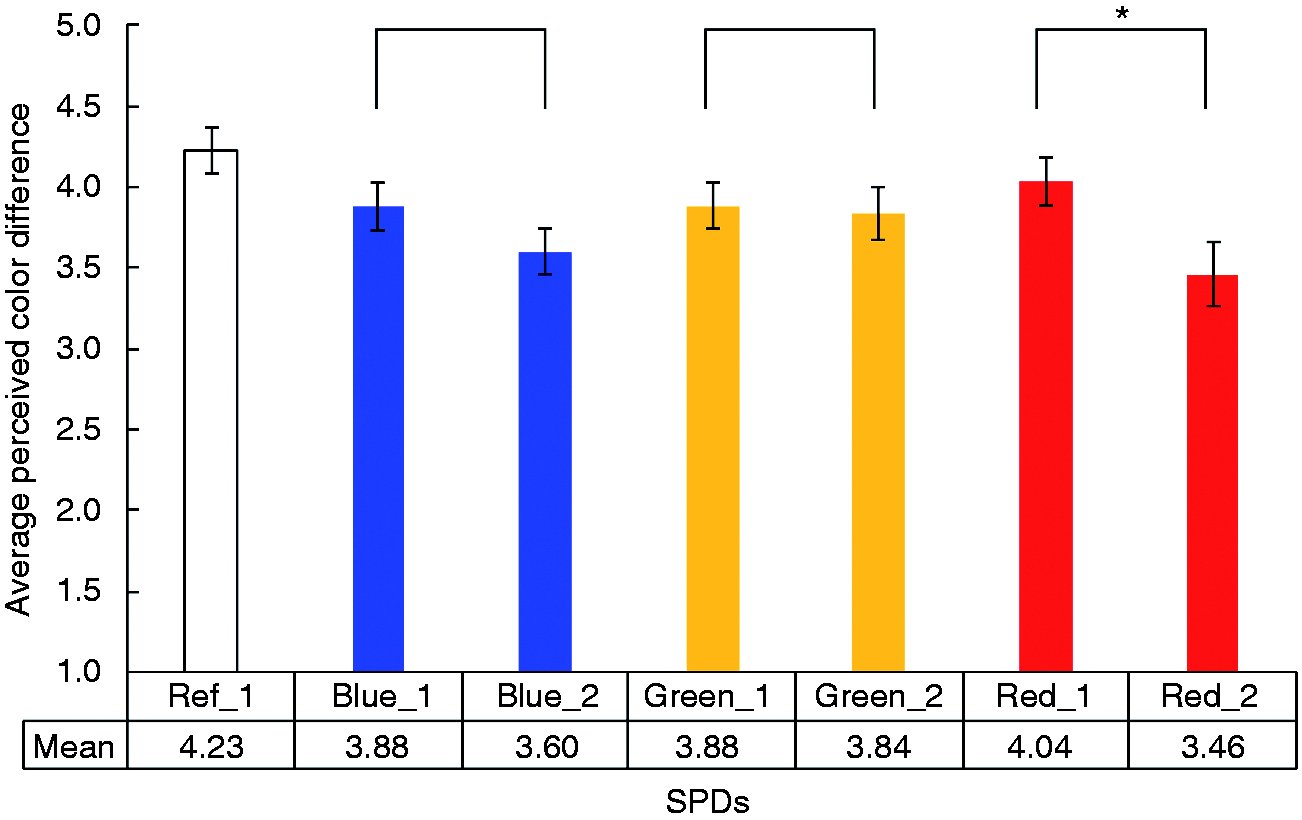

All three pairs of SPDs had smaller differences in both Rf and Rf_experiment, and larger differences in both Ra and Ra_experiment. The experimental results shown in Figure 4, however, illustrate that only the pair of Red_1 and Red_2 had a significant difference in perceived colour fidelity. This pair had the largest differences in Rf and Rf_experiment, supporting IES Rf as a more accurate measure of colour fidelity. When spectral uniformity of the test colour samples was eliminated as a factor by replacing the standardized samples with those used in the experiment, the performance of Ra_experiment was still much worse than Rf_experiment. This implicates the non-uniformity of CIE U*V*W* as an influential limitation of CIE Ra, corroborating other research.5,6,16,19
Of particular note is the pair of Green_1 and Green_2. Like the blue pair, it showed no significant difference in perceived colour fidelity, but the correlation between perceived and calculated colour fidelity was actually slightly negative in all cases. This pair had the smallest difference for colour fidelity calculations using the IES Rf framework, and the largest difference in colour fidelity calculations using the CIE Ra framework.
To translate these results into practical advice, differences of up to 10 points for CIE Ra resulted in no perceived difference in colour fidelity, whereas the equivalent value for IES Rf was approximately 3 points. It was not the intent of this work to develop these thresholds, however, so they should not be considered representative of results for a broader range of sources.
3.3 Individual sample colour differences
The correlation between calculated colour differences and perceived colour differences for individual colour samples was also examined, using both CIE U*V*W* and CAM02-UCS. These two colour spaces (and associated chromatic adaptation transformations) are those used in CIE Ra and IES Rf calculations, respectively. Both sets of comparisons are shown in Figure 6, with the Pearson correlation coefficients summarized in Figure 7. The more negative the correlation coefficient, the stronger the correlation – the rated values used the convention of a greater value indicating a smaller colour difference. It can be observed that colour difference calculated in CAM02-UCS and CIE U*V*W had a similar average correlation to the perceived colour difference, but there were notable differences for individual colour samples HL2 and HL4.
Perceived colour difference vs. the calculated colour difference for each colour sample in (a) CAM02-UCS and (b) CIE U*V*W*. Pearson correlation coefficient between the perceived and calculated colour differences for each sample in CAM02-UCS and CIE U*V*W.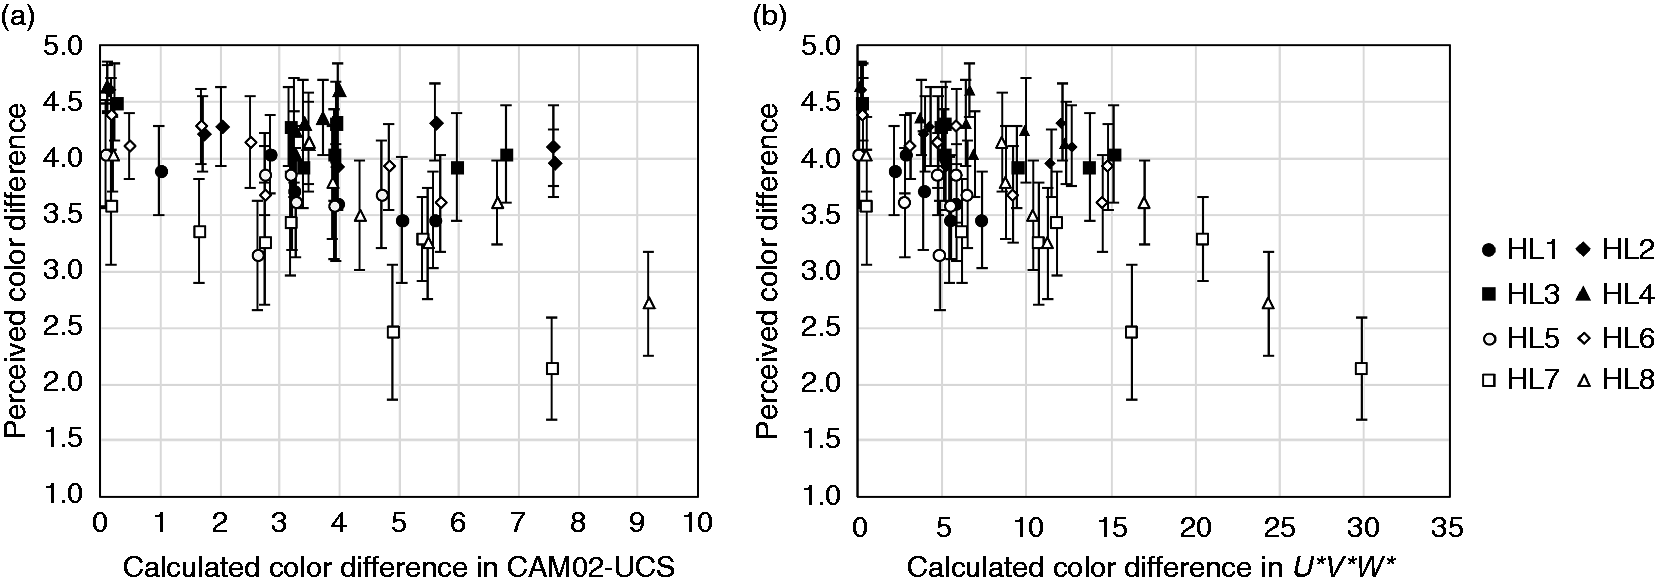
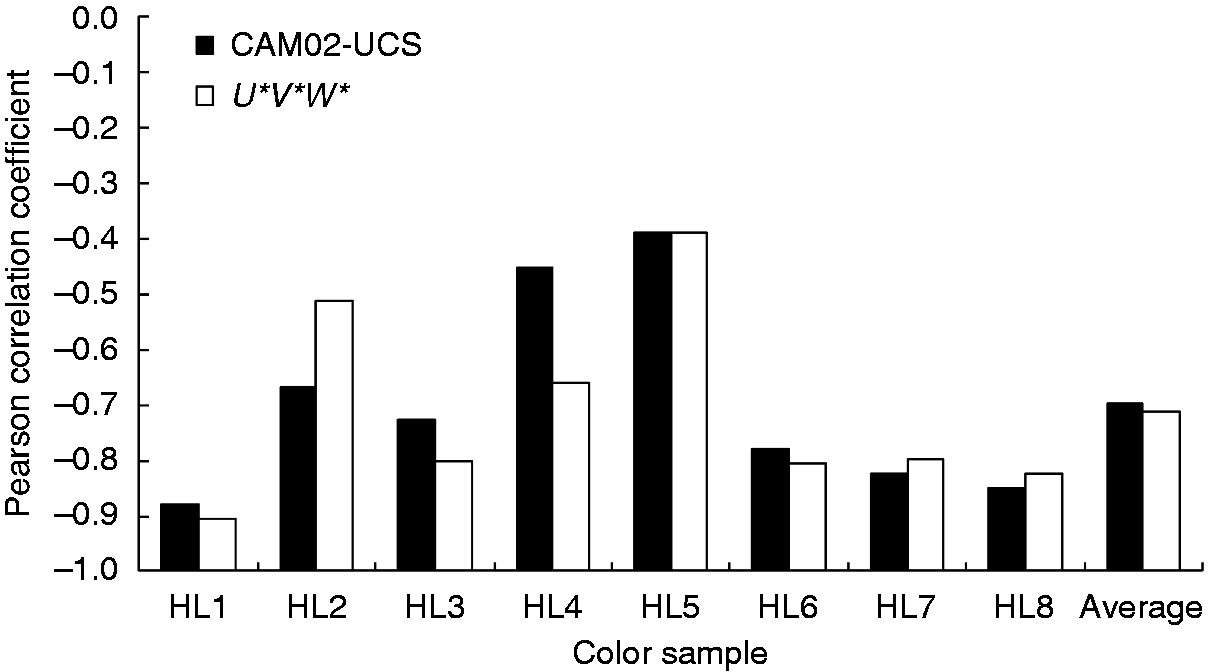
CAM02-UCS had a much higher correlation than CIE U*V*W* for HL2, which is nominally blue (having a high reflectance between 430 and 480 nm). Such a better performance of CAM02-UCS for samples with a high reflectance in this range was never experimentally investigated before, but it is critically important to typical white-light LEDs.
Windisch et al. 21 noted that Rf is sensitive to small changes in the short-wavelength region, whereas CIE Ra is not. This experiment confirms that Rf is the more accurate representation. The use of CIE Ra allows for more flexibility in binning and is more lenient as an InGaN chip's emission changes with temperature, but it masks real changes in colour fidelity. (The outcome of these changes on subjective evaluations is a separate question, which requires consideration of measures beyond colour fidelity.)
3.4 Uniformity of colour spaces
As shown in Figure 8, the perceived colour difference between Red_1 and Red_2 was mainly due to the individual differences for colour samples HL7 and HL8 (nominally red and purple, respectively). Although the perceived colour difference of HL7 under Red_1 compared to the reference was similar to the other colour samples, the calculated colour difference of HL7 in CIE U*V*W* was much larger, as shown in Figure 9(a). In addition, though the colour differences of HL7 and HL8 under Red_2 versus the reference were rated larger than those under Red_1, the calculated colour differences of these two samples seemed to be overestimated in CIE U*V*W*, as shown in Figure 9(b). It can be concluded that CIE U*V*W* colour space generally enlarged the colour difference along red–green axis (i.e., a′ axis in CAM02-UCS and U* axis in CIE U*V*W*), which caused a larger colour difference in comparison to CAM02-UCS. This discrepancy between CAM02-UCS and CIE U*V*W* in characterizing the colour difference matches has been identified theoretically by others.16,19 It may be greater at lower CCTs and less at higher CCTs than the nominally 3500 K examined here.
16
Perceived colour difference, together with the 95% confidence interval, for each sample between Red_1 and the reference SPD and between Red_2 and the reference SPD. Calculated colour difference for each sample under (a) Red_1 and (b) Red_2 in comparison to the reference SPD along the red-green axis in CAM02-UCS and CIE U*V*W*.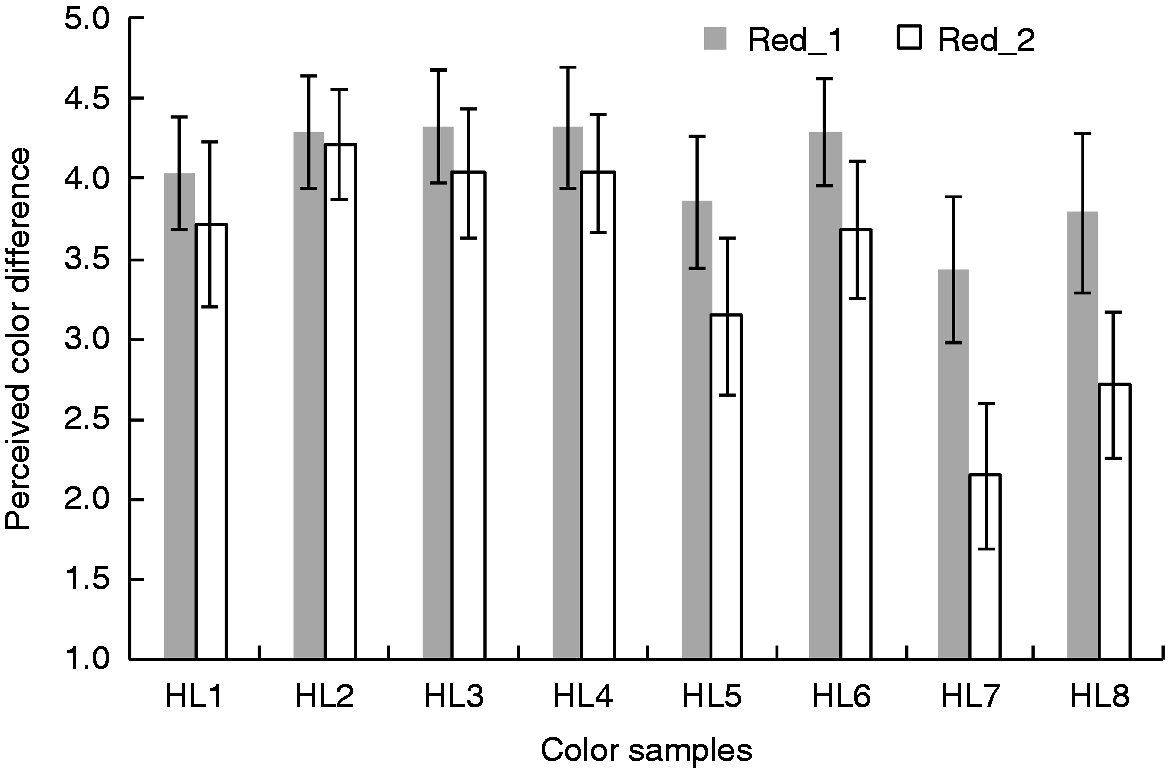
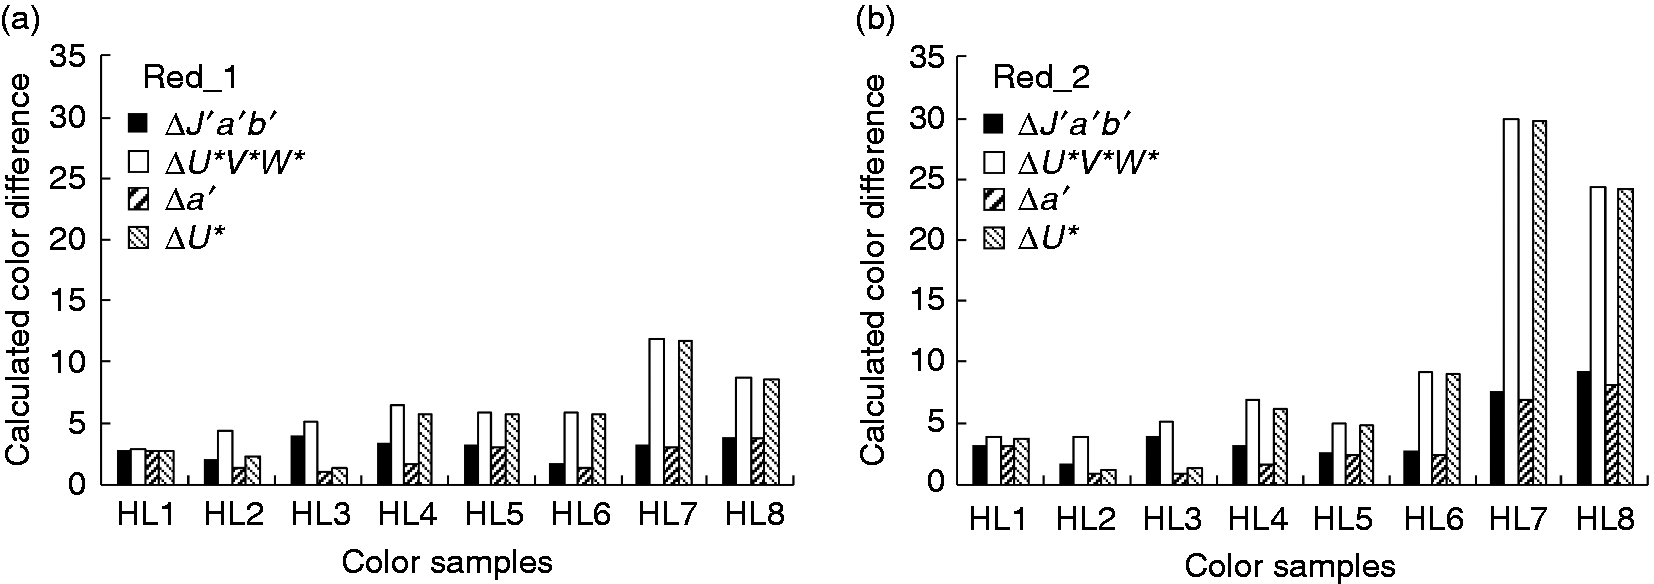
For the six test light sources in this study, the average magnitude of the colour shift in comparison to the reference illuminant was 3.50 units in CAM02-UCS, with 0.827, 2.768 and 1.492 units in the J′, a′ and b′ directions, respectively. In contrast, the average magnitude was 2.23 units in CIE U*V*W*, with 0.828, 7.036 and 2.032 units in the W*, U* and V* directions. In other words, CIE U*V*W* colour space is more sensitive to a colour shift along the red-green direction but less sensitive to a colour shift in the yellow-blue direction, in comparison to CAM02-UCS; this explains the stronger effect of red InGaAlP chips on CRI Ra than on IES Rf reported by Windisch et al. 21 This is also consistent with current recommendations regarding CIE R9 (saturated red), for which much lower values (larger colour differences in CIE U*V*W*) are considered acceptable.
4. Conclusion
Three pairs of light sources were carefully designed to have different SPDs, similar IES Rf values but very different CIE Ra values. The similarity of average perceived colour differences for each pair of light sources suggested better performance of IES Rf with respect to human perception. Furthermore and in particular, the pair that had a small peak wavelength difference in the nominally red wavelength region revealed that CIE U*V*W*, used in calculating CIE Ra, overestimated the colour shifts versus perception along the red-green axis, which is particularly important to subjective qualities of illumination. In short, the findings reported in this paper suggested a higher robustness of IES Rf in evaluating white LED colour fidelity.
Footnotes
Declaration of conflicting interests
The authors declared no potential conflicts of interest with respect to the research, authorship, and/or publication of this article.
Funding
The authors disclosed receipt of the following financial support for the research, authorship, and/or publication of this article: The Public Policy Research Funding Scheme from Policy Innovation and Co-ordination Office of the Hong Kong Special Administrative Region Government (Project Number: 2017.A6.091.18A). The contribution of Michael Royer was supported by the U.S. Department of Energy Solid-State Lighting Program.