
Abstract
The spectral power distribution (SPD) is the true fingerprint of a light source and is mainly dependent on electrical and thermal loading. Both the photometric and colorimetric quantities are originally extracted from SPD. Therefore, the dynamic prediction of SPD for LED has become an important aspect to evaluate the performance of LED during its time of operation. Generally, the statistical models are used to predict SPD. However, the statistical model with more than two input makes the system complex and time demanding. Artificial Neural Network (ANN) models, on the other hand, can help with this problem. The major goal of this research is to improve the utility of ANN in lighting applications. This is demonstrated by various neural network (NN) structures referred as models 1, 2 and 3 with combinations of varied neurons and hidden layers (HLs) to forecast SPD for various electrical and thermal stress levels at zero hours. The results are compared and based on absolute prediction error (APE) set to 5%, model 1 is considered as the best model for the SPD prediction. In addition, the time-based SPD prediction with model 1 is investigated using temperature, wavelength and time as input parameters for the LED luminaire and is validated.
1. Introduction
Solid-state lighting sources are proved to be more superior to conventional light sources due to their remarkable advantages such as long life, high luminous efficacy, lower power consumptions, free from IR and UV waves, small volume, high-speed response and wide range of controllability over traditional light sources. 1 LED is a semiconductor device, consists of a chip as the central element that produces light in a PN-junction due to electrons and holes recombination. In many cases, this recombination is a radiative process that generates a photon whose wavelength is defined by the material’s bandgap. At the chip level, LED consists of semiconductor materials. The semiconductor material and the quality of the epitaxial layers play a significant role in estimating light emission. A little change in driving current causes a significant difference in light output. Since the output of an LED is proportional to the driving current.1,2 In general lighting applications, most of the LEDs used are white. LED manufacturers use various approaches to produce white light. Currently, blue LED chip with yellow phosphor is the prevalent and popular method used by the manufacturers because of its simplicity in construction, easy to control and low cost. Lighting devices based on a phosphor converted-White LED (pc-WLED) replace conventional light products such as fluorescent and incandescent lamps. However, along with the power ratings, correlated colour temperature (CCT) and colour rendering index (CRI), users are even more concerned about reliability, which lacks in manufacturer information to select the right LED from various manufacturers available in the market. Moreover, the actual life of LED is less than what is defined from manufacturer prediction analysis.3,4
The studies Padmasali and Kini.5,6 demonstrated that the failure of LED is the key factor in the whole LED luminaire system’s short lifespan, which includes the driver, optics and other components in use. LEDs shorter lifespan can be attributed to significant degradation under high thermal, electrical and humidity conditions. Thus it becomes very apparent that the reliability of LEDs is vital to gain user confidence. The Illuminating Engineering Society proposed L70 standard to define the lifetime of an LED.
3
However, L70 was not sufficient to predict the lifetime of a product recommended to applications such as shopping malls, supermarkets and museums where colour stability plays an important role. A colour-based lifetime estimation analysis is introduced with
Currently, accelerated life tests are conducted on LED devices for reliability estimation. The light output in lumen and chromaticity changes are considered as performance indicators in LED’s life estimation and are measured at each test readout time. Moreover, both the photometric and colorimetric quantities such as luminous flux, xy colour coordinates, CRI and CCT are originally estimated from spectral power distribution (SPD). The influence of chromaticity on subjective colour quality judgments was investigated.
9
The results indicated that absolute SPD of light sources with radiometric values and
Various studies related to improving the colorimetric and photometric quantities have been performed based on the design and optimization of SPD. The failure mechanisms of LEDs could be identified with the extracted features of SPD achieved through statistical curve fitting such as Gaussian and Lorentz models. Furthermore, a particle-filtering method is used to accurately predict colour coordinates, which is further used to estimate the residual colour lifetime of the selected pc-WLED. 12 The SPD of a pc-WLED can be modelled by superimposing two asymmetric double sigmoidal functions. 13 The Gaussian, asymmetric double sigmoidal, and Lorentz model are commonly used statistical models.14–16 Song and Han 17 developed a method to estimate the blue and phosphor-converted light radiant fluxes separately by applying SPD de-convolute approach. These radiant fluxes are further used to investigate the failure mechanism of pc-WLED by estimating the yellow to blue ratio and phosphor conversion efficiency. Song and Han 18 quantifies the effect of each degradation mechanism on the final values of CRI, CCT and lumen based on SPD through a hybrid analytical/experimental procedure.
From various studies, it is clear that the nature of SPD contributes majorly to understand the failure mechanisms of LED devices. The photometric and colorimetric quantities such as luminous flux and colour coordinates considered as performance indicators in analysing LED lifetime can be estimated from the SPD. Therefore, the dynamic prediction of SPD of white LED as a function of time has become a challenging topic in illumination applications, and white LED design aspects.
There are various statistical models such as Gaussian, asymmetric double sigmoidal, superimposing of two asymmetric double sigmoidal functions and Lorentz model used to model the SPD. Moreover, these models are not used for the prediction of SPD for various electrical and thermal stress levels. However, Dupuis et al. 19 developed an SPD Prediction model using mathematical low order polynomial function considering only the current as input parameter. Chang et al. 20 proposed multiple peak fitting techniques to extract the SPD features. Furthermore, principal component analysis is applied to estimate the test duration required to predict the lifetime of a LED. The study found that the test duration of 1200 hours can be used to estimate the lifetime of a LED. Both Dupuis et al. 19 and Chang et al. 20 studies used luminous flux, extracted through SPD in estimation of lifetime. The SPD prediction follows mainly two steps. Firstly, extract SPD features using Gaussian function so that number of inputs can be reduced. Secondly, models are developed to predict each extracted SPD feature. Later, luminous flux is extracted and lifetime is predicted though reconstructed SPD. But, this procedure requires more time and expectation of data loss while extraction of SPD features. And the statistical models with more than two inputs makes the system complex and time demanding. However, this issue can be addressed with Artificial Neural Network (ANN) models.
Botero et al. proposed a low-cost RGB sensor used to create a technique for classifying light sources and selecting an estimating model for CRI and CCT.
21
The findings reveal that the error was less than 3.6% when using a K-Nearest Neighbor classifier. The model estimation error was 1.2%, 0.09% and 1.8% for incandescent light sources, fluorescent light sources and LED sources, respectively. Botero et al.
22
designed a low-cost spectrometer with a resolution of 5 nm in the visible spectrum, which was constructed using an ANN to address the cost of typical spectrometers. The reconstructed SPD has a less than 2% margin of error. Deeb et al.
23
presented a method for determining light’s spectral reflectance and power distribution from a single RGB picture of a V-shaped surface using a convolutional neural network (NN). Furthermore, the paper asserts that spectral reflectance estimate under unknown illumination is more accurate than physics-based methodologies under known SPD lighting. Kaiyuan et al.
24
showed a life prediction method through multidimensional back propagation NN considering different electric currents and ambient temperatures. The luminous flux data measured are used for the study. Fan et al.
25
proposed dynamic prediction of SPD using machine learning (ML) at any stress levels. Back propagation (BP) and genetic algorithm back propagation (GA-BP) algorithms are used. The designed NNs consist of current and temperature as two input neurons, one output neuron with each Gaussian parameter extracted from SPD, and one hidden layer (HL) having seven neurons. Song and Qian
26
proposed a NN-based life prediction model for two different kinds of LED. The LEDs electrical and optical characteristics were considered in the model. Fluorescence efficiency, light quantum number, luminous flux, and ideal factor are used as input factors in the model, with LED life as an output variable. The results have a precision of less than 5% and 30%, respectively, for mean square error and maximum absolute error. Liu et al.
27
recommended to use ANN to simplify photo electro thermal (PET) from a multiphysics field problem, this results in a single physics field issue. The results showed that using a simplified PET model, temperature distribution analysis was performed using the finite element approach with a temperature inaccuracy of ±0.3 K. According to the findings, the ANN simplified PET model can be utilized as a reference tool for designing the best thermal dissipation structure for LED lamps. Liu et al.
28
demonstrated that ANN can predict the lifetime of a multi-chip high-power LED light source based on the precise LED temperature distribution. Finite element method with LED chip PET ANN is used to calculate the temperature distribution of the high power light source. Cao et al.
29
proposed the BP and GA-BP methods to estimate the luminous flux of an LED array with a precision of more than 98.5% and a short train time. Yuan et al.
30
used deep ML techniques to create a gated network with a two-step learning algorithm to build an empirical relationship between the design parameters, thermal ageing loading and luminous output of LED products. The validation of luminous data from multiple LED chip packaging reveals that the maximum differences in CCT and colour coordinate are 2.6% and 1.0%, respectively. Using low-cost sensors, Botero et al.
31
proposed an approach for estimating
Based on the literature survey, the application of ANN to SPD prediction of solid-state lighting systems is not carried out extensively. The performance of different models of ANN is not explored to yield accurate results which can be further considered for reliability studies to understand the behaviour of optical performance and device characteristics. In this paper, an ANN-based data-driven method to predict the full spectrum SPD of commercially available LED is studied. Three models are considered which are different in terms of number of inputs, hidden layers (HLs) and neurons. The results are analysed for prediction accuracy and the best model is suggested.
The rest of the paper is organized as follows: Section 2 introduces ANN theory and models used in this study. Section 3 presents the LED test sample specifications, experimental setup for data collection, and validation approach for models used in this study. Section 4, presents the comparative analysis of results followed by discussions. Section 5, demonstrates further validation of the chosen approach through LED luminaire reliability analysis. Finally, Section 6, provides the conclusions and scope for future work.
2. Theory and models
The SPD of LED is indicative of the relationship of spectral density with wavelength. The nature of SPD changes when the LED is subjected to electrical and thermal stresses. The information of spectral changes in life test could be one of the methods for reliability estimation in solid-state lighting applications. Therefore, an approach to the prediction of SPD plays a vital role in developing a model-based life estimation technique. The ML approach is an alternate way to the statistical characteristic parameter extraction in predicting SPD and helps to make decisions or predictions through a mathematical model of training data constructed by mathematical algorithms defined in ML. Before deploying the ML algorithm, the accuracy of predictions is evaluated, and ML algorithms will be trained repeatedly, if accuracy is not within the acceptable range. There are three types of ML algorithms namely unsupervised learning, supervised learning, and semi-supervised learning, which differ in their approaches. Supervised learning is used in this study. Supervised learning is a type of ML task that relates a new input to output with the help of actual input-output data. The training data consist of a set of input objects and corresponding output values. Even though various supervised ML methods exist, ANN has been proven as a more effective and widely used method in various non-linear behaviour applications.
ANN can directly or indirectly figure a predictable output of a product or system from a mathematical representation of the product or system resulting from observation data rather than a physical understanding of the failure processes. The significant benefit of ANN is that, it can be used without any assumption regarding the functional form of the underlying system behaviour model. The other advantages of ANN include: it does not require prior knowledge of any mathematical models; can model non-linear systems efficiently; and it takes less training time.32,33 The study proposes an ANN-based data-driven method with different models as given in Table 1 to predict the full spectrum SPD of white LEDs used for general illumination applications.
Details of various NN models used
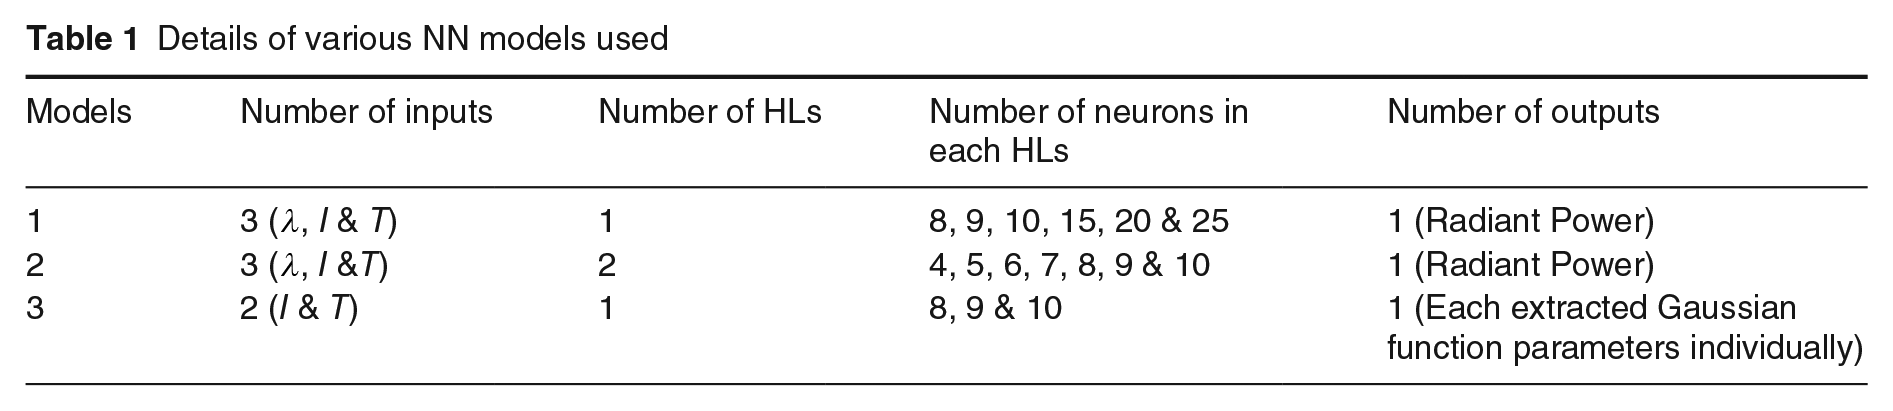
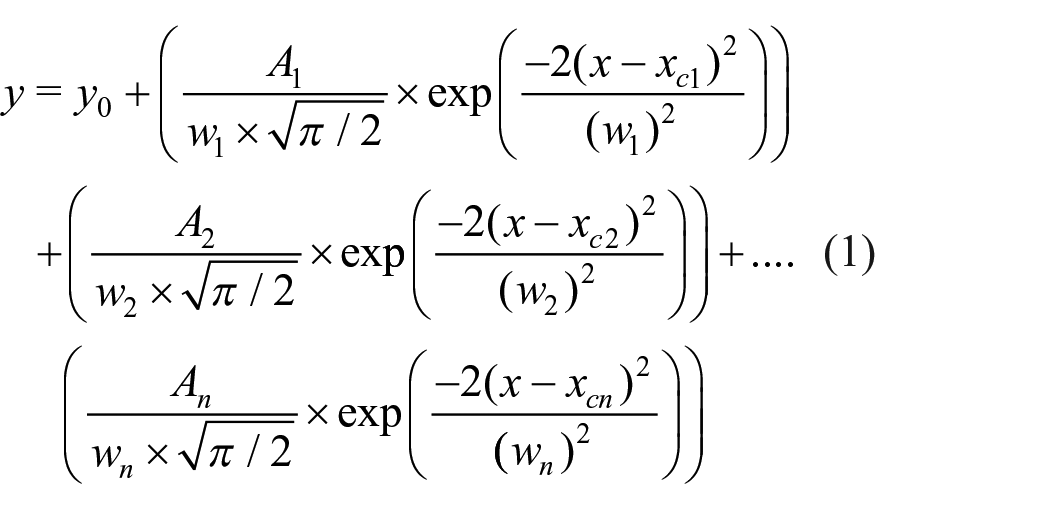
The different NN models predict the SPD of LED under test at various electrical and thermal stress levels. Validation of the proposed approaches is performed by extracting the luminous flux from SPD, and performance is presented in terms of absolute prediction error (APE). The typical NN structure with single HL is depicted in Figure 1. The NN structure is made up of three major component namely an input layer, a hidden (processing) layer and an output layer. In a structure, the variables ‘n’, ‘q’ and ‘m’ denote the number of neurons in the input, hidden and output layers, respectively. Figure 2 shows the three different NN models used in this study. Both model 1 and model 2 use the wavelength, current and temperature as inputs and are referred as λ (nm), I (mA) and T (°C), respectively, for further discussions. In this study, the temperature and current levels are referred as thermal and electrical stress levels, respectively. The radiant power (µW/nm) is considered as the output parameter. The differences between model 1 and model 2 are the number of HLs and the number of neurons in each HL represented as N-X, where X is the number of neurons. The model 3 uses the current and temperature as inputs and to exclude the wavelength from inputs, the SPD of an LED can be modelled using various functions. Among various functions, a simple Gaussian function can be used as expressed in Equation (1) to extract parameters of SPD. 25
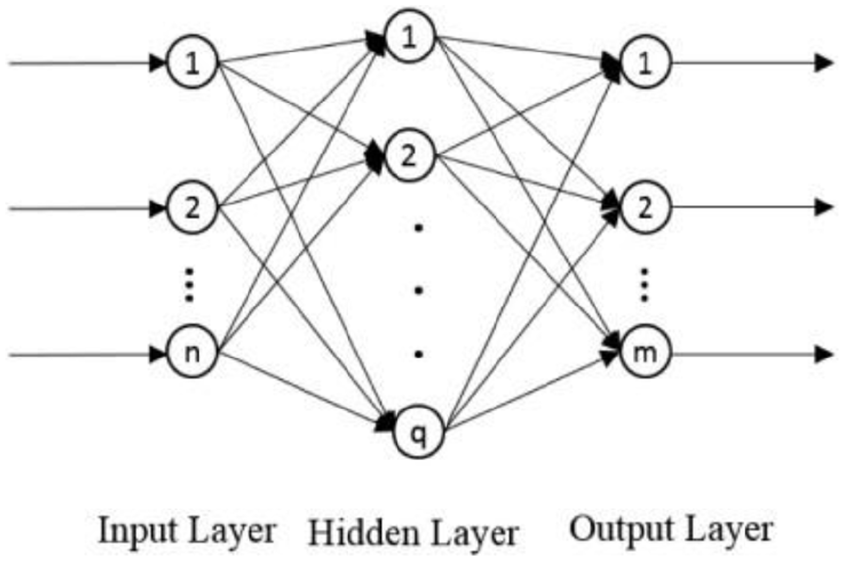
NN structure with single HL 25
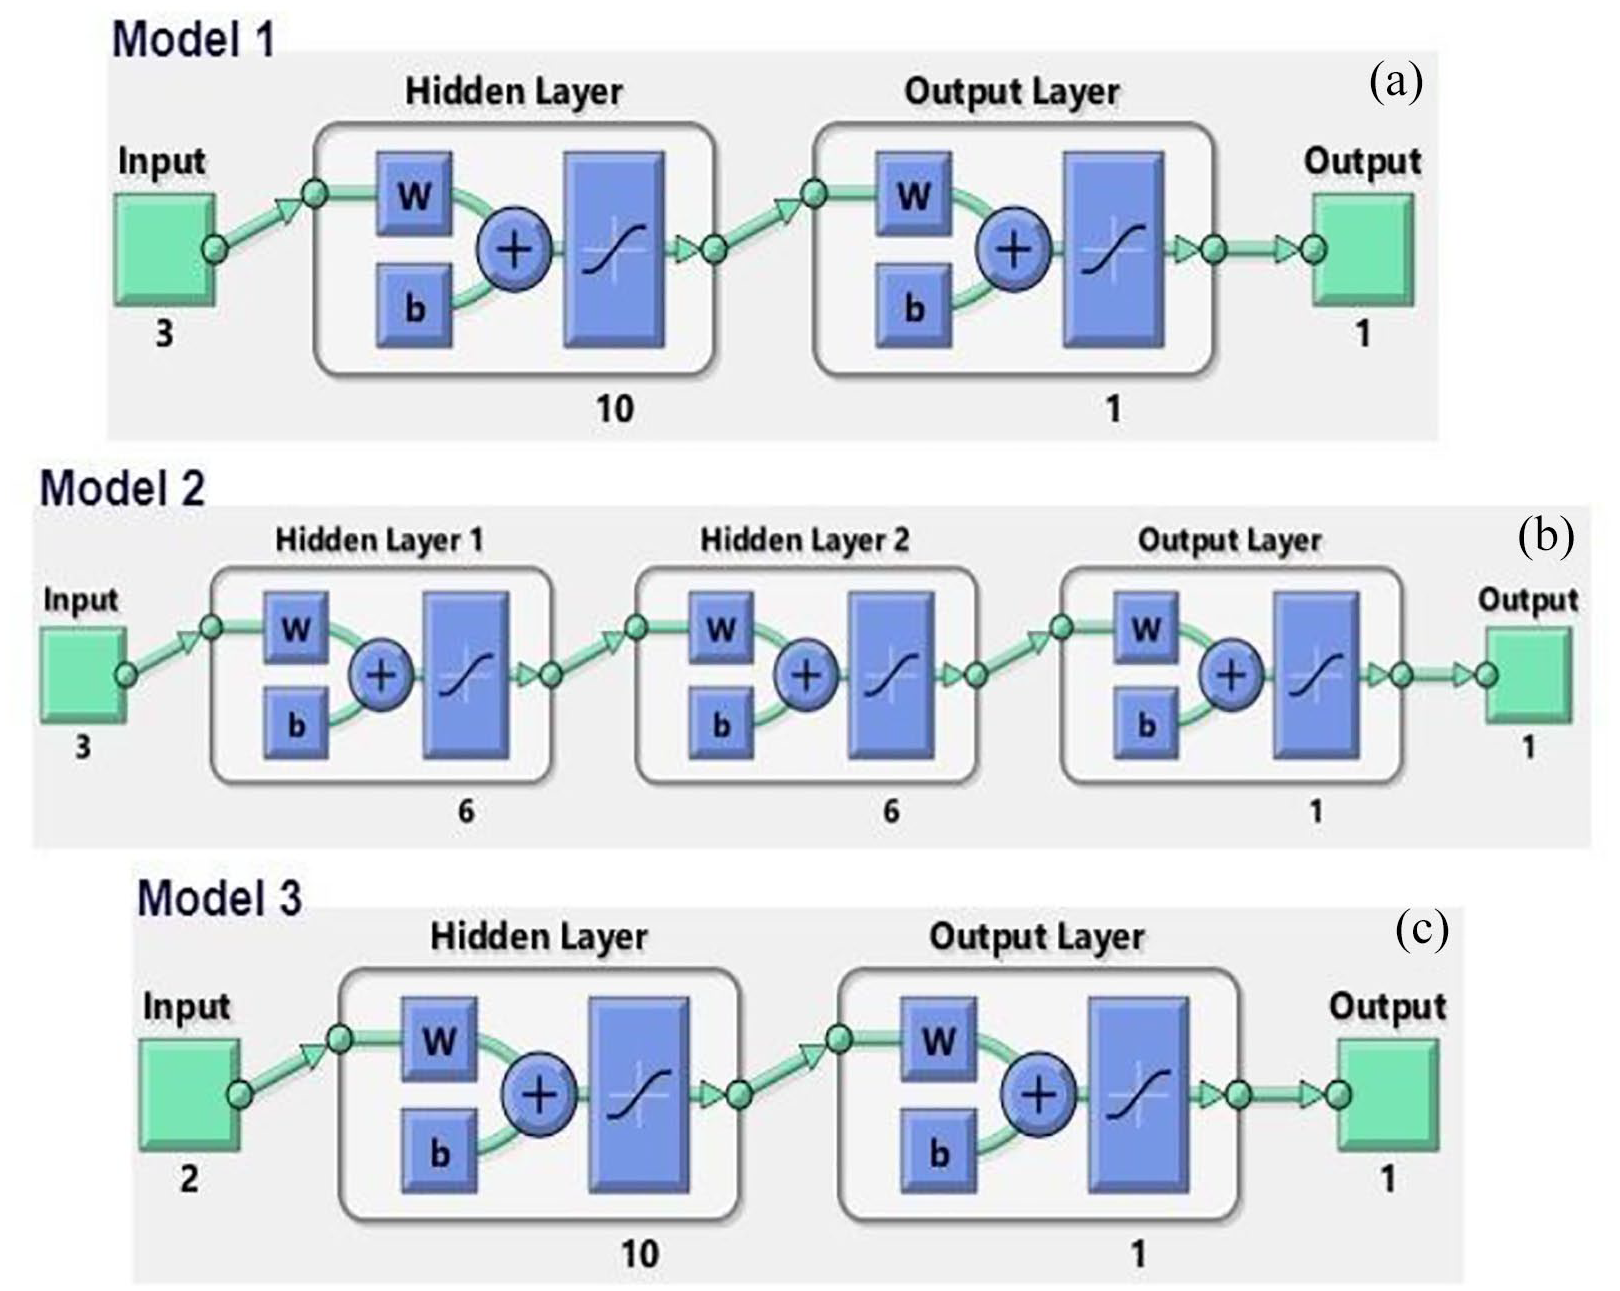
NN with (a) model 1: three inputs, one HL, multiple neurons in HL and one output, (b) model 2: three inputs, two HLs, multiple neurons in each HL and one output and (c) model 3: two inputs, one HL, multiple neurons in HL and one output
where
3. Data acquisition
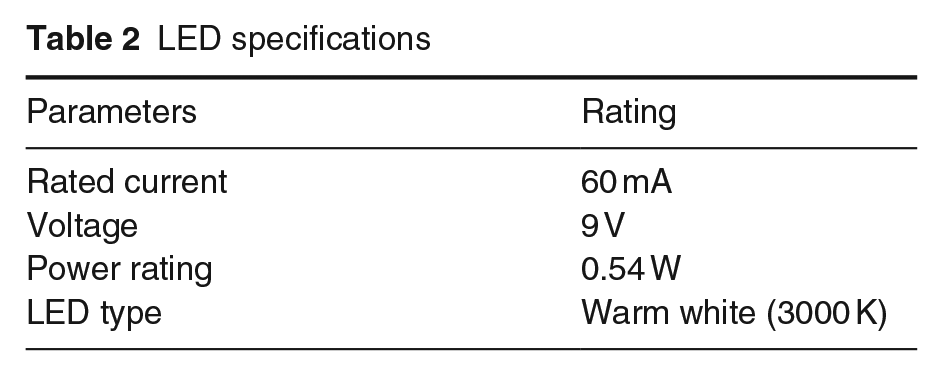
Figure 3 shows the typical LED sample used for the study. Data are recorded for 10 identical LEDs and its average values are used for the analysis. The specifications of the LED is given in Table 2. Figure 4 shows the experimental setup used for SPD data measurement. Experimentally, the SPD data are collected with the temperature ranging from 10 °C to 110 °C in steps of 10 °C and current ranging from 4 mA to 88 mA in steps of 4 mA. At each stress level, SPD data of LED are measured using 0.5 m diameter illumiaPro LabSphere which has a wavelength accuracy of less than ±0.3 nm with a resolution of 1 to 1.4 nm for the spectral wavelength range from 350 nm to 1050 nm and uncertainty in luminous flux measurements of ±3%. A total of 220 sets of SPD data are collected for the study, which excludes the randomly selected test scenarios used for the further validation of the models and to illustrate the accuracy of the models. The randomly selected test scenarios are listed in Table 3, which reveals that good variations in temperature and current levels are considered for the study.
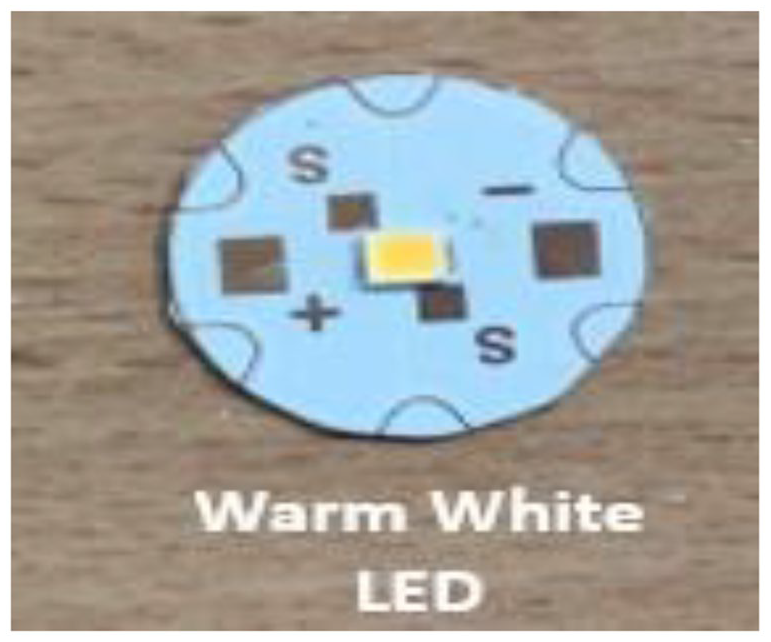
LED mounted on printed circuit board
LED specifications
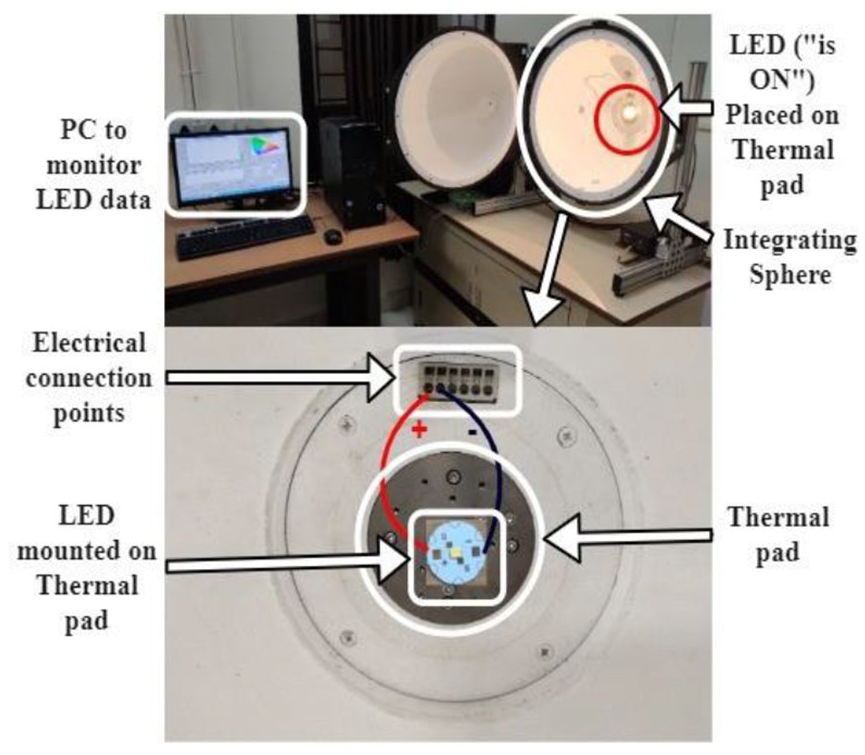
Experimental setup
Test scenarios used in this study
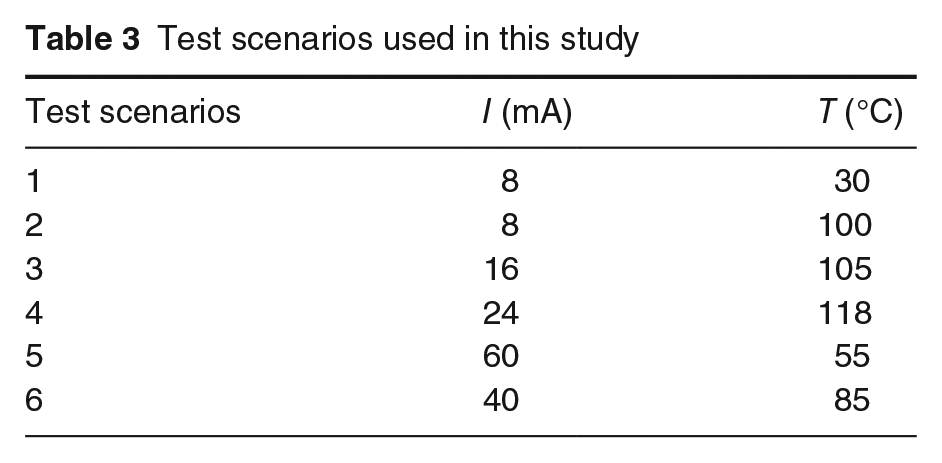
Figure 5(a) shows the SPD nature of selected samples operated under various drive currents at a fixed case temperature of 30 °C, and it is observed that SPD raises as drive current increases. On the other hand, Figure 5(b) shows the SPD drop under various case temperatures at fixed drive current of 60 mA. The results shows that temperature impacts negatively on the radiant power emitted from the LED. From above results it is clear that SPD produced from an LED is dependent on both current and temperature.
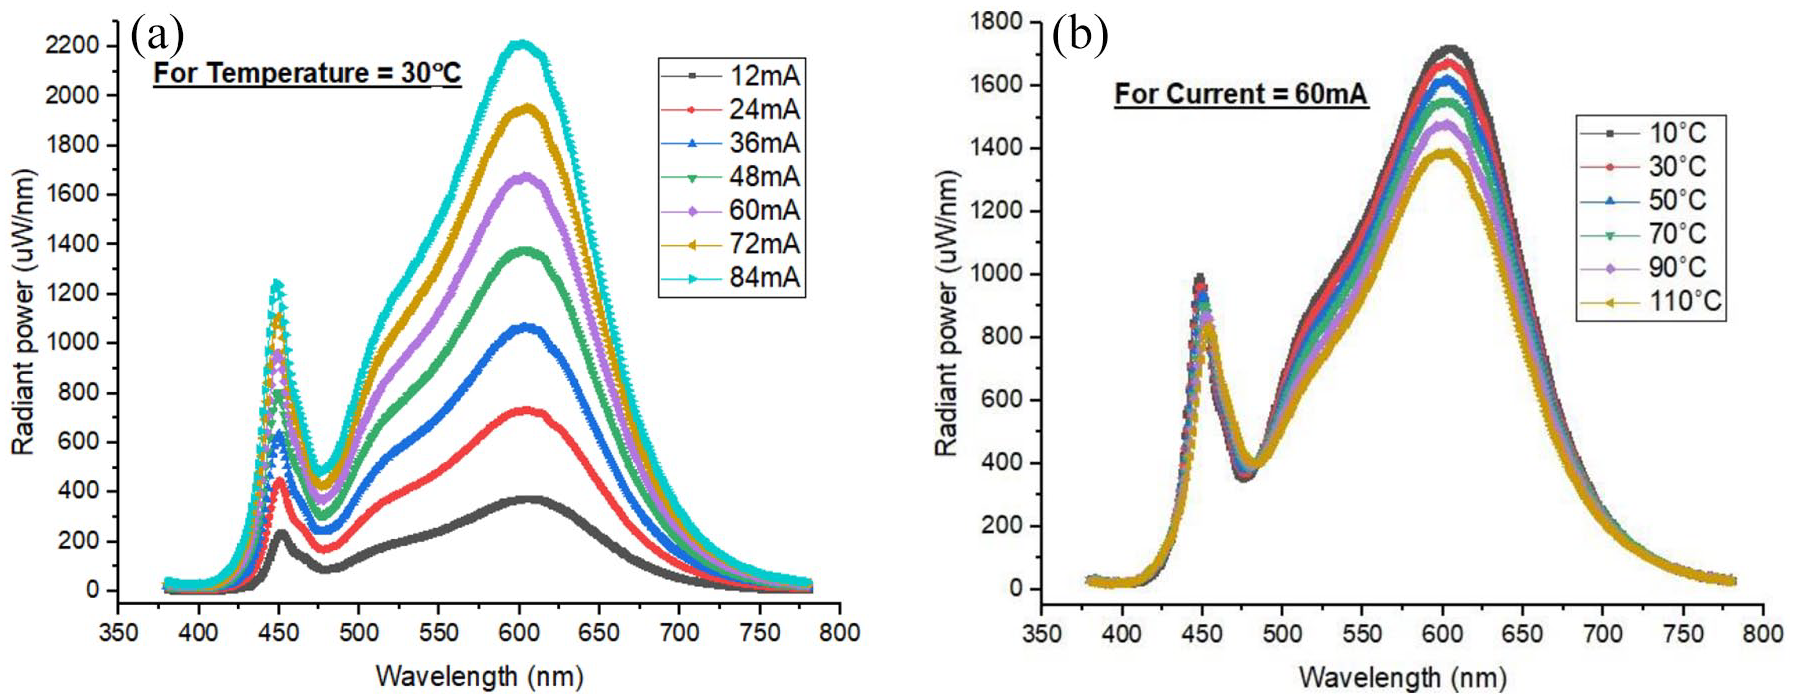
SPD measured at (a) 30 °C and different current levels and (b) 60 mA and different temperature levels
The measured data are used for all the models. The model’s performance is analysed with performance indicators such as regression R and mean squared error (MSE). The Equation (2) is used to evaluate the MSE.
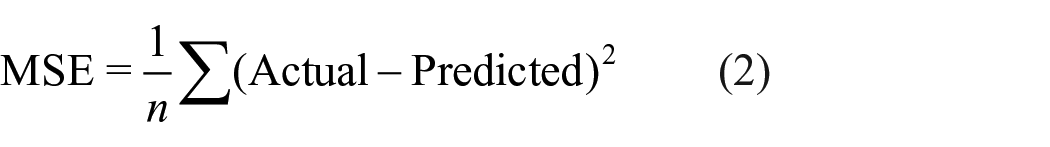
where n is the number of data points. Furthermore, the root mean square error (RMSE) of the predicted SPD through models is used to analyse the model performance. and is calculated using Equation (3).
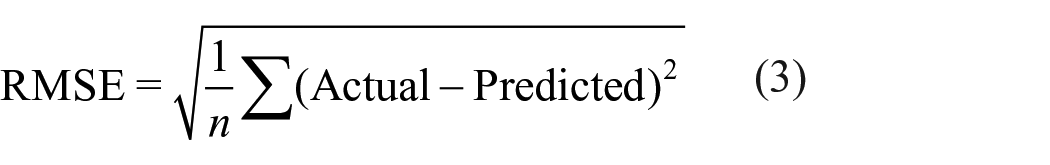
The RMSE value aids in the selection of an accurate model at early stage. However, there is no connection to visual performance regarding threshold value for RMSE. Furthermore, in order to justify that the RMSE value is within the acceptable limit, for randomly selected test scenarios both photometric and colorimetric parameters are obtained from the predicted SPD as described in Qian et al. 34 and the results are presented in terms of APE. The APE is shown in Equation (4).
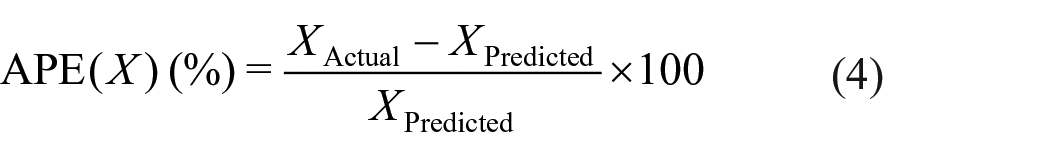
where ‘X’ can be any photometric or colorimetric parameters extracted from predicted SPD. And ‘Actual’ corresponds to measured SPD through the measurement setup and ‘Predicted’ corresponds to predicted SPD trough developed model. The expected error is limited to 5% or less to suggest the best model.
4. Results
4.1 Model 1: NN with three inputs, one HL and multiple neurons in HL
The wavelength (λ), current (mA) and temperature (°C) are taken as three inputs and radiant power (µW/nm) as output to the model 1. Each wavelength of SPD from 380 nm to 780 nm insteps of 1 nm is taken as input. The NNs are designed with multiple neurons. The performance indicators such as R and RMSE are evaluated and given in Table 4. The results show that as the number of neurons in HL increases, RMSE value decreases and R (validation) value increases.
Performance indicators of the NN for multiple neurons
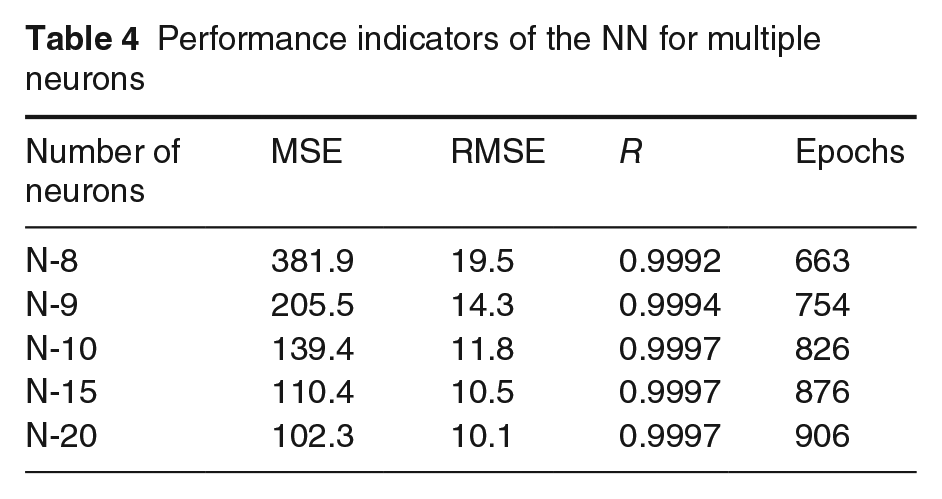
Figure 6(a) depicts the time-dependent learning process of the ANN. The term ‘epoch’ refers to the presentation of each dataset by the network and the subsequent capture of output values. This graph clearly shows that MSE decreases monotonically throughout repeated epochs for all datasets which includes training, test and validation datasets. The findings show that the best performance is attained at 826 epochs, with an MSE of 139.484 and all the graphs are near overlapping with each other. Figure 6(b) and (c) illustrate the relationship between the target and the results of the training as well as the validation process. The obtained value of R indicates a stronger association between target and the results with regard to training and validation datasets showing Y = T in both the graphs. This suggests that the model created is appropriate.
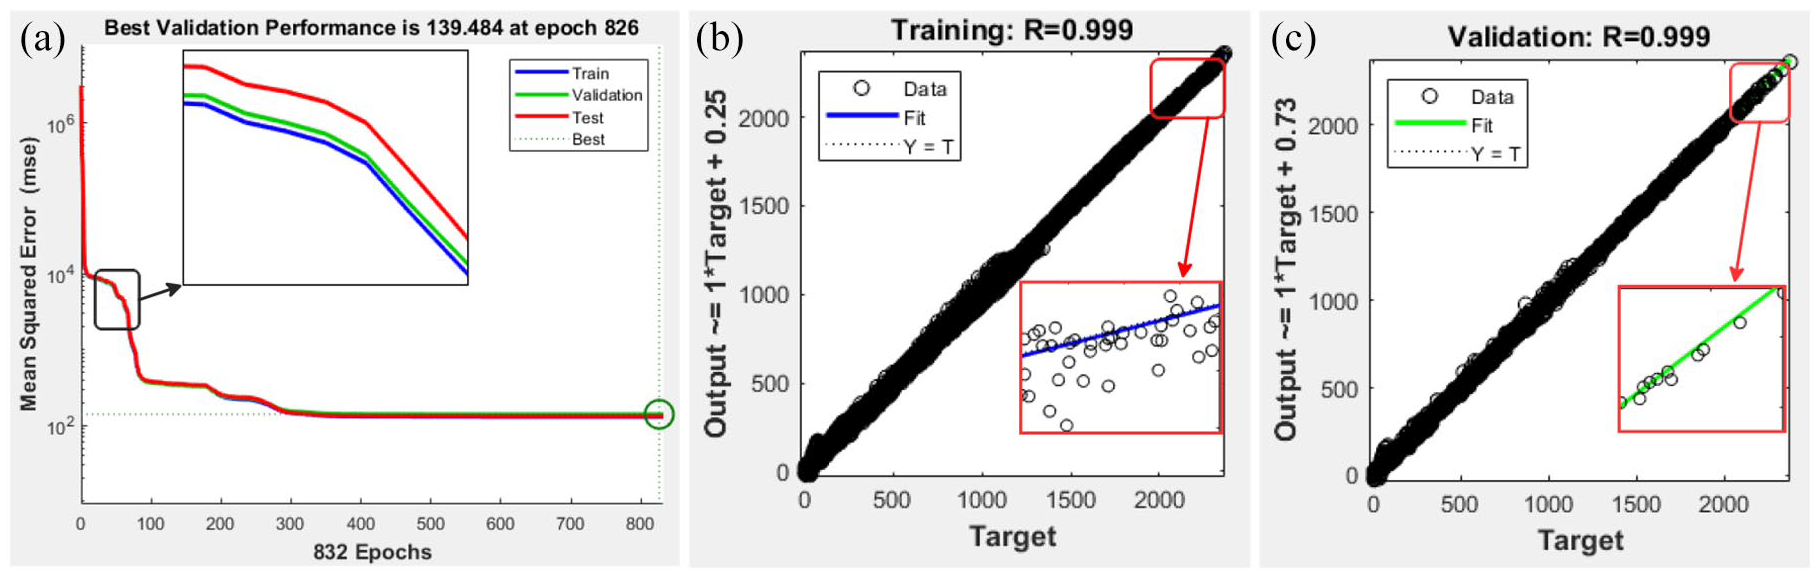
Performance indicators (a) MSE performance from training, vaidation and test data (b) R-training and (c) R-validation
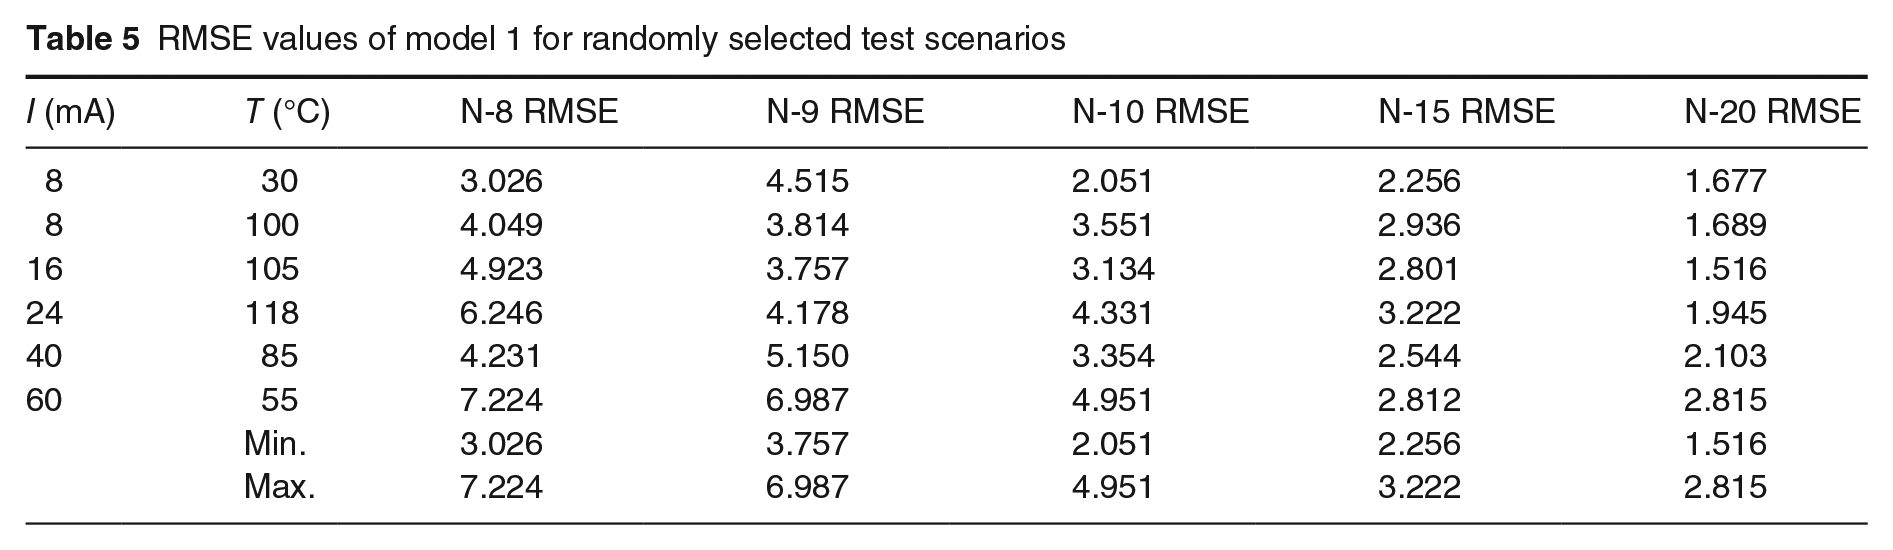
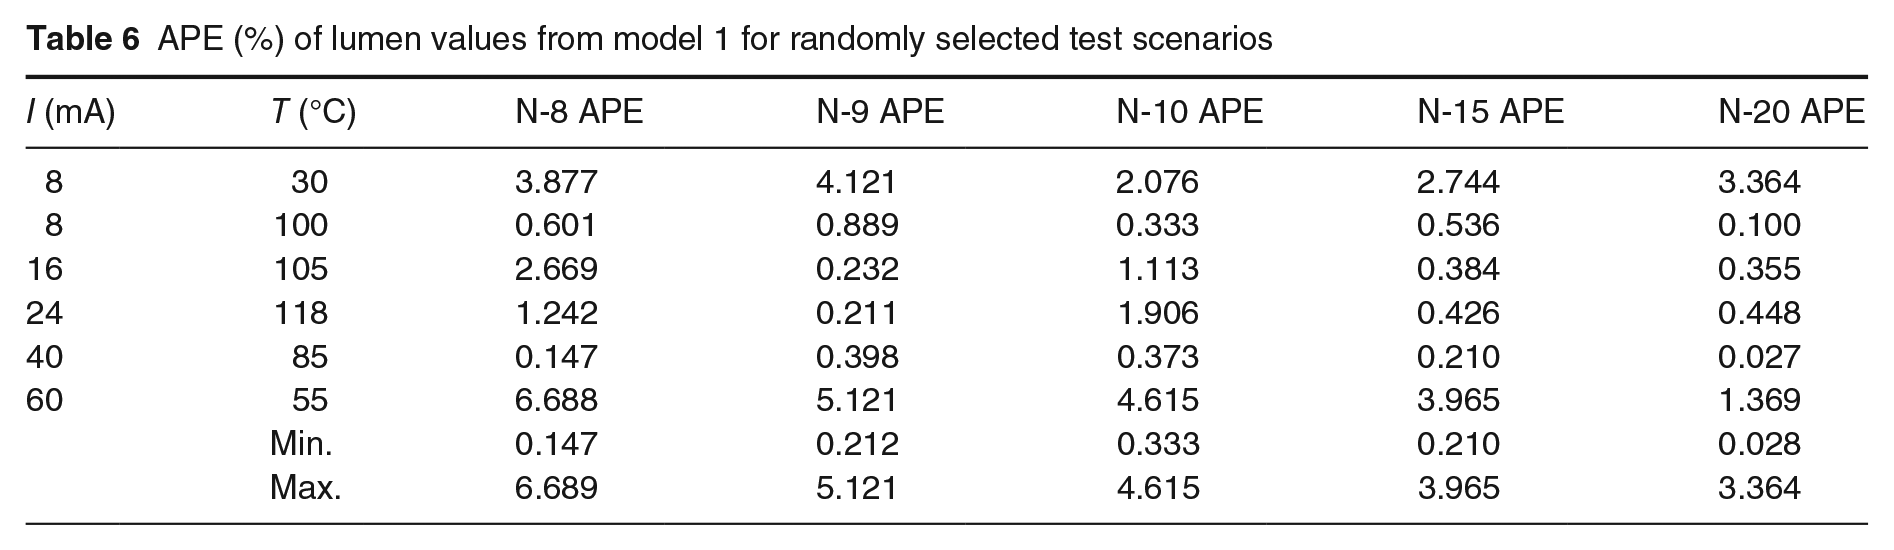
Furthermore, to validate the models developed, the SPD is predicted and RMSE is calculated for the randomly selected test scenarios and is given in Table 5. The maximum RMSE is found with the eight neurons in HL when stress levels of 60 mA and 55 °C. Furthermore, the RMSE values are justified with the APE (Lumens) value evaluated for this test scenarios and is presented in Table 6. The best prediction accuracy is obtained when the number of neurons considered in the model is 10 or greater considering prediction error limit set to
RMSE values of model 1 for randomly selected test scenarios
APE (%) of lumen values from model 1 for randomly selected test scenarios
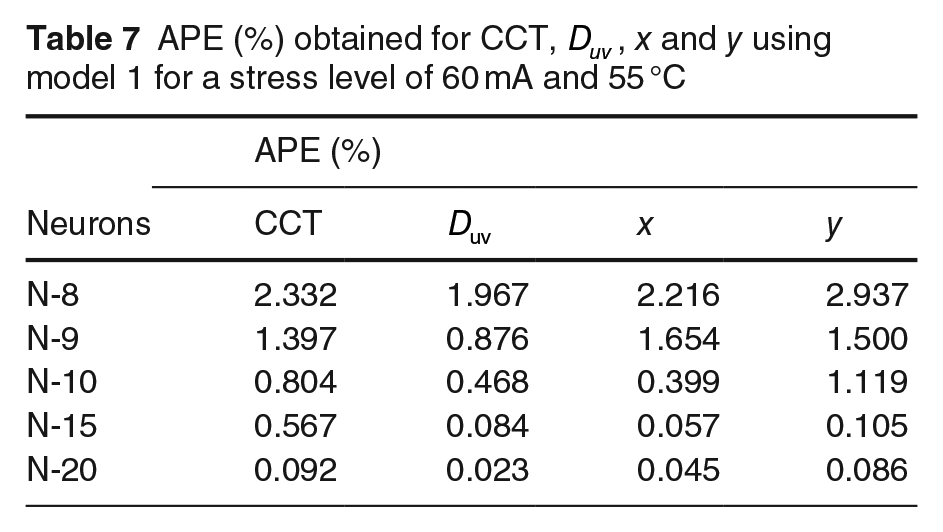
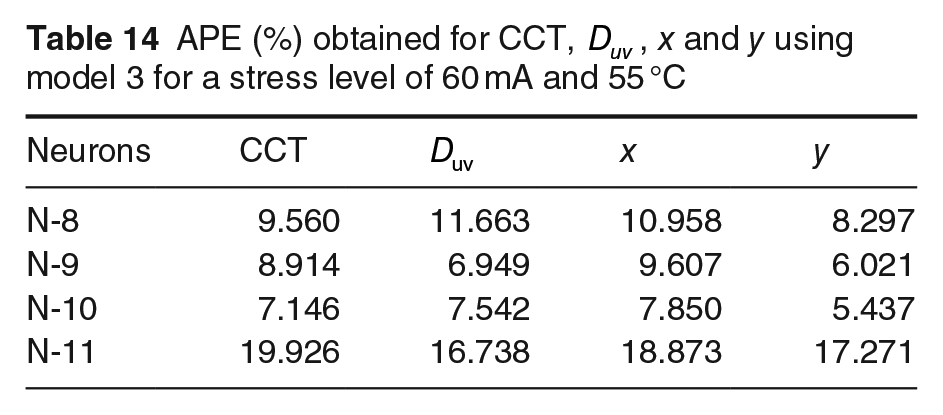
Similarly, colorimetric parameters are extracted from the predicted SPD and the results are presented in terms of APE and are given in Table 7, with multiple neurons in HL for a stress level of 60 mA and 55 °C. The results show that as number of neurons in HL increases, the APE of parameters such as CCT,
APE (%) obtained for CCT,
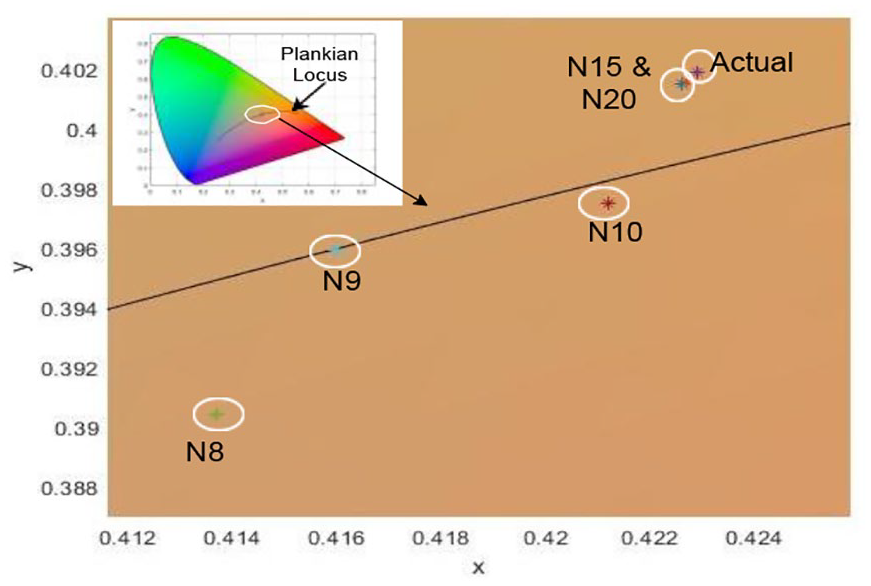
CIE1931 xy plot for various neurons at 60 mA and 55 °C stress level
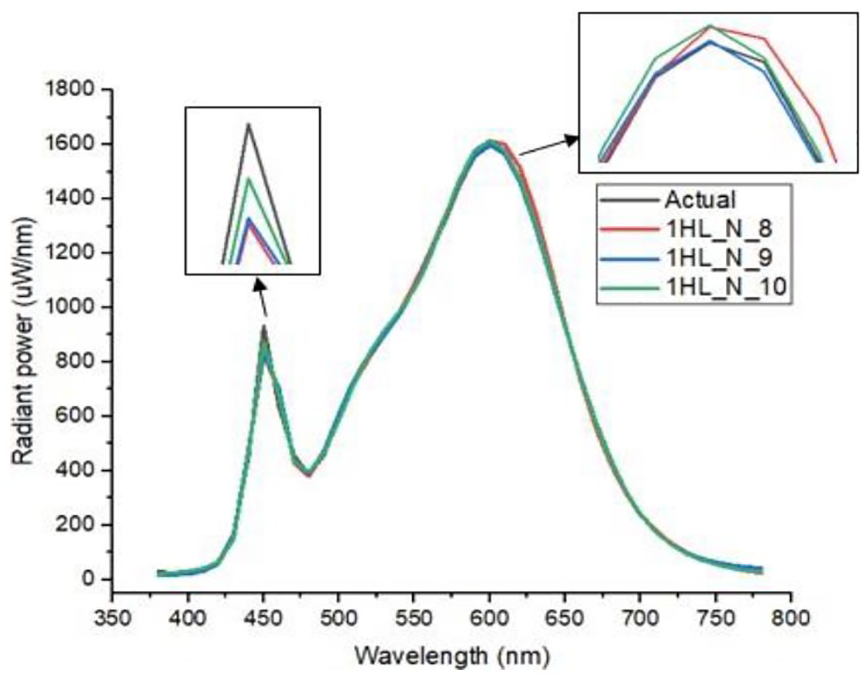
Predicted SPD at 60 mA and 55 °C stress levels
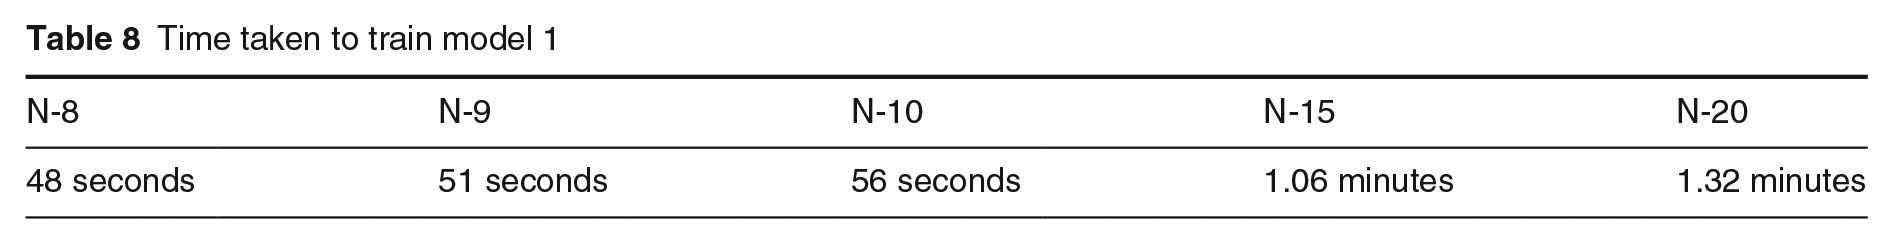
Time taken to train model 1
4.2 Model 2: NN with three inputs, two HLs and multiple neurons in each HL
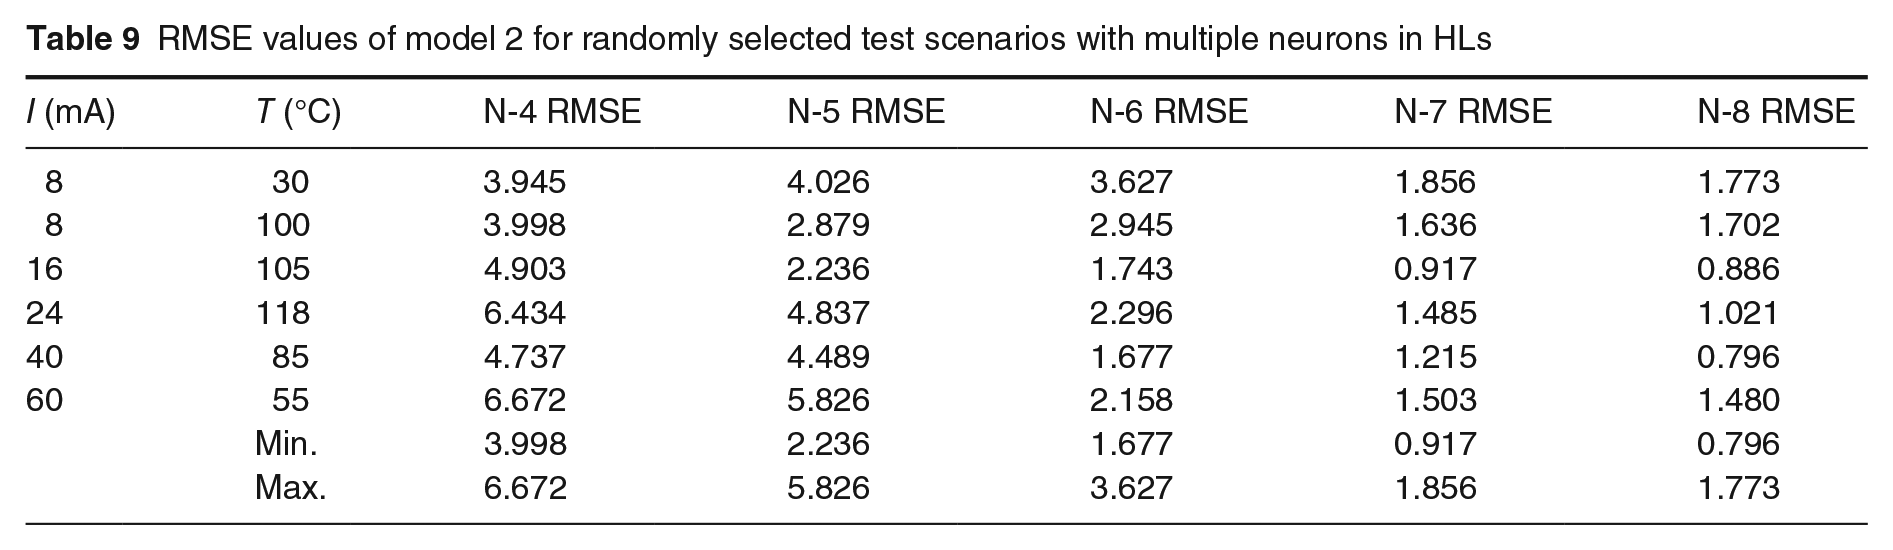
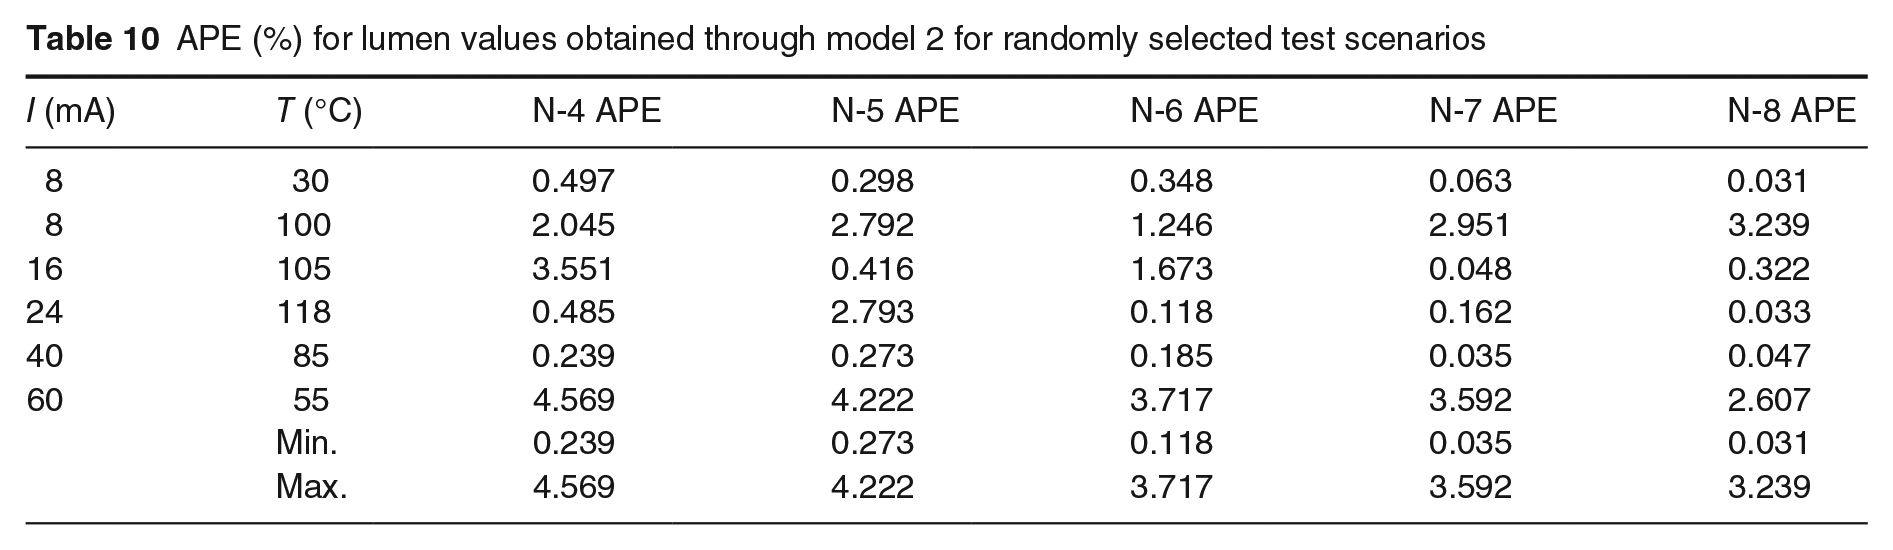
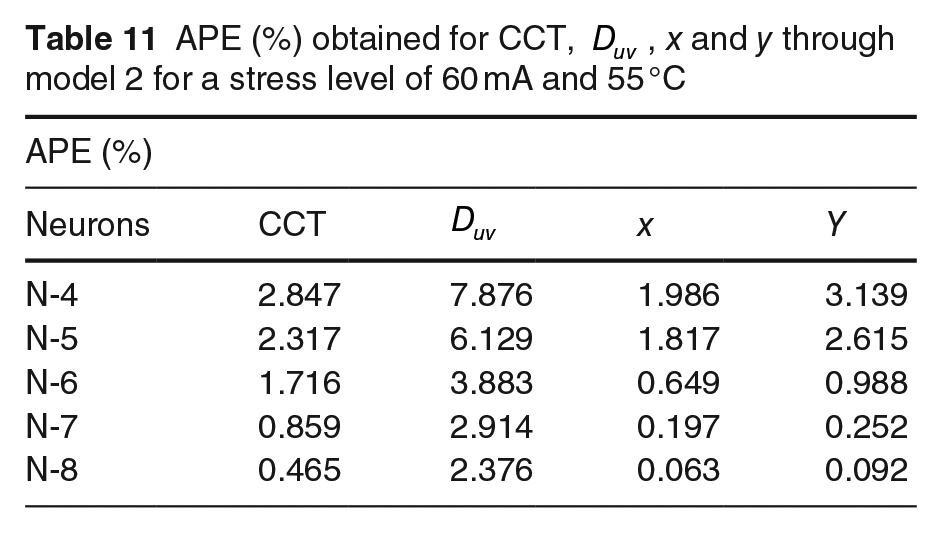
The input and output variables are same for both model 1 and model 2. The differences between models 1 and 2 are the number of HLs and neurons in each HLs. The NNs are developed and tested with randomly selected test scenarios. The RMSE and APE (Lumens) are computed and given in Tables 9 and 10, respectively. It is found that the maximum APE (Lumens) is below 5% for all the scenarios of neurons. It is also observed that the maximum APE (Lumens) is obtained when LEDs are operated at 60 mA and 55 °C stress levels. Similarly, colorimetric parameters are extracted from the predicted SPD and the results are presented in terms of APE and are given in Table 11, with multiple neurons in each HL for a stress level of 60 mA and 55 °C. The xy plot on CIE diagram for various neurons considered at 60 mA and 55 °C is plotted and shown in Figure 9.
RMSE values of model 2 for randomly selected test scenarios with multiple neurons in HLs
APE (%) for lumen values obtained through model 2 for randomly selected test scenarios
APE (%) obtained for CCT,
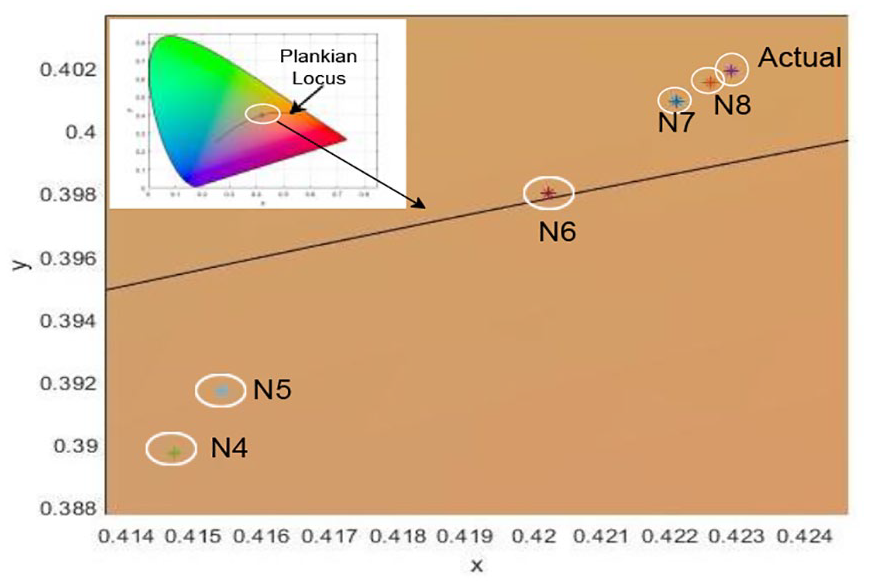
CIE1931 xy plot for various neurons at 60 mA and 55 °C stress level
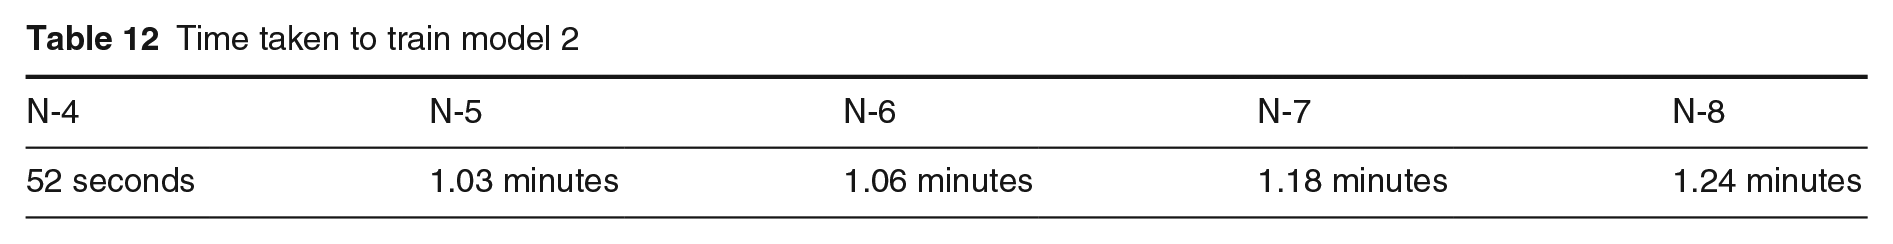
The results show that there is no change in colour emitted by LED selected. Similar results are seen with model 1 too. In other words, the model 2 can be structured with number of neurons considered four or greater in each HL for similar results as that of model 1 with more than 10 or more neurons in HL. Figure 10 shows the actual and the predicted SPD when LEDs operated at 60 mA and 55 °C stress levels. The train time taken by the model with different neurons is shown in Table 12.
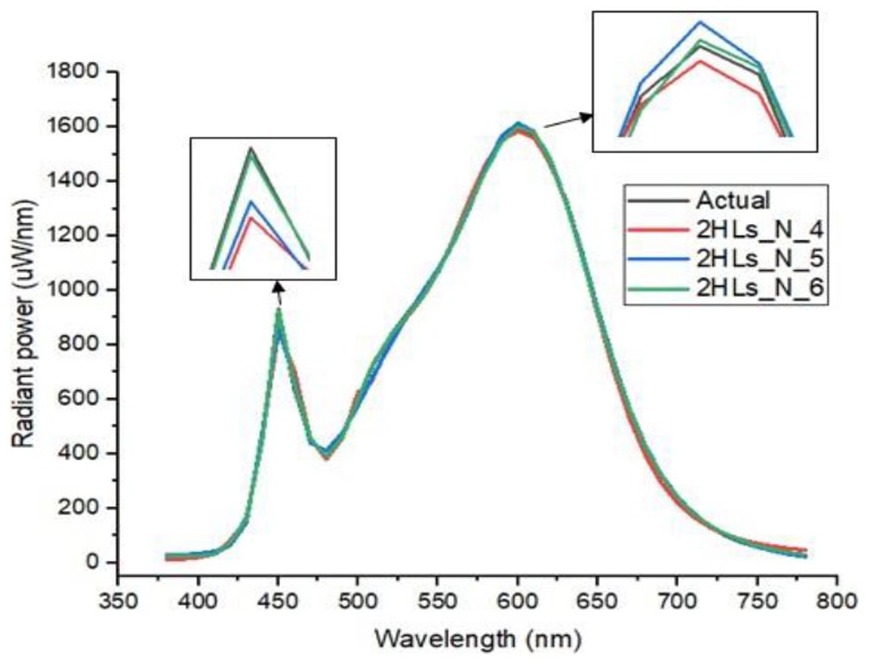
Predicted SPD at 60 mA and 55 °C stress levels with two HLs and with multiple neurons in each HL
Time taken to train model 2
4.3 Model 3: NN with two inputs, one HL and multiple neurons in HL
The prediction of SPD follows mainly two steps. Firstly, Gaussian function fitting is used to extract the parameters from actual SPD measured through experimentation at various stress levels. The SPD decomposition modelling using Gaussian function fitting is applied for selected test scenarios and shown in Figure 11. Figure 11 includes the original SPD, two extracted individual spectrums, and cumulative peak fitting model, respectively. The minimum R square value seen is 0.9757.
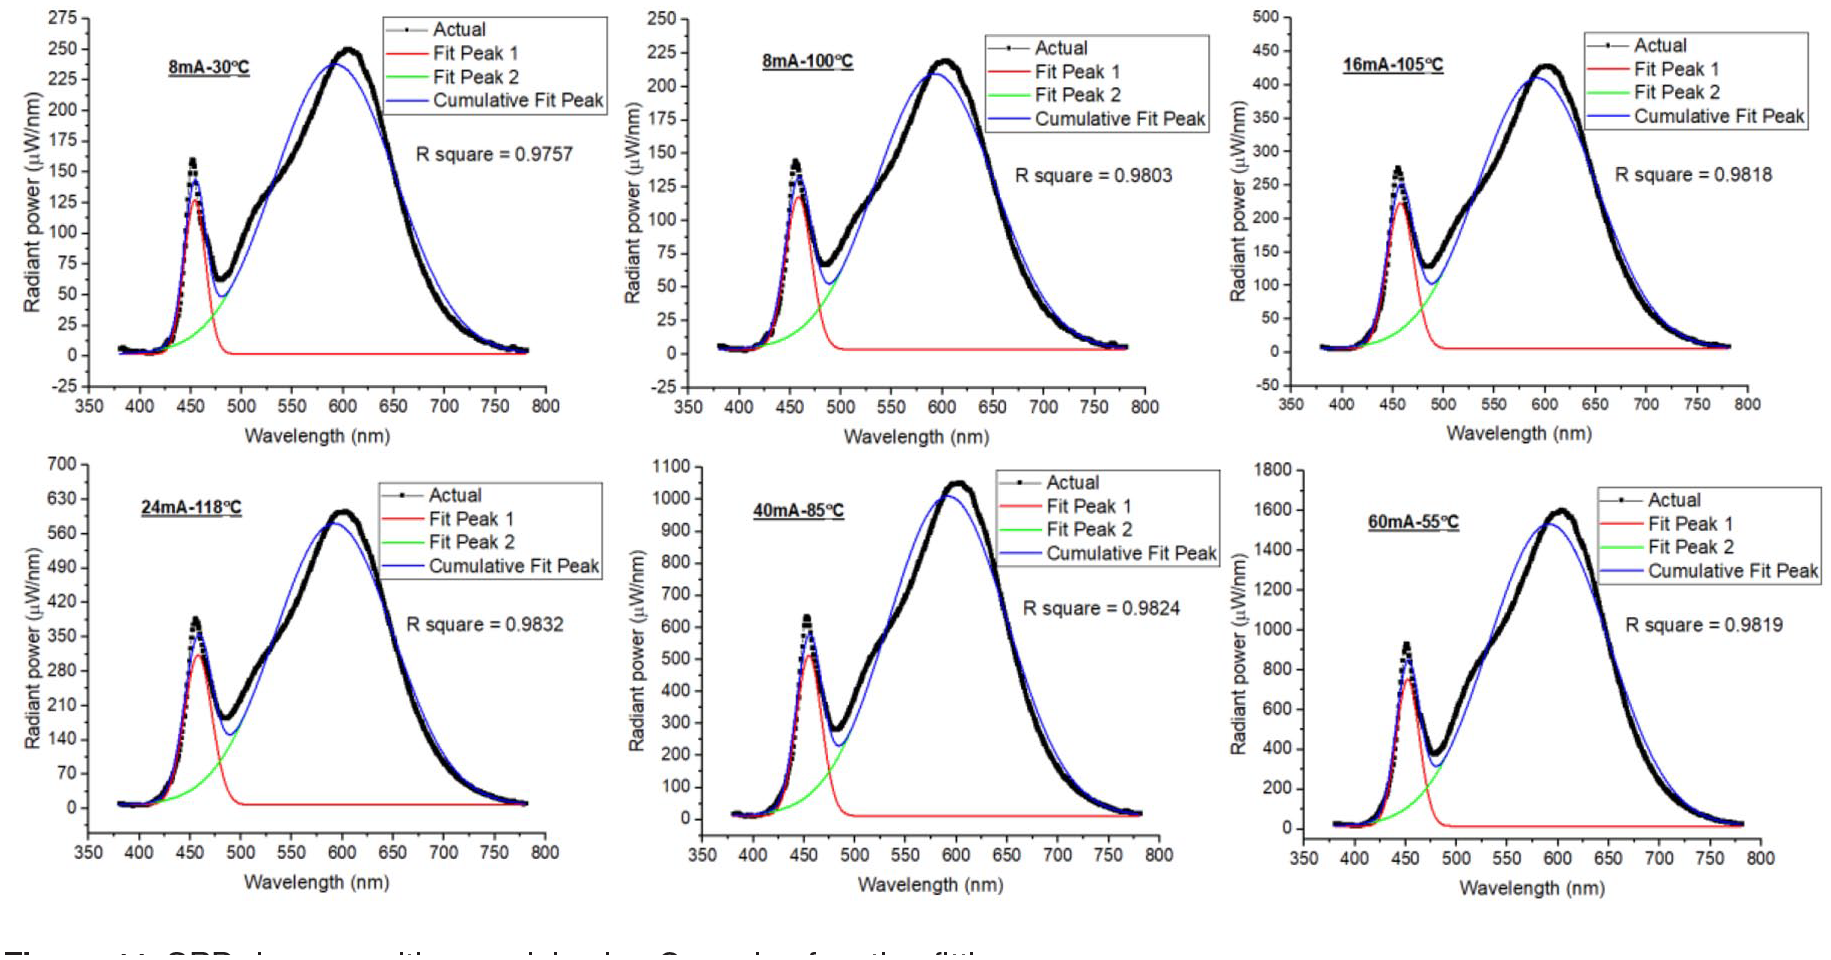
SPD decomposition model using Gaussian function fitting
The results show that the Gaussian-based model applied to extract SPD features in this study is appropriate. Secondly, the NNs are developed to predict each Gaussian parameters individually. For the NNs developed, I (mA) and T (°C) are taken as two inputs and Gaussian function parameters such as
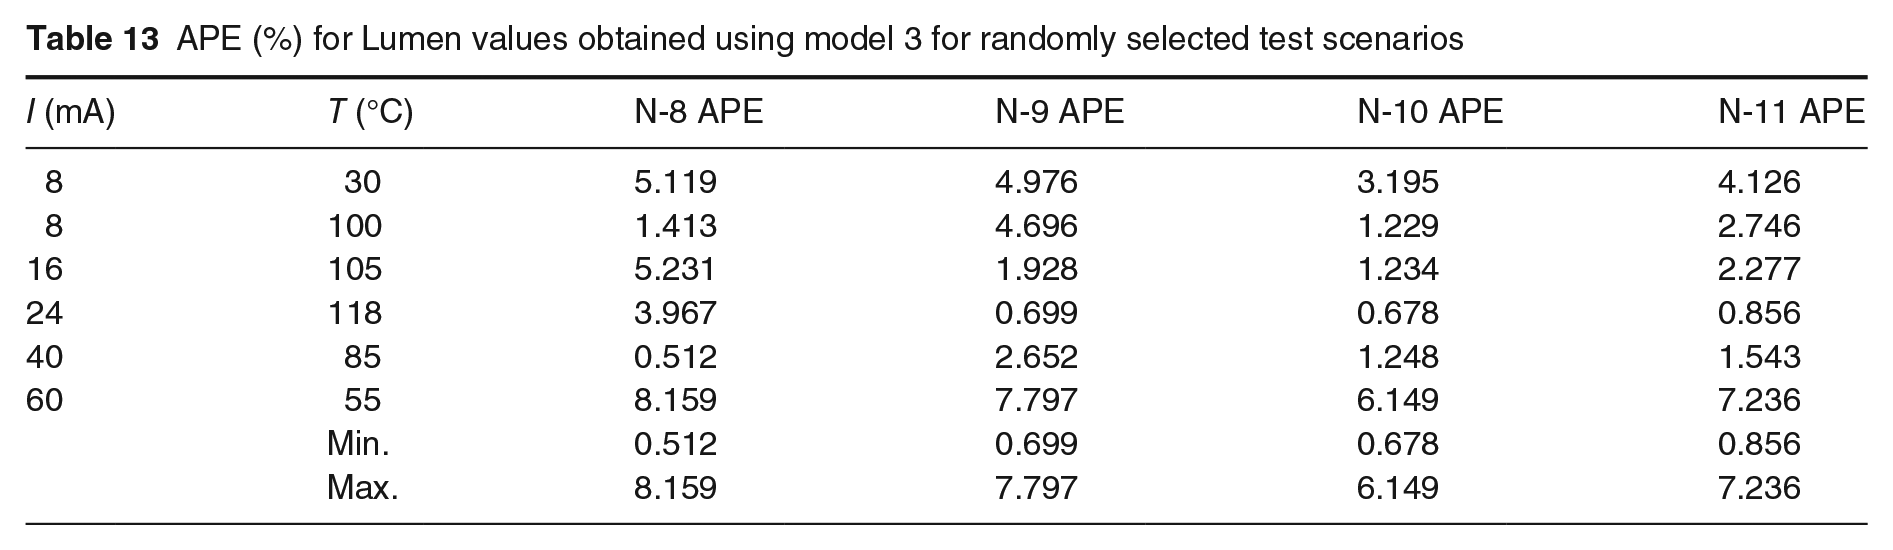
APE (%) for Lumen values obtained using model 3 for randomly selected test scenarios
APE (%) obtained for CCT,
The xy plot on CIE diagram for various neurons considered at 60 mA and 55 °C is plotted and shown in Figure 12. The colour emission with 10 neurons in HL is comparable with that of actual. However, as neurons in HL are more than 10, the significant difference in colour emission is seen between the actual and predicted.
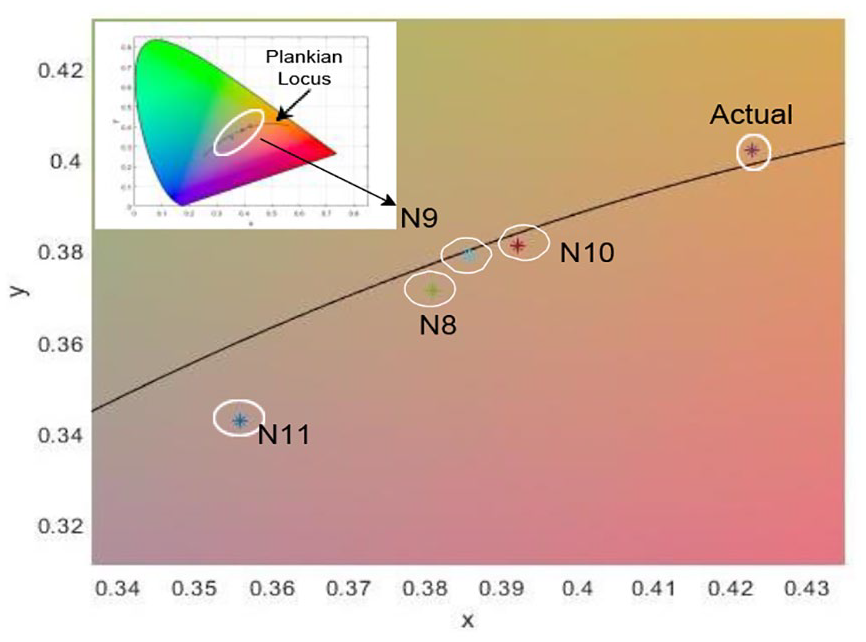
CIE1931 xy plot for various neurons at 60 mA and 55 °C stress level
4.4 Comparative analysis
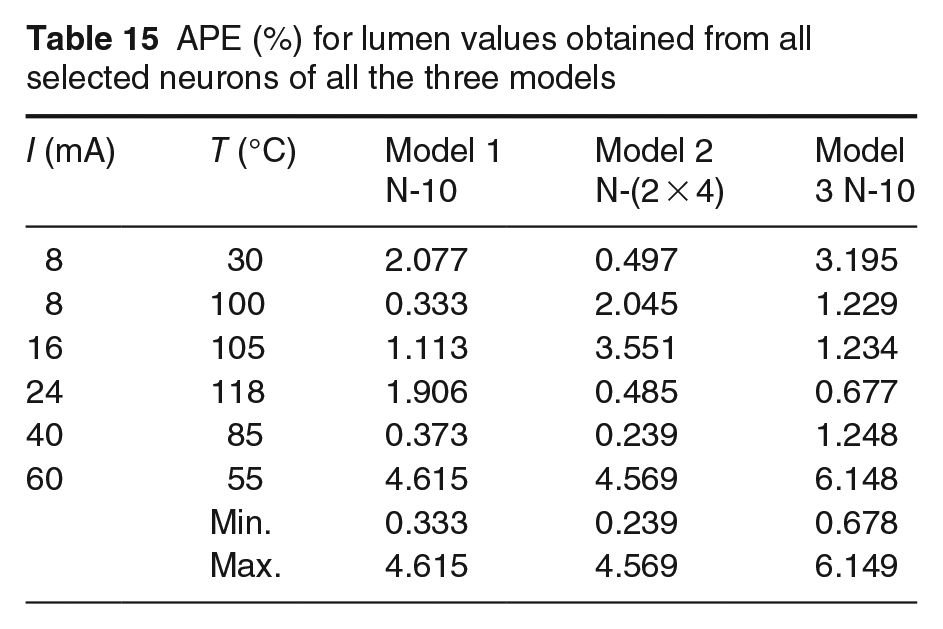
The three models with selected number of neurons considering APE limit are compared for randomly selected test scenarios and is shown in Table 15. The predicted SPD for the stress levels of 60 mA and 55 °C from three models are further visualized as shown in Figure 13. On comparison of maximum APE (Lumens), it is found that both model 1 and 2 give similar results with compromise in train time of few seconds. However, the model 3 is found to have higher value of maximum APE (Lumens) and variations in the colour emission relative to other two models, which can be attributed to the information loss during data preparation. It is also seen that the difference of 10 nm in the second peak of predicted SPD from model 3 compare to model 1 and 2. However, no variation is seen in the first peak of predicted SPD from all three models, which might make a considerable impact to understand the physics of LED failures. And importantly, the model 3 takes longer time for data preparation than the first two models. Furthermore, a reliability estimation analysis is carried out for a LED luminaire to evaluate the effectiveness of model 1 through SPD prediction.
APE (%) for lumen values obtained from all selected neurons of all the three models
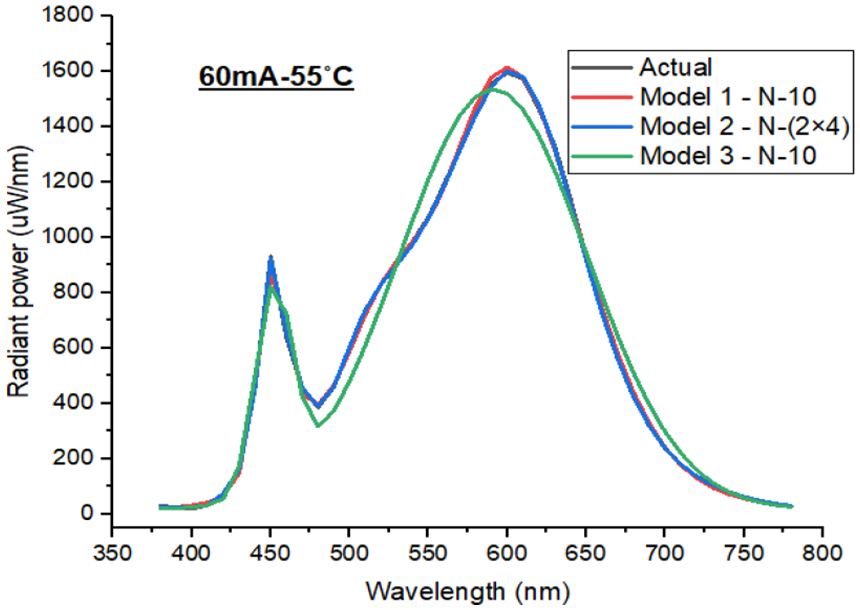
Predicted SPD at 60 mA and 55 °C stress levels using three models
5. ANN-based lifetime estimation: A case study
Accelerated life test data of 16 W, 6500 K LED luminaire operated at junction temperature of 65 °C, 86 °C and 104 °C were considered for the reliability analysis using ANN based approach. By keeping the LED luminaire inside a regulated humidity chamber at a fixed driving current, the selected LED is evaluated under various thermal stress levels. At each readout time, the luminaire was allowed to cool for 30 minutes before measuring SPD data with a experiment setup at room temperature. Following that, the ANN is used to estimate lifetime. The methodology used is shown in Figure 14. The NN model has three input parameters (temperature, wavelength and time) and only one output parameter (radiant power). As train data, the model employed 65 °C, 86 °C and 104 °C reliability data. The performance of the NN model is initially assessed using MSE, RMSE and R (validation). The MSE, RMSE and R (validation) of the developed NN models are 3142.387, 56.057 and 0.906, respectively.
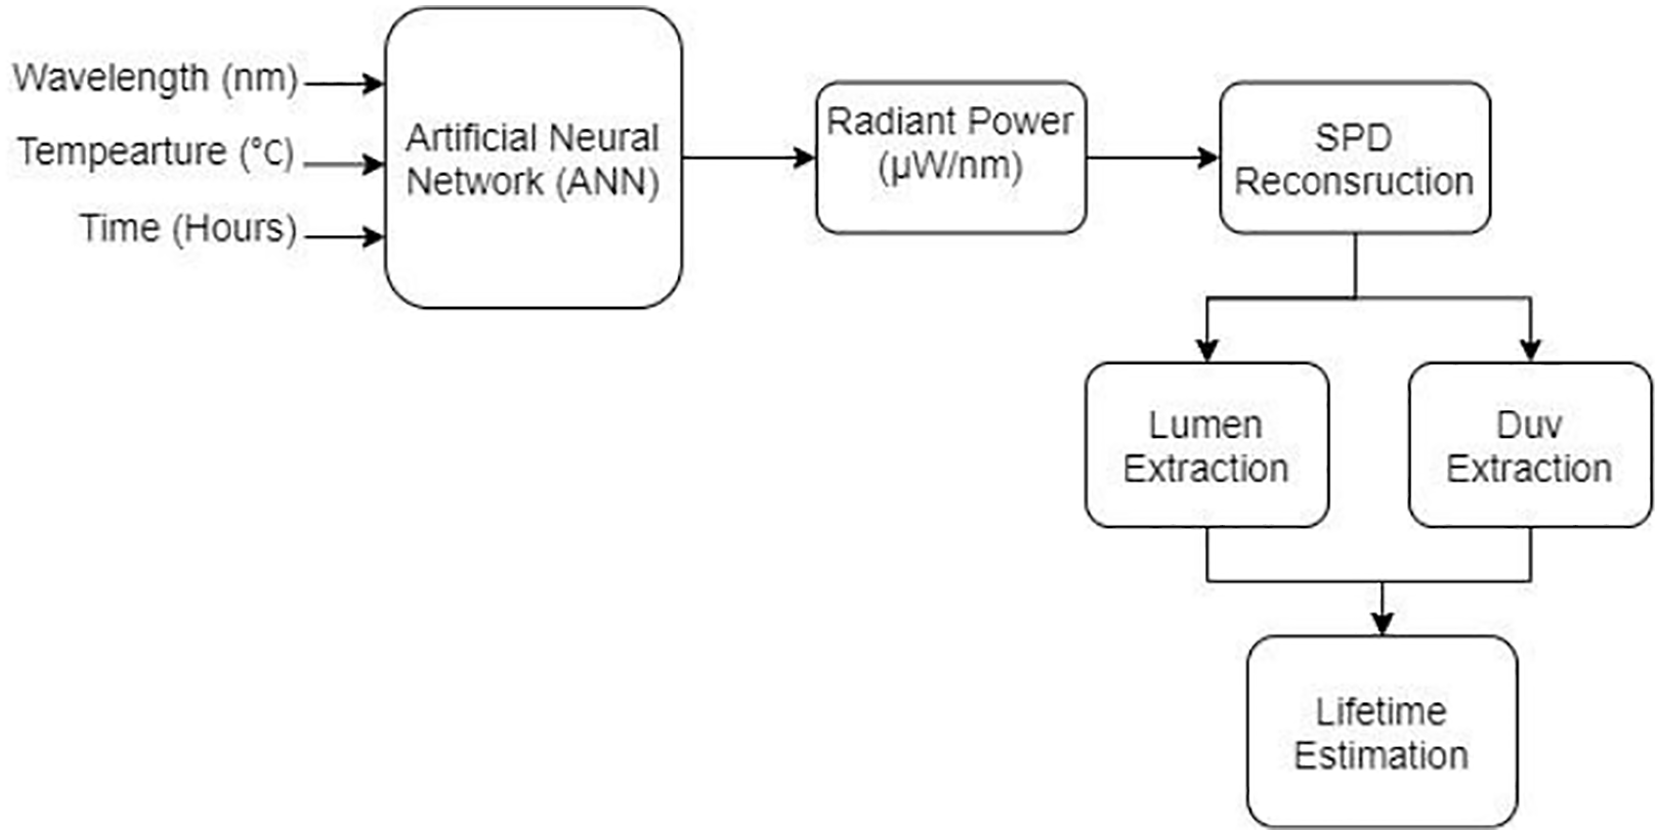
Reliability estimation using NN through SPD approach
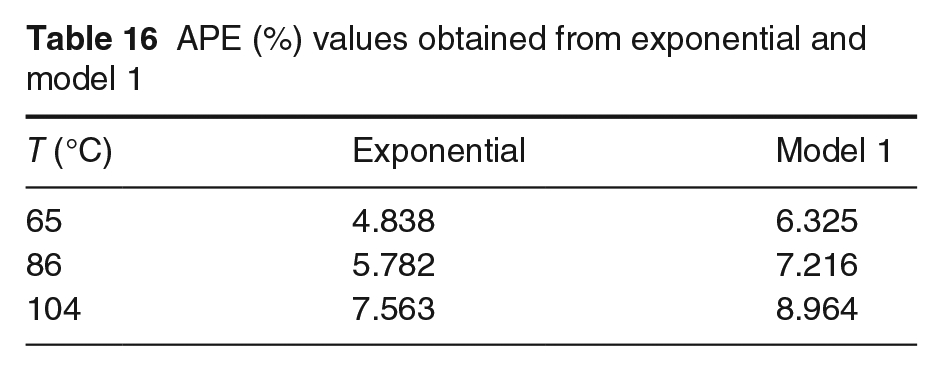
To prove that the RMSE and R validation are acceptable, the luminous flux is extracted from the predicted SPD, and compared with experimental data obtained as well as the data extracted through the conventional exponential model, which is typically used by LED manufacturers to specify lifetime. The results are presented in APE (Lumens) and given in Table 16. The selected models give the results with APE less than 10%. The model’s performance is further evaluated and validated for stress levels of 74 °C and 115 °C. The predicted SPD for the selected stress levels considered for the model validation is shown in Figure 15. The results reveal that the radiant power decreases over the period for both the temperatures. However, no variations are seen in the peak wavelength due to blue chip and phosphor coating.
APE (%) values obtained from exponential and model 1
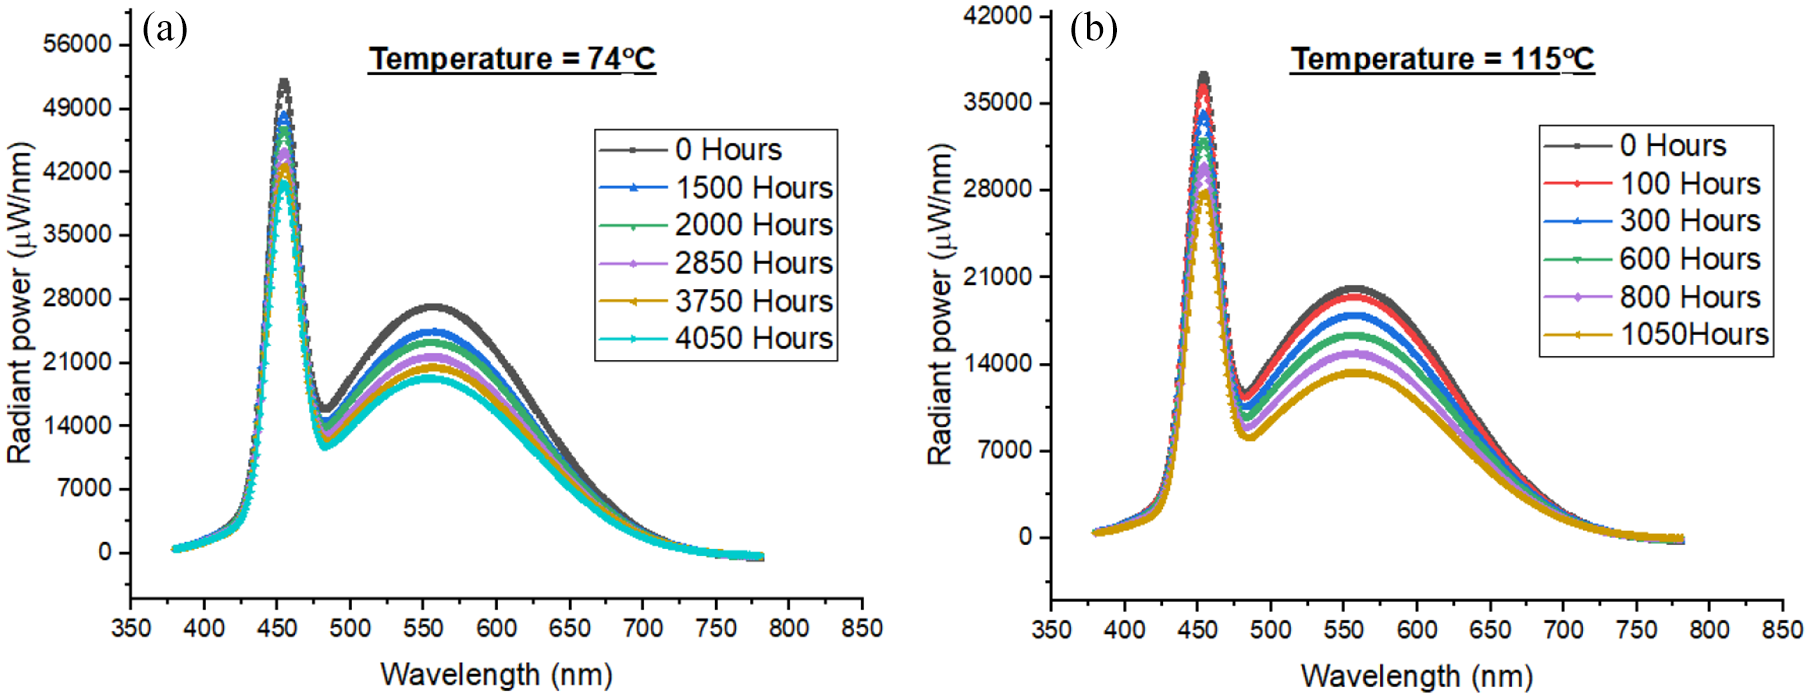
Predicted SPD at (a) 74 °C and (b) 115 °C
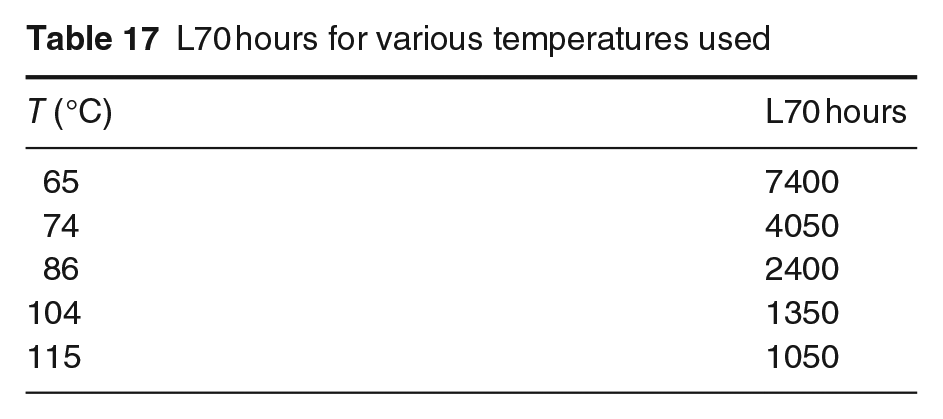
Further luminous flux is extracted from predicted SPD to estimate LED luminaire lifetime. Figure 16 depicts the luminous flux deterioration over time for stress levels of 65 °C, 74 °C, 86 °C, 104 °C and 115 °C. The data reveal that when the temperature rises, the rate of degradation rises as well. The findings show that the NN model can accurately predict the degradation behaviour and lifetime of LED Luminaires at any temperature. Table 17 shows the expected lifetime using the NN model and the SPD technique for various stress levels. Similar to luminous flux, the
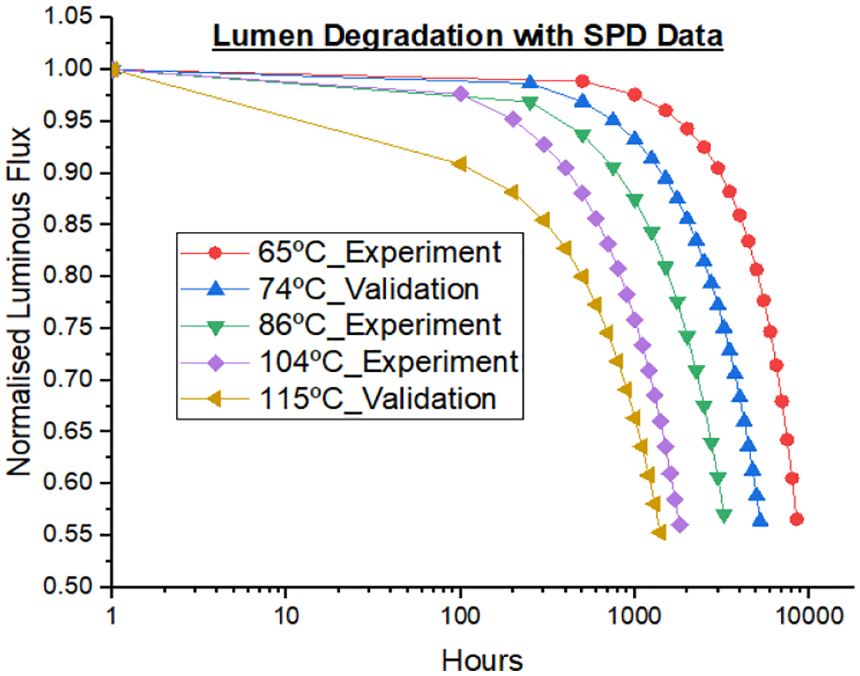
Luminous flux degradation behaviour through SPD approach
L70 hours for various temperatures used
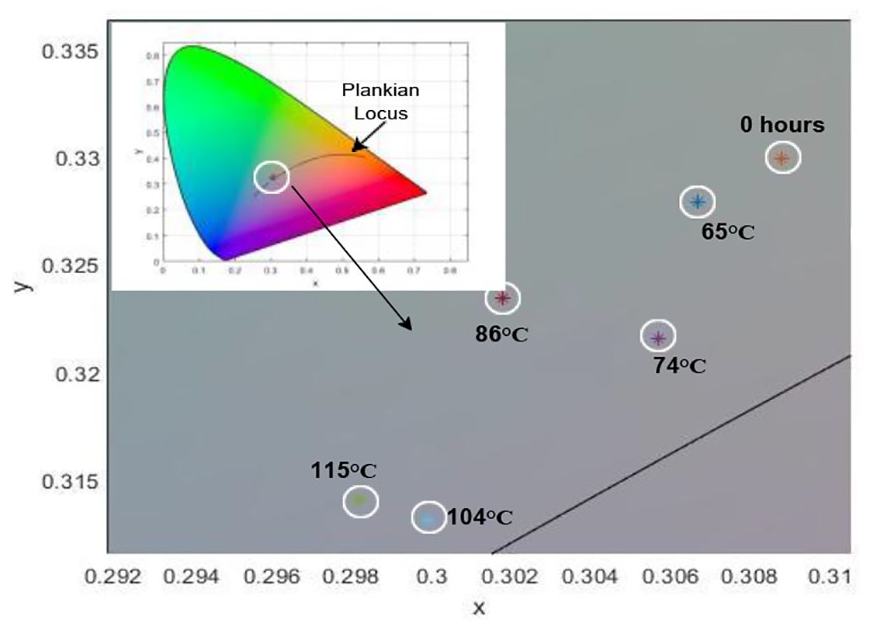
CIE1931 xy plot for selected stress levels
6. Conclusion
The study proposes an ANN-based data-driven technique for estimating pc-WLED SPD, taking into account the various models. Models 1 and 2 each have three inputs, but model 3 has only two. The performance of the models is measured in APE, which in SPD prediction is set to less than 5%. Models 1 and 2 are said to be comparable in terms of performance. However, the model 2 is thought to be the best in terms of training time. Model 3 has a larger prediction error due to lost information during data processing. The researchers can use the performance comparison of models 1 and 2 to inform the structure of their NN models. All three models can estimate SPD at any desired electrical or thermal stress level, allowing desirable characteristics like luminous flux, CCT,
Footnotes
Acknowledgements
The data were acquired from the testing facility available in the Department of Electrical and Electronics Engineering, Manipal Institute of Technology, Manipal Academy of Higher Education, Manipal, Karnataka, India 576104.
Declaration of conflicting interests
The authors declared no potential conflicts of interest with respect to the research, authorship, and/or publication of this article.
Funding
The authors received no financial support for the research, authorship, and/or publication of this article.