
Abstract
Lighting makes up 17% of electrical loads and the largest energy end use in commercial buildings. Linear fixtures are among the largest opportunities for energy efficiency improvement, given their long operating hours. With continued, rapid light-emitting diode (LED) development and more LED replacement products on the market, lighting replacement decisions become more complex and warrant re-examination. With a goal to inform building managers and other decision-makers with practical guidance on lighting replacement, this study is a life cycle cost (LCC) analysis that compares the cost–benefit of six replacement options (one fluorescent and five LED) for a 0.61 m by 1.22 m (2 ft by 4 ft) T8 recessed troffer based on data for 168 lighting products from an online vendor. Results show that direct wire (i.e. unballasted) LED retrofits are the least-cost option to replacing fluorescent lamps in terms of normalized LCC. Plug-and-play lamps suffer from a lock-in with ballasts, but their ease of installation can help spur LED adoption. In cases where an existing ballast is still usable, hybrid LED retrofits provide the least upfront cost option by deferring the cost of rewiring. LED luminaires can offer improved aesthetics and reliability; however, they have high upfront cost. Among them, luminaires with replaceable lamps offer lower cost than those without.
1. Introduction
Electricity consumption for lighting has been on a steady decline, driven most recently by the adoption of light-emitting diode (LED) lighting. Today, lighting accounts for 6% of total US electricity consumption, 1 down from 19% in 2010. 2 Lighting still makes up 17% of the electrical loads and remains the largest end use of electricity in commercial buildings. 3 Linear fixtures are the most common lighting systems in commercial buildings, with nearly 1 billion units installed in the United States. 4 Linear fixtures include ‘all troffer, panel, suspended and pendant luminaires’, as well as their lamps and retrofit kits. 5 Troffers are rectangular fixtures that are typically recessed into the ceiling and are used in offices, schools, hospitals, retail and industrial spaces. With their long operating hours, linear fixtures represent one of the largest opportunities for energy efficiency gain from LED retrofits. T8 or 25.4 mm diameter fluorescent linear lamps are currently the majority of linear fixture lighting. This study focuses on commonly used 32 W fluorescent-equivalent T8 fluorescent recessed troffer lighting and examines the life cycle cost (LCC) and decision-making considerations for retrofit and replacement options for a 1.22 m (4 ft) two-lamp system.
Since their inception, LED lighting technologies have undergone enormous change. The cost of LEDs has been decreasing ten-fold per decade while their ability to produce light has increased by a factor of 20, a phenomenon that was first described by Haitz’s law. 6 It is only in recent years that both the cost and performance of LED lighting have caught up with fluorescent lighting. Data collection and cost analysis were conducted in US$ but GBP (£) equivalents are also shown (using the conversion £1.00 = $1.21, rounded to the nearest £0.10 for all values greater than £1), as Lighting Research & Technology is published in the United Kingdom. For a long time, linear LED lamps struggled to compete with their fluorescent counterparts, which have efficacies up to 108 lm/W and costs as low as £3.30 ($4) per klm. 4 Efficacy is a measure of energy efficiency of a light source, defined as the ratio of rated luminous flux to rated power consumption. By 2015, LED replacements began to exceed their fluorescent counterparts in efficacy, but cost remains a challenge. In a US Department of Energy (DOE) study, 7 the cost of 1.22 m (4 ft) LED lamps was estimated to be £9.10–£27.20 ($11–$33) per klm or £16.50–£49.40 ($20–$60) per lamp, though the cost today is between £1.70 and £7.40 ($2–$9) per klm or £3.30–£11.50 ($4–$14) per lamp based on the market information collected in this study. Additionally, current LED lamps surpass fluorescent lamps in several performance attributes. They produce light without flickering, have higher energy efficiencies and last longer. These translate into improved building ambiance, maintenance deference and energy cost savings. LEDs also offer better dimming performance than fluorescent lamps. They have faster ramp-up to full brightness and are more energy efficient at low dimming levels due to lower die (i.e. semiconductor base) temperatures. 8 Finally, LEDs do not contain mercury, making them safer for indoor use and at end of life.
Despite this recent progress, consumers may still find drawbacks with LED lighting. LEDs tend to emit more blue light than traditional bulbs. Prolonged exposure to blue light can disrupt a person’s circadian rhythm, affecting mood, energy level and productivity.9,10 Research is ongoing on the spectral effect of LED lighting on human health and biological activities. LEDs require compatible electronic dimmer switches and may not work with existing dimmers for fluorescent lighting. With many lighting configurations and LED retrofit and replacement options available, the cost–benefits between the upgrade options are not clear. Some lamps are directly usable with the existing fixtures and fluorescent lamp ballasts, whereas others require retrofitting or rewiring the fixtures to bypass the ballasts. Hence, upfront costs and labour requirements differ depending on the complexity of the electrical modification required. Pairing with fluorescent ballasts can hinder the performance of LEDs, creating a trade-off between convenience and energy efficiency. These trade-offs must be resolved when scoping and executing lighting replacement projects.
The US DOE has invested in a few efforts to aid the development and diffusion of LED lighting technologies. They have created programs, such as the Design Lights Consortium, a hub for product ratings and other technical resources, 11 and reports aimed at providing objective information and guidance on the technologies and their use. Among these reports is a series evaluating the performance of linear T8 LED lamps with troffers 12 and the cost-effectiveness of the lamps compared to the best-performing fluorescent counterparts. 7 DOE 13 also published a practical guide to walk users through a series of important considerations for performance, cost and safety when deciding between LED lamps, retrofit kits and luminaire replacement. There is also a wealth of online resources from lighting suppliers to help users navigate through the vast and confusing replacement lighting market.
With the cost and performance of linear LED lamps improving drastically in the past 5 years, it is necessary to re-examine the cost–benefit of LEDs based on current market and technology conditions. This is especially important given that a third type of LED lamp, a hybrid that can be used as both ballast-compatible and ballast-bypass lamps, is now on the market. To include the environmental cost of retrofit and replacement decisions, the social cost of carbon (SCC) should also be included. The SCC is a carbon pricing structure developed by the US Environmental Protection Agency 14 to account for the long-term financial, social and ecological damage from small incremental (marginal) changes in CO2 emissions in the United States.
With a goal to inform building managers and other decision-makers with practical guidance on troffer lighting replacement, this study evaluates the LCC and performance trade-offs between six retrofit and replacement lighting options currently available in the market for a 0.61 m by 1.22 m (2 ft by 4 ft) two-lamp F32 (32 W fluorescent or equivalent) T8 recessed troffer. Compared to the DOE report, 7 this study considers more lighting upgrade options, including hybrid LED lamps and LED replacement luminaires, some of which were not available before. The study also incorporates actual market data, which provide a snapshot of the latest development in lighting technologies relative to the projections assumed by DOE. Using market data also allows for the estimation of the range of expected LCC by capturing the products’ variation in lumen rating, lifetime, efficacy and material cost. Other than cost, these attribute variations are not captured in the DOE report. As LED technologies continue to improve rapidly and their costs continue to fall, it is important to keep track of these changes so that building owners and managers can make better informed decisions regarding lighting replacement.
2. Method
A description of the six replacement lighting types and their attributes is included in Section 2.2. Figure 1 shows the system boundary for the replacement product systems examined in this LCC analysis. Each system begins with a full fluorescent luminaire whose components are then retired and replaced according to the replacement lighting type requirement. A luminaire is a lighting system made up of lamps (light sources), electronics (ballast or driver) and a fixture (mechanical structure). For example, plug & play LEDs are a ‘lamp’ type replacement, so they follow the top system boundary in Figure 1. The lamps and ballast from the fluorescent luminaire are replaced with new plug & play LEDs and a new ballast. At the end of the time horizon, all components including the incumbent fixture are retired to ensure functional equivalence. Since the flow of incumbent fluorescent components (italicized text in Figure 1) are common between the systems, they are excluded from the analysis and only the components in bold text are examined.
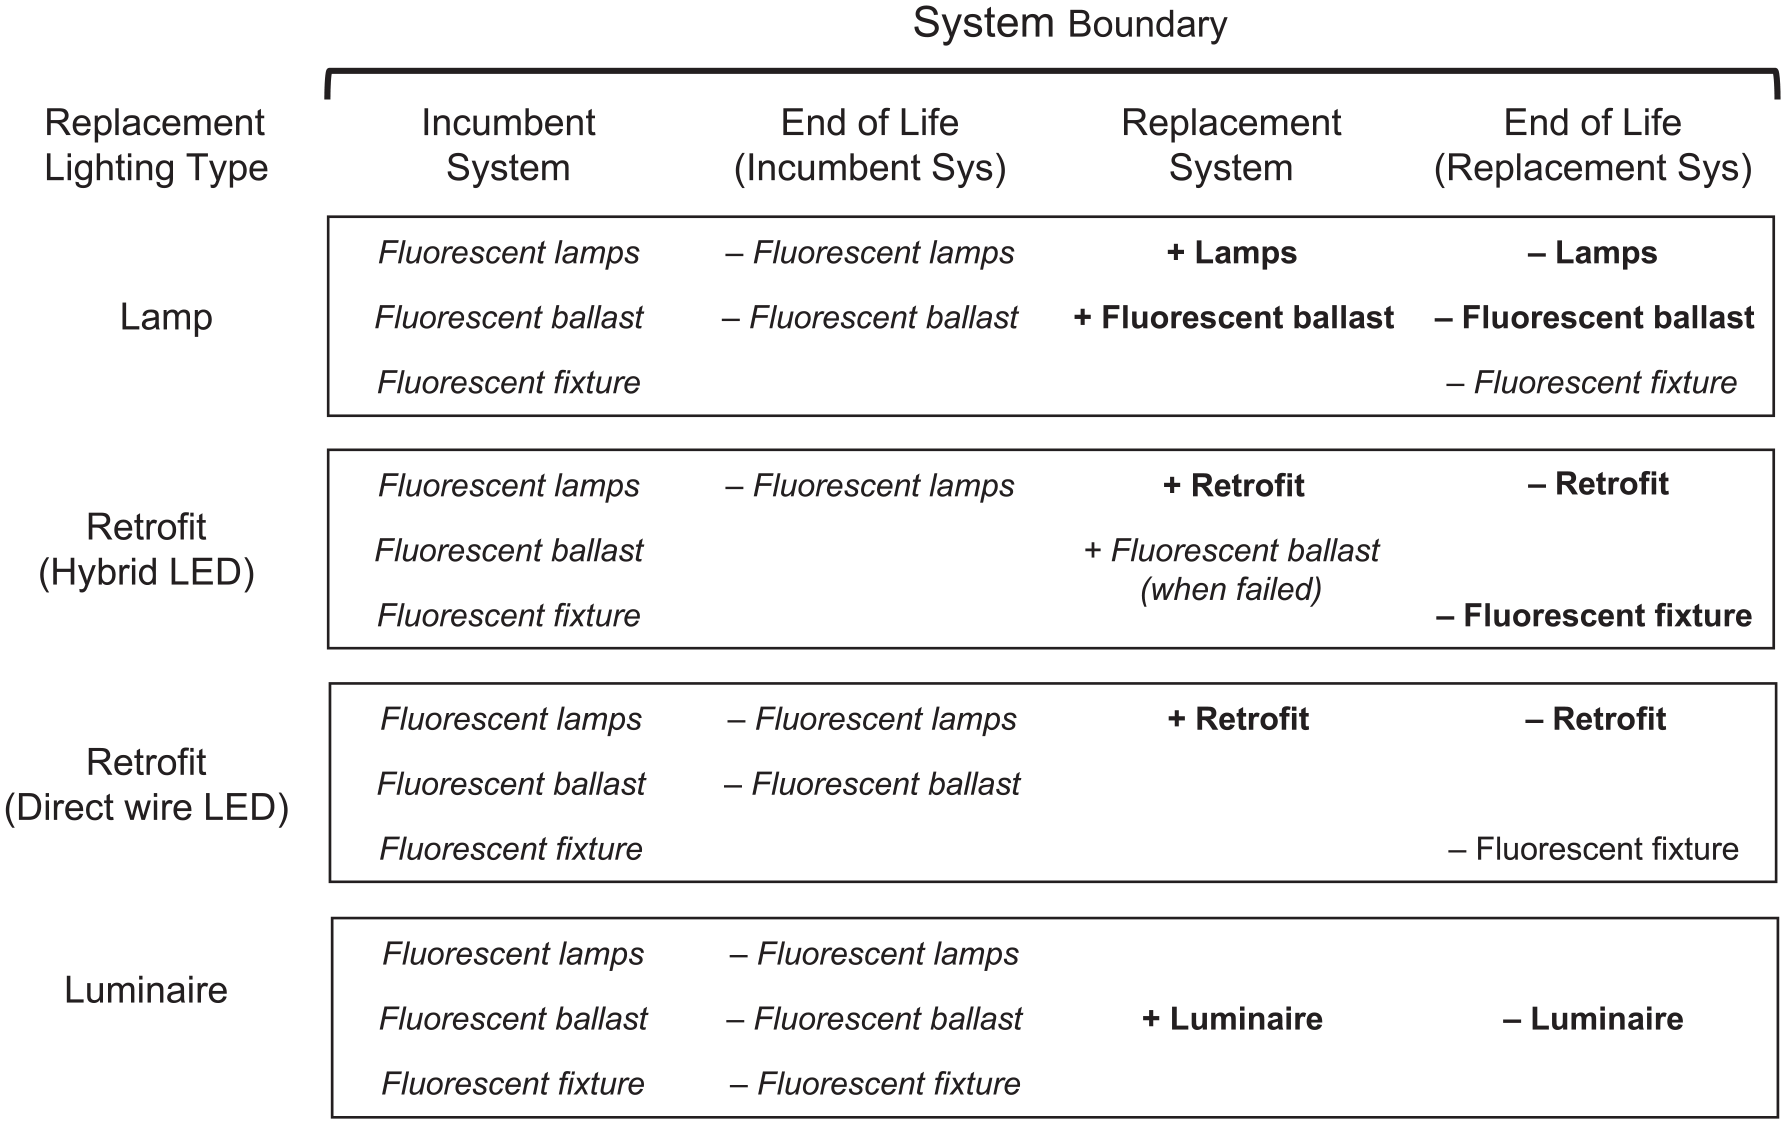
LCC product system boundary based on replacement lighting type
2.1 LCC analysis
This LCC analysis uses a method similar to that in DOE’s T8 LED cost-effectiveness report, 7 as well as the same key parameters to maintain result comparability. The LCC method used is consistent with the National Institute of Standards and Technology 15 Handbook 135 – LCC manual for the federal energy management program. Differences from the DOE report are (1) actual product data are collected and used in this analysis, whereas estimated product attributes based on technology projections are used in the DOE report; (2) SCC is included in this study and (3) in addition to total LCC, normalized LCC (NLCC) is assessed, allowing the comparison of products with different lumen ratings to be made per klm of light service delivered. For the LED options, simple cost payback relative to a fluorescent lamp and ballast benchmark system is also calculated. The mathematical formulation for this LCC analysis is available in Section B of the Supplemental Material.
The performance rating of the lamps surveyed varies between model and make. To ensure consistent comparison, the performance requirement is defined such that each lamp is at least 1800 lm in rated luminous flux and a CIE General Colour Rendering Index (CRI) of at least Ra=80. This rated lamp luminous flux is chosen because the lamps were categorized by lumen levels and 1800 lm represents the 19th percentile of the lamps surveyed. Most light sources have a CRI between 80 and 100. Indeed, all the lamps surveyed have a CRI of 80 or more. System lumen output is the total lumen output from a system after accounting for the ballast factor, which measures how a ballast affects lumen output relative to a reference ballast. At a normal ballast factor of 0.88, the minimum lumen output for a two-lamp system is 3168 lm (1800 lm/lamp × 2 lamps × 0.88). Data were collected from an online lighting vendor for 56 fluorescent lamps, 91 LED lamps and retrofits, 2 LED-ready fixtures and 19 LED troffer luminaires. 16 Of the LED lamps and retrofits, 54% are direct wire, 28% are plug & play and 17% are hybrid lamps, indicating that the market is trending towards direct wire LEDs. All LED lamps have a rated lifetime of 50 000 h. Further information on the replacement products is in Section A of the Supplemental Material.
This analysis assumes a ten-year time horizon at a discount rate of 3% which yields a capital recovery factor of 0.114. Four annual operating hours are accessed – 1000 h (suitable for home setting), 2000 h (baseline, suitable for school setting), 4000 h (suitable for industrial spaces) and 8760 h (24/7 operation). The ballast factors examined are 0.76, 0.88 (baseline) and 1.18, which yield a minimum system lumen requirement of 2727 lm, 3163 lm and 4248 lm, respectively. These requirements govern the number of replacement lamps, retrofits and luminaires used in the LCC calculations. The per-hour electrician labour cost rates examined are £41.30 ($50), £62.00 ($75) (baseline), £82.60 ($100) and £103.30 ($125). The per-kWh electricity prices explored are £0.07 ($0.08), £0.09 ($0.11) (baseline), £0.16 ($0.20) and £0.24 ($0.29). These reflect the range of US state-average commercial electricity rates in 2019, which was between £0.07 ($0.08 in Oklahoma) and £0.24 ($0.29 in Hawaii), with a national average of £0.09 ($0.11). 1
Tähkämö et al.’s study 17 shows that the use phase of a fluorescent T5 fixture accounts for over 80% of its life cycle carbon emissions. Liu and Keoleian, 18 in a comparison of the environmental impacts of reusing, recycling and landfilling a fluorescent linear fixture and a LED linear fixture, also showed the dominance of the use phase across all scenarios, particularly in terms of carbon emissions. Therefore, it is sufficient to consider the SCC only for the use phase electricity consumption in this study. The Intergovernmental Panel on Climate Change 2013 global warming potential (GWP) 100a (V1.03) per kWh of US low voltage electricity is 0.699 kg CO2-equivalent. The SCCs examined are £0 ($0), £21.80 ($26.46), £43.60 ($52.92) (baseline) and £127.60 ($154.98) (which corresponds to high impact at the 95th percentile in present value) per metric tonne CO2. The SCCs have an annual increase of £0 ($0), £0.41 ($0.50), £0.83 ($1.01) and £3.10 ($3.78), respectively, per metric tonne CO2. 14
An electrician rate of £62.00 ($75) per hour is used to estimate the labour costs. The cost of spot replacement (i.e. relamping) is £3.10 ($3.75) per lamp and £12.40 ($15) per ballast based on 0.05 h and 0.20 h of estimated labour, respectively. Recycling fee is assumed to be £0.13 ($0.16) per fluorescent lamp and £0.04 ($0.05) per ballast. Since LED lamps and luminaires do not contain mercury like fluorescents, their recycling cost is assumed to be £0.04 ($0.05) per lamp and £0.62 ($0.75) per luminaire based on mass allocation. For reference, an LED lamp weighs roughly the same as the ballast, whereas an LED luminaire weighs about 15 times more. The annual expected maintenance cost is the product sum of the annualized expected failure rates and their total replacement cost combining material, recycling and labour costs. The annualized expected failure rate, or the probability that a component fails in a given year, is based on how much that component has been in use in that year relative to its rated lifetime (i.e. the more it is used, the more likely it is to fail). Additional costs, such as design and planning and inspections, which may be required in actual projects, are not included.
2.2 Replacement options
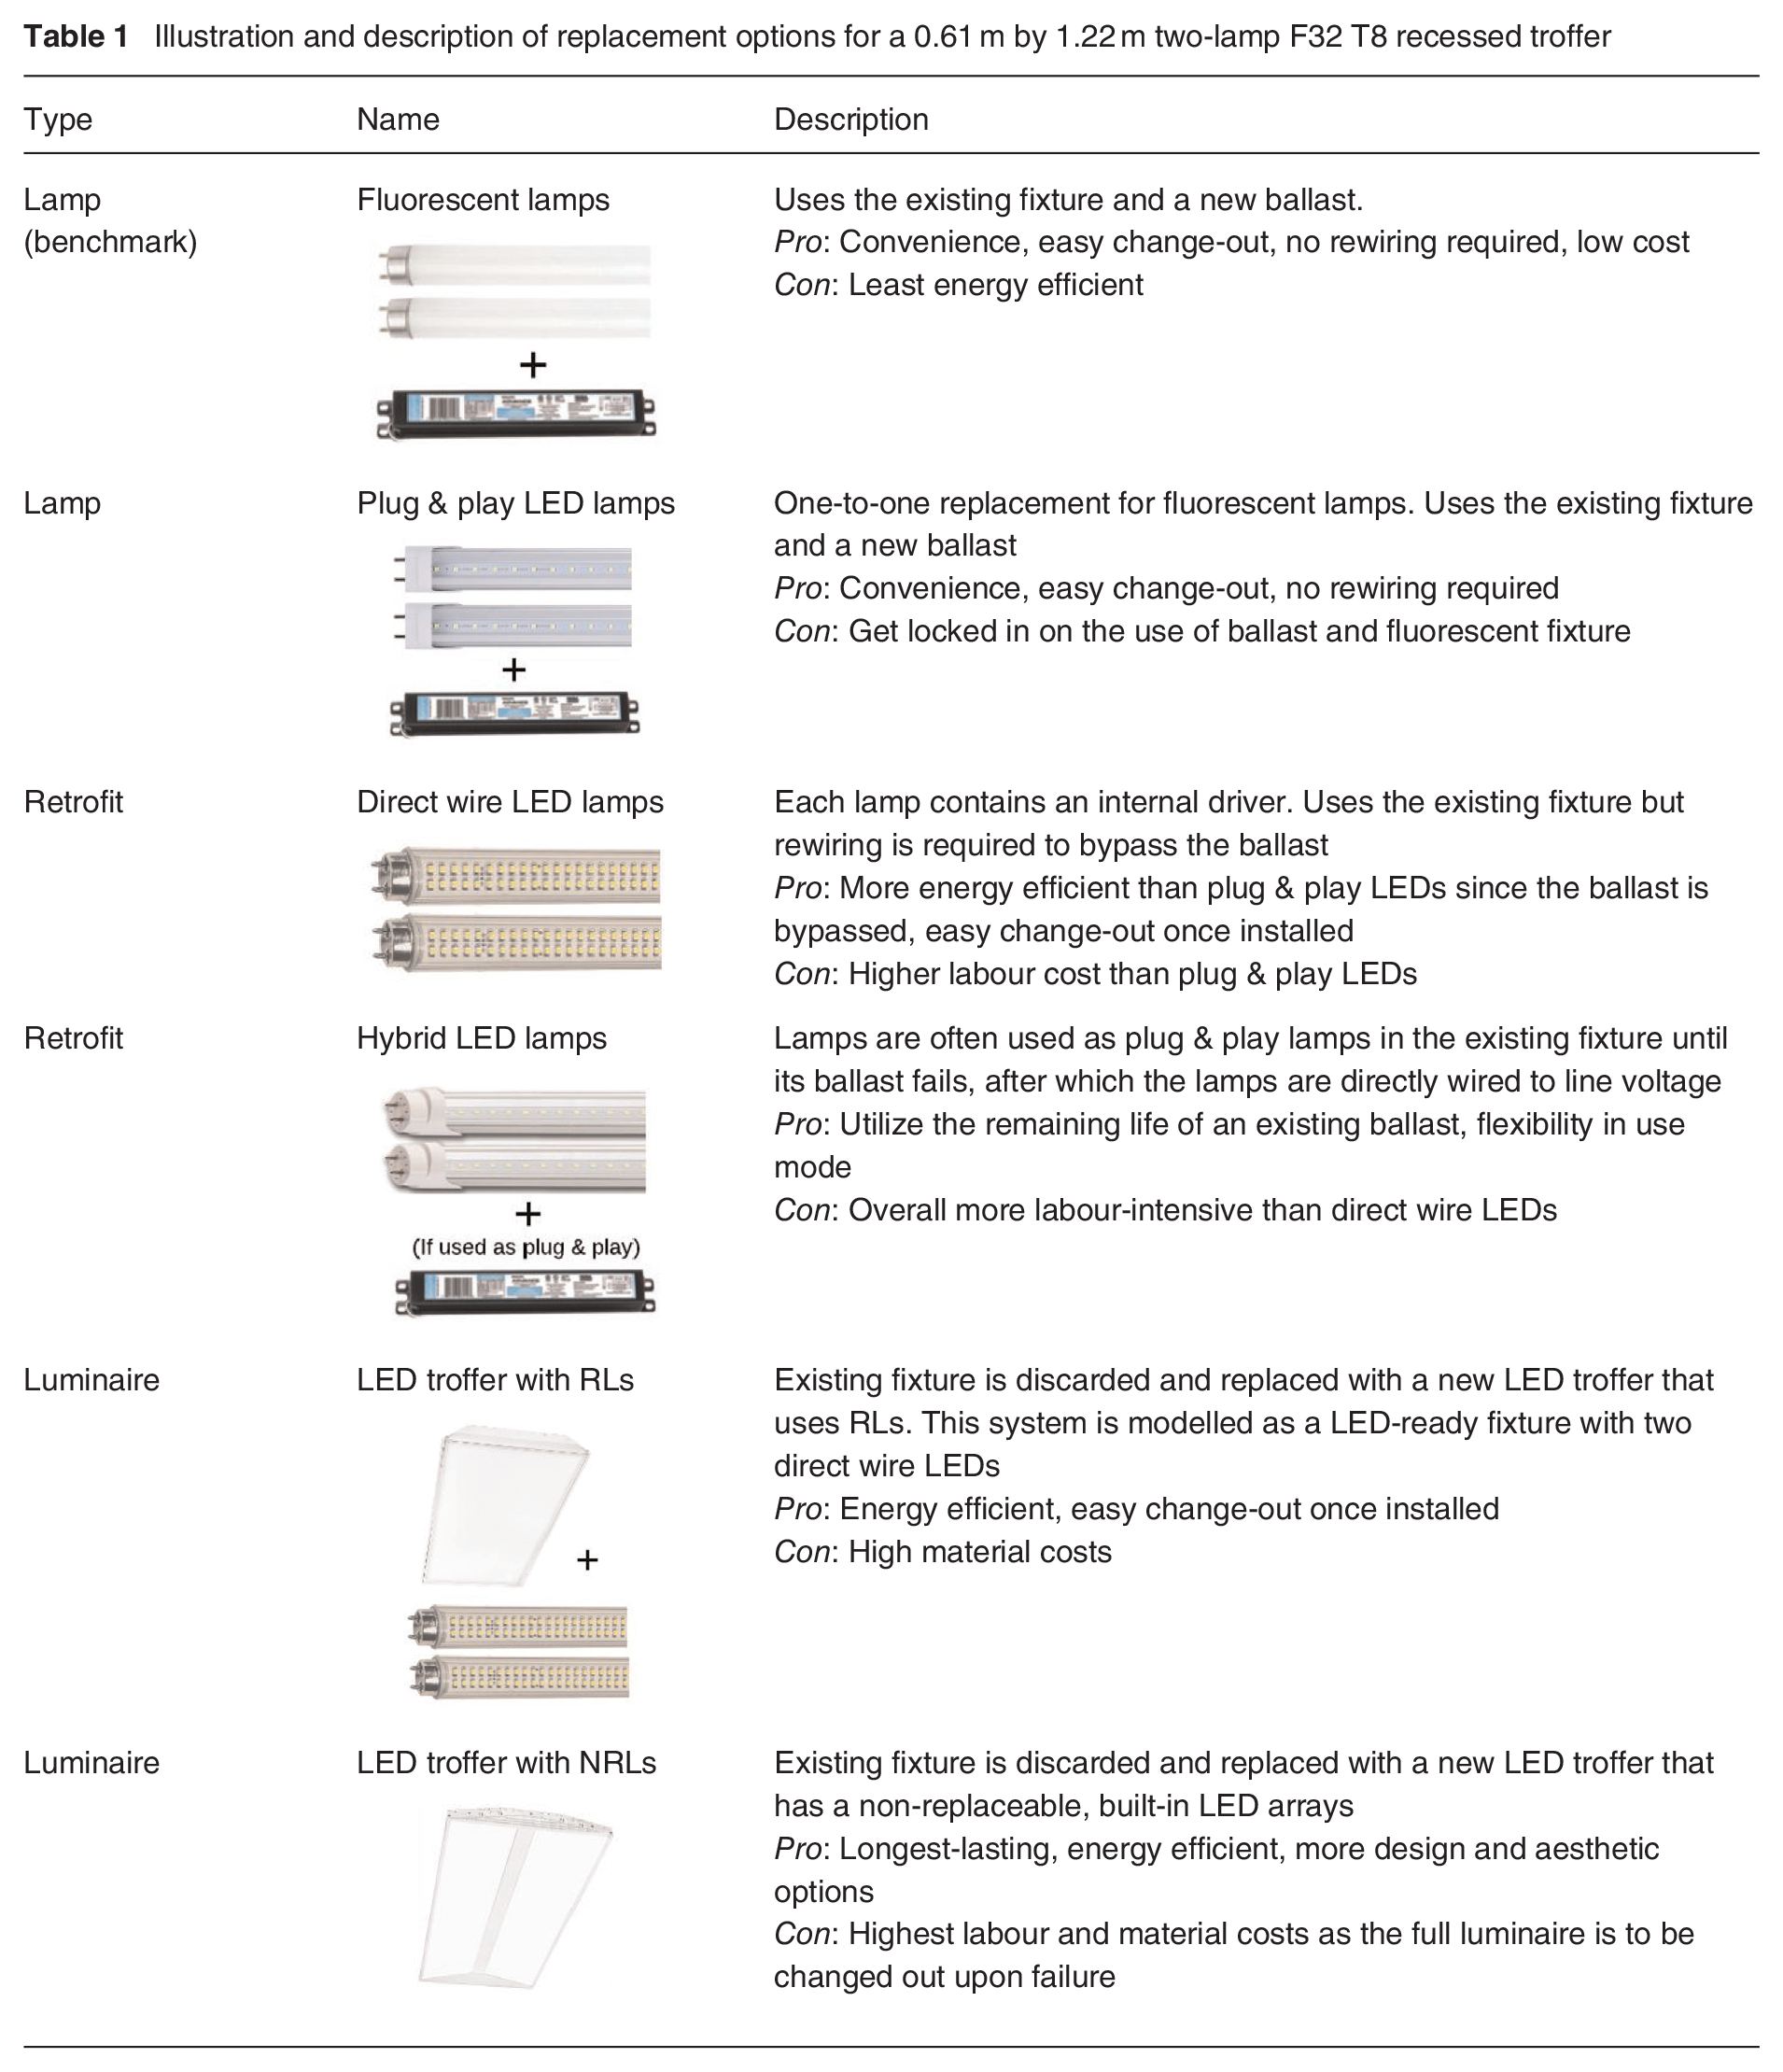
Six lighting product options (one fluorescent and five LED systems) for replacing a 0.61 m by 1.22 m two-lamp F32 T8 troffer are examined, which are summarized in Table 1. The lighting options can be categorized into three replacement types – lamp replacement, retrofits and luminaire replacements. A lamp replacement is a change-out of the lamps only and does not require any electrical modification. Fluorescent lamps and plug & play LEDs fit this category. A retrofit involves modifying the existing fixture to accommodate a new light source and/or electronics. Retrofits include ballast-bypass LEDs and hybrid LEDs. Luminaire replacement is a full change-out of the lighting system, including the mechanical structure. This replacement type includes an LED troffer with replaceable lamps (RLs) and LED troffer with integrated non-replaceable lamps (NRLs). While lamp replacements and retrofits offer quick and lower-cost ways to upgrade to LEDs, full luminaire replacements are typically longer lasting and more energy efficient. However, higher material and labour costs are often required.
Illustration and description of replacement options for a 0.61 m by 1.22 m two-lamp F32 T8 recessed troffer
2.2.1 Lamp retrofits: Fluorescent lamps
Linear fluorescent lamps are used as the benchmark for this study. The T8 fluorescent lamps surveyed have an efficacy range between 62 lm/W and 100 lm/W, a price range between £0.40 and £3.80 ($0.48 and $4.58) per klm and a rated lifetime between 20 000 h and 84 000 h. DOE 7 projected that 32 W fluorescent lamps would be replaceable with 28 W or 30 W counterparts today given the minimum performance requirement of 1800 lm and a CRI of 80. However, contrary to this assumption, no 28 W or 30 W fluorescent lamps could meet these requirements. Therefore, 32 W fluorescent lamps are surveyed in this study. Prior to their installation, a change-out of the ballast is assumed for two reasons: (1) a new ballast allows for energy efficiency gain and (2) the existing ballast will most likely burn out before new lamps do. Thus, with both the lamps and the ballast, the total material cost is £8.70–£54.60 ($10.57–$66.03) with an average of £23.50 ($28.46). The installation cost is £15.50 ($18.75) based on 0.25 h labour, with recycling cost estimated to be £0.31 ($0.37) at end of life. The average material cost of this benchmark system is £34.20 ($41.39) compared to £24.80 ($30) in the DOE report. 7 The system efficacy averages 91 lm/W compared to 88 lm/W assumed in the DOE report.
2.2.2 Lamp retrofits: Plug & play LEDs
As their name suggests, plug & play LED lamps (UL Type A) are designed to be a direct replacement for fluorescent lamps. They are ballast-compatible to allow for lamp swaps without having to rewire the fixtures. The system lumen output is proportional to the ballast factor, and the ballast increases the system energy demand by 2 W–3 W per lamp. 19 Plug & play replacements are best suited for applications where fast replacement with minimal labour is desired, such as retail and limited access lighting.
The plug & play LEDs surveyed have an efficacy range between 127 lm/W and 164 lm/W and a price range between £1.70 and £4.30 ($2.08 and $5.20) per klm. A change-out of the ballast is assumed prior to installation to enhance energy performance (as with fluorescent lamps). The total material cost for two lamps and a ballast is £12.80 to £54.90 ($15.43 to $66.47) with an average of £28.80 ($34.82). The cost to install the system is £15.50 ($18.75) based on 0.25 h of labour, with recycling cost estimated to be £0.12 ($0.15) at end of life.
2.2.3 Lamp retrofits: Ballast-bypass LEDs (direct wire LEDs)
Ballast-bypass LEDs require the existing fixtures to be rewired, including disconnecting the ballast. Because the ballast is bypassed, the system performance is not subject to the ballast factor. Direct wire LEDs (UL Type B) are a type of ballast-bypass LEDs that have an internal driver built in and are among those surveyed in this study.
Direct wire LEDs are further categorized as single ended or double ended based on the number of pins on the ends of the tubes. This categorization is important for determining what type of sockets are required in the fixtures. Using the wrong sockets can cause short circuits and electrical fire as well as damage to the lamps. Shunted sockets supply line voltage to both ends of the lamps and only double-ended tubes can be used with them. Non-shunted sockets are compatible with either pin types as only one of the sockets supplies line voltage to the lamps. Retrofitted fixtures are often wired with non-shunted sockets for maximum compatibility.
The direct wire lamps surveyed have an efficacy range between 113 lm/W and 150 lm/W and a price range between £1.80 and £7.00 ($2.22 and $8.47) per klm. The total material cost for two lamps is £6.60 to £23.10 ($7.98 to $27.96) with an average of £12.70 ($15.37). The cost to install these lamps is £31.00 ($37.50) based on 0.5 h of labour per fixture, with recycling cost estimated to be £0.08 ($0.10) at end of life. Another type of ballast-bypass lamps are LED lamps that operate with an external driver (UL Type C). Since this type of lamp is not widely available currently, they are not modelled in this study.
2.2.4 Lamp retrofits: Hybrid LEDs
This LED type is a hybrid of direct wire and plug & play (UL Type A&B) and is intended to offer upgrade flexibility. The LED lamp can be used as a plug & play to capitalize on the remaining life of an existing ballast before the fixture is rewired for ballast-bypass lamps. This replacement strategy, which distinguishes the hybrid option from that of a plug & play or a direct wire, is what is assumed in the LCC analysis.
The hybrid lamps surveyed have an efficacy range between 113 lm/W and 150 lm/W and a price range between £1.80 and £7.00 ($2.22 and $8.47) per klm. The material cost for two lamps is £9.50 to £17.60 ($11.46 to $21.24) with an average of £12.20 ($14.80), and it costs £0.08 ($0.10) to recycle both lamps at end of life. The labour cost is estimated at £6.20 ($7.50) when installing them as plug & play lamps, plus an additional £31.00 ($37.50) to rewire the fixture when the ballast fails.
2.2.5 Lamp retrofits: Ballasts
Ballasts and LED drivers serve the same purpose in lighting systems – they regulate the input electricity for the lamps to maintain light level and prevent damage by high current. Traditional magnetic ballasts naturally vibrate, which causes audible buzzing. They also cause visible light flicker because they modulate current at relatively low frequency. High-frequency electronic ballasts, which are the replacement technology, eliminate audible and visible artefacts by regulating the current and voltage at high frequency. In addition, electronic ballasts are more energy efficient, longer lasting (by a factor of 2) and lighter weight. 20
Replacement F32 electronic ballasts include instant start and program ballasts, all of which have a rated lifetime of 150 000 h. The ballasts can be further categorized into three groups based on their ballast factors. A ballast factor denotes how many lumens the lighting system will produce relative to the lamps’ rated output when integrated with the ballast. For a fluorescent system, the ballast factor also affects the system wattage. Based on the ballasts surveyed, low, normal and high ballast factors have an average value of 0.76, 0.88 and 1.18, respectively. Their costs are £10.90–£20.20 ($13.27–$24.50) with an average of £13.20 ($16.01), £6.50–£30.40 ($7.85–$36.79) with an average of £13.80 ($16.69) and £11.60–£13.10 ($13.99–$15.86) with an average of £15.00 ($18.18), respectively. The cost to replace a ballast is £12.40 ($15) based on 0.20 h of labour.
2.2.6 Luminaires: LED troffers with RLs
This option is modelled as two direct wire LEDs paired with an LED-ready fixture. One potential advantage of this option compared to the direct wire retrofit LEDs is its less complex electrical modification. Hence, the amount of labour required is estimated to be 0.4 h or £24.80 ($30) in cost. Only two LED-ready fixtures are available at the time of data collection. The average material cost of the fixture is £39.10 ($47.35), and the recycling cost is £0.58 ($0.70) on top of the costs of the direct wire LEDs.
2.2.7 Luminaires: LED troffers with NRLs
LED troffer luminaires are designed to leverage the full benefits of LED packages. They are energy efficient, durable and can last up to 100 000 h, which is twice as long as LED lamps and retrofits. Since their light sources are integrated and non-replaceable, higher material and labour costs are required upon their failure or retirement.
The LED troffers with integrated lamps surveyed have an efficacy range between 102 lm/W and 140 lm/W and a price range between £10.00 and £44.80 ($12.09 and $54.17) per klm. Their rated lifetime is between 50 000 h and 100 000 h. The material cost is £51.90–£179.10 ($62.82–$216.67) with an average of £85.30 ($103.21). The cost to install the luminaire is £31.00 ($37.50) based on 0.50 h of labour, with recycling cost estimated to be £0.12 ($0.15) at end of life.
Figure 2 illustrates the system efficacy and material cost with respect to system lumen output for the six replacement options (one fluorescent and five LEDs, as described in Table 1). For the fluorescent and plug & play lamps, their system costs include the cost of the ballast. The dashed line is the minimum system luminous requirement for a troffer operating at a ballast factor of 0.88. For each LCC calculation, replacement lamps are excluded if their lumen outputs do not meet the minimum performance requirement. At a ballast factor of 0.88, six plug & play LEDs and one hybrid LED are excluded. The number of LED lamps and retrofits used in the LCC calculation decreases with a higher ballast factor (see Section C of Supplemental Material for details).
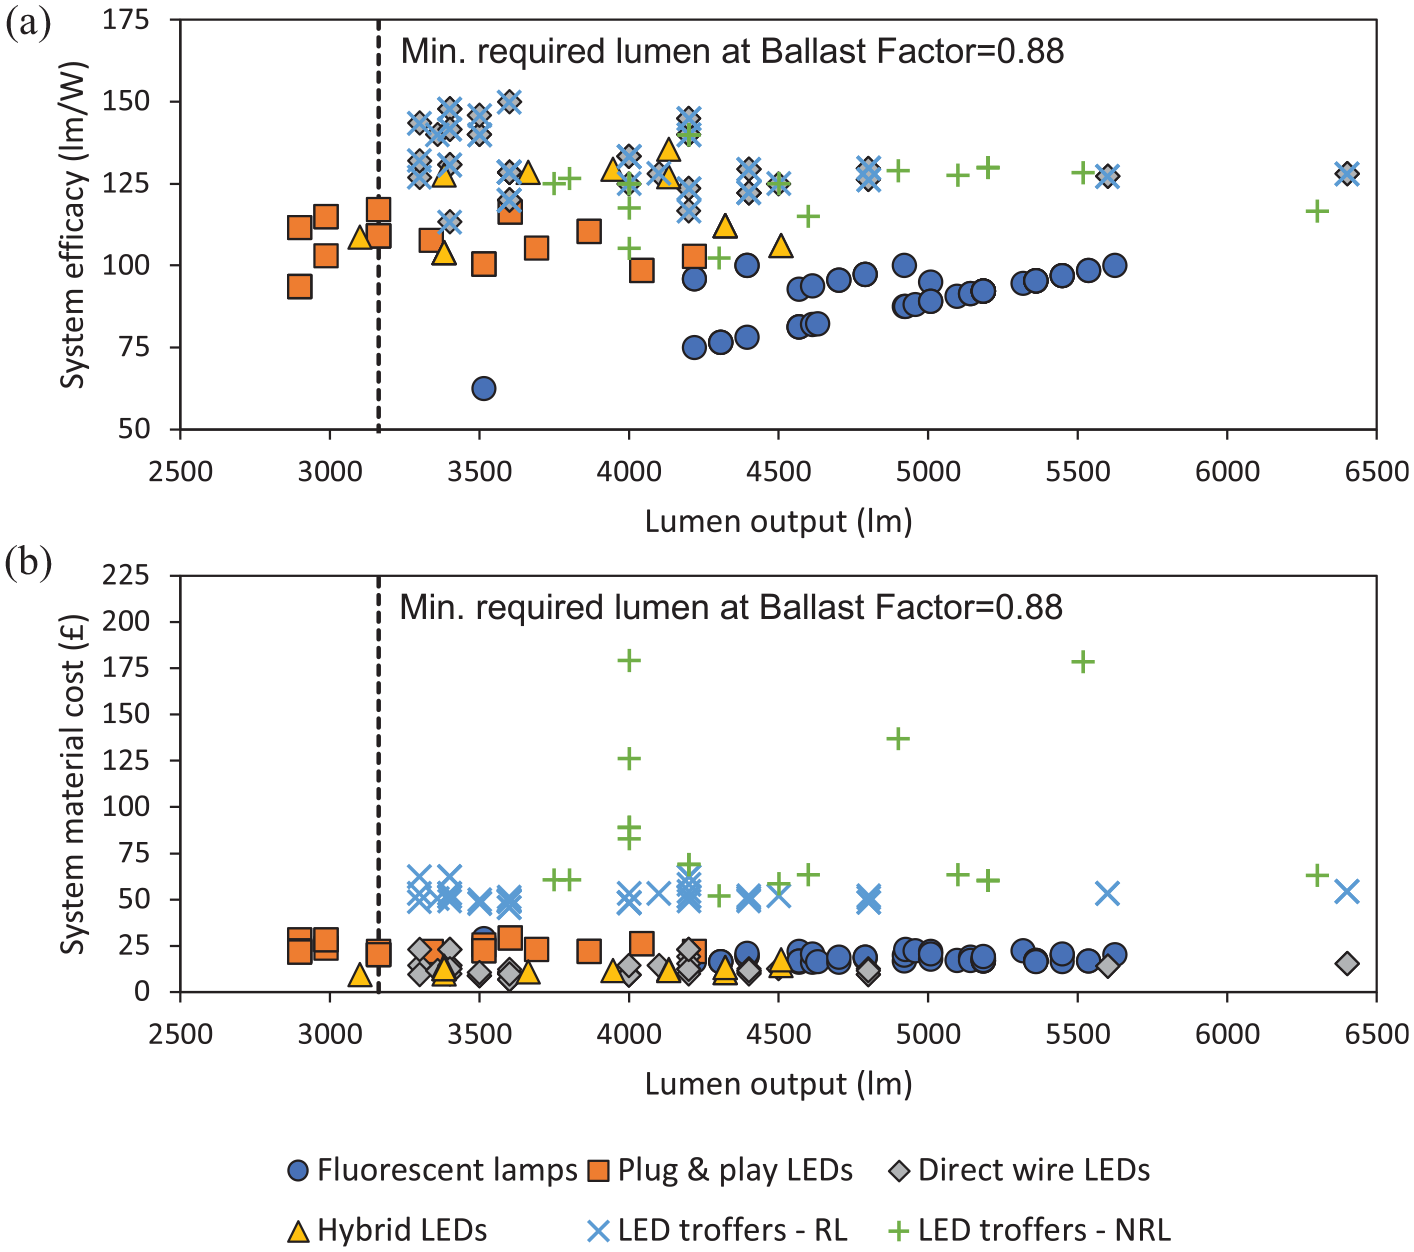
(a) System efficacy and (b) material cost for six types of replacement lighting products
Tables 2 and 3 provide a summary of the model system and cost parameters described in Sections 2.1 and 2.2. Of note, the rated efficacy is per light source for all lighting options except LED troffers with NRLs, the efficacy of which is rated for the complete fitting. These rated efficacies are adjusted by the ballast factor, where applicable, to yield system efficacies. Tabular data on surveyed product attributes and costs are available upon request.
Summary of model system parameters
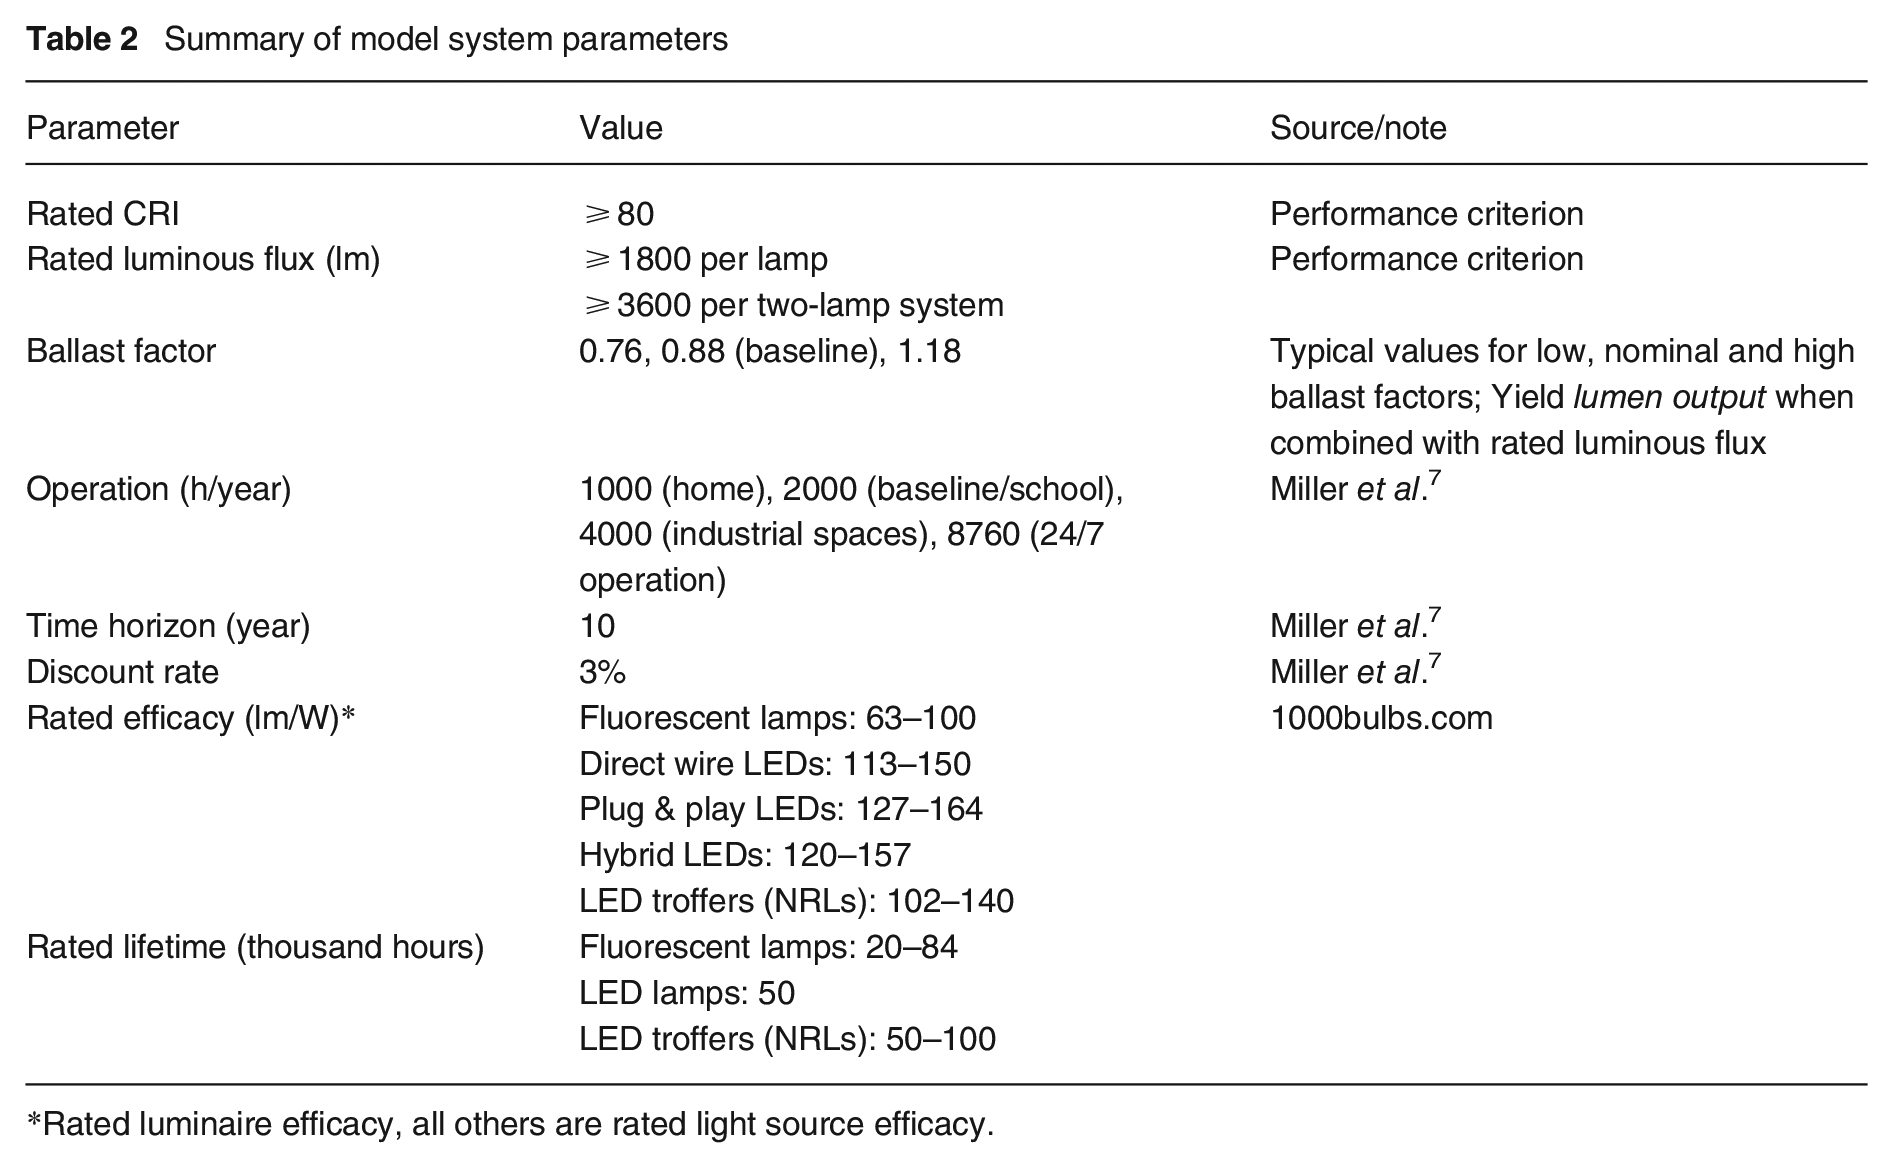
Rated luminaire efficacy, all others are rated light source efficacy.
Summary of model cost parameters
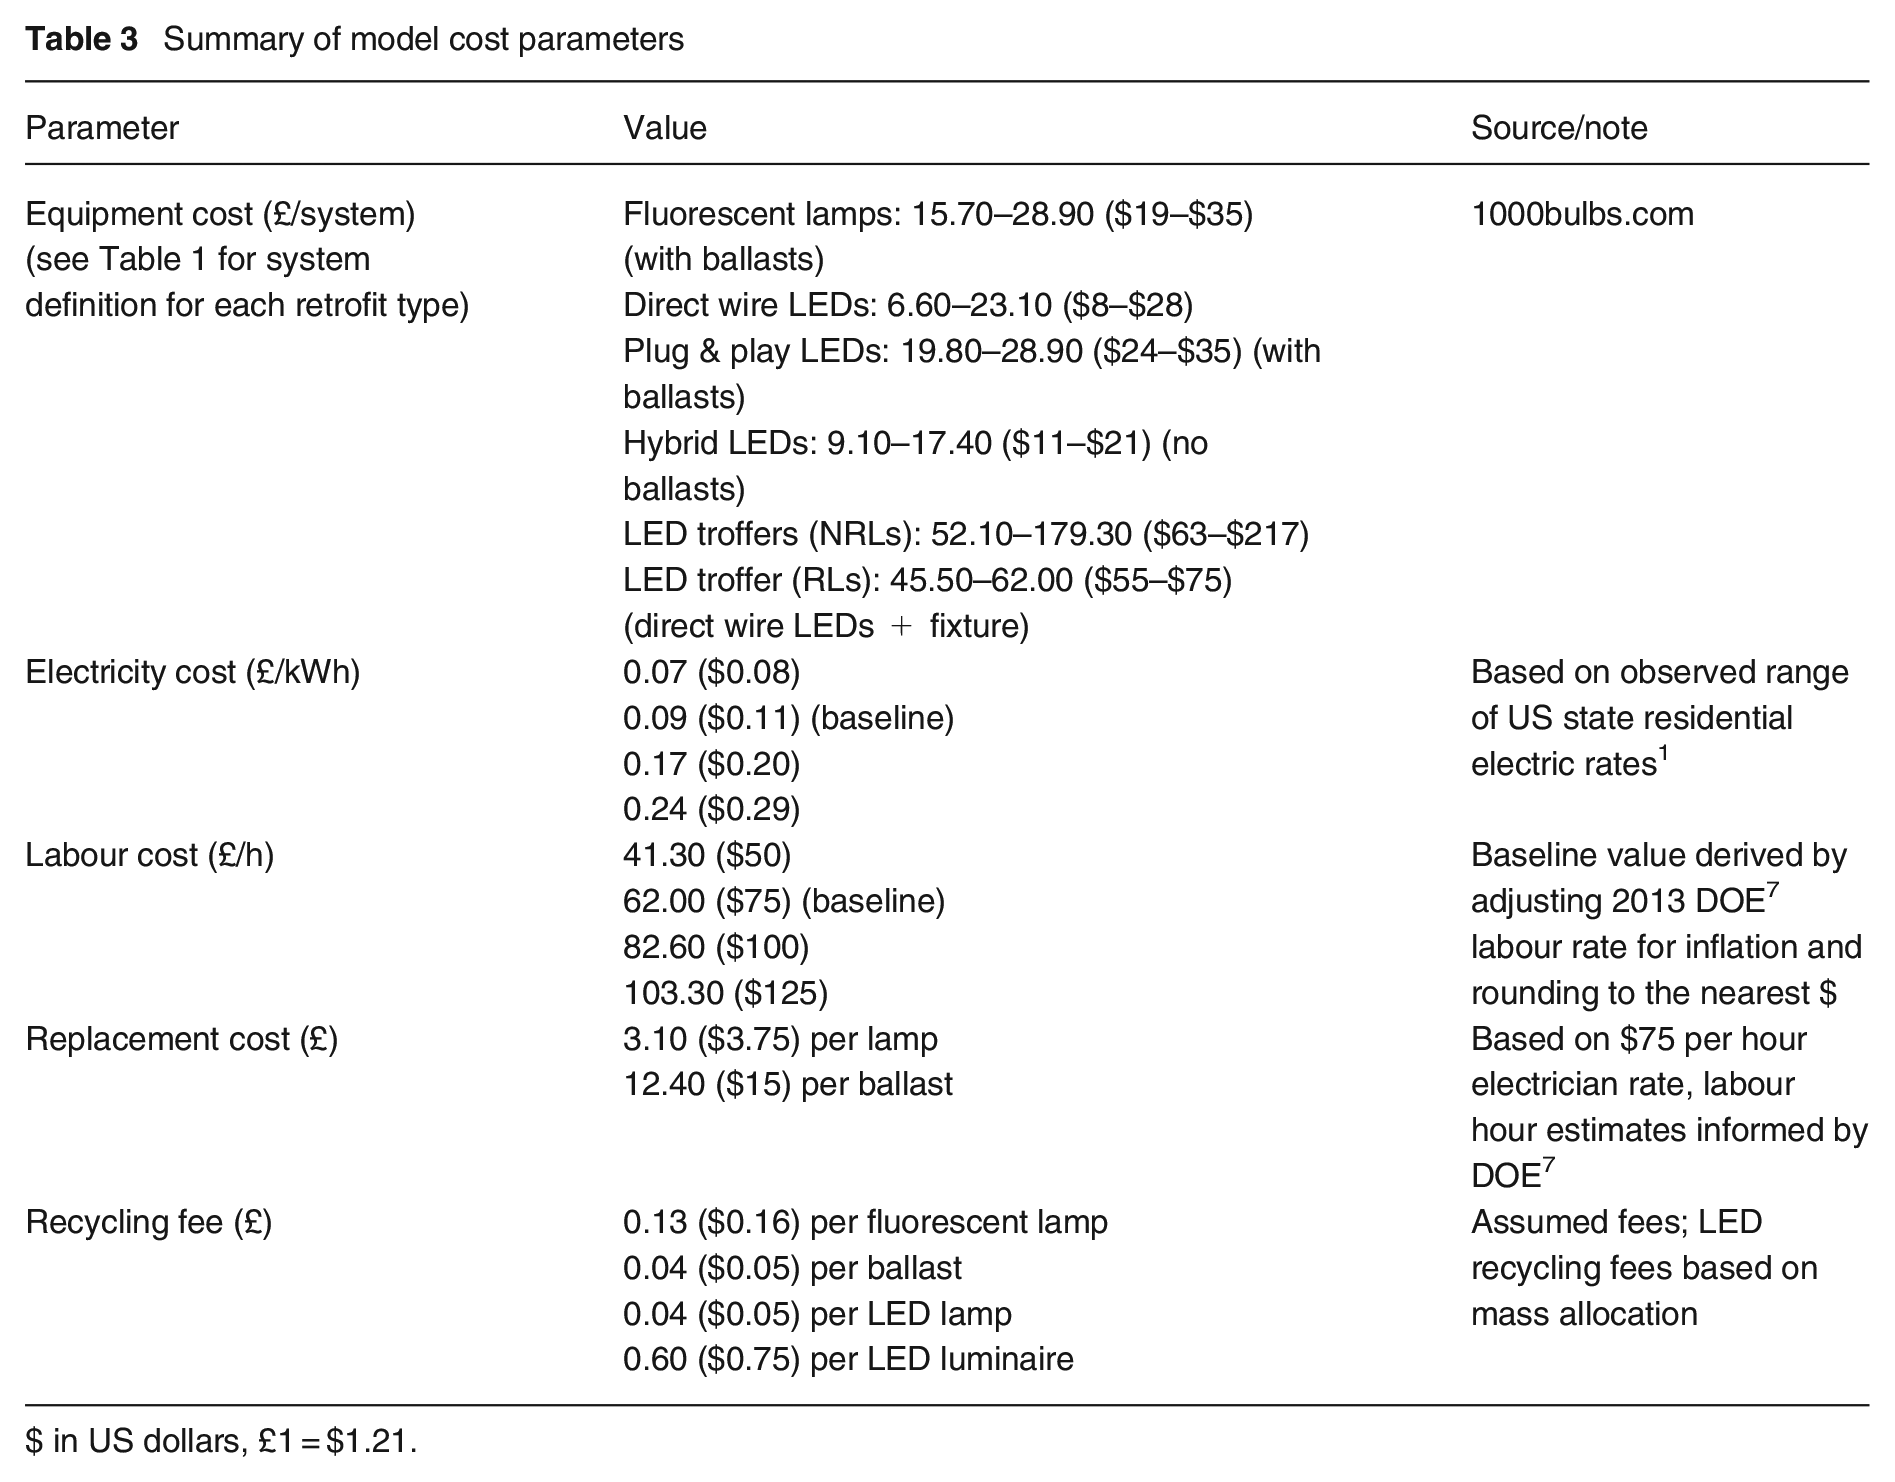
$ in US dollars, £1 = $1.21.
3. Results
3.1 Baseline
Based on the baseline parameter values in Tables 2 and 3, Figure 3 shows the average LCC decomposition, range of system efficacy, range of LCC in present value and range of NLCC for each of the six replacement options. The boxes of Figure 3(b) to 3(d) represent the 25th, 50th and 75th percentile values, with the whiskers denoting the minimum and maximum values. Compared to fluorescent lighting, a larger portion of the LCC of the LED options come from their upfront cost (Figure 3(a)). This is because LED options are generally more energy efficient and incur lower electricity costs over their lifetimes, thereby making their upfront costs more significant. An exception to this is the hybrid LED option. On average, hybrid LEDs have the lowest material cost and labour cost of all replacement options, making them the most favourable from an upfront cost perspective. This makes sense as hybrid LEDs do not require a ballast and their initial change-out is similar to fluorescent lamps. However, the cost of direct wiring the hybrid lamps as the ballast burns out can increase the maintenance cost over time, making the option the highest in terms of total labour cost. Although the hybrid LED option provides flexibility, deferring electrical modification comes at the expense of higher labour cost over the life cycle.
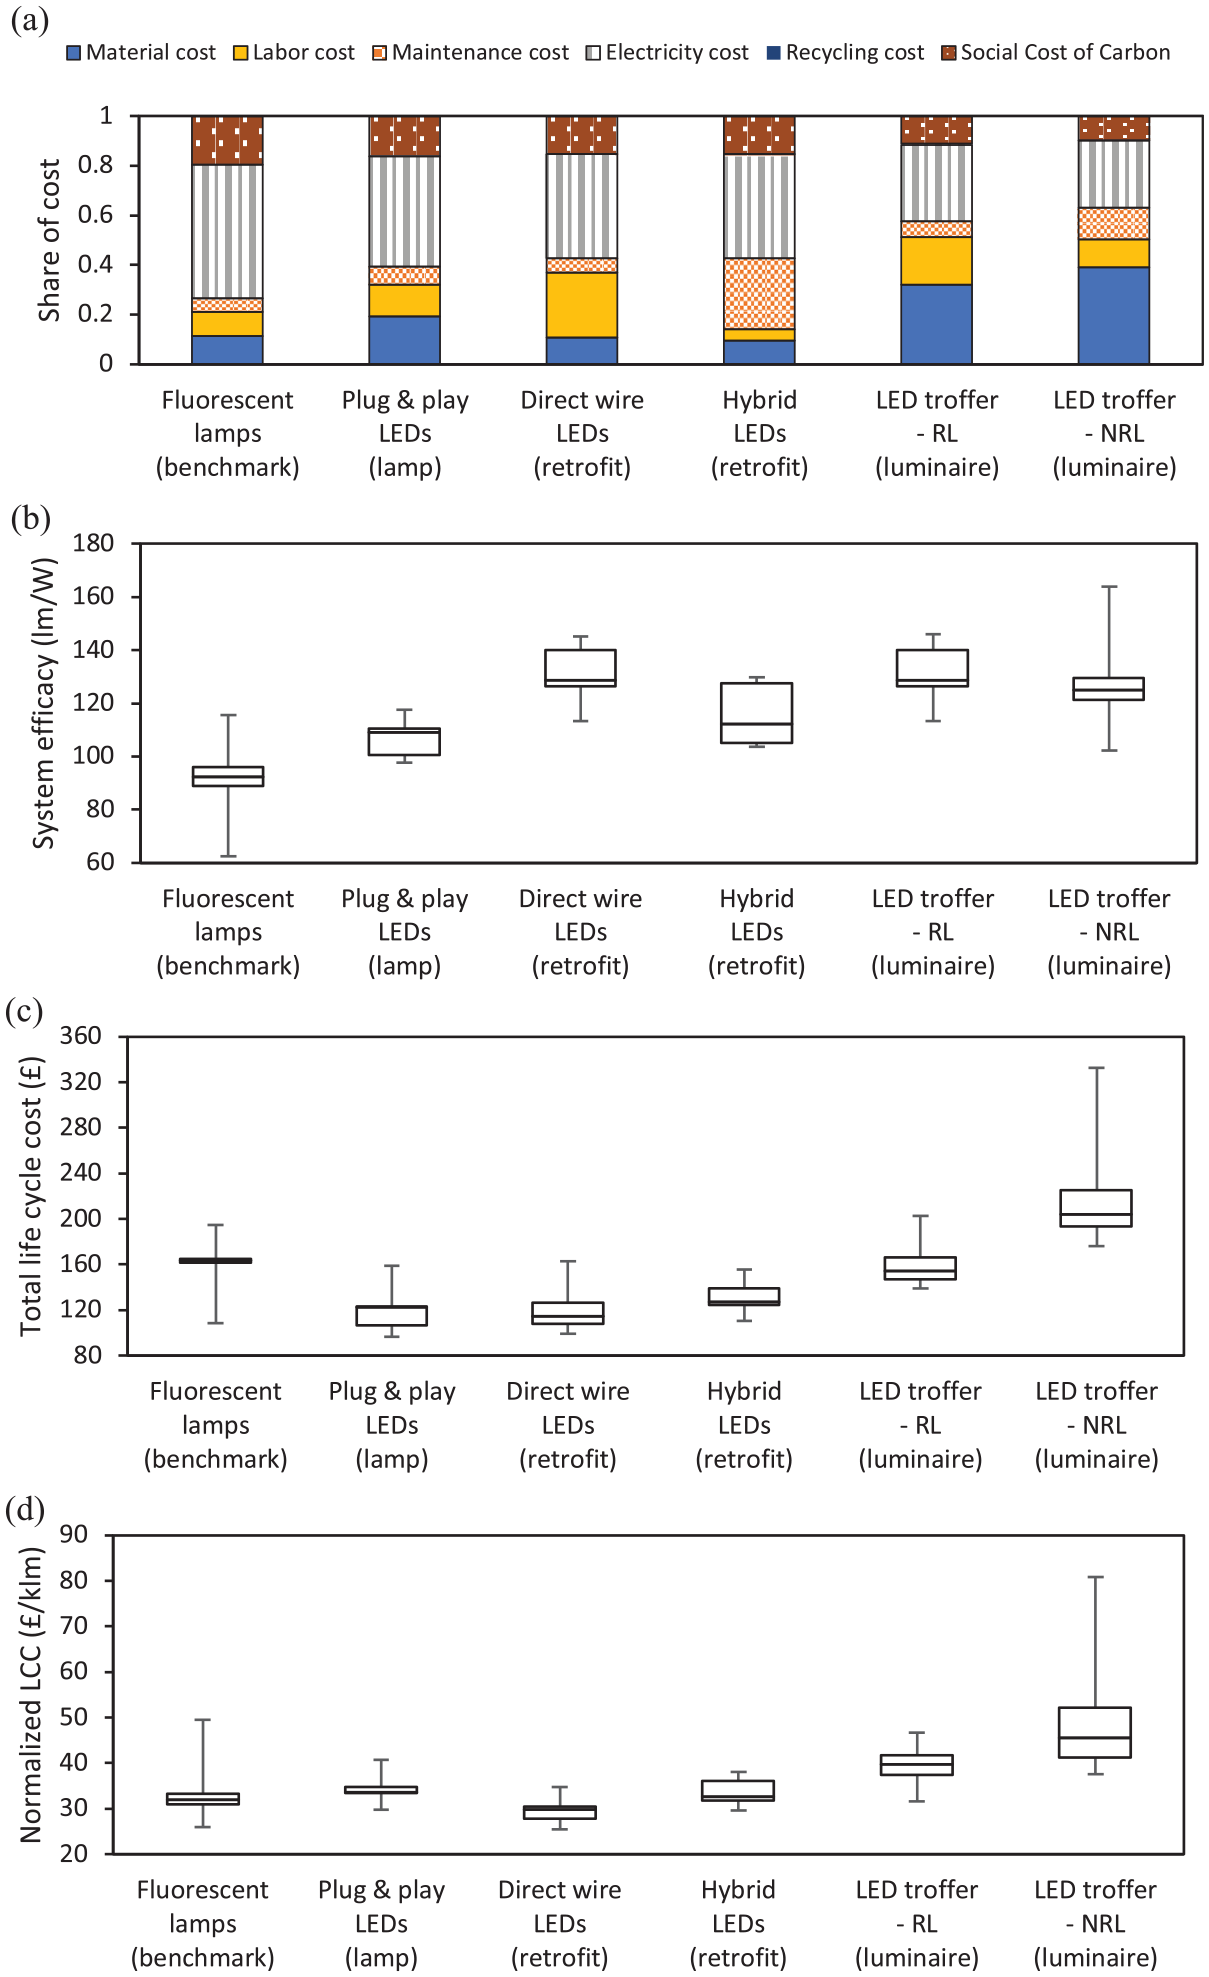
(a) Average LCC components, (b) system efficacy, (c) total LCC in present value and (d) NLCC (per klm) of six replacement options for a 0.61 m by 1.22 m (2 ft by 4 ft) two-lamp F32 T8 recessed troffer
Table 4 compares the mean and 95% confidence intervals of the baseline LCC and NLCC results. The confidence intervals describe the range in which 95% of the calculated costs are expected per the lighting product survey. Based on the mean LCC values, most LED systems are cheaper than the fluorescent benchmark system. But per energy service (i.e. based on mean NLCC values), most LED systems are actually more expensive. A two-tailed t-test is applied to compare whether these cost differentials are statistically meaningful, using an upper threshold value of 0.05 to reject the null hypothesis that each cost differential is not statistically significant. Table 4 shows that the extent to which the LED options compare with the fluorescent benchmark vary. For example, LED luminaires with RLs are lower in LCC than the benchmark, but this difference is not significant. However, all three LED lamps and retrofit options are lower in LCC with high statistical significance and LED luminaires with NRLs are higher in LCC with high statistical significance. Statistical significance corresponds to results with p value <0.05; high statistical significance has a p value <0.01. Another metric for measuring the significance of these cost differences is how much the confidence intervals overlap. For example, although the NLCC of plug & play LEDs are statistically higher than that of the fluorescent benchmark, since the confidence intervals of the former overlap completely with the latter, the difference is not meaningful.
Baseline LCC and NLCC comparison with BM fluorescent lamps (rounded to the nearest £)
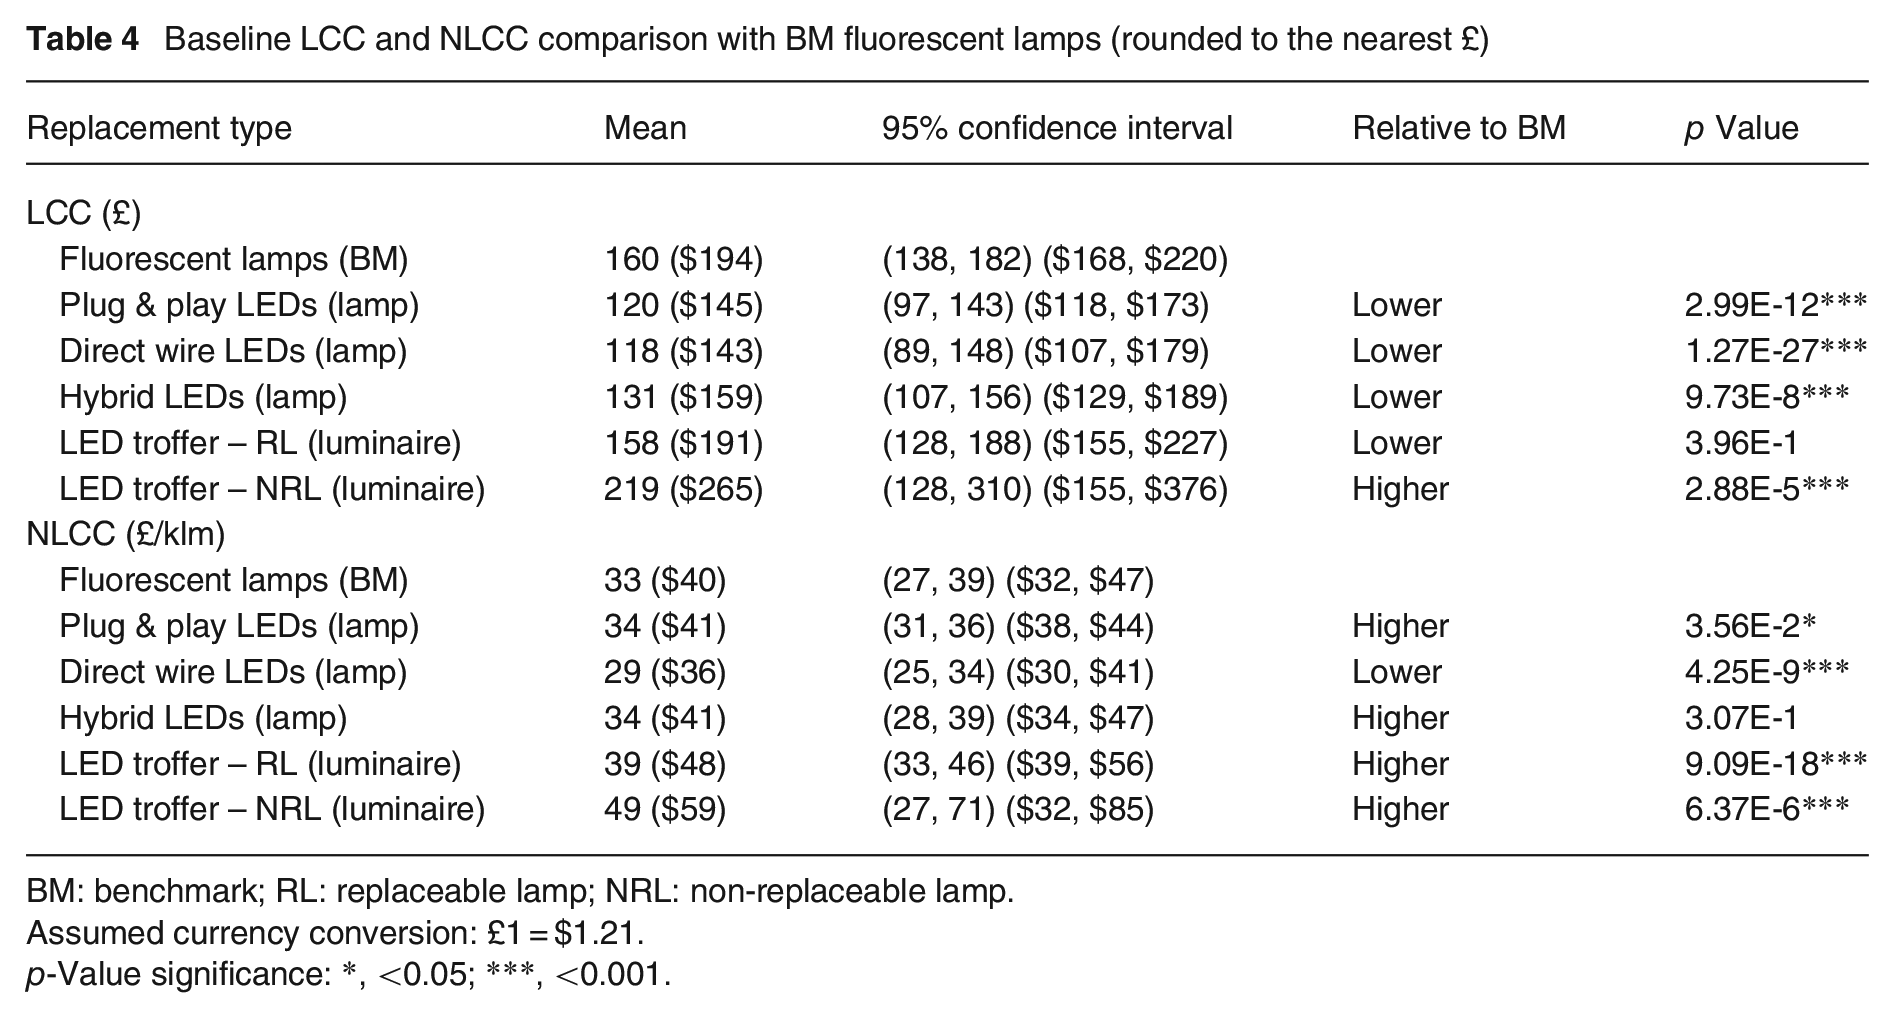
BM: benchmark; RL: replaceable lamp; NRL: non-replaceable lamp.
Assumed currency conversion: £1 = $1.21.
p-Value significance: *, <0.05; ***, <0.001.
All three LED lamps and retrofit options are among the lowest total LCC on average. While the LED troffer with RL option is on par with that of fluorescent lamps. In terms of NLCC, direct wire LEDs score the best on average due to their system efficacies being among the highest of all replacement options, while plug & play and hybrid LEDs are on par with fluorescent lamps. The full luminaire replacement options with NRLs have the highest LCC and NLCC, owing to their high upfront costs, which are also highly variable. Their average upfront cost is 33% higher than that of troffers with RLs.
From an upfront cost standpoint, plug & play LEDs and direct wire LEDs cost on average 14% and 29% more, respectively, than fluorescent lamps. However, they outperform fluorescent lamps in terms of operation (electricity) and maintenance costs. Their simple cost payback relative to the average cost of fluorescent lamps are 1.2 (plug & play) and 2.1 (direct wire) years. If the cost to rewire is included in the labour cost rather than the maintenance cost, the average simple cost payback for hybrid LEDs is 4 years. For LED luminaires with and without RLs, the average simple payback is 12 years and 76 years, respectively. LED luminaires that do not allow for modular replacement require a full equipment change-out, therefore a higher replacement cost, making it the least cost-effective option. However, because these systems are not constrained by traditional lighting format, they could be better designed for minimal efficacy loss.
3.2 Sensitivity analysis
Figure 4 displays how the NLCC varies with respect to: ballast factor, labour rate, electricity price, SCC and annual operating hours. The sensitivity of the NLCC to each parameter can be measured by comparing the slope of each line. Except for ballast factor, the NLCC increases linearly with all the parameters. NLCC generally decreases with increasing ballast factors because at higher system lumen requirements, more low-lumen replacement products are excluded from the analysis, thus increasing the average lumen rating of those that are qualified. Plug & play LEDs are the most sensitive to the ballast factor, as their performance is regulated by both the ballast and their internal driver.
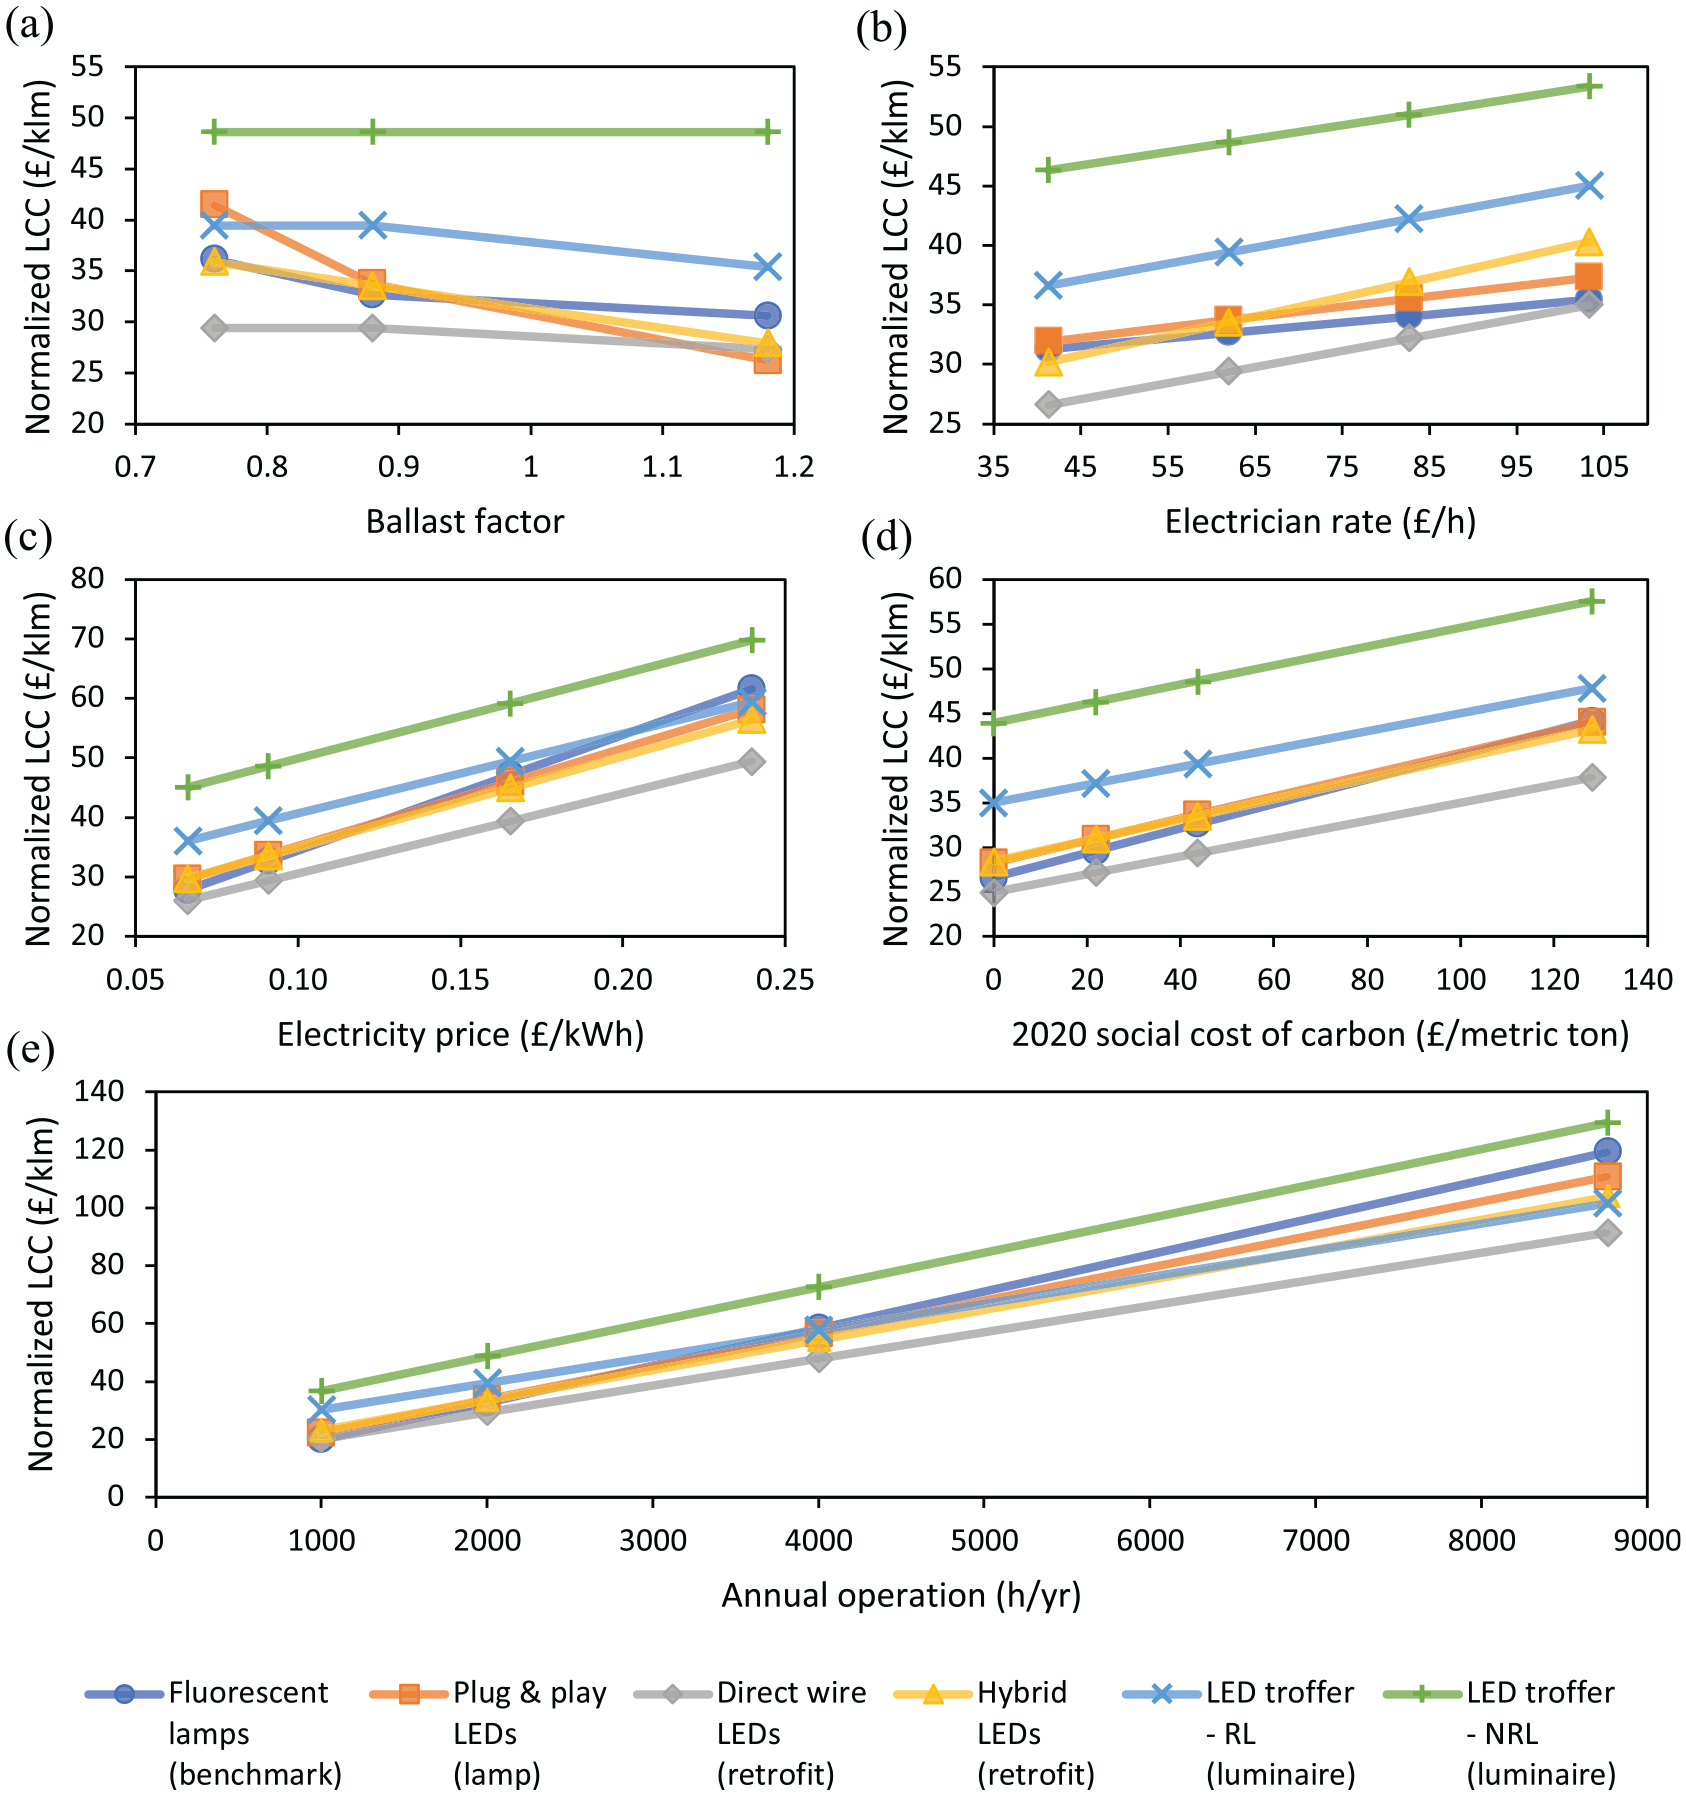
Sensitivity of the mean NLCC (per klm) to (a) ballast factors, (b) electrician rates, (c) electricity prices, (d) SCC and (e) annual operations
The direct wire LED option is the least-cost option in terms of NLCC in nearly all cases. The only exception is when the high ballast factor is used. This LED option also shows the lowest sensitivity to all parameters except the labour rate, since its installation is relatively more labour intensive. The LED luminaire with NRLs is consistently the highest cost option, owing to its high material and maintenance costs. At or beyond 4000 h/year operation, nearly all LED replacement options are more cost-effective than fluorescent lamps. This is also true when electricity price is at least £0.21 ($0.25) per kWh or when SCC reaches £214.90 ($260) per metric tonne CO2 (and increasing at £3.10 ($3.78) per year).
4. Discussion
Compared to the DOE report, 7 the cost and efficacy of the fluorescent benchmark system are higher in this study by 30% and 3%, respectively. The higher cost is due to the 32 W fluorescent lamps assessed in this study being the only lamps that meet the 1800 lm requirement. DOE had assumed that high-efficiency fluorescent lamps meeting this requirement at a lower wattage would be available today. Additionally, the average efficacies of all LED options surveyed are higher by 7%–31% than projected by DOE. However, their relative efficacy difference from that of fluorescent lamps (18%–44% more) are consistent with DOE’s assumption that the LED systems are 25% more energy efficient than the fluorescent benchmark.
A finding different from the DOE report is that fluorescent lamps may no longer be the least-cost option in terms of material cost and upfront cost (material and labour costs). Based on the products surveyed, hybrid LEDs and direct wire LEDs respectively cost 31% and 33% less on average than fluorescent lamps and ballast combined. This means that the costs of maintenance and subsequent replacement are also lower for these LEDs once the fixture has been retrofitted. In addition, hybrid LEDs offer lower upfront costs based on their ability to be used as plug & play LEDs to replace fluorescent lamps directly while the ballast is still functional. If the trend of cost reduction continues for LED lighting, it is likely that other LED lamps and retrofits will also reach upfront cost parity with fluorescent lamps.
This study shows that comparing LCC alone does not provide a full picture of the trade-off between replacement options. While the LED lamps and retrofit options offer lower LCC on average, they deliver 7%–28% less lumens than fluorescent lamps. The inclusion of NLCC as a metric helps capture this trade-off. The results show that all three LED lamps and retrofit options are lower or on par with fluorescent lamps in terms of both average LCC and NLCC. Fluorescent lamps may still fill a niche in high lumen applications as most 32 W-equivalent LED options are lower in rated lumens. Alternatively, higher wattage-equivalent LEDs or additional LED fixtures may be installed to compensate and meet the luminous requirement in this situation.
Table 5 summarizes the average attributes of the LED systems relative to the fluorescent lamps. All LED options are more energy efficient and longer lasting on average than fluorescent lamps. The luminaire options offer more design flexibility. Because they are not constrained to fit incumbent fluorescent fixtures, their packaging can be optimized for energy efficiency, durability and aesthetics, though often at the trade-off of higher cost. The material costs of the LED luminaires surveyed are 1.2–11 times higher than the combined cost of fluorescent lamps and ballast, and 1.2–9.4 times higher than LED lamps and retrofits. Among the LED troffer luminaires, the options with replaceable light sources (e.g. direct wire LEDs with LED-ready fixtures) are lower cost. They can also offer environmental benefits by reducing the amount of waste generated at end of life and the amount of material produced for replacement. 18
Attribute comparison of LED replacement options for troffer lighting relative to benchmark fluorescent lamps (as multiples of fluorescent benchmark)
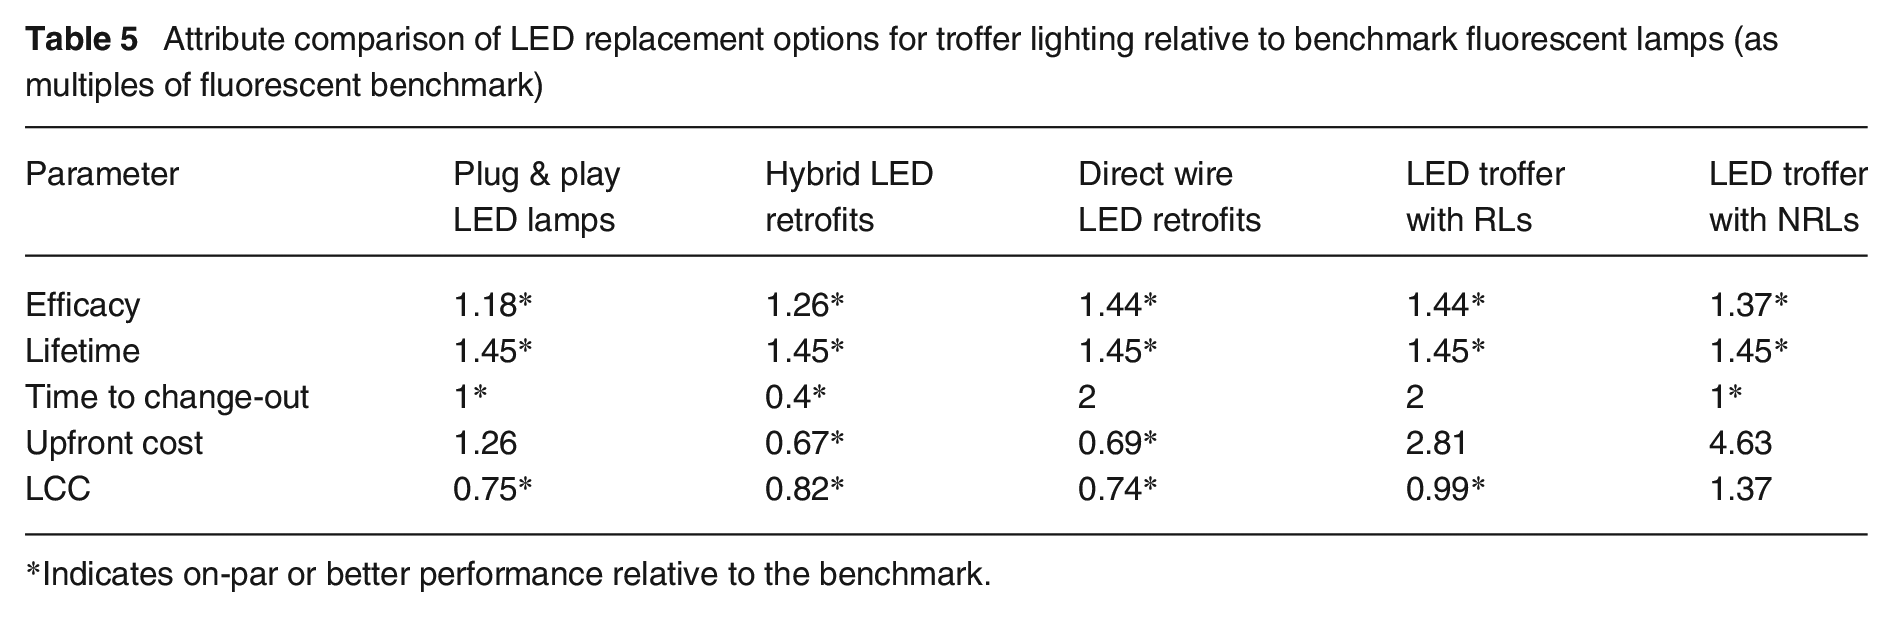
Indicates on-par or better performance relative to the benchmark.
LED lamps and retrofits are competitive options for replacing fluorescent lamps in an existing fixture. Plug & play and hybrid LEDs offer the same convenient change-out as fluorescent lamps, which makes them suitable for applications where access to lighting is limited (e.g. retail spaces and high ceilings) as well as niche markets where the lighting can be relocated with the owner when they vacate the property. Because of this convenience factor, plug & play and hybrid lamps may help spur LED adoption by acting as a gateway to ballast–bypass LEDs, which are meant for long-term use. In cases where an existing ballast is still usable, hybrid LEDs are the lowest upfront cost option; however, the cost of rewiring is only deferred as maintenance, which increases the overall labour cost over the life cycle. Direct wire LED retrofits are the lowest cost replacement for fluorescent lamps in terms of operation and maintenance costs and NLCC, despite their relatively high installation cost. Their high efficacy, low cost and wide market availability suggest that direct wire LEDs have been a focal point of recent LED development and are currently a manufacturer-preferred replacement choice.
5. Conclusion
This study compared the LCC of six different replacement options for a 0.61 m by 1.22 m T8 recessed troffer with fluorescent lamps, based on a survey of 56 fluorescent replacement lamps, 91 LED lamps and retrofits, 2 LED-ready fixtures and 19 LED troffer luminaires from an online lighting vendor. Some of the key findings include:
• Plug & play, direct wire and hybrid LEDs are cost-effective and more energy efficient options to replacing fluorescent lamps.
• Plug & play LEDs suffer from a lock-in with ballasts, but their ease of installation can help spur LED adoption.
• Hybrid LEDs have the lowest upfront cost when an existing ballast is still useable.
• In terms of operation and maintenance costs and NLCC, direct wire LEDs are the lowest cost option despite their relatively high installation cost.
• LED luminaires with RLs are lower cost than those with integrated NRLs though they offer fewer design options.
These findings provide guidance for commercial building owners and managers who are considering lighting replacement. They highlight the trade-offs in lighting performance and cost between the six options considered. The results and findings are also applicable to residential buildings where 0.61 m by 1.22 m T8 lamps and troffers are commonly used particularly in workshops, basements and garages.
Supplemental Material
sj-docx-1-lrt-10.1177_14771535231207810 – Supplemental material for Life cycle cost analysis of LED retrofit and luminaire replacements for four-foot T8 troffers
Supplemental material, sj-docx-1-lrt-10.1177_14771535231207810 for Life cycle cost analysis of LED retrofit and luminaire replacements for four-foot T8 troffers by L Liu, GA Keoleian and GM Lewis in Lighting Research & Technology
Footnotes
Declaration of conflicting interests
The authors declared no potential conflicts of interest with respect to the research, authorship, and/or publication of this article.
Funding
The authors disclosed receipt of the following financial support for the research, authorship, and/or publication of this article: This work was supported by the National Science Foundation Graduate Research Fellows Program [Grant number: DGE 1256260] and the Rackham Merit Fellowship from the University of Michigan.
Supplemental material
Supplemental material for this article is available online.
References
Supplementary Material
Please find the following supplemental material available below.
For Open Access articles published under a Creative Commons License, all supplemental material carries the same license as the article it is associated with.
For non-Open Access articles published, all supplemental material carries a non-exclusive license, and permission requests for re-use of supplemental material or any part of supplemental material shall be sent directly to the copyright owner as specified in the copyright notice associated with the article.