
Abstract
Four groups of accelerated degradation tests of light-emitting diode (LED) lights under constant current stresses were carried out with the goal of precisely and rapidly obtaining the conventional life of LED lights. Three-parameter Weibull function and right approximation method were used to fit the test data of the luminance degradation with time of samples under different stresses, and the pseudo-failure time of each sample was calculated according to the failure criteria. Then combined with lognormal distribution and least square method, the life distribution of LED lights under each stress was determined, and the life of LED lights under conventional stress was extrapolated by inverse power law. The results show that the obtained luminance degradation data can reflect the decay trend of LED lights preferably and obey the three-parameter Weibull function, the lognormal distribution has a good fitting effect on the failure time distribution of LED lights, and the conventional life predicted by the model combined with Weibull function and lognormal distribution has a high accuracy. Manufacturers and researchers of LED lights can benefit from theoretical foundation and technical reference offered by the life tests of LED lights and the established life prediction model.
1. Introduction
At present, due to the intensification of energy crisis, energy conservation and environmental protection are becoming the most concerned global issues. Traditional light sources (such as incandescent bulbs and fluorescent tubes) have the disadvantages of low photoelectric conversion efficiency and the use of toxic mercury. 1 The energy release process from chemical energy to internal energy is applied in the oil light, and there is a large amount of energy loss in this process. Incandescent and fluorescent lights emit photons by converting electrical energy into internal energy, and the energy conversion efficiencies of these two are only 5% and 20%, respectively. Of all the lighting sources used, light-emitting diode (LED) has the lowest energy consumption per lumen,2,3 and LED-based light is expected to reduce lighting power consumption by up to 50% or more. 4 Besides lower energy consumption, LED has many advantages, including higher light output, smaller size, longer life, fewer environmental hazards and better colour controllability.5–7 Therefore, in addition to lighting applications, LED is widely used in various fields, such as display, 8 communication, 9 sensing 10 and biotechnology. 11
However, due to the long life, high reliability and different failure mechanisms from traditional light sources, there are still a lack of unified degradation monitoring methods, collection of reliability assessment information and accurate remaining useful life estimation methods.12–14 Therefore, a lot of research on LED life prediction and estimation, such as failure mode mechanism and effect analysis (FMMEA), 15 fault tree analysis (FTA), 16 life testing and accelerated life testing (ALT), 17 has been carried out. Nevertheless, FMMEA, FTA and life testing are often time-consuming and labour-intensive. Even ALT is difficult to obtain failure data in a short time in testing highly reliable products. 5
Accelerated degradation test (ADT) has been widely adopted because it can provide failure-related data for product reliability prediction without waiting for failure to occur. 18 ADT is to obtain degradation information by applying stresses beyond normal levels to products to accelerate their degradation. 19 ADT can shorten test time, reduce required samples and provide sufficient degradation data to ensure the accuracy of product reliability assessment. 20 On the basis of ADT, constant-stress accelerated degradation test, 21 step-stress accelerated degradation test 22 and progressive-stress accelerated degradation test 23 are proposed and applied in LED life prediction. Since the final failure time is usually not obtained in ADT, selecting a suitable degradation model to describe the degradation curve and calculate the pseudo-failure time is the key to improve the reliability evaluation accuracy. 24 The degradation curve of the product can be described by a linear or nonlinear function with time as the independent variable, whose parameters are stress-related. 25 Meeker et al. 18 described the degradation model corresponding to the physical failure mechanism and explained the relationship between the degradation model and the failure time model, which is a key research work to predict the failure time distribution by using the degradation data and model. Wang and Chu 26 applied exponential function to describe the LED luminance degradation process and used inverse power law to extrapolate the accelerated life to obtain the life under conventional stress.
In summary, the studies on fitting luminance degradation test data of LED lights under constant accelerated stresses by three-parameter Weibull function and applying probability distribution to describe the difference of samples under the same stress have not been carried out. Therefore, in this work, four sets of constant ADTs on LED lights were conducted, luminance degradation data and the pseudo-failure time of each sample by three-parameter Weibull right approximation method (TPWRAM) were obtained and finally the life estimation of LED lights combined with probabilistic statistical life prediction model were completed, so as to achieve the life prediction of LED lights.
2. Theoretical model
2.1 Three-parameter Weibull luminance degradation model
The three-parameter Weibull luminance degradation function is shown in Equation (1). 27
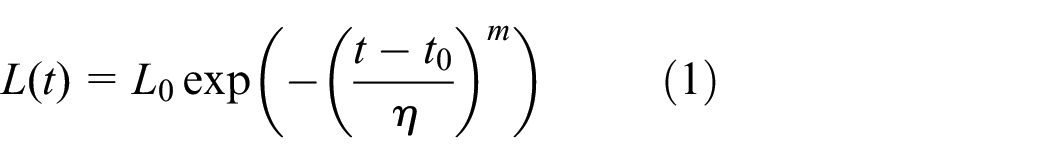
where
2.2 Lognormal distribution
The distribution function of lognormal distribution can be written as Equation (2).
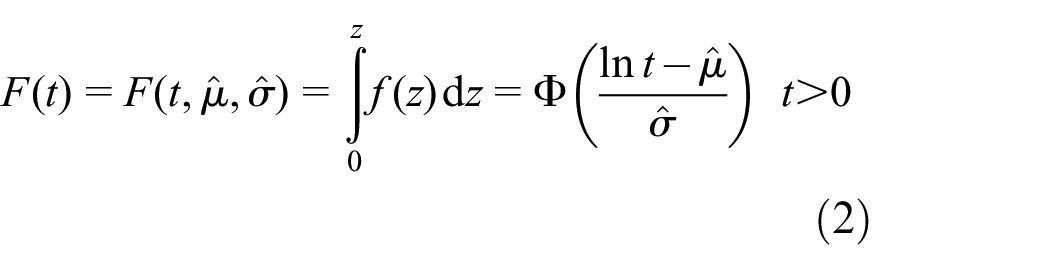
where
2.3 Parameter estimation of lognormal distribution
In order to solve the
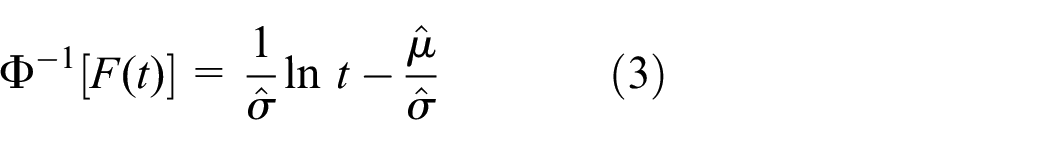
As shown in Equations (4) and (5), let

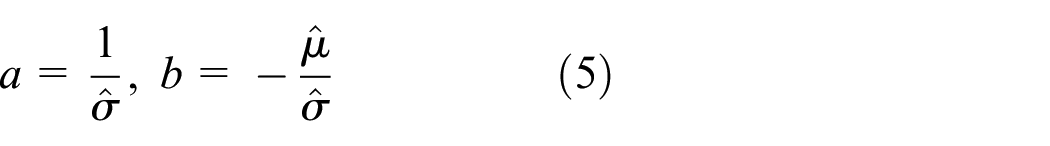
The following linear relation is obtained as Equation (6).

The failure time of LED lights
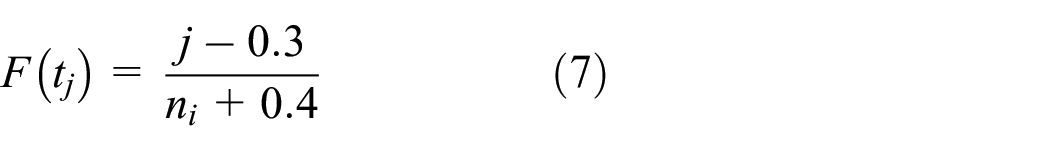
Combining with Equation (7), Equation (8) can get the following data points
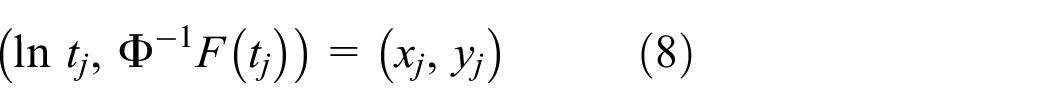
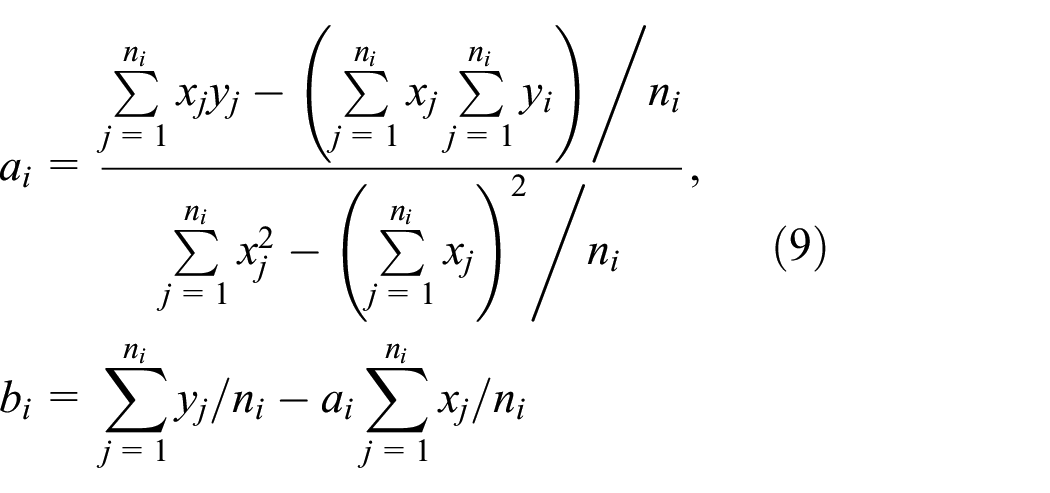
The linear regression based on the LSM is applied to lognormal distribution linear model, and the coefficients of the regression line are expressed as Equation (9).
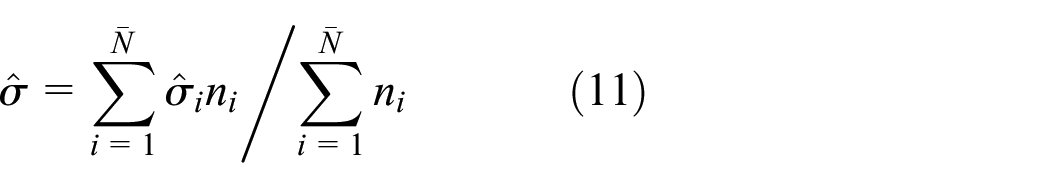
The logarithmic standard deviation

2.4 Conventional life derivation
To improve the accuracy of life prediction, it is usually necessary to select the appropriate stress range when designing the ADTs for fear that the failure mechanism changes. In the lognormal distribution, the logarithmic standard deviation
For the current stress ADTs, the accelerated life equation generally conforms to the inverse power law, and the mean value

where
When the product life follows lognormal distribution, the average life and the median life are respectively calculated as Equation (13).
The logarithmic standard deviation
2.5 Evaluation index
To verify the accuracy of TPWRAM fitting LED luminance degradation data, the mean absolute percentage error (MAPE) is selected as an evaluation index. The corresponding formula is as given in Equation (14).
where
2.6 Kolmogorov–Smirnov test
The Kolmogorov–Smirnov (K–S) test is to demonstrate whether the empirical distribution based on the experiment conforms to the theoretical probability distribution of the hypothesis. It takes the maximum vertical distance between the empirical distribution function and the theoretical distribution function as the statistical index of the similarity of these two distribution functions. The calculation formula is represented as Equation (15).
where
According to the selected sample size n and the significance level α, the critical value can be searched in the K–S test critical value table. If
3. LED light ADTs
Forty-eight test samples are randomly selected from different batches of products from the same type of LED and are evenly divided into four groups which are applied different stresses. In order to ensure that the failure mechanism of LED lights under accelerated stress is the same as that under conventional stress, the test samples of the same type are selected to carry out preliminary tests and the maximum accelerated stress
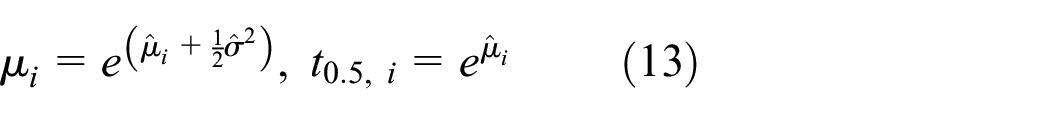
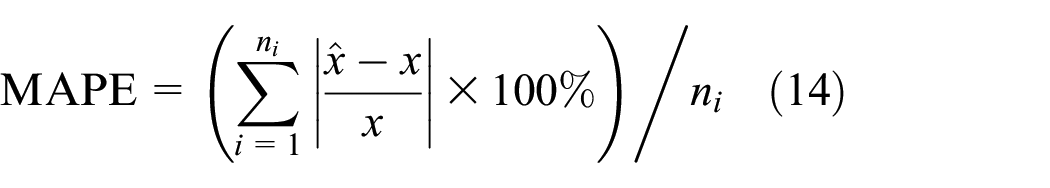
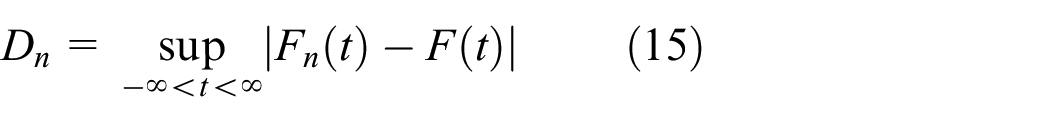
Figure 1(a) to (d) respectively show the luminance degradation test data of the samples under various accelerated stresses. It is prone to find that the luminance variation of each sample under each accelerated stress with time shows a nonlinear decreasing trend, indicating that the failure mechanism of all samples is basically the same. With the increase of stress, the luminance degradation rate of LED lights rises.
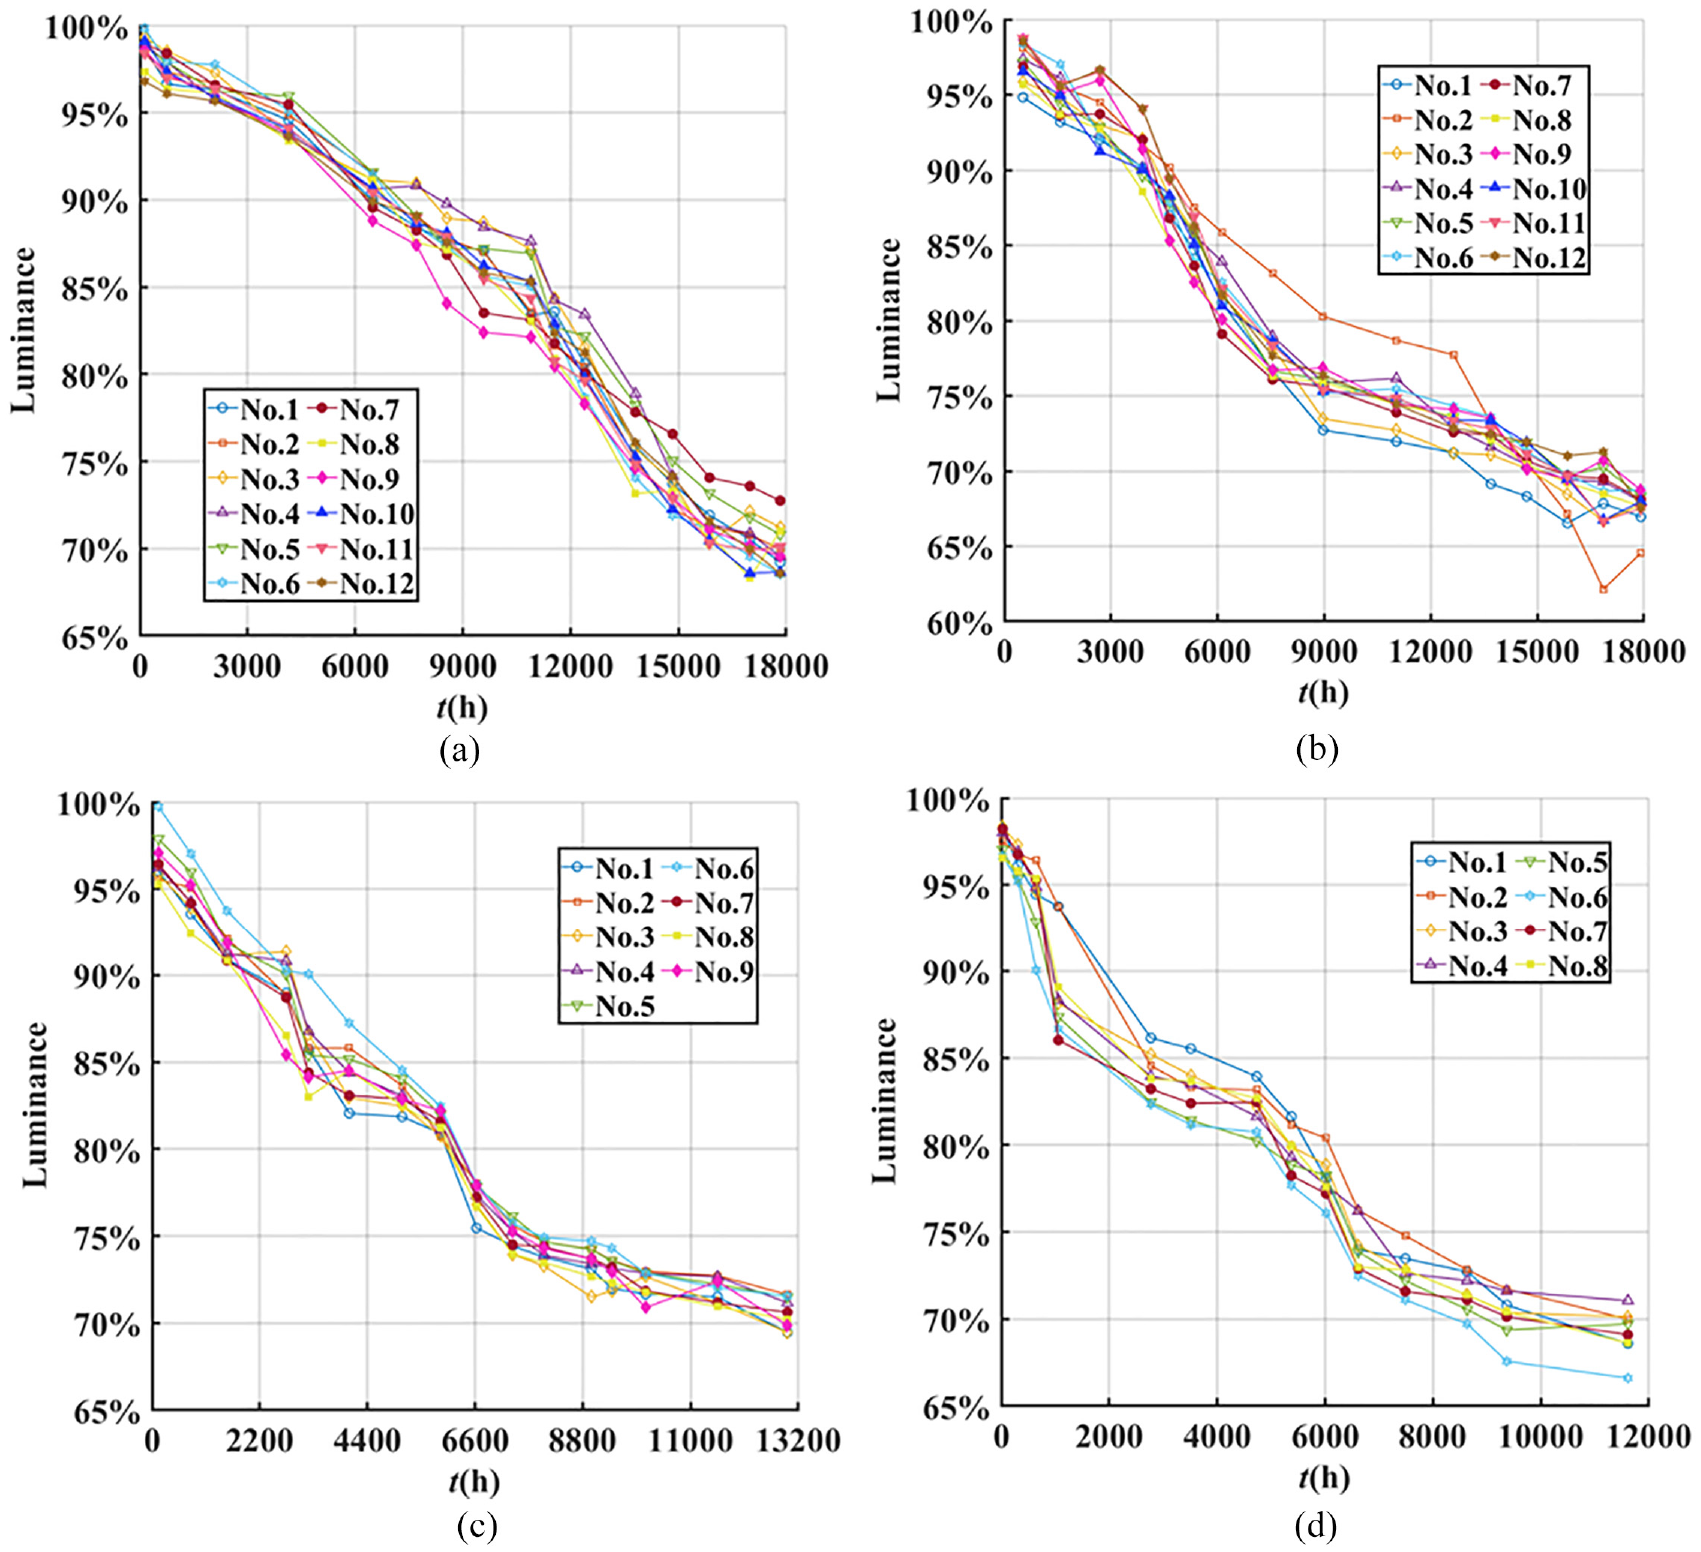
Luminance degradation test data under each accelerated stress: (a) I1, (b) I2, (c) I3 and (d) I4
4. Life prediction and result analysis
4.1 Data processing
Figure 2 is the flow chart of calculation of pseudo-failure time for LED lights. The luminance degradation function of each sample is obtained by TPWRAM, and the pseudo-failure time of each sample can be solved by combining with the failure criteria that the luminance degrades to 50% of the initial luminance. The pseudo-failure time of each sample under various accelerated stresses is listed in Table 1.
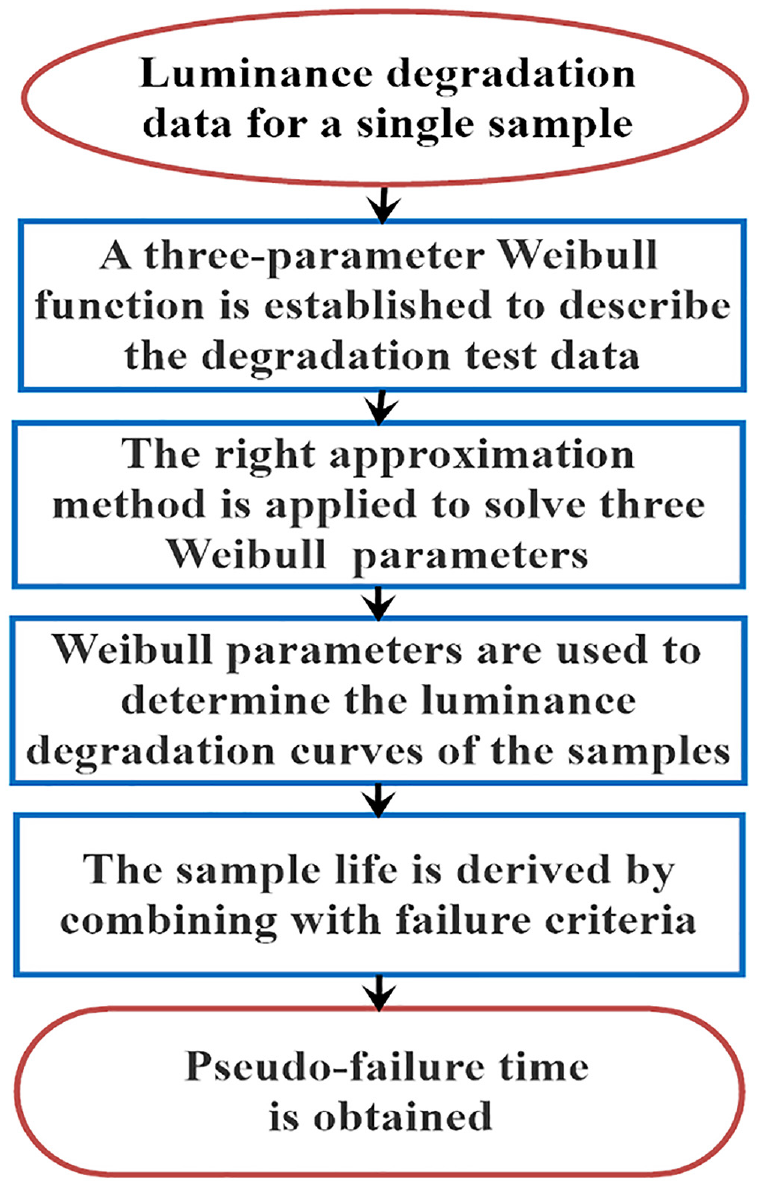
Calculation flow chart of pseudo-failure time for LED lights
Pseudo-failure time of LED lights based on TPWRAM
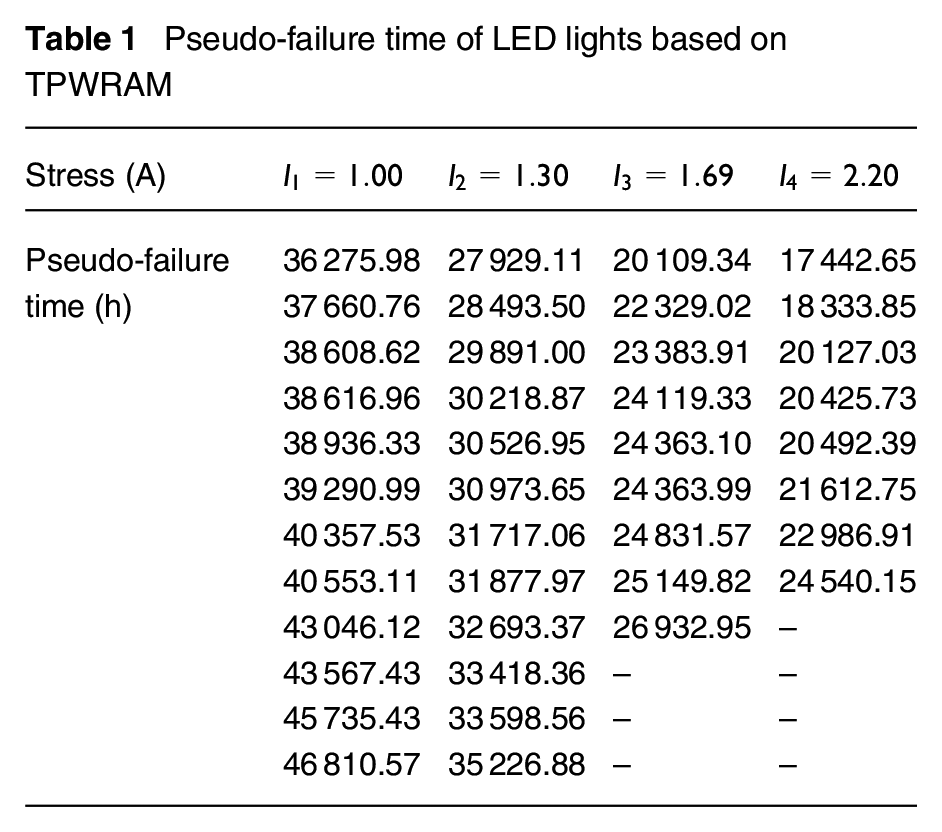
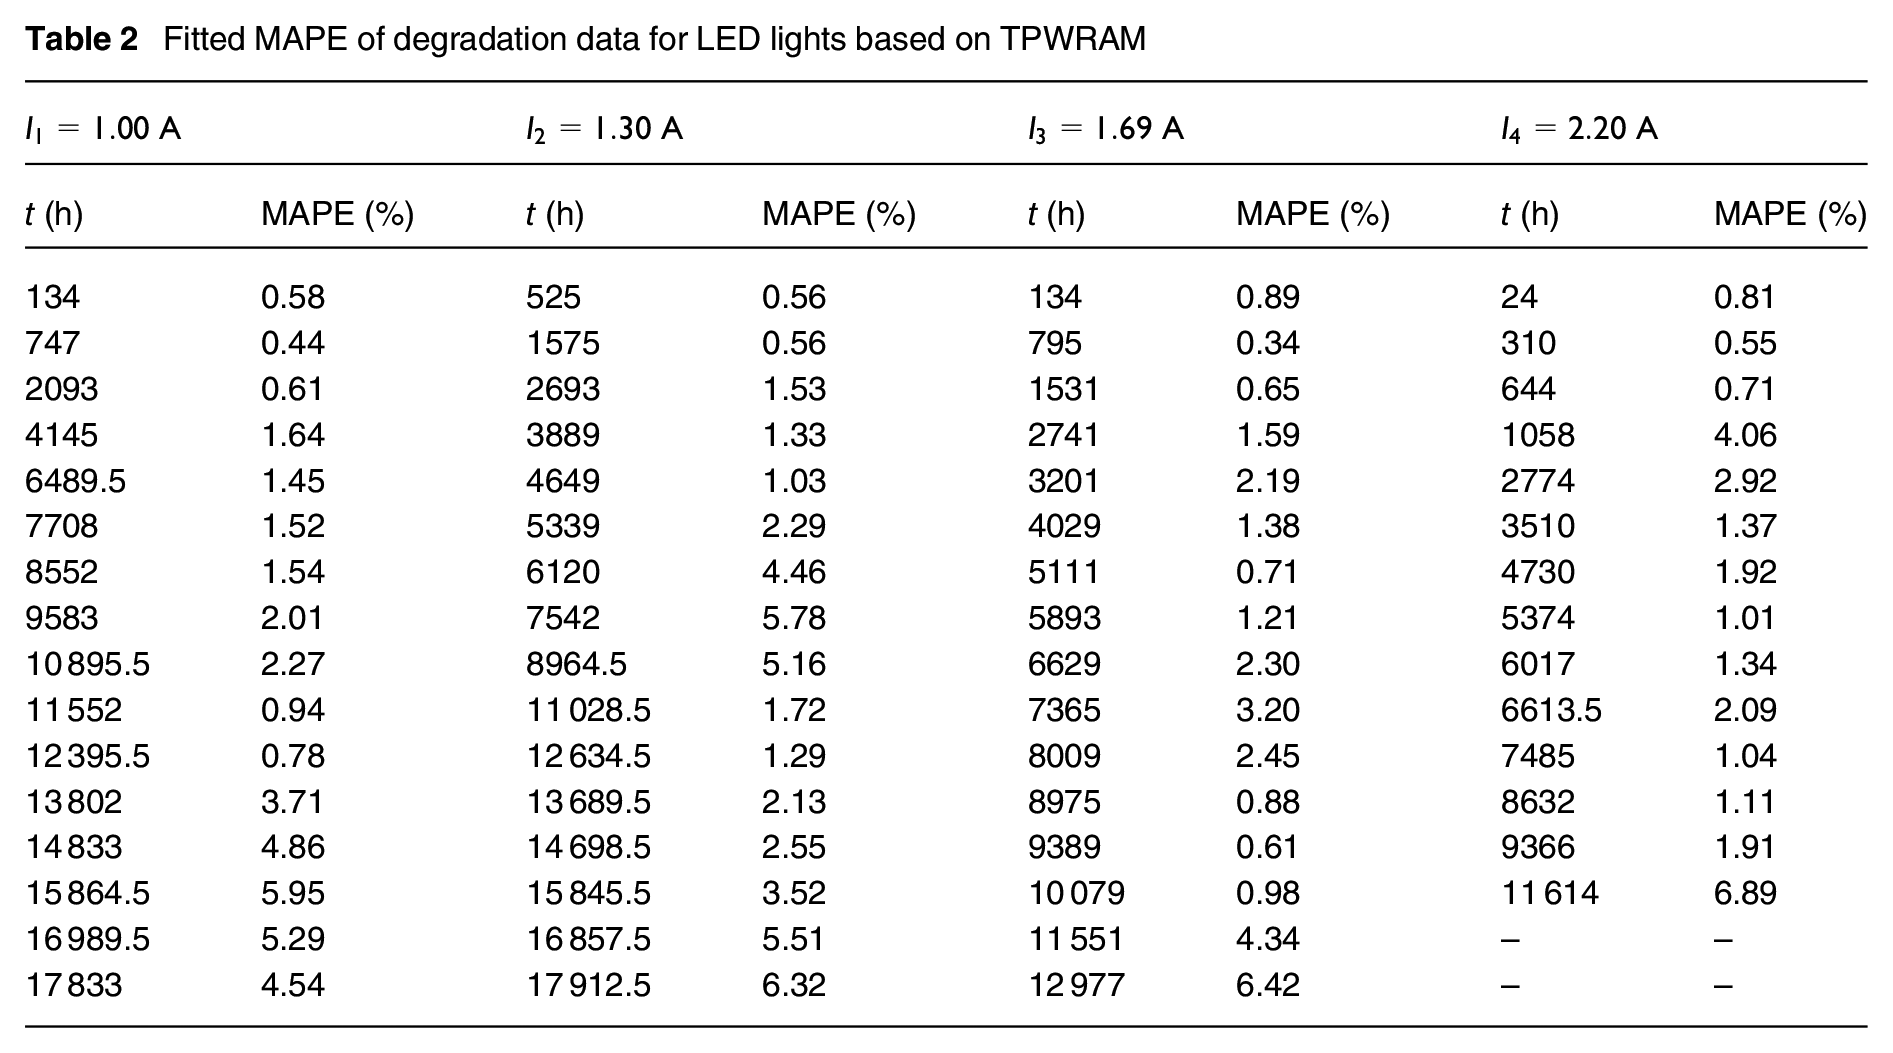
Table 2 lists the MAPE fitted by the three-parameter Weibull function for all samples at time
Fitted MAPE of degradation data for LED lights based on TPWRAM
4.2 Life prediction
4.2.1 Determination of logarithmic mean and logarithmic standard deviation
In this work, the lognormal distribution function is employed to describe the pseudo-failure time of LED lights, and the data points in Table 1 are fitted by LSM, thereby obtain the corresponding statistical curves, as shown in Figure 3.
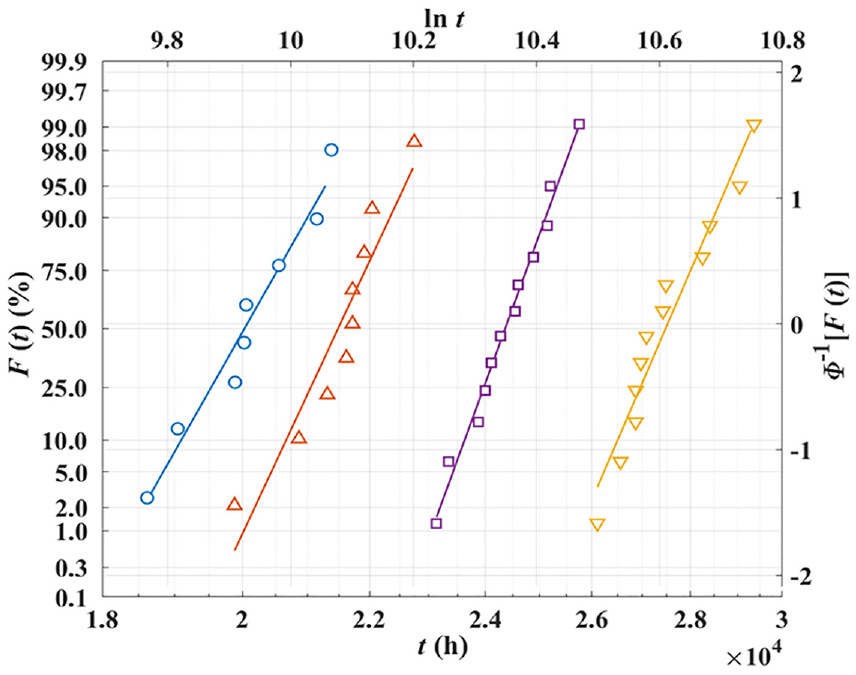
Statistical curves of pseudo-failure time under each constant stress (▽, □, △ and ⚪ are the data points at I1, I2, I3 and I4, respectively; — represents fitted lines)
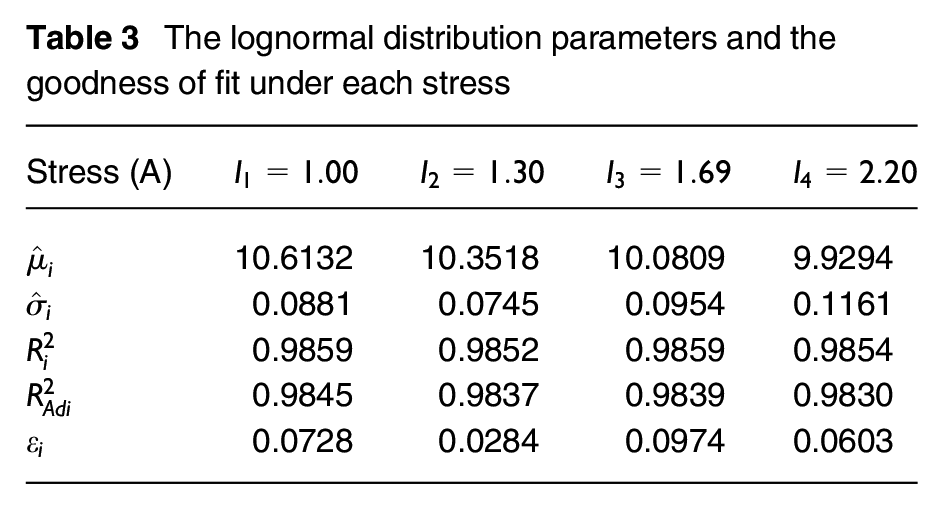
As can be seen from Figure 3, in the dual coordinate system, the data points are very close to the fitted curves, and the relationship between
The lognormal distribution parameters and the goodness of fit under each stress
4.2.2 Determination of accelerated life equation
The data points

Figure 4 gives the accelerated life curve, that is, the diagram of LED lights life characteristic. The fitted determination coefficient is 0.9856, which approaches 1, showing that the accelerated model of LED lights complies with the inverse power law.
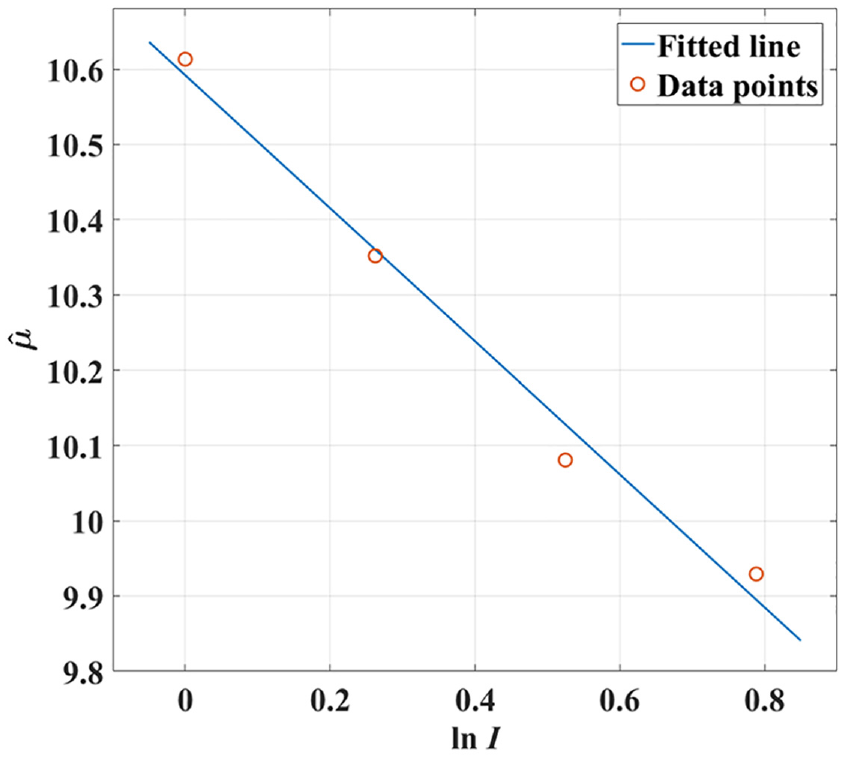
Life characteristic map based on LSM and lognormal distribution
4.2.3 Test of distribution fitting
According to K–S theory and self-designed K–S test program, the pseudo-failure time distribution under each accelerated current stress is verified. The test sample size of LED lights is small, so a larger significance level is selected as
4.2.4 Life estimation under conventional working condition
By substituting the conventional working stress
5. Conclusions
In this study, the luminance degradation tests of LED lights under four groups of accelerated current stresses are carried out. The prediction model combined with Weibull function and lognormal distribution is used to estimate the life of LED lights. The main conclusions are as follows.
Four groups of ADTs for LED lights are conducted, and the luminance of each sample under each accelerated stress shows a similar change trend with time, indicating that the failure mechanisms of all samples are basically the same. Additionally, the high reliability of test data is demonstrated by the positive correlation between luminance degradation rate and accelerated stress.
Three Weibull parameters are identified by fitting the luminance degradation data of each test sample via TPWRAM, and the fitted MAPEs are all small, indicating that the accuracy of parameter estimation is high.
Lognormal distribution and LSM are used to determine the pseudo-failure time distribution under different accelerated stresses, and all the results pass the K–S test, implying that the life distribution of LED lights is in line with lognormal distribution.
By extrapolating the accelerated life of LED lights with the aid of inverse power function, the average life under conventional stress is calculated, and the fitted determination coefficient is close to 1, showing that the extrapolated conventional life has a high precision, which can serve as theoretical basis and technical reference for the reliability analysis of LED lights.
Footnotes
Correction (January 2025):
This article has been updated to include the revised corresponding address and a note regarding the current affiliation of author J. Zhang since its original publication.
Declaration of conflicting interests
The authors declared no potential conflicts of interest with respect to the research, authorship, and/or publication of this article.
Funding
The authors disclosed receipt of the following financial support for the research, authorship, and/or publication of this article: This work is sponsored by the Program of Foundation of Science and Technology Commission of Shanghai Municipality (22dz1206005, 22dz1204202), National Natural Science Foundation of China (12172228, 11572187), Natural Science Foundation of Shanghai (22ZR1444400) and Shanghai Professional Technical Service Platform for Intelligent Operation and Maintenance of Renewable Energy (22DZ2291800).