
Abstract
In this work, it is investigated how reading comfort is influenced by monitor and ambient luminance levels, when employing high-luminance monitors. High-luminance monitors can be used to get more light on the eye and elicit non-image-forming effects. However, this might lead to reduced reading comfort. Two psychophysical methods, a continuous rating scale and paired comparison, were employed to investigate reading comfort in relation to the luminance of the monitor and the ambient environment. The results of 18 observers for the continuous rating scale experiment (aged 20 y to 30 y) and 20 observers for the paired comparison experiment (aged 20 y to 37 y) indicate that reading comfort is significantly influenced by both monitor and ambient luminance levels The paired comparison methodology provided more distinctive capabilities and thus offered a deeper insight. In contrast to prior work suggesting a linear relation between monitor luminance and preferred ambient luminance, the current results indicate that the reading comfort level reaches a tipping or saturation point. A monitor luminance level of 260 cd m−2 combined with an ambient luminance level of 68 cd m−2 provided the highest reading comfort. This reading comfort could not be matched when employing a higher monitor luminance level of 700 cd m−2.
1. Introduction
The importance of adequate light at eye level, especially in the morning, has become more prominent over the past two decades. Lighting should support our tasks visually and elicit the non-image-forming effects, defined as the effects beyond vision caused by activating the intrinsically photosensitive retinal ganglion cells.1,2 The light sensitivity of these photoreceptors was discovered in the early 2000s,3,4 and although much is still unknown, it is clear they have an important effect on alertness, emotion and sleep.1,2 To elicit these effects beyond vision, sufficient light has to reach the eye. The amount of light is still debated, but a recent publication recommends a melanopic equivalent daylight (D65) illuminance (melanopic EDI) of at least 250 lx at eye level during the day for healthy individuals. 5 In addition to exposure to sufficient daylight (before or after working hours and during breaks), artificial light can contribute to this necessary dose. 6 Since most people spend about 90% of their time indoors, 7 it is imperative to establish an indoor environment that provides the necessary 250 lx of melanopic EDI. However, achieving this goal requires a different lighting design that focuses on directing the light towards the eye while avoiding glare. To achieve this, implementing wallwashers and indirect illumination are potential interventions.
During regular office hours, employees typically experience lower illuminance levels in the office than elsewhere. 8 It is therefore necessary to increase the amount of light at eye level, as this can lead to an immediate and persistent effect on (subjective) alertness and vitality. 9 Nowadays, most office work is conducted using computers with one or more monitors. These monitors generally emit a slightly blue-tinted spectrum with a correlated colour temperature (CCT) of approximately 6500 K. Moreover, newly released monitors typically have a higher luminance level than older versions. As shown by Hu and Davis, 10 light from computer displays can meaningfully stimulate occupants’ circadian systems. Applying high-luminance monitors in the workplace may thus help achieve the necessary melanopic EDI, without the need for extensive lighting design. In addition, monitors are typically used individually and can therefore provide the opportunity to influence the worker’s personal lighting condition to improve the effects beyond vision. As van Duijnhoven et al. 6 mentioned, the evolution towards more multi-user open-plan offices increases the office worker’s flexibility to choose the best workplace. The characteristics of a best possible workplace (view, privacy, distance from the window) can be complemented by the possible use of high-luminance monitors. However, the excessive luminous output of these monitors might lead to long-term issues, such as dryness of the eyes and visual fatigue. 11 Increasing the luminance of the direct task area may induce visual discomfort if the surrounding and background do not adhere to the recommended ratio of 1:3:10, as specified in lighting standards. 12 To avoid any adverse effects, it might be advisable to limit exposure to high monitor luminance levels, for example, only in the morning to help synchronise the circadian rhythm13,14 or for tasks that require a high level of attention.15,16 The presented study does not investigate these effects beyond vision, but assesses the feasibility of utilising high-luminance monitors in an office environment by exploring reading comfort in relation to the luminance level of the monitor and the ambient environment.
This paper defined ‘reading comfort’ as a pleasant state or relaxed feeling 17 while reading text on a monitor. Reading comfort is subjectively defined by the observer 18 and can be affected by both the luminance level of the monitor and the ambient (il)luminance.19–21 Therefore, the relationship between reading comfort and the luminance levels of the monitor and the ambient environment is investigated. The importance of ambient lighting in creating a comfortable environment has recently been emphasised. For example, in the 2021 revision of NBN EN 12464-1:2021, 22 the minimum required wall illuminance for office settings has been doubled from 75 lx to 150 lx.
Many recent studies focus on the reading comfort of hand-held e-devices,23–25 which are typically much smaller than external displays in the working environment. These e-devices can reach high luminance levels. For example, in Liu et al., 25 visual comfort was assessed on mobile displays with a luminance level of up to 500 cd m−2. However, as mentioned by Huang et al. 24 the intended use of tablet devices is quite different from computer device displays, which makes the results of e-devices not directly applicable to the results of computer displays.
In 2006, Madsen and Osterhaus 26 examined the most preferred luminance ratio between a computer screen and a background backlit panel. Observers could change the luminance of the panel from 40 cd m−2 to 2000 cd m−2. Since this is an older study, the screen luminance levels only ranged from 12 cd m−2 to 66 cd m−2, substantially lower than the current luminance levels of computer displays. In addition, the outcomes from considering a luminous panel might differ compared to utilising a non-luminous background, where only reflected light is observable. Despite the differences in technology, the study showed that the observers preferred a screen-panel luminance ratio 1:6, indicating that the background luminance should be higher than the screen luminance. Interestingly, an experiment with a slightly different research design by Sheedy et al. 27 showed that the preferred surrounding luminance is slightly less than the screen luminance. A 17-inch liquid crystal display (LCD) monitor with a white screen setting (91 cd m−2) was used, and observers could choose from nine different ambient luminance levels (1.4 cd m−2 to 600 cd m−2). A study conducted by Shen et al., 20 showed that, irrespective of the task being performed, most individuals prefer a non-dark ambient environment while using a computer screen. Their results demonstrated a linear relationship between the screen luminance and preferred ambient luminance levels. Furthermore, maintaining the luminance ratio between the screen and ambient luminance levels was essential to ensure users’ visual comfort. However, the maximum screen luminance of the 17-inch LCD used in their study was only 60.5 cd m−2.
More recently, Han et al. 28 performed an experiment using a 15.6-inch laptop screen with a luminance of 220 cd m−2. Their study focused on using computer/laptop screens in the evening as a leisure activity and not in a working environment. A desktop lamp was the only light source besides the laptop screen and was set to one of six setups: 375 lx, 675 lx or 1500 lx with warm (3000 K) and intermediate (5000 K) CCT. A completely dark environment was also included. Participants preferred a CCT of 3000 K over 5000 K, and a high illuminance level (1500 lx). The dark environment was the least preferred choice. In the study of Kim et al., 19 the backlight unit of a 16-inch LCD panel was removed and replaced by a new LED array in order to reach a screen luminance of up to 2000 cd m−2. The brightness of the LCD was assessed using a 7-point ordinal scale (from too dark to too bright). The appropriate screen luminance zones were established through these brightness evaluations. If the ambient illumination increased, a higher screen luminance was needed. In addition, the appropriate zones depended on the display’s maximum white luminance. Zhou et al. 21 evaluated visual fatigue and comfort of an LCD with screen luminance levels up to 106.7 cd m−2 and ambient illuminance levels at eye level up to 100 lx in the evening. Optimal results, characterised by high visual comfort and low visual fatigue, were achieved when screen luminance levels increased concurrently with increasing ambient illuminance levels.
Various studies thus examine the visual comfort of displays. However, more focused research is needed, especially regarding the potential of high-luminance monitors in office applications, which are becoming increasingly popular, whether or not to fulfil requirements regarding effects beyond vision. This paper presents two experiments with different psychophysical methods (continuous rating scale and paired comparison) evaluating reading comfort in relation to monitor and ambient luminance levels. The continuous rating scale experiment enables a rapid assessment of a large number of lighting scenes. A wide range of luminance levels can thus be examined within a reasonable experiment duration. However, the results of the continuous rating scale experiment might be influenced by the stimulus range. 29 A paired comparison methodology is a more distinctive procedure to determine a somewhat difficult question, like in this case, reading comfort. Observers are given the freedom to decide for themselves which criteria they deem important to make their decision. 30 Nevertheless, the number of lighting scenes should be restricted in order to ensure that the experiment can be completed within a manageable timeframe. It is hypothesised that a higher monitor luminance would require a higher ambient luminance to maintain adequate reading comfort.
2. Material and methods
2.1 Setup
The experiments were conducted in a windowless room (
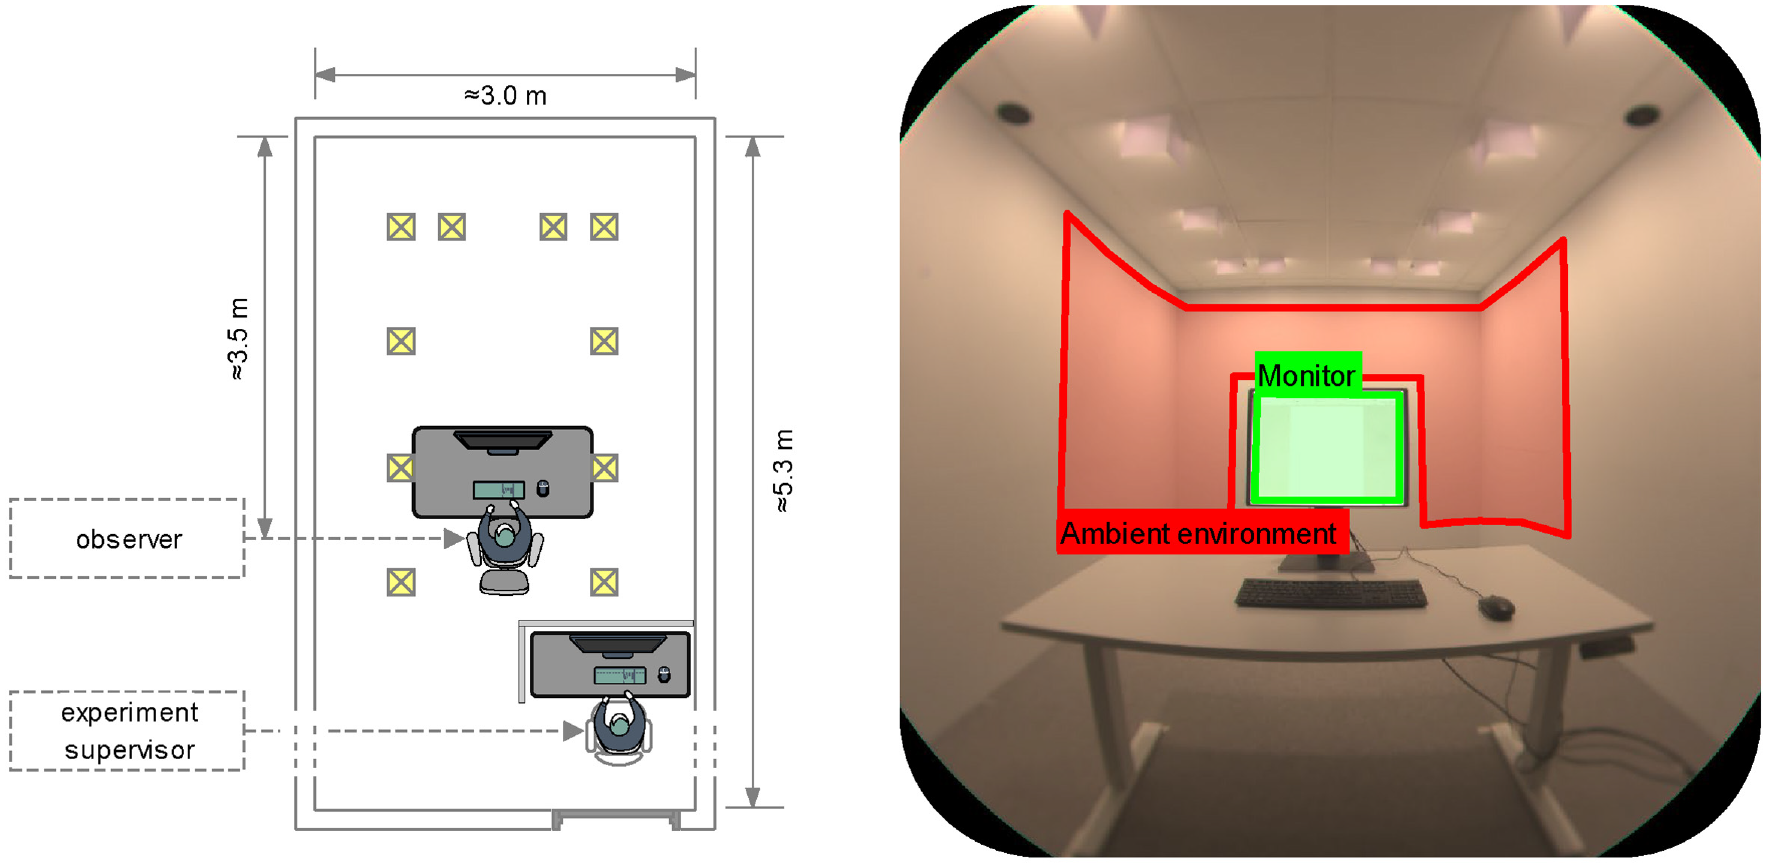
(Left) Schematic representation of the experiment room. (Right) Image at the observer’s eye level, where the red and green areas indicate the regions of interest for the ambient and monitor areas, respectively
Four unique monitor luminance levels (120 cd m−2, 260 cd m−2, 453 cd m−2, 700 cd m−2) and six unique ambient luminance levels (0 cd m−2, 12 cd m−2, 34 cd m−2, 68 cd m−2, 113 cd m−2, 170 cd m−2) were chosen. The monitor luminance levels were equally distributed regarding brightness perception, according to Stevens’ power law 31 for a brightness-luminance relationship 32 with a brightness exponent of 0.5. 33 The monitor luminance level of 700 cd m−2 corresponded to the maximum achievable stable value. Following the same reasoning, the ambient luminance levels were equally distributed in terms of brightness between 12 cd m−2 (the minimal requirement according to EN12464-1, version of 2011) 34 and the maximally stable achievable value of 170 cd m−2. Note that in the revised version of EN12464-1 from 2021, the minimal requirement for the maintained wall illuminance in an office is doubled. 22 All lamps were turned off for the lowest ambient luminance (<1 cd m−2). The CCT of the ambient lighting and the monitor were 4500 K and 6500 K, respectively. Combining all monitor and ambient settings resulted in 24 unique lighting scenes.
These scenes were calibrated in the regions of interest shown in Figure 1 using a colorimetric camera (LMK 6-12 colour, TechnoTeam) with a conoscopic lens and were always within 1.5% relative error or 1 cd m−2 absolute error of the required value. The monitor luminance levels were calibrated while showing an empty Word document. In addition, the spectrum of each scene was measured with a spectral light meter (BTS256-EF WiFi, Gigahertz Optics, Türkenfeld, Germany) at the position of the observer (1.2 m height, 60 cm distant from the monitor). The CCT,
The melanopic EDI at eye level for each scene is shown in Figure 2. Given the recommendations of Brown et al., 5 a dotted horizontal line denotes the 250 melanopic EDI border. Increasing either ambient or monitor luminance levels resulted in a higher influence on the non-image-forming pathway. Seven of the 24 unique scenes reached the recommended melanopic EDI. For the two lowest monitor settings (120 cd m−2 and 260 cd m−2), an ambient luminance of 170 cd m−2 was needed to cross the 250 melanopic EDI border, whereas a melanopic EDI of 274 lx was already obtained at an ambient luminance of 68 cd m−2 when using a monitor luminance of 700 cd m−2.
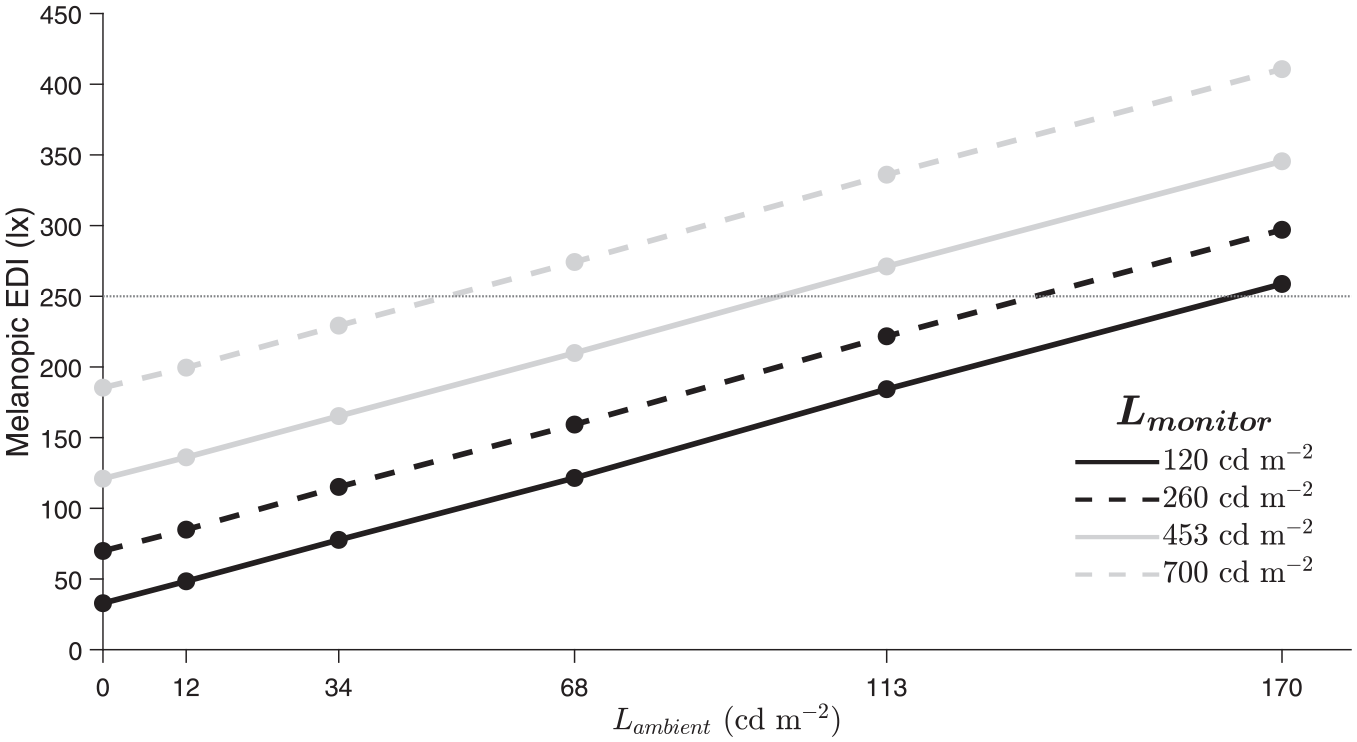
Melanopic EDI (vertical axis) of the 24 unique scenes shown in function of ambient luminance level (horizontal axis) for each monitor luminance level. A separate line is plotted for each monitor luminance level: black solid line denotes 120 cd m−2, black dashed line denotes 260 cd m−2, grey solid line denotes 453 cd m−2 and grey dashed line denotes 700 cd m−2 monitor luminance level. The horizontal dotted line indicates the 250 melanopic EDI border
In both experiments (continuous rating scale and paired comparison), the same black text on a white background in a Microsoft Word © document template was shown, see Figure 3. The text was an excerpt of an unknown child story (from the Dutch website https://www.verhaaltjesvoorlezen.nl) translated into Czech using the online DeepL translator (DeepL SE, Cologne, Germany). The Czech language was chosen because the characters are still readable for Dutch-speaking people but cannot be understood. This way, the participants were not able to attach emotion to the story and made their decision solely based on the lighting scene.
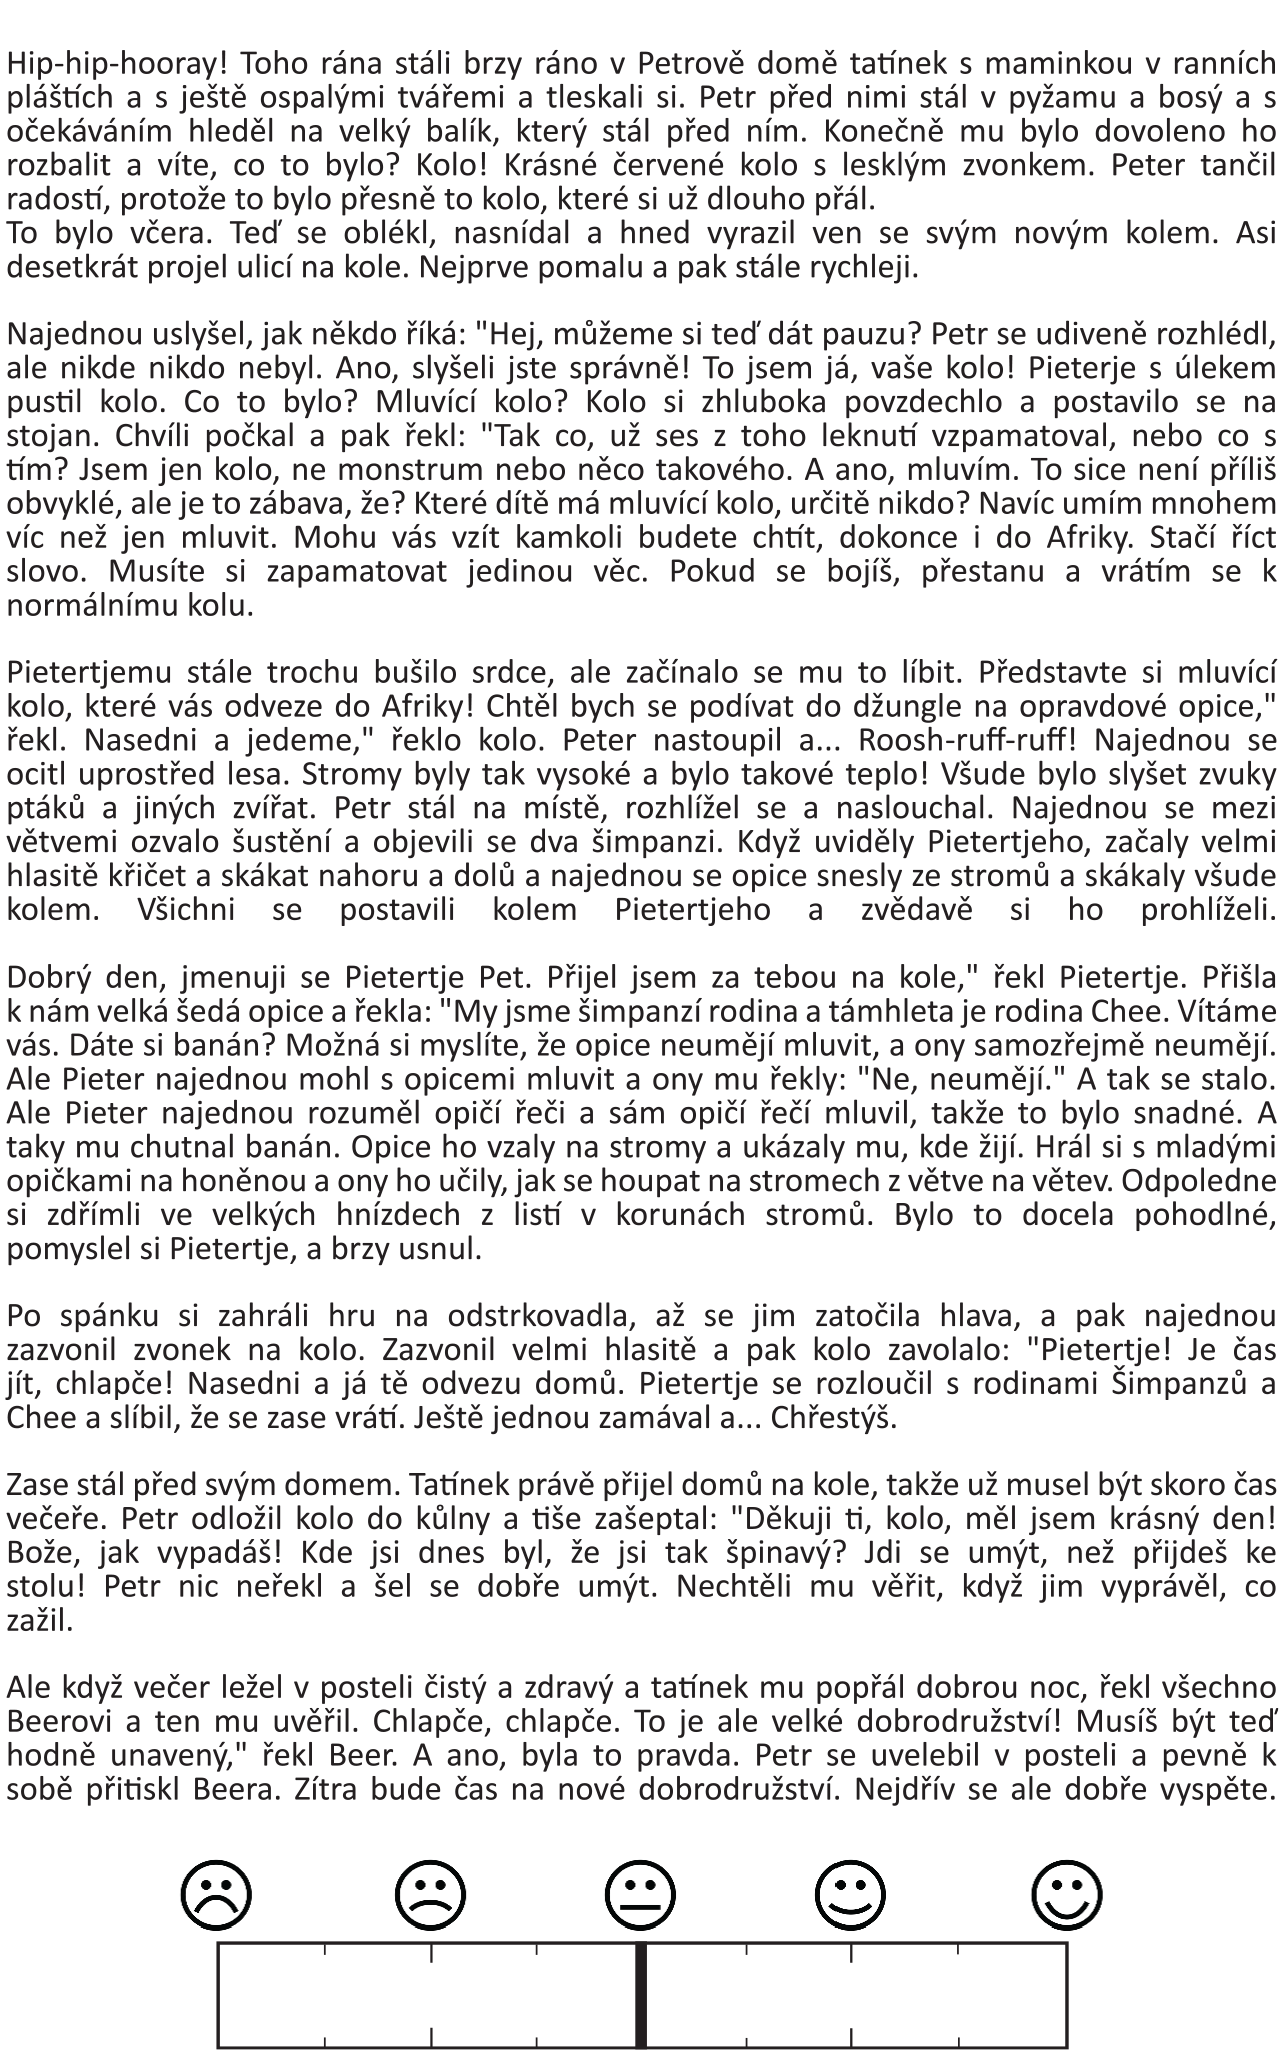
Observers were shown this Czech text in a Word document during both experiments. Note: the slider with emoticons was not present during the paired comparison experiment
Observers’ visual acuity was assessed using a modified Snellen test, conducted in the experiment room. If participants typically used glasses or lenses for monitor reading, they were required to wear them for the Snellen test and the entirety of the experiment. Data from observers with acuity scores of 20/40 or lower were excluded from subsequent analysis. During the experiment, participants were seated at a desk and instructed to adjust the chair to achieve an eye level of 1.2 m. Observers were directed to maintain a direct gaze at the monitor and ensure a consistent distance equivalent to an arm’s length. After answering general questions about age, gender, wearing glasses and state of fatigue, one of the two experiments described below was started.
2.2 Experiment 1: Continuous rating scale
2.2.1 Design
A repeated measures, continuous rating scale experiment was designed where observers evaluated the reading comfort of a scene on a continuous rating scale. Observers were asked to answer the following question: ‘How comfortable is this lighting scene to read the text on the monitor?’ As an aid, checkmarks and emoticons were added to the slider, see Figure 3. However, participants were free to completely ignore these tools and place the scale bar anywhere on the slider. If the scale bar was placed to the left, the scene was rated as not comfortable to read the text on the monitor; if the scale bar was placed to the right, the whole scene was perfectly comfortable to read the text on the monitor. Participants could operate the scale bar themselves by moving the mouse and confirming their answer by pushing the spacebar. There was thus no influence of the experimenter during the decision-making process.
The experiment was divided into four blocks, each corresponding to a distinct monitor setting (120 cd m−2, 260 cd m−2, 453 cd m−2 or 700 cd m−2). Within each block, the monitor’s luminance remained consistent, a fact not disclosed to the observers in advance. All six unique ambient settings (0 cd m−2, 12 cd m−2, 34 cd m−2, 68 cd m−2, 113 cd m−2, 170 cd m−2) were shown and repeated three times, resulting in a total of 18 judgements to be made per block. The effect of adaptation was tested in two blocks (monitor luminance 120 cd m−2 and 700 cd m−2). In these blocks, the adaptation time of four ambient luminance levels (0 cd m−2, 12 cd m−2, 68 cd m−2, 170 cd m−2) was increased from 10 s to 60 s. In 60 s, around 90% of chromatic adaptation is achieved.37,38 This was repeated twice, leading to 16 additional scenes being judged. As these added scenes effectively doubled the time required to complete the two blocks, a brief intermission was included mid-block, though participants remained in the experiment room. The order of blocks was fully randomised, as was the order of ambient settings within each block.
The timeline of this experiment is visualised in Figure 4. Each judgement started with a baseline scene consisting of an empty Word template and a minimum ambient luminance (lamps maximally dimmed). The ambient luminance was then set to the desired level, and after an adaptation time of 10 s or 60 s, the Czech text appeared. Observers read this text in silence. They were instructed to approach it as a regular Word document sent by a colleague. The slider with the scale bar was subsequently shown below the text. This was the cue for the observer to evaluate how comfortable the scene was to read the text on the monitor. When their answer was confirmed, the text would disappear, and the sequence would start over again with the next ambient luminance setting. This protocol was explained during a short training period where all ambient settings were shown for a fixed monitor luminance of 350 cd m−2. During this training period, observers were regularly asked if everything was clear and were encouraged to ask questions.
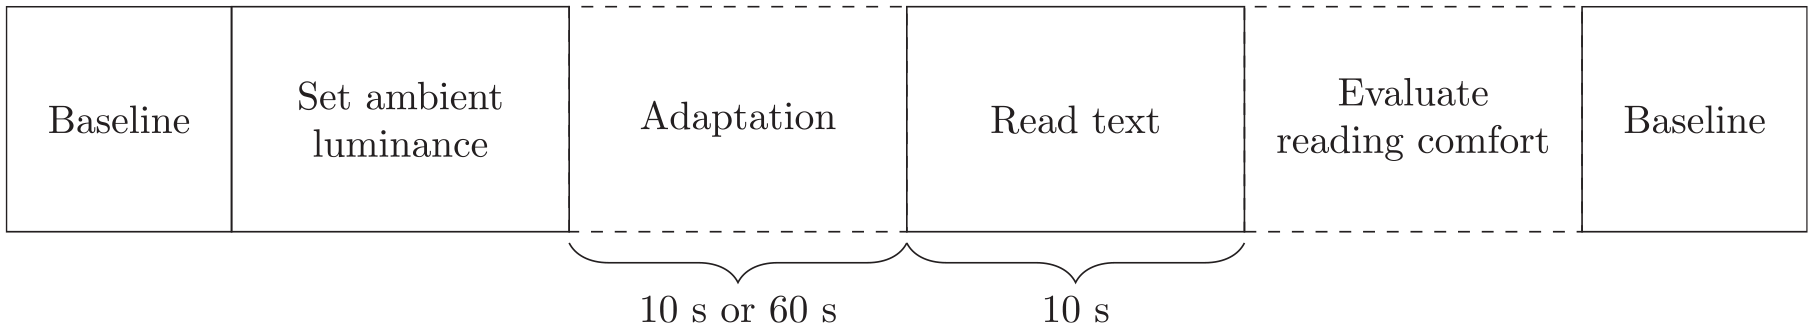
Schematic representation of the procedure of the first experiment (continuous rating scale). This scheme was repeated for each scene
When a block was finished, the observer followed the experimenter to the hallway for a minimum 5-minute break. The above-described protocol was repeated for the four blocks. At the end of the fourth block, the observer had the chance to give feedback and was informed of the change in the monitor luminance after each block. The entire experiment, which included an introduction, training period and four blocks, spanned roughly 90 minutes. The experiment was written in MATLAB (MathWorks, Natick, MA, USA), using the Psychophysics Toolbox extensions.39–41
2.2.2 Observers
Twenty observers (10 male and 10 female) completed the experiment. One male observer scored worse than 20/40 on the Snellen test for his left eye and 20/30 for his right eye. The data of this observer were thus excluded from the analysis. Half the observers had corrected vision (glasses or lenses), but nobody was reported to be colour blind. Participants were between 20 y and 30 y. Observers received a compensation of 15 euros for their participation. All observers were naive in lighting research. The experiment was ethically approved by the university’s Social and Societal Ethics Committee on 25/8/2021 (reference number G-2021-3780).
2.2.3 Statistical analysis
The reading comfort score indicated by the observers on the scale was transformed to a numerical value between 0 and 100. Inter- and intra-rater reliability were calculated using the intraclass correlation coefficient (ICC).42–44 A linear mixed-effects or multilevel linear model 45 was fitted to the data with monitor and ambient luminance levels as fixed effects. Both luminance levels were entered as categorical variables into the model. Interactions between the effects were also added. The model was corrected for differences between observers (random effect). In addition, the influence of age, gender, wearing of eyewear and adaptation time on the reading comfort score was examined. Linear coefficient tests were used to assess differences between certain scenes. All analysis was done using MATLAB R2022b (MathWorks, Natick, MA, USA).
2.3 Experiment 2: Paired comparison
2.3.1 Design
During each block of the continuous rating scale experiment observers evaluated only one monitor luminance level. Therefore, a second experiment was designed employing a paired comparison or two-interval forced-choice (2IFC) psychophysical procedure.
46
A pair of scenes was shown in temporal order, and participants had to choose the scene that provided the best reading comfort. Given that
The procedure of this experiment is visualised in Figure 5. At the start of the experiment, a pair of scenes would be randomly selected from a total of 76 pairs. A text on the monitor instructed the observer to close their eyes while the appropriate monitor and ambient luminance levels for the first scene were prepared. A beep signal indicated to open the eyes, and the Czech text (same as in the first experiment) was shown on the monitor. After 10 s of reading, the ‘close eyes’ text appeared again, and the second scene was prepared. A beep signal indicated again to open the eyes and read the text. The Czech text disappeared after 10 s, and the experimenter asked the observer which scene was the most comfortable to read the text on the monitor (scene 1 or scene 2). The choice was entered by the experimenter, and the next pair was selected. Observers had the opportunity to view the current pair again in the same order, for example, when in doubt. Three 5-minute breaks outside the experiment room were given during the experiment. Observers could also ask for a short break at any moment between pairs. A short training session was conducted before the start of the experiment to ensure everything was clear to the observer. The entire experiment, which included an introduction, training period and the evaluation of 76 pairs, spanned roughly 90 minutes. The experiment was written in MATLAB (MathWorks, Natick, MA, USA), using the Psychophysics Toolbox extensions.39–41
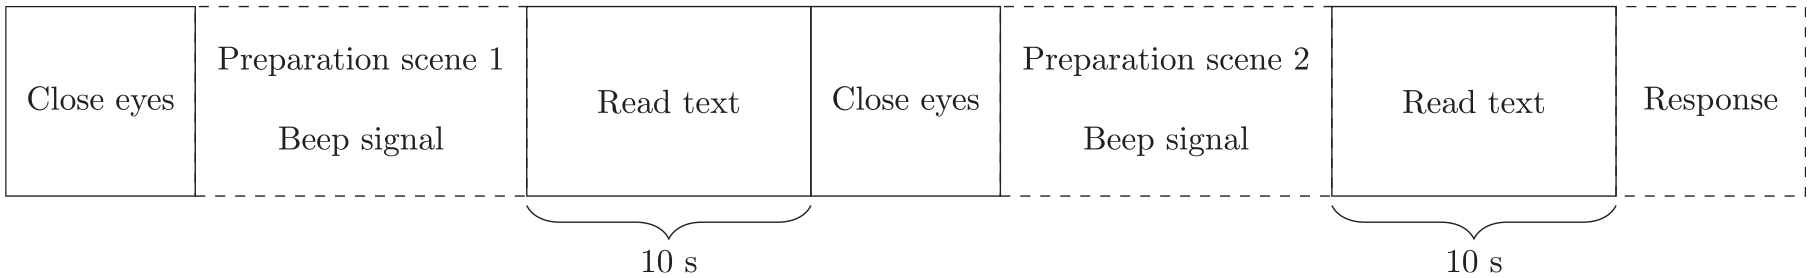
Schematic representation of the paired comparison procedure employed in the second experiment. This scheme was reiterated for each scene pair
2.3.2 Observers
Twenty-four observers (22 male and 2 female), all students recruited at the university, completed the experiment. None of the observers had participated in the first experiment. One male observer with a score below 20/40 in his left eye on the Snellen test was identified, and his data were excluded from the analysis. Fifteen observers had non-corrected vision; one observer was reported to be colour blind. Participants were between 20 y and 37 y. All observers were naive in lighting research. The experiment was ethically approved by the university’s Social and Societal Ethics Committee on 25/8/2021 (reference number G-2021-3780).
2.3.3 Statistical analysis
Observer consistency was determined with the repeated pairs. From the eight repeated pairs, the test–retest reliability could be calculated. In addition, the coefficient of internal reliability (CIR), 47 defined as 1 minus the quotient of the number of circular triads and the maximum possible number of triads, was determined. For 12 pairs, the maximum number of triads is equal to 70. The two null conditions were employed to test for a tendency to the first or second scene (interval bias). 48
A one-dimensional interval-scaled z-score was calculated for each scene by fitting a generalised linear model (GLM) specifying a binomial distribution with a probit link function based on the Thurstone model.49,50 The z-score is a representation of the reading comfort for each scene based on the observer’s paired comparison data. Using the GLM method, z-scores and their standard errors were estimated for each unique scene, allowing z-score differences to be tested via linear coefficient tests. All analyses were performed using MATLAB R2022b (MathWorks, Natick, MA, USA).
3. Results
3.1 Experiment 1: Continuous rating scale
Each observer evaluated a total of 88 scenes, 72 with an adaptation time of 10 s and 16 with an adaptation time of 60 s. As said before, the data of one male observer were removed because of a low Snellen score. Based on low intra-rater reliability (−0.27) and after visual inspection of the data, the data of another male observer were excluded from further analysis. Therefore, the following analysis was performed on the data of 18 observers (8 male and 10 female) with a total of 1584 evaluated scenes.
Inter-rater reliability, calculated as ICC based on a mean-rating, consistency, two-way random effects model, was found to be 0.90 (95% CI: 0.84, 0.95), indicating a good to excellent level of reliability according to Koo and Li. 42 Intra-rater reliability was calculated for each observer as ICC based on a mean-rating, absolute agreement, 2-way mixed-effects model. The results ranged from 0.72 to 0.98, meaning all observers obtained a moderate to excellent level of reliability. 42
The mean reading comfort score as a function of the ambient luminance levels is shown in Figure 6. Visual analysis indicates that a dark ambient environment resulted in the lowest reading comfort score (around 30 to 35 on a scale of 100). In addition, reading comfort appears to increase with increasing ambient luminance levels. However, at higher ambient luminance levels (above 34 cd m−2), reading comfort stabilises around a score of 60 to 65.
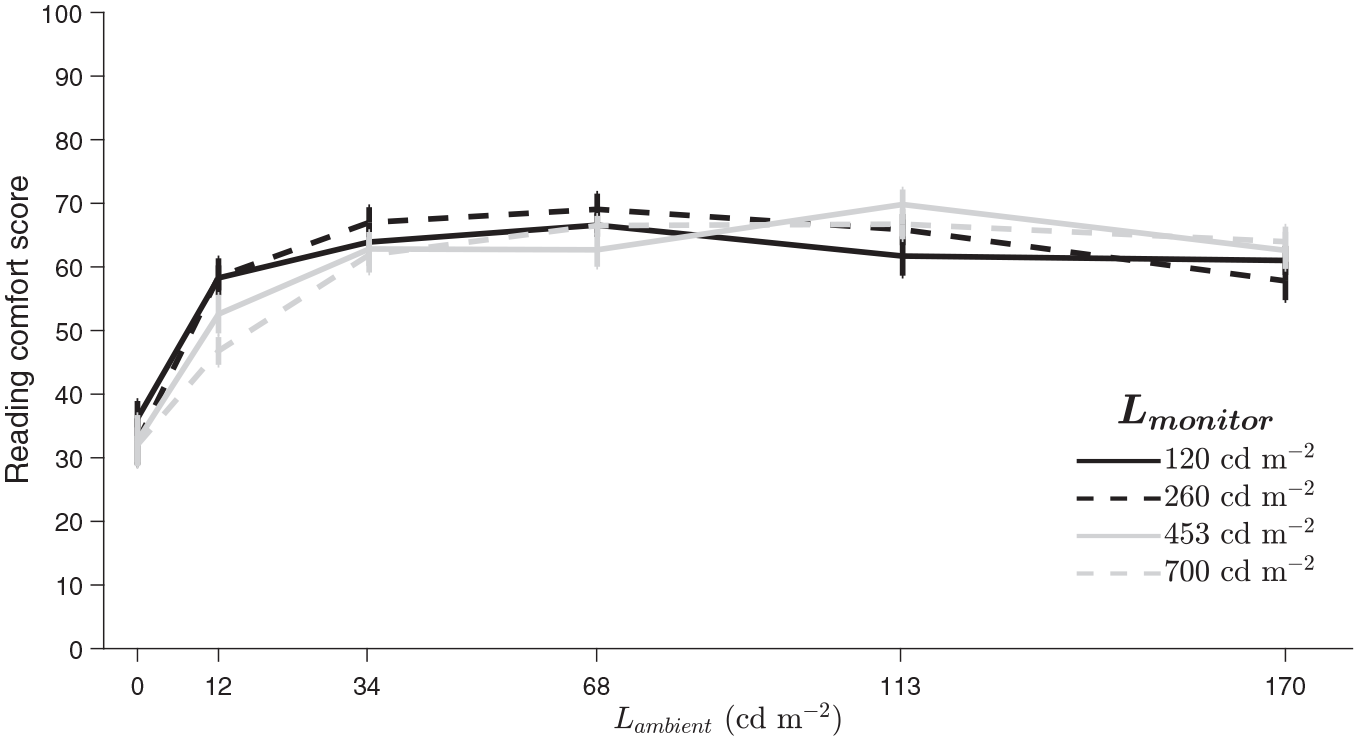
Reading comfort score (vertical axis) as a function of the ambient luminance level (horizontal axis) for each of the four unique monitor luminance levels. A separate line is plotted for each monitor luminance level: black solid line denotes 120 cd m−2, black dashed line denotes 260 cd m−2, grey solid line denotes 453 cd m−2 and grey dashed line denotes 700 cd m−2 monitor luminance level. Error bars indicate the standard error of the mean
The linear mixed-effects model incorporated the fixed effects of both monitor and ambient luminance levels as well as the random effect of the observers. Adding random intercepts to the baseline model, which only includes the intercept, resulted in a significant improvement,
In Figure 7, the distinction between an adaptation time of 10 s and 60 s is depicted for the eight corresponding scenes (ambient luminance levels of 0 cd m−2, 12 cd m−2, 68 cd m−2 and 170 cd m−2 for monitor luminance levels of 120 cd m−2 and 700 cd m−2). Adding the adaptation time did not improve the final linear mixed-effects model,
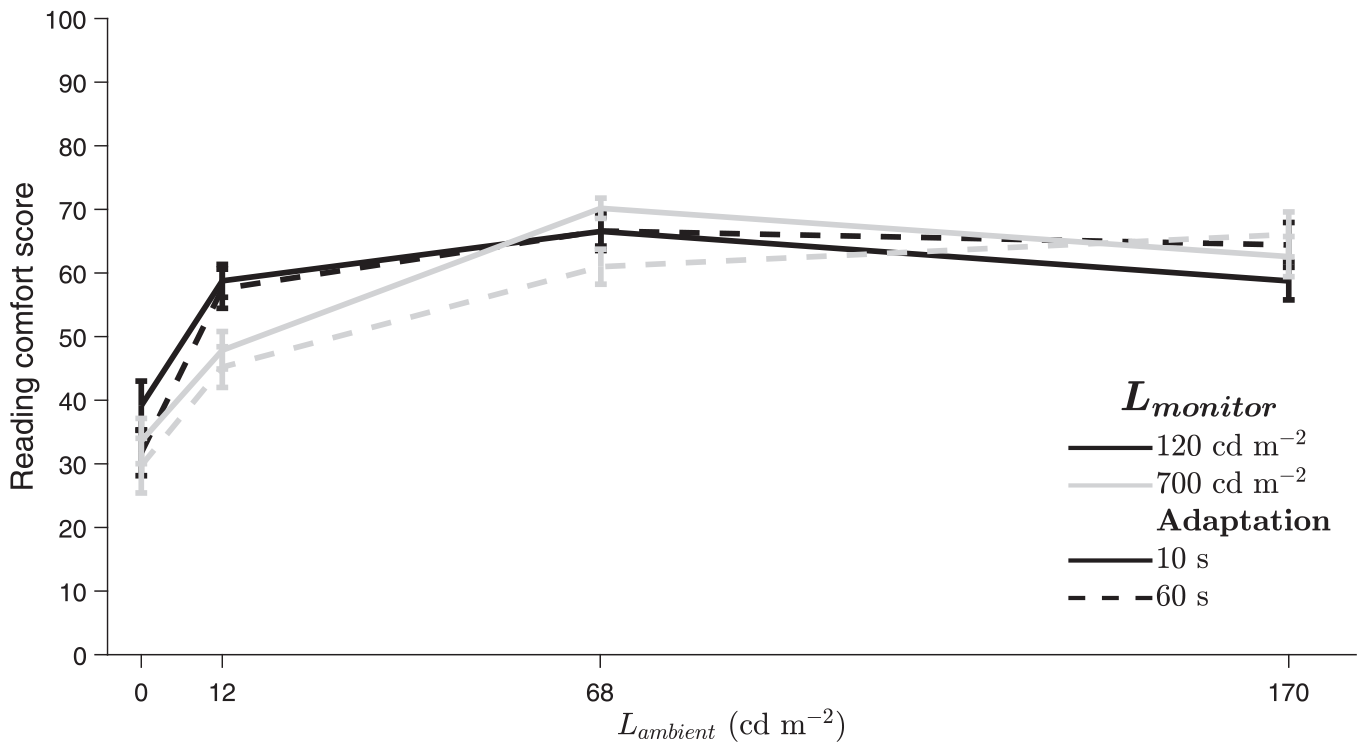
Reading comfort score (vertical axis) as a function of the ambient luminance levels (horizontal axis) for the two monitor luminance levels with altered adaptation times. A separate line is plotted for each monitor luminance level and adaptation time: black lines denote 120 cd m−2, grey lines denote 700 cd m−2 monitor luminance level, solid lines denote an adaptation time of 10 s, dashed lines denote an adaptation time of 60 s. Error bars indicate the standard error of the mean
3.2 Experiment 2: Paired comparison
Each observer evaluated 76 pairs, including eight repeats and two null conditions. As said, the data of one male observer were removed due to amblyopia of the left eye. Internal reliability was checked by calculating the CIR. This coefficient is equal to 1 when no circular triads are present and 0 when all possible circular triads are present. 47 The data of three observers (two male and one female) were excluded based on a CIR below 0.5, leaving the data of 20 observers or 1520 evaluated pairs for further analysis. The mean CIR of the remaining observers was 0.74. Test–retest reliability was also assessed for each observer by comparing the answers of eight repeated pairs. Sixteen of the 20 observers made the same choice for at least five of the eight repeated pairs; one observer made the same choice in only three repeated pairs. The repeated pairs were randomised between observers; therefore, it is possible that for some observers, the repeated pairs were harder to judge than for other observers. Lastly, analysis of the null conditions showed a slight tendency to choose the second scene of the pair. Overall, for the null conditions, the second scene was chosen 65% of the time. Moreover, observers asked to see the pair again in 30% of the null condition pairs, compared to only 5% for the other pairs. This might be an indication that observers noticed the choice was harder for the null conditions.
In Figure 8, the results of the paired comparison experiment are shown. The z-scores for each of the 12 unique scenes are plotted as a function of the ambient luminance levels, for each of the three monitor luminance levels. Reading comfort significantly differed between the monitor luminance levels,
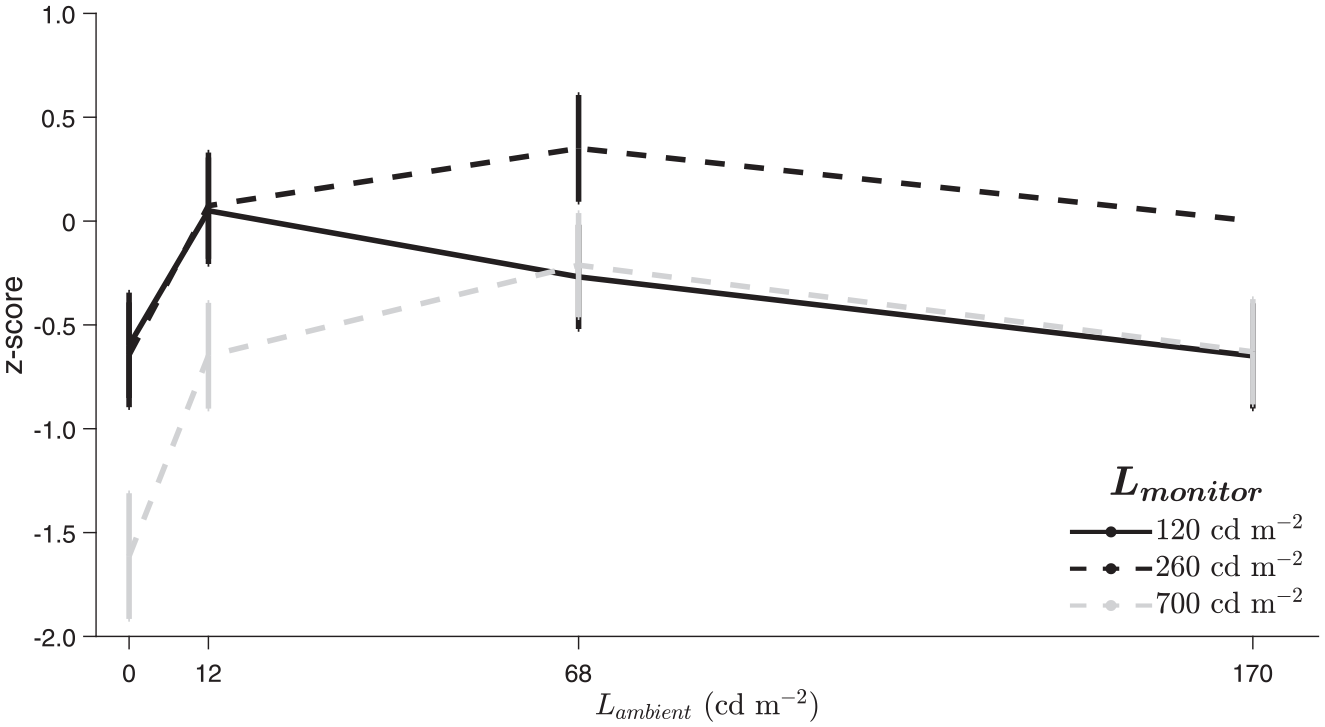
GLM z-scores (vertical axis) as a function of the ambient luminance levels (horizontal axis) plotted for each monitor luminance level. A separate line is plotted for each monitor luminance level: black solid line denotes 120 cd m−2, black dashed line denotes 260 cd m−2 and grey dashed line denotes 700 cd m−2 monitor luminance level. Error bars indicate 95% confidence intervals
In accordance with Stokkermans et al.,
51
a correlation coefficient was calculated between the z-scores of the paired comparison experiment and the mean scores of the continuous rating scale experiment for the 12 identical scenes in both experiments. A Kendall’s tau coefficient of 0.42 was found, indicating a low correlation
4. Discussion
4.1 Importance of ambient lighting
Illuminating the ambient environment, including walls and ceiling, has become increasingly important in the (European) standards and guidelines of good practice.22,52 In the latest revision of NBN EN 12464-1:2021 by the European Committee for Standardisation in 2021,
22
the minimum required maintained illuminance
The results of the presented study have confirmed the importance of wall luminance in establishing a good reading comfort environment when working with (high-luminance) monitors. Observers negatively scored the absence of ambient light while reading text on the monitor, which is consistent with other studies.20,28,53 A visual analysis of Figure 8 indicates that reading comfort improves within the required wall luminance range of the NBN EN 12464-1:2021 standard compared to the absence of ambient light. This effect was established as significant and validated by a coefficient test. The continuous rating scale experiment also revealed that increasing the wall luminance from 12 cd m−2 to 34 cd m−2 improved reading comfort, as shown in Figure 6. While not the primary focus of the study, these findings support the decision to double the required maintained wall (il)luminance in the latest revision of NBN EN 12464-1.
Increasing the ambient luminance level from ~0 cd m−2 to 12 cd m−2 thus positively affects reading comfort, regardless of the monitor luminance, see Figure 8. However, this improvement is not consistent across all ambient luminance levels. Reading comfort stabilises and even decreases significantly for the higher ambient luminance levels and lowest monitor luminance levels. It was expected that an ambient luminance level of 170 cd m−2 would be too high for comfortable reading on a monitor with a luminance level of 120 cd m−2. However, the occurrence of this result at a monitor luminance level of 700 cd m−2 was not anticipated. It was hypothesised that increasing the ambient luminance level up to 170 cd m−2 for this monitor luminance level would result in an ever-improving reading comfort score. The stabilisation/small decrease in reading comfort for an ambient luminance level above 68 cd m−2 was unexpected. Other studies suggest that ambient luminance should increase with increasing monitor luminance levels to maintain a visually comfortable scene.19–21 Therefore, a high monitor luminance of 700 cd m−2 would require a higher ambient luminance than the other monitor luminance levels. However, the aforementioned studies were conducted with either lower monitor luminance levels20,21 or on smaller display areas, 19 which may impact the applicability of their findings to the current results. In the presented study, several observers reported giving low reading comfort ratings to the high monitor luminance level when combined with increased ambient luminance levels due to excessive brightness in the room. This is in line with the study of Chraibi et al., 54 where a high (non-uniform) wall luminance of 200 cd m−2 has been linked to lower preferred task illuminances. In addition, reading under high monitor luminance levels is associated with visual fatigue, 11 which could also explain the current results, despite the initial anticipation that this would not be problematic due to the relatively short exposure time. 55 Finally, the overall state of adaptation throughout the experiment may impact the outcomes. However, measuring this effect is challenging. Although the results are likely to be significantly influenced by this factor, the present study does not delve into this aspect due to the complexity of its precise evaluation during the experiment. Based on these results, there thus appears to be no reason to further increase the required maintained wall (il)luminance in the NBN EN 12464-1.
4.2 Discrepancy of psychophysical methods
Two experiments with different psychophysical methods (continuous rating scale and paired comparison) were conducted to examine the effect of monitor and ambient luminance levels on reading comfort. The continuous rating scale experiment enabled rapid assessment of reading comfort for a large number of scenes. This allowed for investigating a wider range of luminance levels without extensively increasing the experiment duration. In addition, it was possible to investigate a longer adaptation time (60 s compared to 10 s) for a number of scenes. This continuous rating scale experiment was divided into four blocks, corresponding to the four monitor luminance levels. Observers thus evaluated only one monitor luminance level during each block. It was hypothesised that the luminance gap between the lowest and highest monitor settings would be sufficient to observe differences in reading comfort, which was supported by previous research. 25 Some observers noticed a change in monitor luminance between the four blocks of the experiment. However, based on the results, the monitor luminance did not seem to affect the reading comfort score. This is probably due to the experimental design and the limited distinctiveness of the continuous rating scale methodology. Moreover, the continuous rating scale experiment is sensitive to stimulus range bias. 29
Therefore, the paired comparison methodology (2IFC) was implemented as an additional experiment. As shown by Stokkermans et al., 51 the paired comparison methodology allows for investigating effects with small effect sizes. The effect of the monitor and ambient luminance levels on reading comfort could thus be investigated in more detail. This methodology provides the opportunity to directly compare monitor luminance levels and hence observe the effect of monitor luminance on reading comfort. In addition, observers can decide based on their own criteria 30 which scene provided the highest reading comfort. In contrast to the continuous rating experiment, the execution time for a paired comparison experiment grows exponentially with the number of stimuli. Therefore, the number of scenes was limited to 12 (three monitor luminance levels and four ambient luminance levels).
The results of the paired comparison experiment revealed a significant influence of monitor luminance on the reading comfort score, in contrast to the results of the continuous rating scale experiment. It is shown that increasing the monitor luminance from 120 cd m−2 to 260 cd m−2 positively affects reading comfort. Further increasing the monitor luminance to 700 cd m−2 decreases the reading comfort score for all ambient luminance levels. It is apparent that there is a tipping point in reading comfort between the monitor luminance levels of 260 cd m−2 and 700 cd m−2. Based on the current results, locating the exact point is impossible. The number of unique scenes of the paired comparison experiment was limited to 12 with a broad range for monitor (120 cd m−2 to 700 cd m−2) and ambient (0 cd m−2 to 170 cd m−2) luminance levels. A future study could investigate the region between 260 cd m−2 and 700 cd m−2 in more detail to examine the location of the tipping point. The continuous rating scale experiment could not observe this influence of monitor luminance. However, both experiments showed that dark ambient lighting was not conducive to reading comfort while increasing ambient luminance had a positive effect up to a certain point. Regardless of monitor luminance level, visual analysis of Figures 6 and 8 revealed a stabilisation or slight decrease of reading comfort around 34 cd m−2 to 68 cd m−2. Despite the low correlation, the results of both psychophysical methods exhibit some similar trends. However, the paired comparison method stands out for its distinctiveness and offers a deeper insight.
4.3 Melanopic EDI of the lighting scenes
Monitors with high luminance levels can have a significant influence on the non-image-forming pathway. 10 Even without ambient lighting, a monitor luminance level of 700 cd m−2 already induced a melanopic EDI of 185 lx at eye level. During the day, and especially in the morning, a melanopic EDI at eye level of at least 250 lx is recommended. 5 In this study, 7 of the 24 scenes reached this threshold and could thus be employed in an office environment to elicit non-image-forming effects of light. Of these seven scenes, the scene combining a monitor luminance of 260 cd m−2 with an ambient luminance of 170 cd m−2 scored best on reading comfort, followed by the scene with a monitor luminance of 700 cd m−2 and an ambient luminance of 68 cd m−2. However, these scenes did not provide the overall highest reading comfort as can be seen by comparing Figures 2 and 8.
The scene with the overall best reading comfort score had a monitor luminance of 260 cd m−2, an ambient luminance of 68 cd m−2 and a melanopic EDI of 159 lx, below the recommended threshold for non-image-forming effects. Therefore, based on the results of this study, it is not always possible to combine high biological potency with high reading comfort. However, switching between a monitor luminance level of 260 cd m−2 and 700 cd m−2 for an ambient luminance level of 68 cd m−2 results in an increase in melanopic EDI of 159 lx to 274 lx. Although reading comfort decreases during this period, it might still be acceptable for a short time, allowing high-luminance monitors to elicit non-image-forming effects.
Office workers could thus adjust their monitor luminance levels to trigger non-image-forming effects at the appropriate times, such as in the morning or when high attention is required. Although it is possible to increase melanopic EDI by increasing ambient luminance levels (see Figure 2), this might be more challenging than simply increasing monitor brightness. Naturally, additional lighting devices such as free-standing luminaires, pendant luminaires and lighting mounted on the monitor 56 can be employed and be more efficient to enhance melanopic EDI.
4.4 Limitations
The current study focused solely on the reading comfort of the scene without considering other variables that can be affected by adjusting monitor and ambient luminance levels. For example, increasing wall luminance can positively affect room appraisal and subjective alertness. 57 The effect of contrast (text to background) was not investigated, which can affect visual comfort. 58 However, since the study used black text on a white background, the identified reading comfort differences between lighting scenes were mainly due to changes in monitor and ambient luminance.
Other factors, such as contrast sensitivity levels 59 and age,25,27,59 can influence visual comfort and preference. These factors were not investigated in detail. Age did not significantly impact the results of the continuous rating scale experiment. However, the experiments were conducted on a relatively young group of participants, aged 20 y to 30 y for the continuous rating scale, and 20 y to 37 y for the paired comparison. Chraibi et al. 54 have shown that self-assessed sensitivity to distractions can influence preferred task illuminances, which may consequently affect the current findings. The presented study did not consider the potential impact of CCT on visual comfort and preference.28,33 The CCT of the monitor (6500 K) and ambient environment (4500 K) was kept constant during both experiments. In the second experiment, there were more male participants than female participants. However, in the first experiment, it was found that gender did not significantly affect the reading comfort scores, potentially indicating no effect for the paired comparison experiment. Reaching higher monitor and ambient luminance levels results in higher power consumption. 19 The specific power consumption values for the various scenes were not investigated in detail in this study.
A notable constraint in both experiments is the brief duration of exposure, which is unrealistic since people typically spend hours in an office environment. Repeating the experiments with different age groups and longer exposure times would be beneficial to see how the results translate to real-life scenarios. Additionally, the prevalence of natural light in most offices might impact the present findings. Overall, the study provides a starting point for conducting longer and more realistic experiments to better understand the impact of monitor and ambient luminance levels on reading comfort.
5. Conclusion
Reading comfort as a function of the monitor and ambient luminance levels was assessed, employing two psychophysical methods (continuous rating scale and paired comparison) to examine the possibility of working with high-luminance monitors. These monitors can elicit positive non-image-forming effects and are, therefore, useful in an office environment.
A dark ambient environment negatively impacted reading comfort in both the continuous rating scale experiment and the paired comparison design. Increasing ambient luminance had a positive effect up to a certain point. The paired comparison experiment revealed the differences between monitor luminance levels, indicating its distinctive capabilities. The results showed that the highest reading comfort score was achieved with a monitor luminance of 260 cd m−2 and an ambient environment of 68 cd m−2. The continuous rating scale experiment did not reveal a significant effect of adaptation time on reading comfort. However, a longer and more realistic exposure time might influence the outcomes. Future work could investigate reading comfort in an office environment using a longitudinal and more diverse research design.
Supplemental Material
sj-docx-3-lrt-10.1177_14771535241269709 – Supplemental material for Reading comfort in relation to monitor and ambient luminance levels: A study using continuous rating scale and paired comparison methodology
Supplemental material, sj-docx-3-lrt-10.1177_14771535241269709 for Reading comfort in relation to monitor and ambient luminance levels: A study using continuous rating scale and paired comparison methodology by R Daneels, L Van de Perre, Y Meuret and WR Ryckaert in Lighting Research & Technology
Supplemental Material
sj-pdf-1-lrt-10.1177_14771535241269709 – Supplemental material for Reading comfort in relation to monitor and ambient luminance levels: A study using continuous rating scale and paired comparison methodology
Supplemental material, sj-pdf-1-lrt-10.1177_14771535241269709 for Reading comfort in relation to monitor and ambient luminance levels: A study using continuous rating scale and paired comparison methodology by R Daneels, L Van de Perre, Y Meuret and WR Ryckaert in Lighting Research & Technology
Supplemental Material
sj-pdf-2-lrt-10.1177_14771535241269709 – Supplemental material for Reading comfort in relation to monitor and ambient luminance levels: A study using continuous rating scale and paired comparison methodology
Supplemental material, sj-pdf-2-lrt-10.1177_14771535241269709 for Reading comfort in relation to monitor and ambient luminance levels: A study using continuous rating scale and paired comparison methodology by R Daneels, L Van de Perre, Y Meuret and WR Ryckaert in Lighting Research & Technology
Footnotes
Declaration of conflicting interests
The authors declared no potential conflicts of interest with respect to the research, authorship, and/or publication of this article.
Funding
The authors received no financial support for the research, authorship, and/or publication of this article.
Supplemental material
Supplemental material for this article is available online.
References
Supplementary Material
Please find the following supplemental material available below.
For Open Access articles published under a Creative Commons License, all supplemental material carries the same license as the article it is associated with.
For non-Open Access articles published, all supplemental material carries a non-exclusive license, and permission requests for re-use of supplemental material or any part of supplemental material shall be sent directly to the copyright owner as specified in the copyright notice associated with the article.