
Abstract
The phantom array effect (PAE) is a series of repeated images that may be perceived when a person moves their eyes in large saccades across a light source (or a specular reflection of that light source) that is modulating in output over time. Fifty-five people, including a group of 25 who experience migraine, evaluated the visibility and annoyingness of phantom arrays produced by 85 unique temporal light modulation waveforms (including sine, rectangular, complex and DC waveforms) generated using an LED placed against a black background. Those with migraine exhibited higher average visibility compared to those without migraine (p = 0.019) and were relatively more sensitive at higher frequencies (p < 0.001). Younger participants also found more stimuli to be visible (p < 0.001). The threshold sensitivity function was similar to that developed for the phantom array visibility measure (PAVM), and PAVM was effective in predicting visibility (R2 = 0.87 for the relevant region of PAVM < 3). While those in the migraine group did not report seeing the PAE more often in everyday life at a statistically significant level, they reported being more annoyed by it and having more unwanted physiological responses (headaches, eye fatigue and distraction/disorientation). Members of the migraine group were also more likely to have changed their behaviour in architectural spaces (such as leaving a restaurant with ‘flickering’ lights). In the four hours after completing the experiment, 64% of the migraine group (vs. 19% of the non-migraine group) reported experiencing discomfort or an adverse reaction. In particular, 41% reported experiencing a headache (vs. 8% for those in the non-migraine group).
1. Introduction
Temporal light modulation (TLM), colloquially called flicker, is variation in light output over time. This modulation has been a characteristic of almost all light sources for over 120 y, but traditional light sources exhibited some persistence over time due to thermal inertia (from filaments or incandescing arc-tube materials) or phosphors. 1 The TLM frequency was generally twice the mains AC distribution voltage (50 Hz in much of Europe and Asia resulting in 100 Hz TLM; 60 Hz in North America resulting in 120 Hz TLM). Furthermore, the modulation was almost always gradual (e.g. sinusoidal or rectified sinusoidal) and did not vary rapidly between on and off states, but rather between maximum and a minimum value (e.g. 60% of maximum). Some observers could see the variation in incandescent lighting from voltage fluctuations at the ends of power distribution systems, or from magnetically-ballasted fluorescent and high-intensity discharge (HID) sources in interiors. The flicker complaints from magnetically-ballasted fluorescent and high intensity discharge sources diminished in the 1990s when high-frequency electronic ballasts were incorporated into these systems. When LED systems were introduced in the early 2000s, some products exhibited more extreme modulation and short persistence (on the order of nanoseconds). Some manufacturers used pulse-width modulation (PWM) to tailor or dim the output (e.g. turning a constant current signal on and fully off, rapidly and repetitively). The resulting higher TLM visibility has brought back concerns over the cognitive, behavioural and health effects of repetitive light patterns.
Not all observers ‘see’ TLM, and not all that do are distracted or affected by it. TLM may be visible directly at lower frequencies (less than about 80 Hz), or through the stroboscopic effect (between about 80 Hz and 1000 Hz), or the phantom array effect (PAE) at higher frequencies (between 80 Hz and 20 000 Hz). 1 This article focuses on the PAE, which is a series of repeated images that can appear when a person looks from one point to another (i.e. saccades) across a modulating light source or an object illuminated by a modulating light source. The PAE is illustrated in Figure 1 using a moving camera and modulating light source. Importantly, TLM may have physiological effects without being consciously observed.
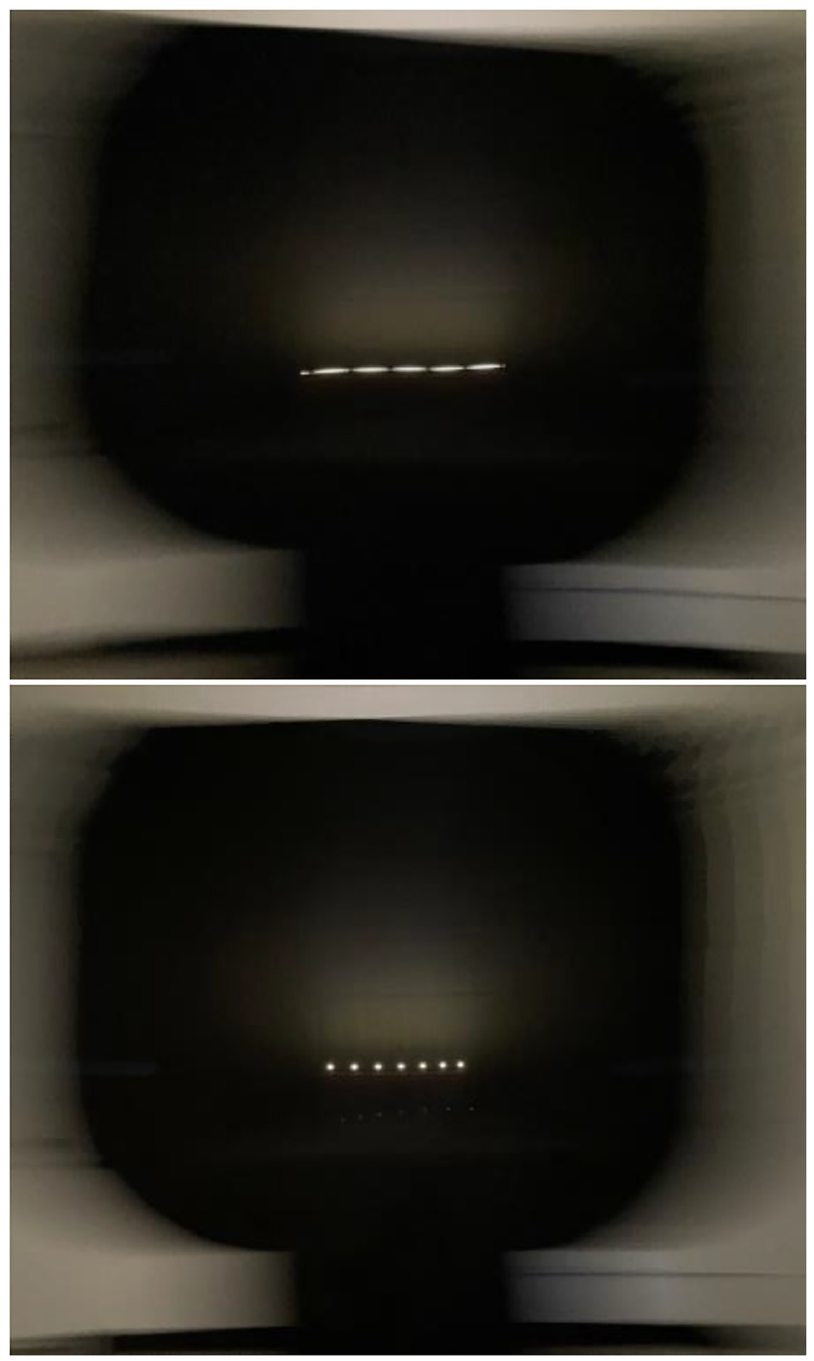
Illustrations of the PAE generated using a moving camera
Investigations into the visibility of TLM have generally progressed from lower frequencies toward higher frequencies, with substantive investigations into the PAE primarily being conducted in the past decade. This is partially due to the recent widespread adoption of LED systems in the 2010s using PWM as a common dimming technique, resulting in unfamiliar TLM waveshapes: rectangular modulation at various duty cycles, and higher levels of modulation than seen in conventional electric lighting. 1 LEDs have also led to wider use of frequencies above 120 Hz but below 20 000 Hz.
Psychophysical research to determine threshold visibility functions has enabled the development of new metrics quantifying the visibility of TLM-induced effects. These threshold visibility models allow a TLM waveform to be broken down into its constituent Fourier frequencies. Summing the visibility of the component frequencies has been shown to predict relative visibility of the composite TLM.2,3 CIE 249:2022 4 summarized the state of knowledge for direct flicker and the stroboscopic effect, but only a provisional model was presented for the PAE and higher frequencies.
The provisional model for PAE visibility in CIE 249 was primarily based on the research of Wang et al. 5 This study used a narrow white opaque target (0.02° visual angle) on a black background on a table lighted to 250 lx or 500 lx, levels more common in workspace interiors. The TLM conditions were 100 Hz, 600 Hz or 1200 Hz; sine waves; modulation depths from 20% to 100% for 100 Hz and 1200 Hz; modulation depths of 8% to 20% for 600 Hz. Others have examined higher frequencies using luminous targets in very dark surrounds,6–8 in which case some observers can reliably see the PAE above 10 000 Hz. The average results appear to depart from the sensitivity function of CIE 249, particularly at higher frequencies; however, visual sensitivity to TLM is also application and population dependent. Limited research has focused on developing threshold visibility functions across the visible frequency range, across ambient light conditions or across population sensitivity ranges.
Miller et al. 9 examined visibility of TLM based on different combinations of the four principal source-based visibility factors: frequency, percent modulation, duty cycle and waveshape. PAE visibility peaked between 500 Hz and 1000 Hz and was visible for some observers at 6000 Hz, the highest frequency tested. The data from Tan et al. 10 were used to derive a threshold modulation function, which was then incorporated into the phantom array visibility measure (PAVM). This function shows relatively higher sensitivity at frequencies above 1000 Hz compared to the CIE 249 function. The current experiment builds upon the Miller et al. data, using a different psychophysical approach and different waveforms to compare threshold visibility and test the performance of PAVM.
PAVM was recently incorporated in IES TM-39-24, Quantification and Specification of Flicker 11 (currently undergoing ANSI public review), where in combination with the stroboscopic visibility measure (SVM) and perceived modulation (MP) it has been used to establish three provisional performance levels. The levels for the PAE are Minimum (Potentially Problematic) for 0.9 < PAVM ≤ 1.6, Good for 0.4 < PAVM≤ 0.9 and Better for PAVM ≤ 0.4.
1.1 Migraine and TLM
Research has linked migraine with sensitivity to TLM for decades.12–15 Proposed explanations include abnormal visual evoked potential in response to intermittent light, 16 a hyperexcitable cortex in individuals with migraine 17 and cortical mechanisms such as haemodynamic response that explain photophobia from aversive stimuli such as bright light, flicker and patterns. 18 However, no research has investigated if or how PAE sensitivity varies between people with and without migraine. Likewise, there has been no research on physiological symptoms following exposure to the PAE – for either migraine or non-migraine groups. Many TLM-visibility studies in the past have rejected participants with migraine,19–21 with a concern that this group poses a risk of harm from TLM. This may have excluded more sensitive individuals, leading to results not representative of the full population. We explicitly sought to compare migraine to non-migraine groups, recognizing it is the more sensitive group that needs additional protection in lighted environments.
1.2 Physiological responses to TLM
While investigations have primarily focused on visibility, past work has also demonstrated TLM may have physiological consequences whether it is visible or not. Wilkins et al. 12 studied the incidence of headache in an office building before and after a change between magnetic ballasts and electronic ballasts in fluorescent overhead lighting. In a double-blind study, the incidence of headache under 100 Hz modulation was twice that at 32 000 Hz frequency, although the headaches were concentrated in a small group of individuals in both cases. Jaén et al. 22 showed a decline in visual search performance (task time and errors) as a result of 100 Hz modulation compared to 64 000 Hz modulation. Veitch and McColl 23 found reduced reading task performance under 120 Hz modulation from magnetically ballasted fluorescent lighting compared to electronic ballasts (between 20 000 Hz and 60 000 Hz).
In addition to visibility, we sought to better understand how people experience the PAE in everyday life and to understand if the experimental exposure caused any physiological responses during or shortly after participation.
1.3 Aims and hypotheses
The goals of this work were to (1) collect additional data on threshold visibility of the PAE; (2) understand the nature of individual- and group-level differences in visibility and subjective annoyance of the PAE; (3) test the performance of PAVM and (4) quantify potential adverse physiological reactions to the PAE, during and after exposure, comparing groups of observers.
Based on our past work comparing people sensitive and not-sensitive to the PAE, we hypothesized that the migraine group would have a higher overall sensitivity to TLM, identifying more waveforms as visible than the non-migraine group. Furthermore, we hypothesized that they would report more visibility at lower modulation depths, but there would not be a difference attributable to frequency. We also hypothesized that sine waves would be less visible than 50% duty cycle rectangular waves with the same modulation depth.
2. Methods
2.1 Participants
Paid participants were recruited primarily through social media and word of mouth. A pre-participation questionnaire was administered online to identify individuals with and without migraine. People who responded that they had a history of migraine were subsequently asked to provide further details about their history, symptoms and severity; these responses were reviewed by a medical professional so that only people without debilitating symptoms were invited to participate in the experiment. All the people with migraine listed symptoms consistent with a migraine diagnosis, but additional clinical evaluations were not performed. Of the 25 participants in the migraine group, 20 were classified as experiencing migraine with aura and 5 without aura – due to the low number experiencing migraine without aura, this subgroup was not analysed independently. No individuals with migraine were excluded by the medical professional due to their symptoms. All recruiting materials, forms, questionnaires and experiment protocols relevant to participants were reviewed and approved by the Institutional Review Board.
Fifty-five individuals completed the experiment, including 25 with migraine. Of all participants, 53% were female; 64% of the migraine group were female, which is not unexpected given that more women than men report experience migraine by a ratio of roughly 2 to 1. 24 Age ranged from 22 y to 81 y, with a median age of 39 y. Median age was 46 y for the migraine group and 37 y for the non-migraine group.
2.2 Apparatus
The study took place in a room at Pacific Northwest National Laboratory’s Lighting Science and Technology Laboratory in Portland Oregon, USA. Dimensions and other details are shown in Figure 2, with a photo of the space in Figure 3. The ceiling height was 2.6 m. A single blue-pump, phosphor-coated, heat-sink-mounted LED assembly was set up on a table located at the end of the room, mounted at the participant’s approximate eye height of 1.2 m. The participant was seated in a chair with approximately 3.0 m distance between eye and LED (head position was not restricted). Two marked visual targets were located on wall behind the light source at the 1.2 m eye height, each at a 22.5° visual angle to the left or the right of the LED. The room’s vertical surfaces were painted with Munsell N8 paint having a rated reflectance of 59%. The wall area around the TLM light source was draped in matte black cloth to increase contrast between the source and its background.
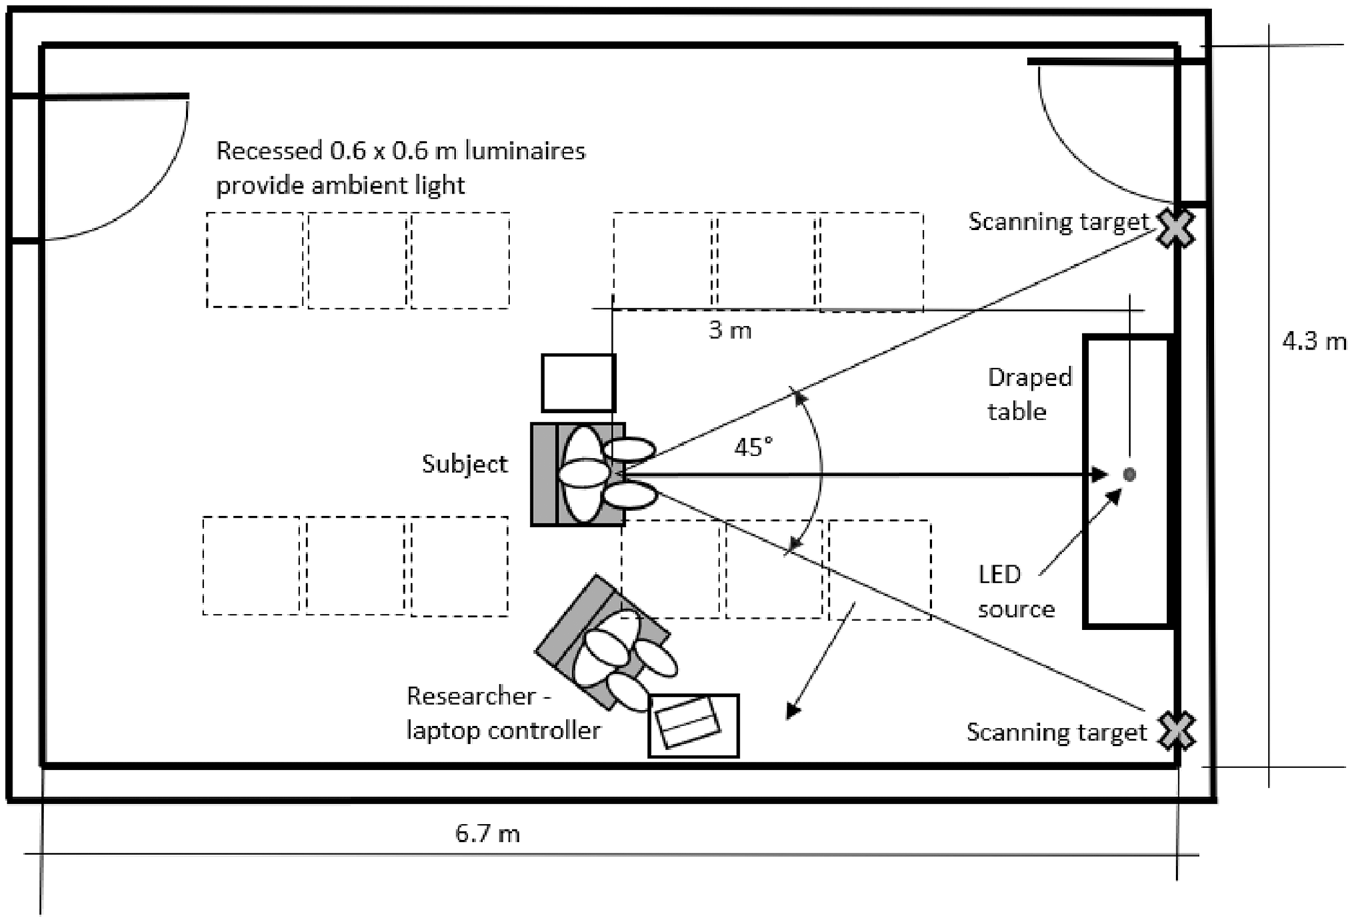
Floor plan of the experiment room
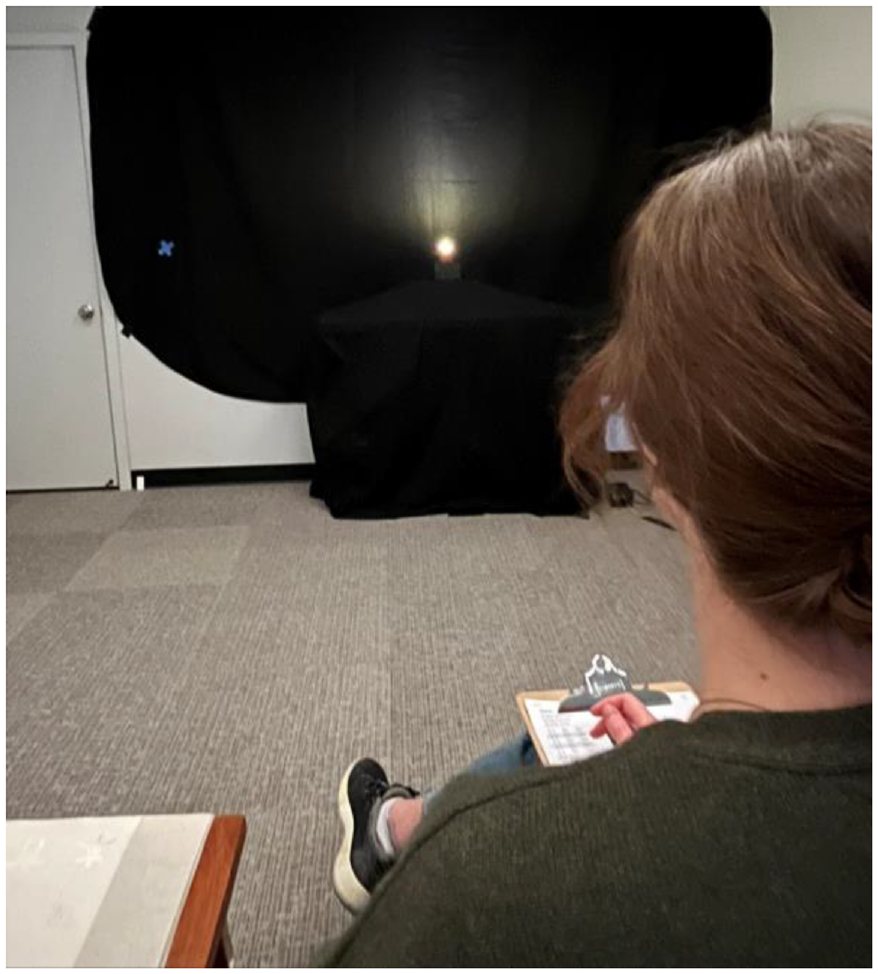
Photograph of the experiment space from the view of the participant
Ambient light was provided by 0.6 m × 0.6 m tuneable luminaires mounted in the suspended tile ceiling. The correlated colour temperature measured at the eye was 2907 K with a distance from the Planckian locus (Duv) of 0.003, dimmed to deliver horizontal illuminance of 18.5 lx on a 0.76 m workplane measured on a 1.2-m grid between the participant and test light source. Vertical illuminance at the participant’s eye was approximately 8.8 lx from the ambient lighting, and 1.9 ± 0.2 lx (depending on the specific waveform) from the LED test source. All illuminance and spectral measurements were taken with a Konica Minolta (Japan) CL-500A spectrophotometer, and luminance measurements with a Konica Minolta (Japan) LS-160. The overhead luminaires were driven at a nominal frequency of 32 kHz.
All modulating light conditions were generated from a ThorLabs (USA) MWWHLP1 LED (2871 K, 0.001 Duv, 11.7 VF, 750 mA, 3.5 mm diameter by 1.6-mm height emitter), which had a visual angle of 0.06° across the dimension of the scan. Its spectral power distribution, colour characteristics and melanopic daylight equivalent ratio (mel-DER) can be found in Supplemental Material. The LED was driven by a ThorLabs (USA) DC2200 LED driver that converted the digital inputs from a Rigol (China) DG800 arbitrary waveform generator (AWG). A computer and Python script were used to automate the sequence of stimuli, providing input to the AWG for each of 85 pre-programmed conditions.
2.3 Modulating light conditions
Table 1 provides the nominal (i.e. target output waveform characteristics from the LED) and measured output characteristics for each TLM condition. TLM measurements were made with an Admesy (The Netherlands) Asteria meter. Input parameters to the AWG were modified using an iterative process to generate the desired shape and luminance of TLM waveforms as closely as possible. The target LED luminance was 52 400 cd m−2, but not all targets could achieve this because the waveform data input from the AWG to the driver and LED did not match the measured output. The waveforms were distorted by the limitations of the driver and, to some extent, the normal behaviour of the LED. Latency in ramp-up/ramp-down output shifted the shape sufficiently to affect luminance. The system used is described further in Miller et al. 9 The final measured variation in luminous output was within ±10% from the mean for all waveforms, with only 10% duty cycle, 100% modulation waveforms exceeding ±3%. These measurements were made with the Admesy Asteria while measuring the TLM.
Summary of target and measured characteristics
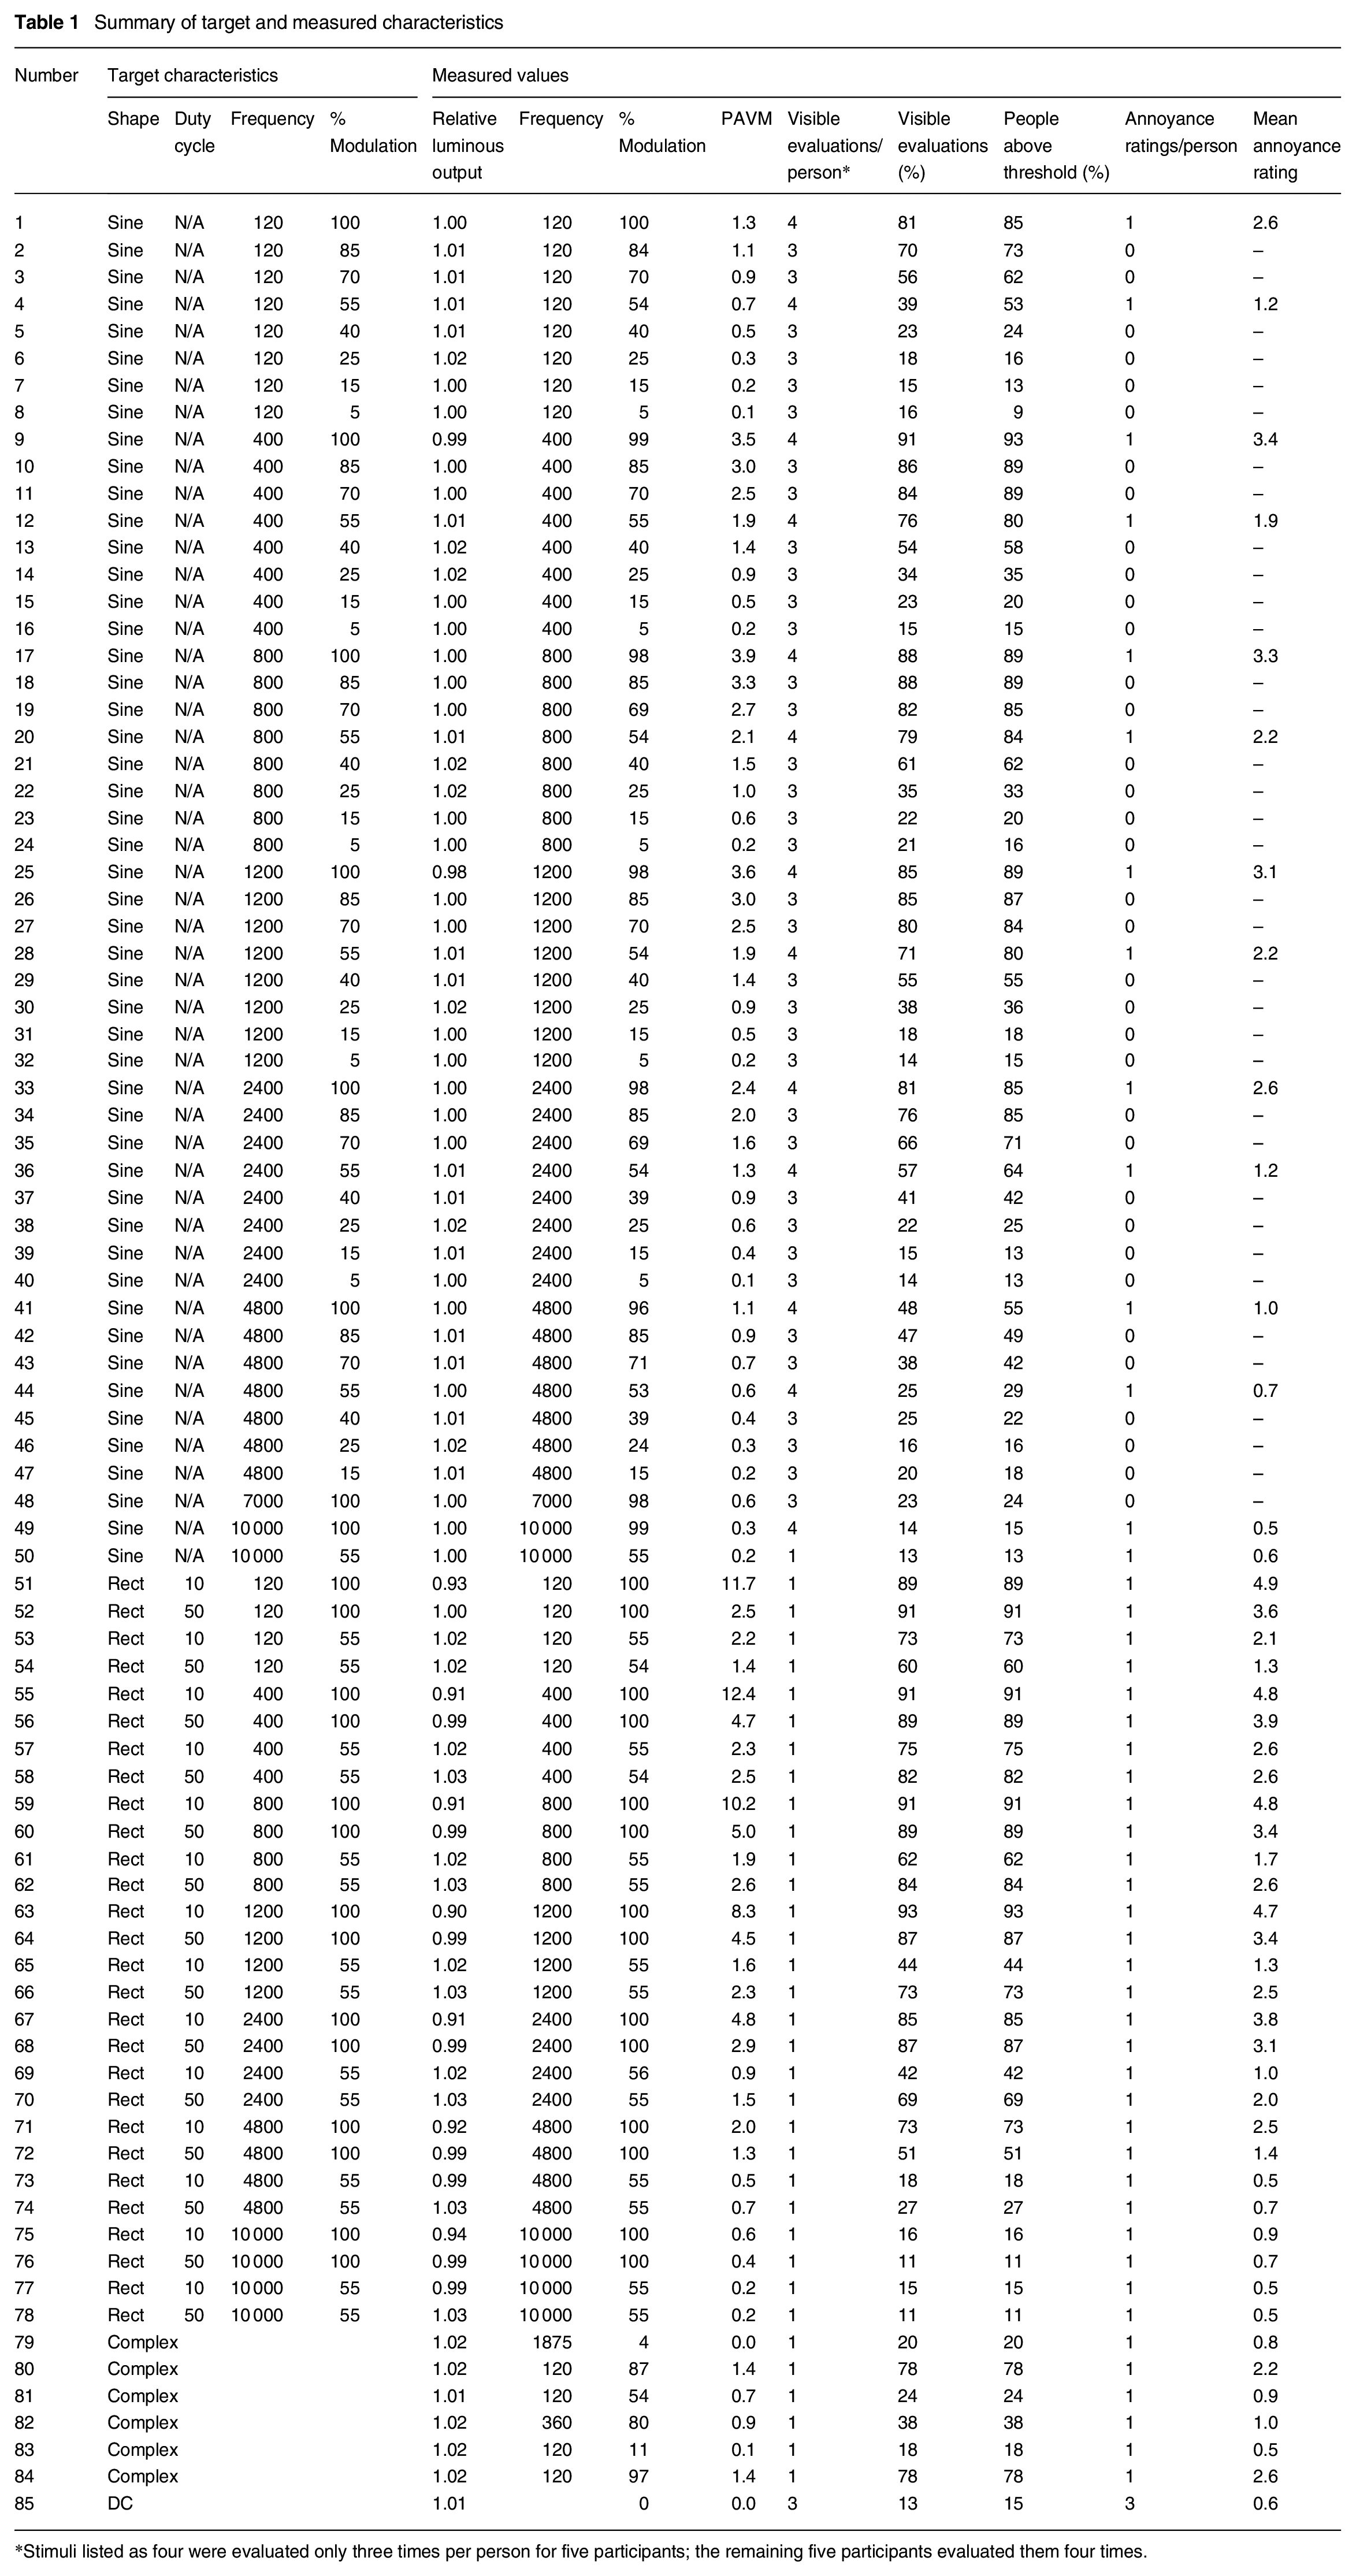
*Stimuli listed as four were evaluated only three times per person for five participants; the remaining five participants evaluated them four times.
The conditions included 50 waveforms with a sinusoidal shape, primarily divided across six frequencies (120 Hz, 400 Hz, 800 Hz, 1200 Hz, 2400 Hz or 4800 Hz). Seven or eight modulation depths were presented at each of these frequencies (100%, 85%, 70%, 55%, 40%, 25%, 15% and 5% modulation for frequencies of 2400 Hz and less). In addition, sine waves at 7000 Hz 100% modulation, 10000 Hz 55% modulation, and 10000 Hz 100% modulation were presented.
The modulating light conditions also included 28 rectangular shape waveforms divided across seven frequencies (120 Hz, 400 Hz, 800 Hz, 1200 Hz, 2400 Hz, 4800 Hz and 10 000 Hz). At each frequency, there were two modulation depths (100% and 55%) and two duty cycles (10% and 50%) – crossed for four total conditions per frequency. There were also six complex waveforms that were generated using measurements of commercially available lighting products. Finally, participants also evaluated what was effectively a DC waveform intended to have no modulation. Representative sine and rectangular TLM waveforms are illustrated in Figure 4, along with the complex waveforms.
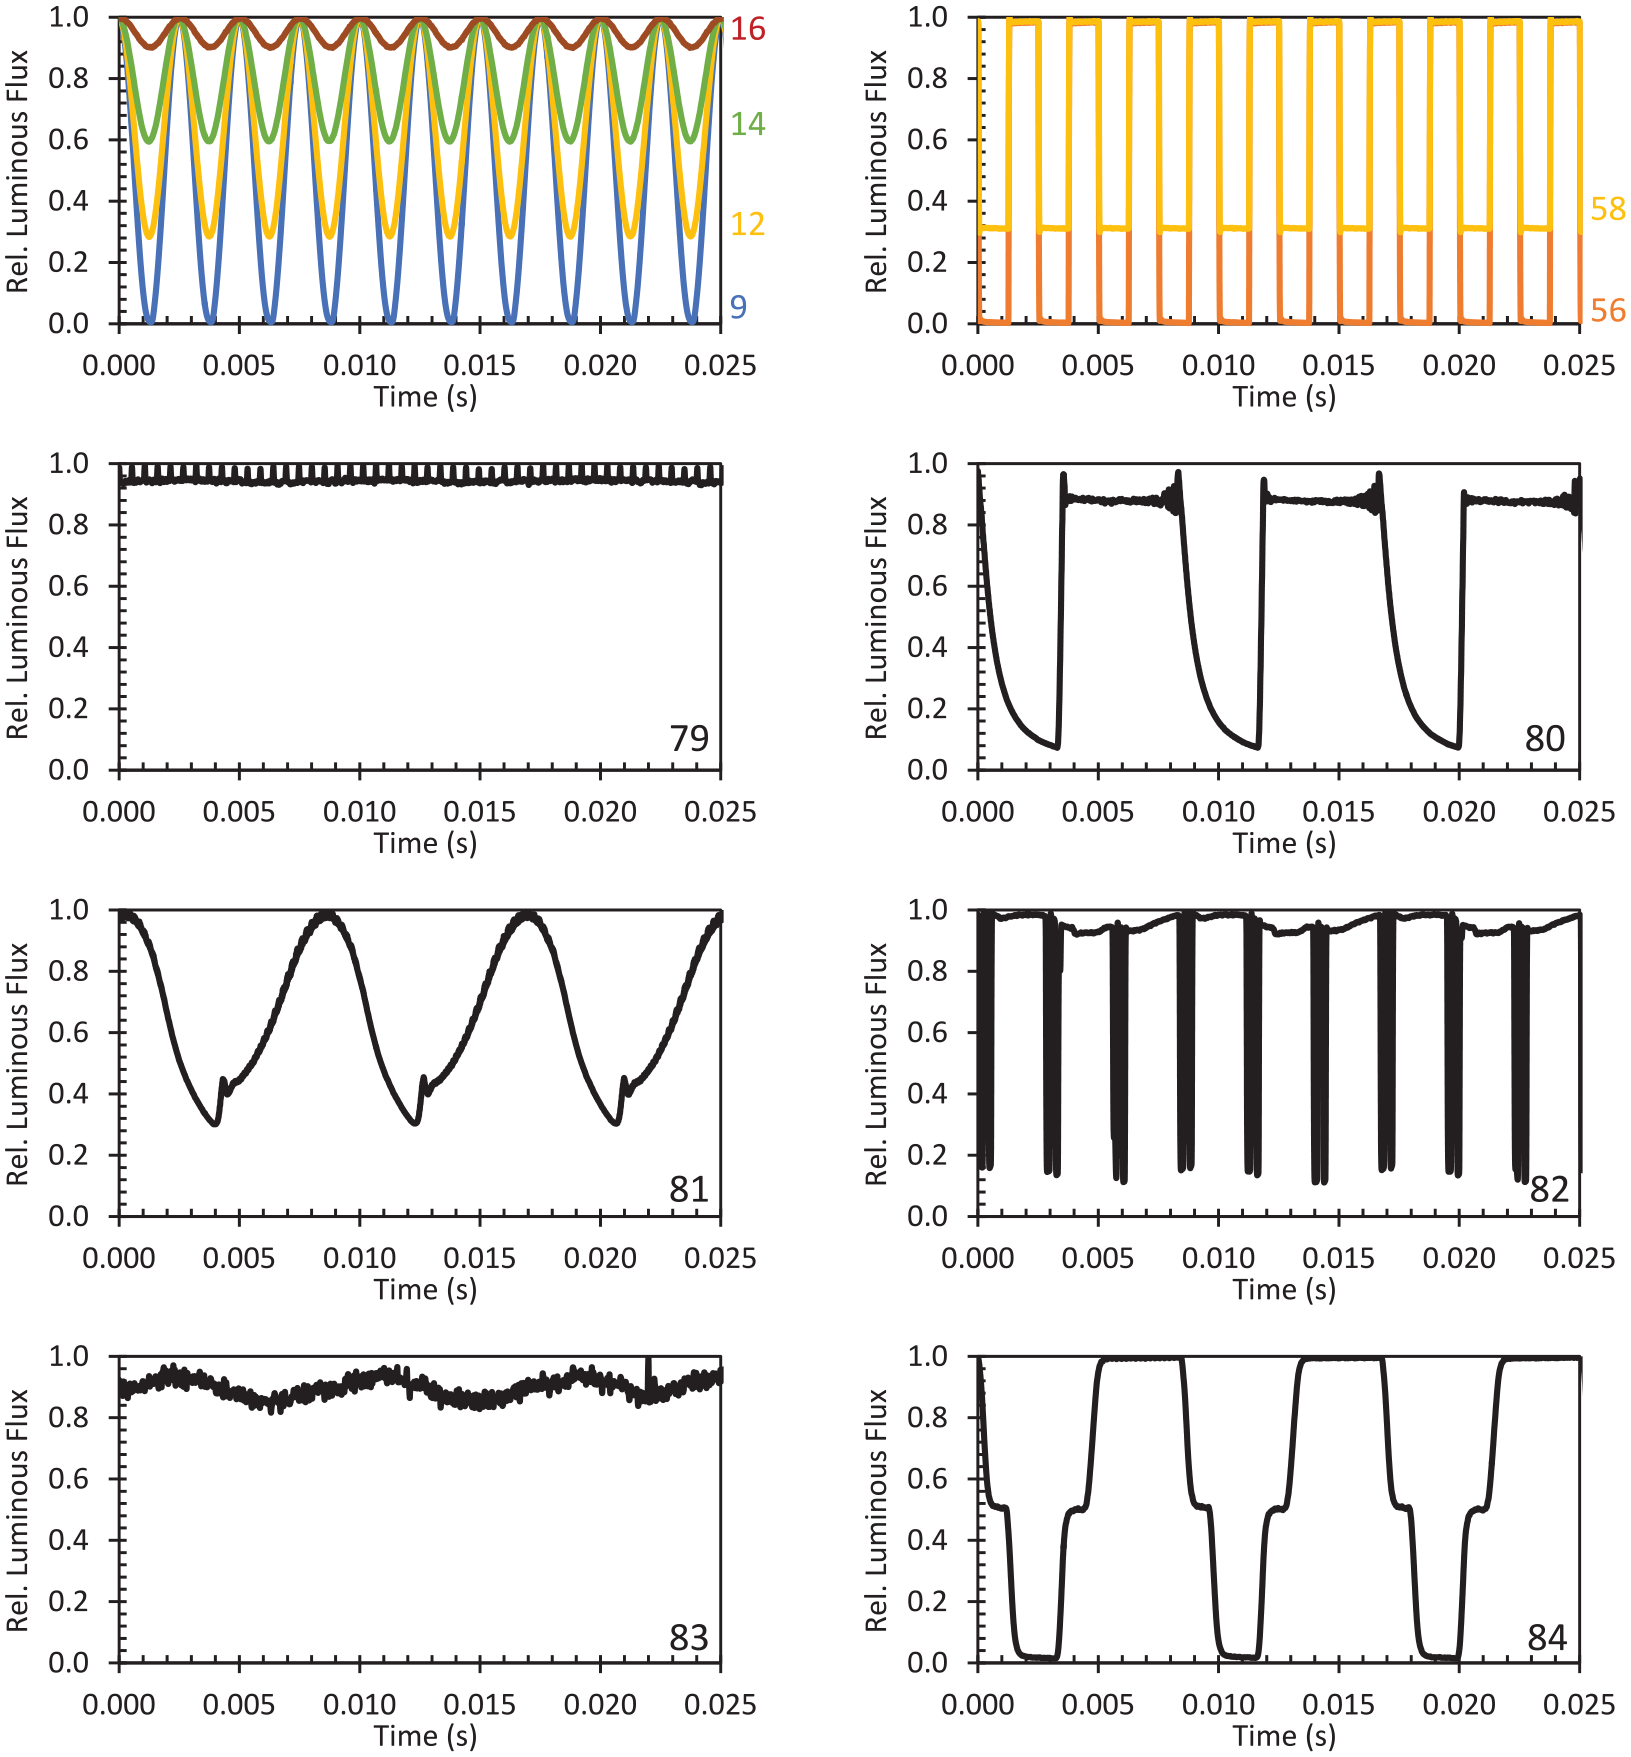
Selected measured waveforms identified by their identification number (see Table 1). All waveform data is available in the Supplemental File
2.4 Dependent measures
2.4.1 Responses to stimuli
Participants were asked to indicate visibility of the PAE verbally and record it themselves on paper by circling Yes or No. They were told that either a single spot or a smooth streak would constitute a no visibility response and were given several examples (Figure 5) of what might be considered a yes (i.e. visible) response.
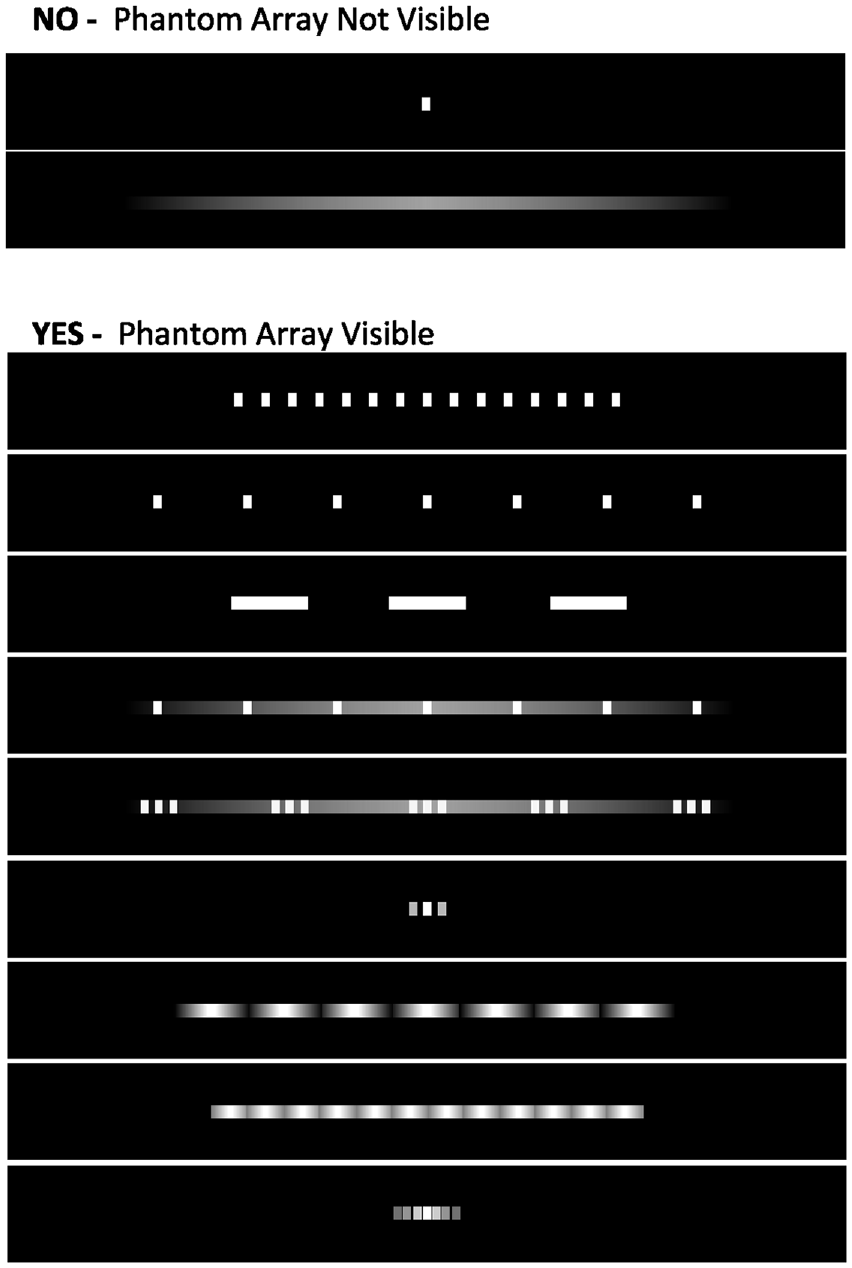
Examples given to participants during the instructions
In the second portion of the experiment, participants evaluated the visibility of the PAE by circling Yes or No and rated how annoying it was (if at all) on a 0 to 8 scale. Zero was described as not annoying at all, with eight described as a stimulus that would require immediate change if encountered in a real environment. Participants were instructed to focus on the pattern of light, ignoring glare, colour or any other quality.
2.4.2 Additional questionnaires
In addition to the responses to each stimulus, participants completed a questionnaire at the completion of the in-lab portion of the experiment. It asked:
• How often do you see the PAE in your everyday life? (Never, Rarely, Sometimes, Often, Every day)
○ If you see this effect in everyday life, what are some places where you typically see it?
• When you see the PAE, how often are you bothered by it? (Never, Rarely, Sometimes, Often, Always)
• Have you ever had any physical symptoms when you are in a space where the PAE is visible to you, that you attributed to the lighting?
• Have you ever changed your behaviour (e.g. left a restaurant, left a building, changed the lighting in your home) because of the visibility of the PAE? If yes, please explain.
One to three days after concluding their session in the laboratory, participants were sent an email with a link to complete a final questionnaire asking about any post-experiment experiences. It asked:
• Did you experience any discomfort or other adverse reactions within 4 h of your visit to the laboratory?
○ If yes, what symptoms or discomfort did you experience? How long did your symptoms last? How long after your lab visit did the symptoms begin to occur?
2.5 Procedure
Each participant was admitted to the laboratory and escorted to the experiment room. Once seated, the ambient lighting was set to the low levels of the experiment to begin adaptation. The participant read instructions and provided consent. The experimenter then verbally explained the procedure and reiterated that if they were to sense any discomfort, they could request a break or stop altogether. As part of the instructions, participants were shown the graphic provided in Figure 5.
Next, five sample waveforms exhibiting different TLM characteristics were presented to help the participant understand the task and range of conditions they might see. During this time, participants were trained to move their eyes from the left target to the right target and back again, using a metronome set to 126 beats min−1. This corresponded to an average saccade velocity of 95° s−1, with a peak velocity near 500° s−1. 25 Between the reading of the consent form and the training using example waveforms, the participant spent about 10 min adapting to the ambient light levels.
The first experiment task was evaluating the visibility of the sine-shaped waveforms (excluding #50). The stimuli were presented in 18 blocks, with 3 blocks per frequency (note that 4800 Hz, 7000 Hz and 10 000 Hz were together). The three blocks per frequency followed three different patterns: ascending modulation depth, descending modulation depth and random modulation depth. The 12 blocks with ascending and descending patterns were presented first, in random order. Then the six blocks with random patterns were presented in random order, after the participant was offered a break. For the ascending and descending patterns, the presentation was ended after three consecutive visible (ascending) or not visible (descending) responses, with the remainder assumed to be the same – this was done to reduce the experimental burden. 4.9% of responses were assumed. This task resulted in three evaluations per stimulus.
After being offered another break, listening to a second round of instructions and seeing corresponding examples, participants completed the second task that included both binary evaluations of visibility and ratings of annoyance. These were completed once, in random order, for all rectangular and complex waveforms, as well as a subset of 14 sine-shaped waveforms with 55% and 100% modulation. Three evaluations of DC waveforms were randomly interspersed. All except one of the sine-shaped waveforms (10 000 Hz 55% modulation depth) were additional replications of the stimuli from the first task. Thus, 48 of the sine-shaped waveforms had four replications – determined with a hybrid of staircase and constant stimuli methods – allowing for determination of the modulation depth corresponding to threshold. The others had three and one replication each.
Upon completion of the roughly 90-min session, participants were asked to complete the exit questionnaire on a computer in the room. Once they were finished, they were compensated. A link to the follow-up questionnaire was emailed to each participant 1 day to 2 days later. One follow-up email request was sent to participants who did not respond to the initial follow-up.
3. Results
Full data is available in Supplemental File. There were 10 645 binary visibility responses (yes/no) across 85 unique stimuli and 2804 annoyance ratings (0 to 8) across a subset of 51 unique stimuli. Visibility responses were provided between one and four times per stimulus per participant, as noted in Table 1. Annoyance ratings were provided once per stimulus for 51 of the 85 stimuli per participant.
Visibility for different groups (or all participants) is based on the percent visible responses across all repetitions and all participants within the group. The data aggregated across all participants (i.e. one data point for each stimulus) are highly linearly correlated (R2 = 0.99) with the percent of participants who rated each stimulus as visible 50% or more of the repetitions (i.e. above threshold), and statistically the conclusions do not change between these two data formats.
All tests for statistical significance were performed at the α < 0.05 level.
3.1 Participant groups
A total of 55 people completed the experiment. The participants included 25 in the migraine group (M) and 30 in the non-migraine group (NM). Summary data for all participants is provided in Table 2. Age differences between the M and NM groups were not statistically significant. However, the M group was more heavily female – with a count of 16 female, 7 male and 2 other responses (1 non-binary, and 1 prefer not to say) – which is consistent with other prevalence data for migraine.24,26 Age was modelled as a continuous covariate in statistical models but is shown in some figures as two groups: 40 y or greater (28 participants) – denoted older (O) – and < 40 y (27 participants) – denoted younger (Y).
Demographic data and results of questionnaires
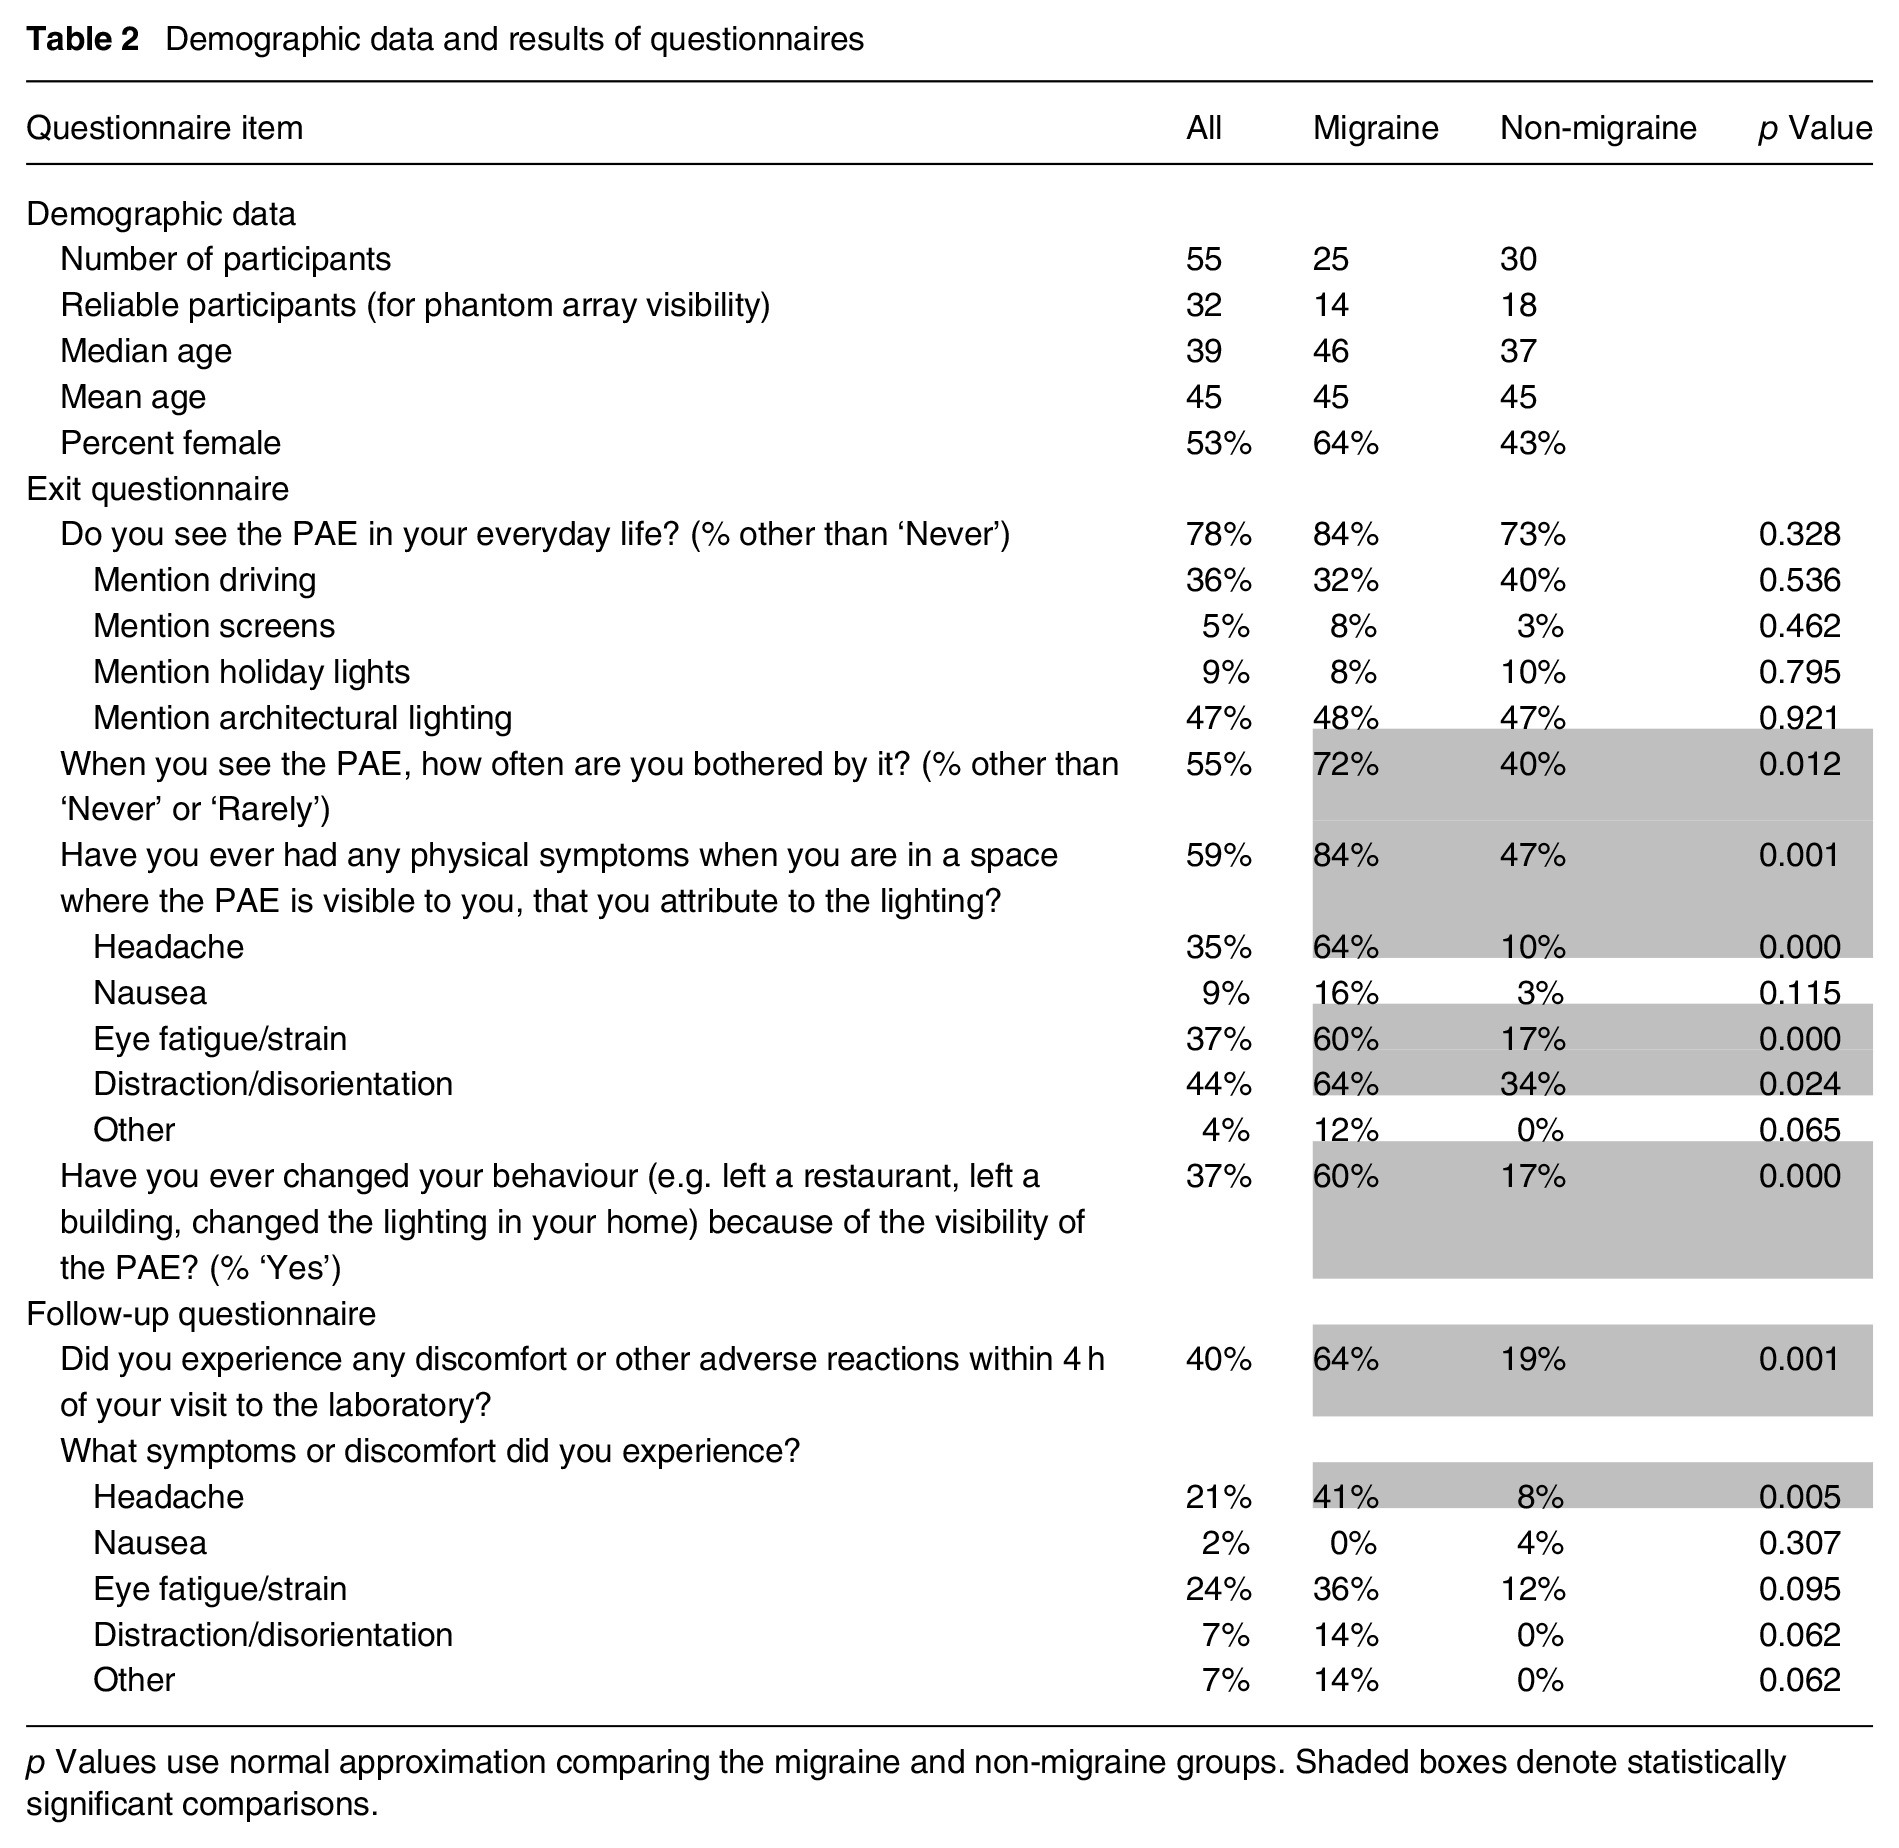
p Values use normal approximation comparing the migraine and non-migraine groups. Shaded boxes denote statistically significant comparisons.
Analysis of the visibility and annoyance data for the PAE were completed for the full set of participants. A priori criteria were used to identify the most reliable participants, for the purpose of establishing averaged sensitivity functions for a generalized metric. These criteria were:
completed all sections of the experiment – the first five participants, two with migraine and three without migraine, did not evaluate all stimuli due to a technical error, leaving 50 complete participants.
detected the PAE in more than 10% of the stimuli – excluded six participants, who had a mean of 2% of the evaluated stimuli rated as visible.
rated at least two of the three DC waveforms as not visible – excluded nine more participants.
had fewer than two out of seven frequencies for which averaged visibility across repeated trials resulted in multiple reversals from above to below threshold visibility – excluded four additional participants (and seven others who were already excluded would have otherwise failed to meet this criterion).
Thus, there were 31 reliable participants, including 13 with migraine and 18 without migraine. The 31 reliable participants included 16 older and 15 younger participants.
3.2 Exit and follow-up questionnaire
As shown in Table 2, the difference in the percentage of the migraine group and non-migraine group saying they see the PAE in everyday life was not statistically significant (normal approximation test for two proportions); however, when the full ordinal response data was analysed in a general linear model, the migraine group’s self-rating of frequency of seeing the PAE in everyday life was statistically higher than the non-migraine group (p = 0.004). Furthermore, Table 1 shows that the migraine group was statistically more likely to be annoyed by the PAE (p = 0.004), and attributed more symptoms to the PAE, including statistically significant differences for headache, eye fatigue/strain and distraction/disorientation. Finally, the migraine group was statistically more likely to have changed a behaviour in response to the visibility of the PAE (p < 0.001). All these responses came at the conclusion of the experimental session. There were no statistically significant differences in the exit questionnaire based on age group or gender. These results address all participants, as performance during the experiment was considered unrelated to their prior or post-experiment experiences.
Forty-seven of fifty-five participants responded to the follow-up questionnaire. There was a statistically significant difference in the proportions of the migraine group (64%) and non-migraine group (19%) who experienced discomfort in the hours after the experiment, as indicated in the follow-up questionnaire. The largest (and only statistically significant) difference for a specific symptom was in the percentage of people who reported a headache (41% to 8%). Likewise, participants < 40 y (36%) old reported more headaches and more eye fatigue than the participants aged 40 y and older (9%; p = 0.018) – both at the same proportions. However, the overall proportion for reporting any discomfort (52% to 26%) was not statistically different (p = 0.056).
While the questionnaire data does not prove a causal relationship, the combination of results from the questionnaires indicates that the PAE is substantially more problematic for the migraine group compared to the non-migraine group, and for younger participants. As subsequently described, these groups were also more likely to see the PAE during the experiment.
3.3 Visual sensitivity to PAE
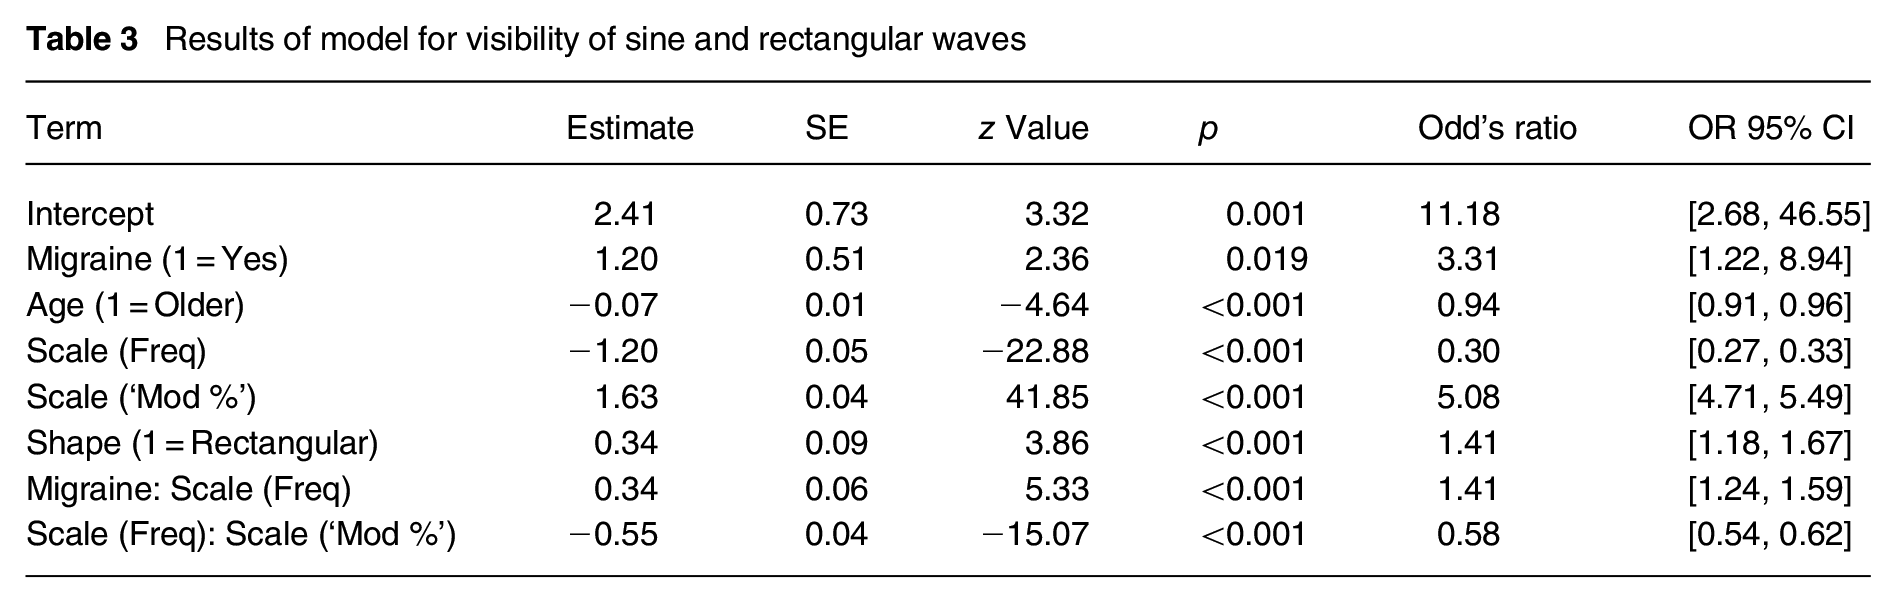
Analysis of variance was performed using a mixed effects binary logistic regression model, accounting for the repeated measures design with a binary outcome of visible or not. Assumptions of singularity, multicollinearity and dispersion were met. The complete model and results are provided in Table 3. This model included all observers’ individual responses for rectangular and sine waves, excluding DC and complex waveforms. Frequency, modulation depth and shape were statistically significant factors affecting visibility, in agreement with prior data. Note that duty cycle could not be simultaneously modelled. Migraine status and age were also statistically significant factors, but gender was not. The migraine group and younger participants were more likely to rate the stimuli as visible, with the odds ratio for the migraine group (3.31) being substantially higher than for age (0.94). Interactions between modulation depth and frequency and between migraine status and frequency were also statistically significant.
Results of model for visibility of sine and rectangular waves
The effect of migraine was anticipated based on prior literature,8,13,27 but the effect of age has not previously been documented. Five of the six participants who saw the PAE for less than 10% of the stimuli were aged 64 y or older. Even excluding these people, there was a decline in proportion of visible stimuli with age of approximately 2.8% per 10 y of age – a linear regression between age and number of stimuli visible above threshold had R2 = 0.08. We hypothesize that this may be related to visual acuity and extent of visual field (declining with age), 28 average saccade velocity (declining with age) 29 or declines in contrast sensitivity. Pattern glare sensitivity also decreases with age 30 and may have a common mechanism with reduction in PAE sensitivity with age.
Figure 6 shows the proportion and 95% confidence interval for the visibility of each stimulus for all participants. Figures 7 and 8 show the same but differentiating between M and NM (Figure 7) and Y and O (Figure 8). The confidence intervals were estimated using the normal approximation. Important takeaways include:
Peak sensitivity occurred between 400 Hz and 800 Hz, consistent with past PAE literature.
Stimuli up to 7000 Hz were statistically more visible than the DC stimulus across all participants, driven by statistically significant differences for the migraine group and younger participants. Stimuli at 10 000 Hz were not statistically more visible than DC based on sample averages (i.e. the visibility of the PAE was not different from a non-modulating stimulus on average), but five reliable participants did indicate visibility above threshold for the 10 000 Hz. stimulus.
With few exceptions (40% and 55% modulation depths for 120 Hz sine waves) the migraine group had higher sensitivity than the non-migraine group; with the difference becoming somewhat greater at higher frequencies.
Younger participants were more sensitive than older participants. While there was some increase in difference with increasing frequency, this interaction effect was not statistically significant.
Note that while the mean age between the migraine and non-migraine groups was the same, the median age for the non-migraine group was lower – which may offset some difference between the M and NM groups if considered in isolation. These differences are accounted for in the aforementioned logistic regression model.
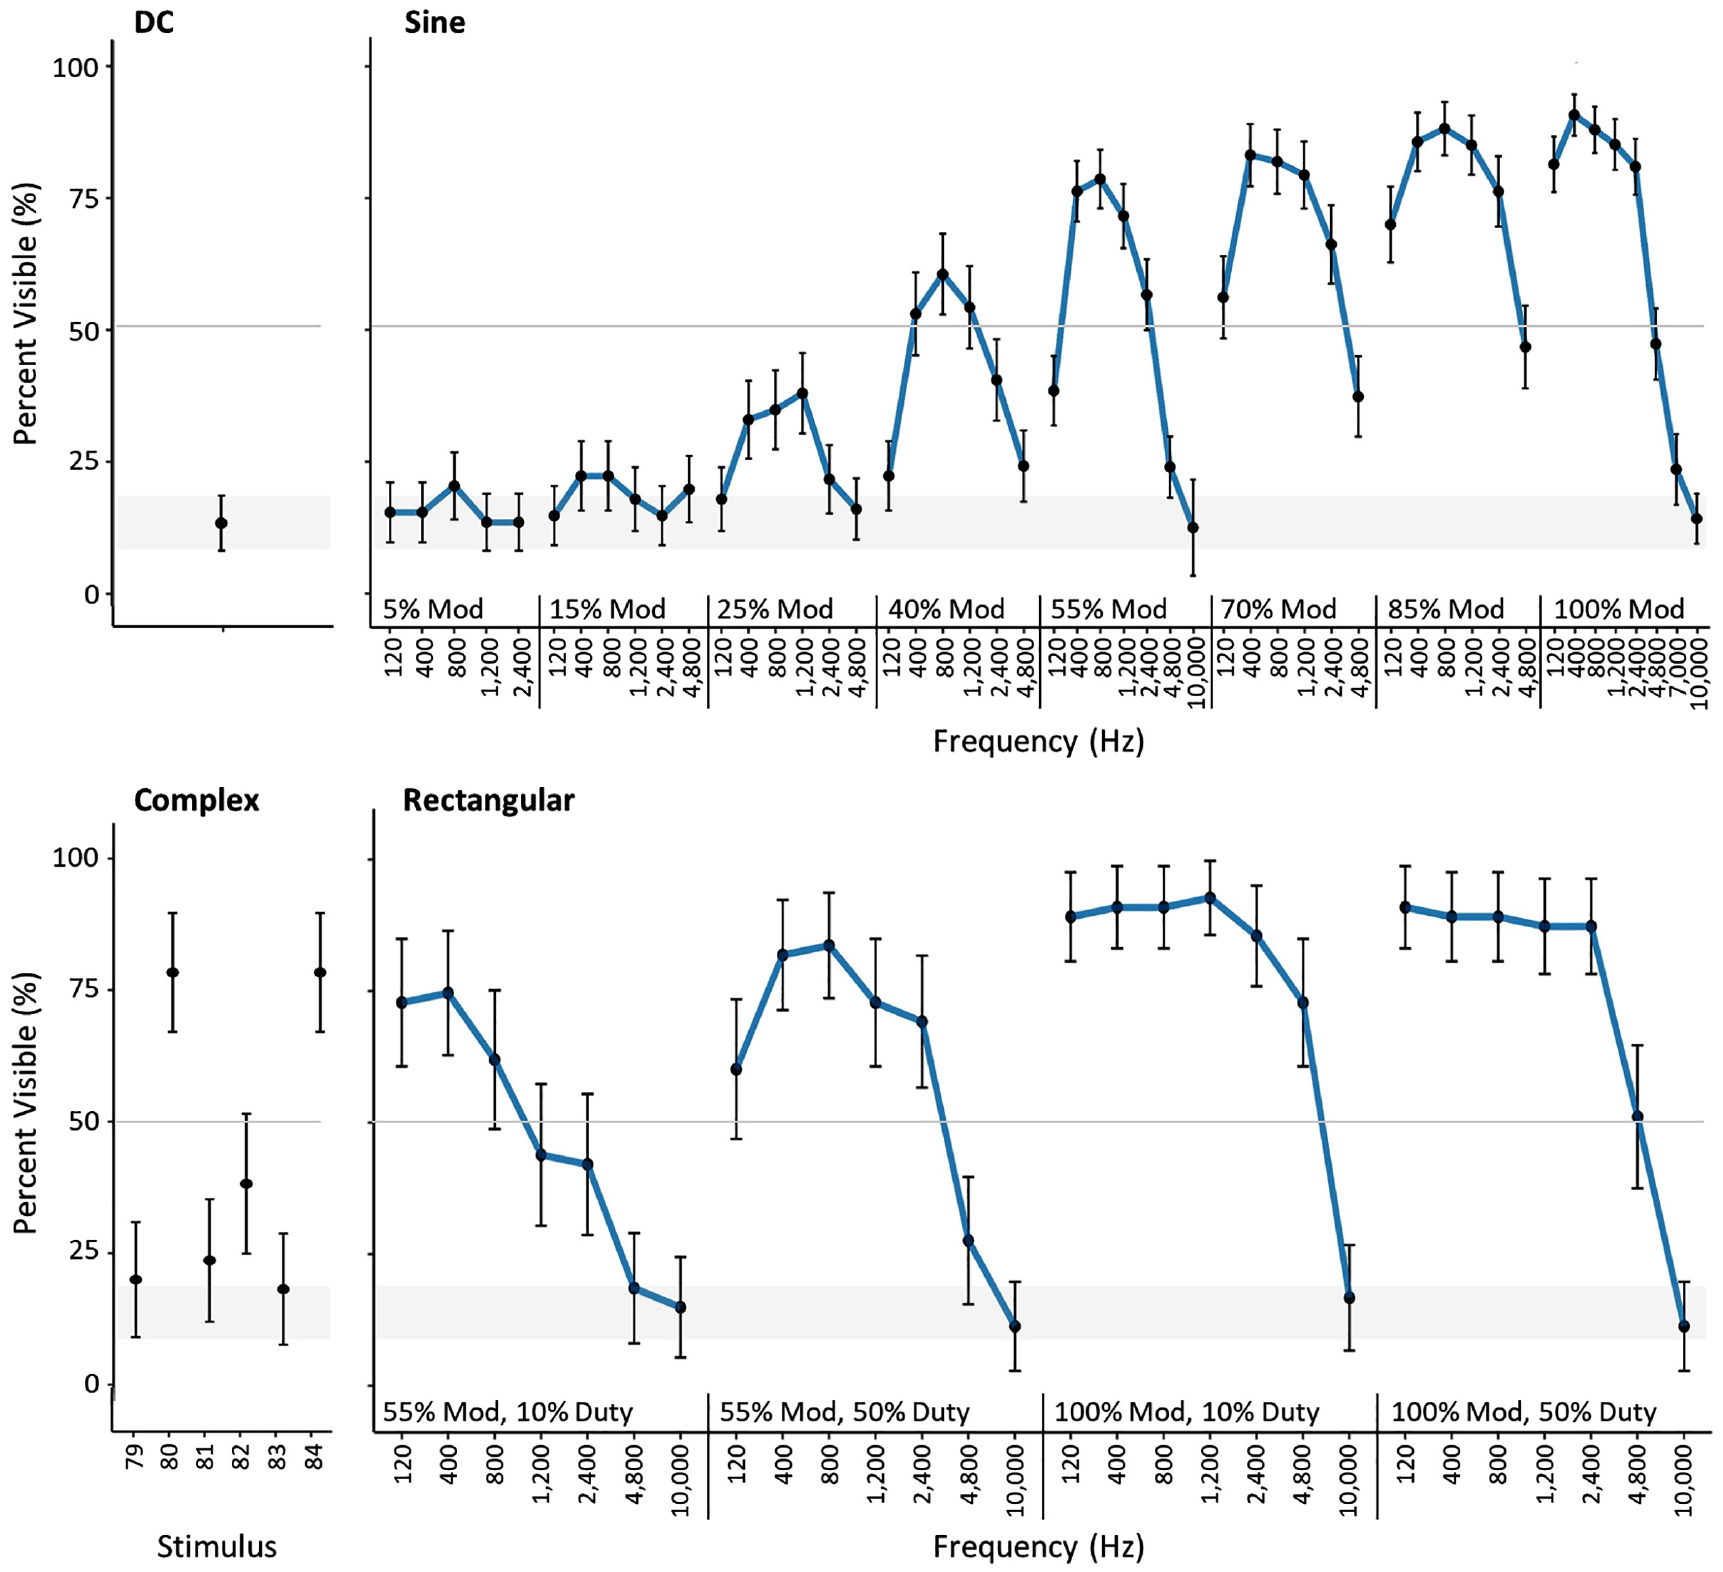
Percent visible and 95% confidence intervals for each unique stimulus for all participants. The grey shaded area shows the 95% confidence interval for the DC waveform
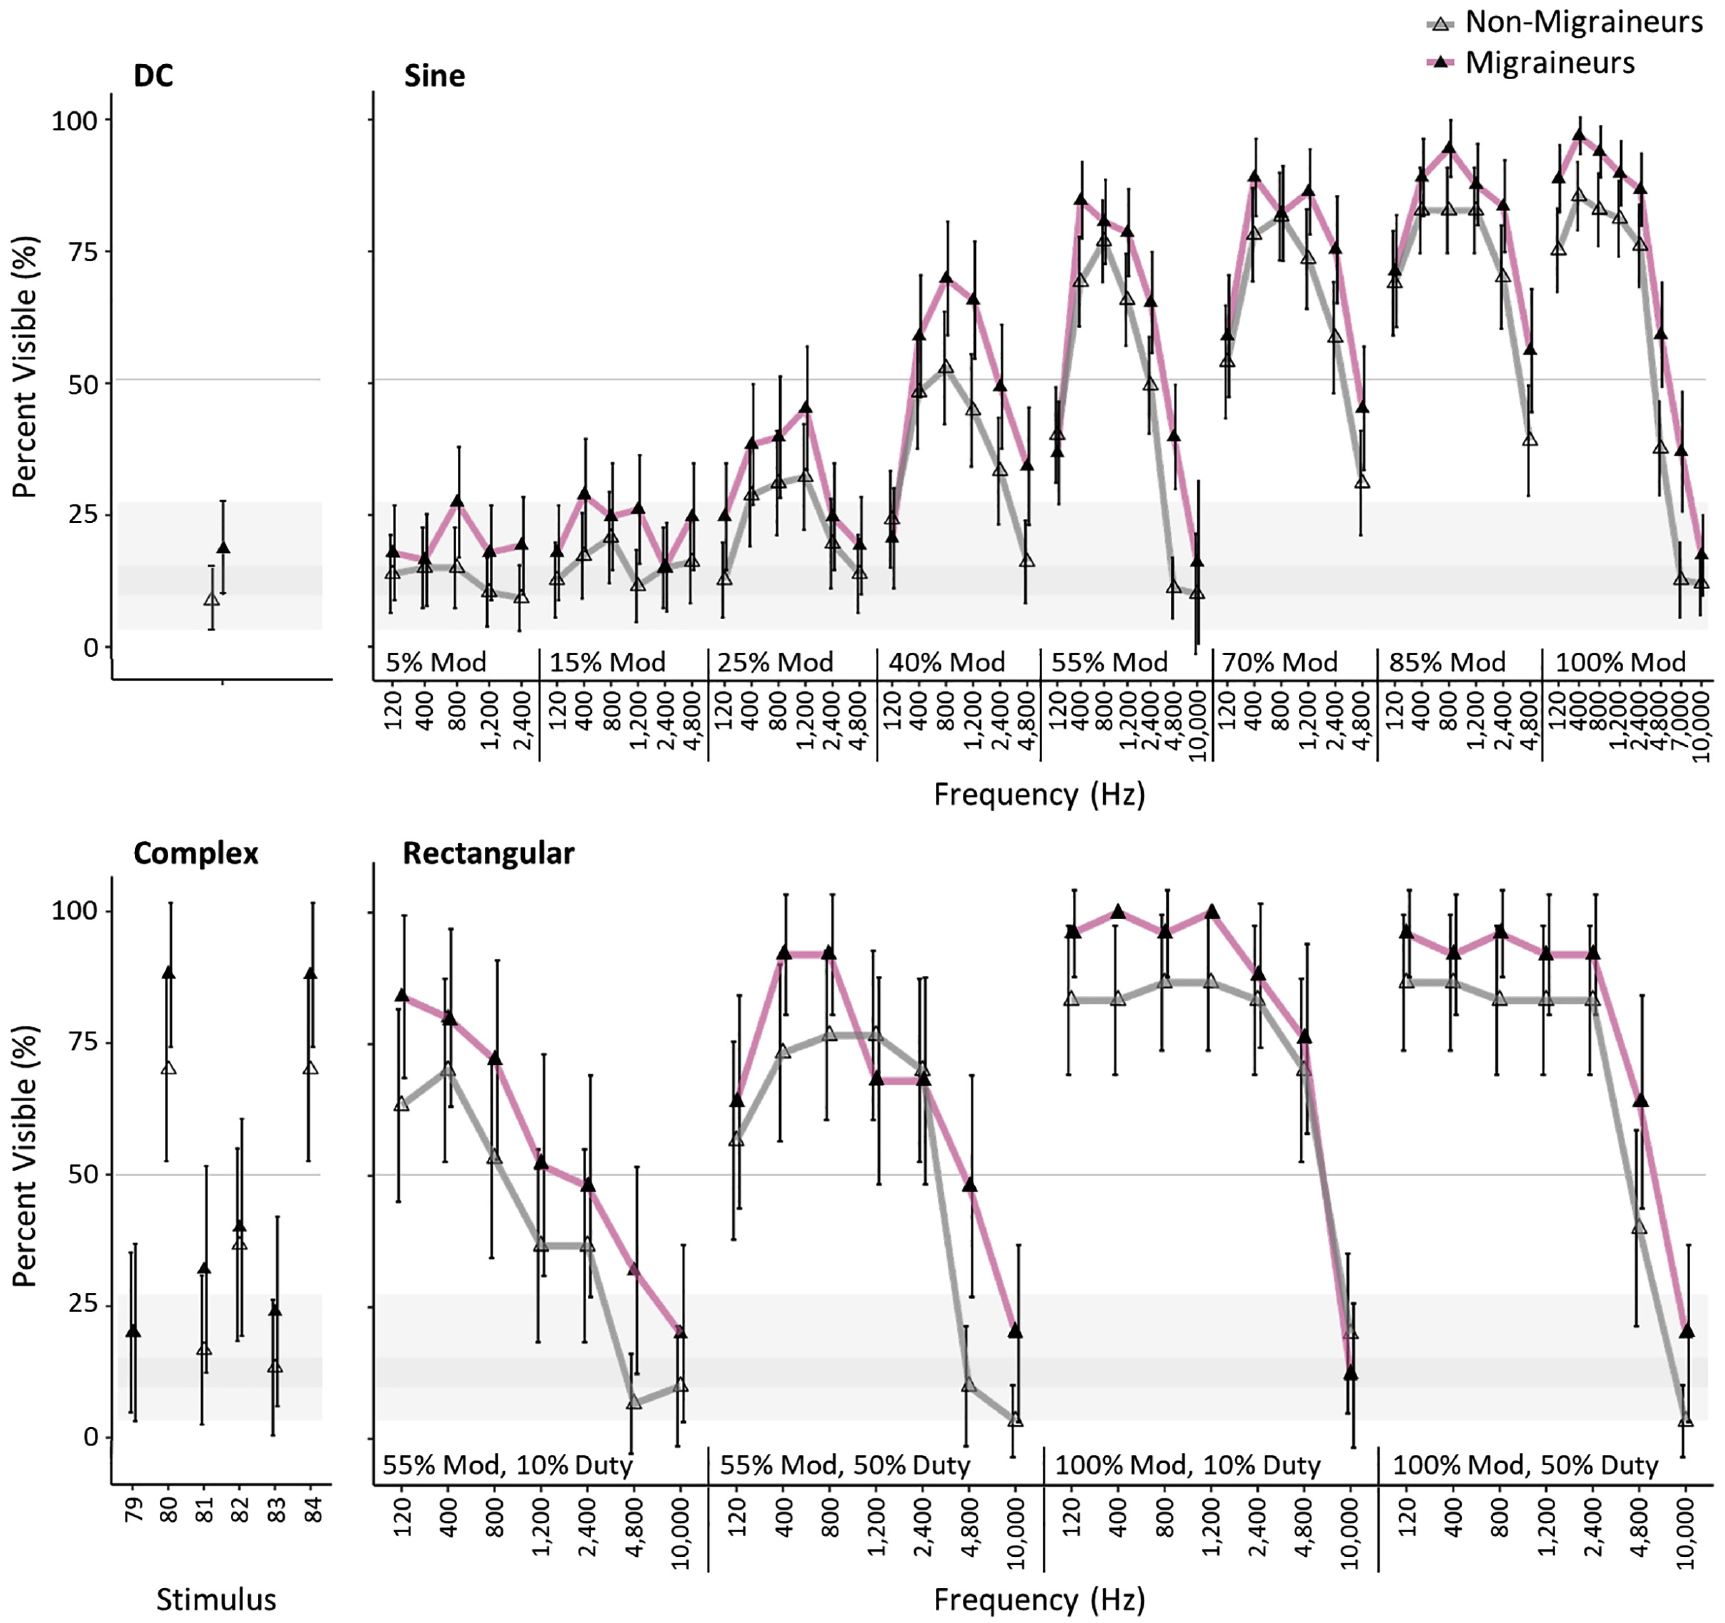
Percent visible and 95% confidence intervals for each unique stimulus for the migraine and non-migraine groups. The grey shaded area shows the 95% confidence interval for the DC waveform
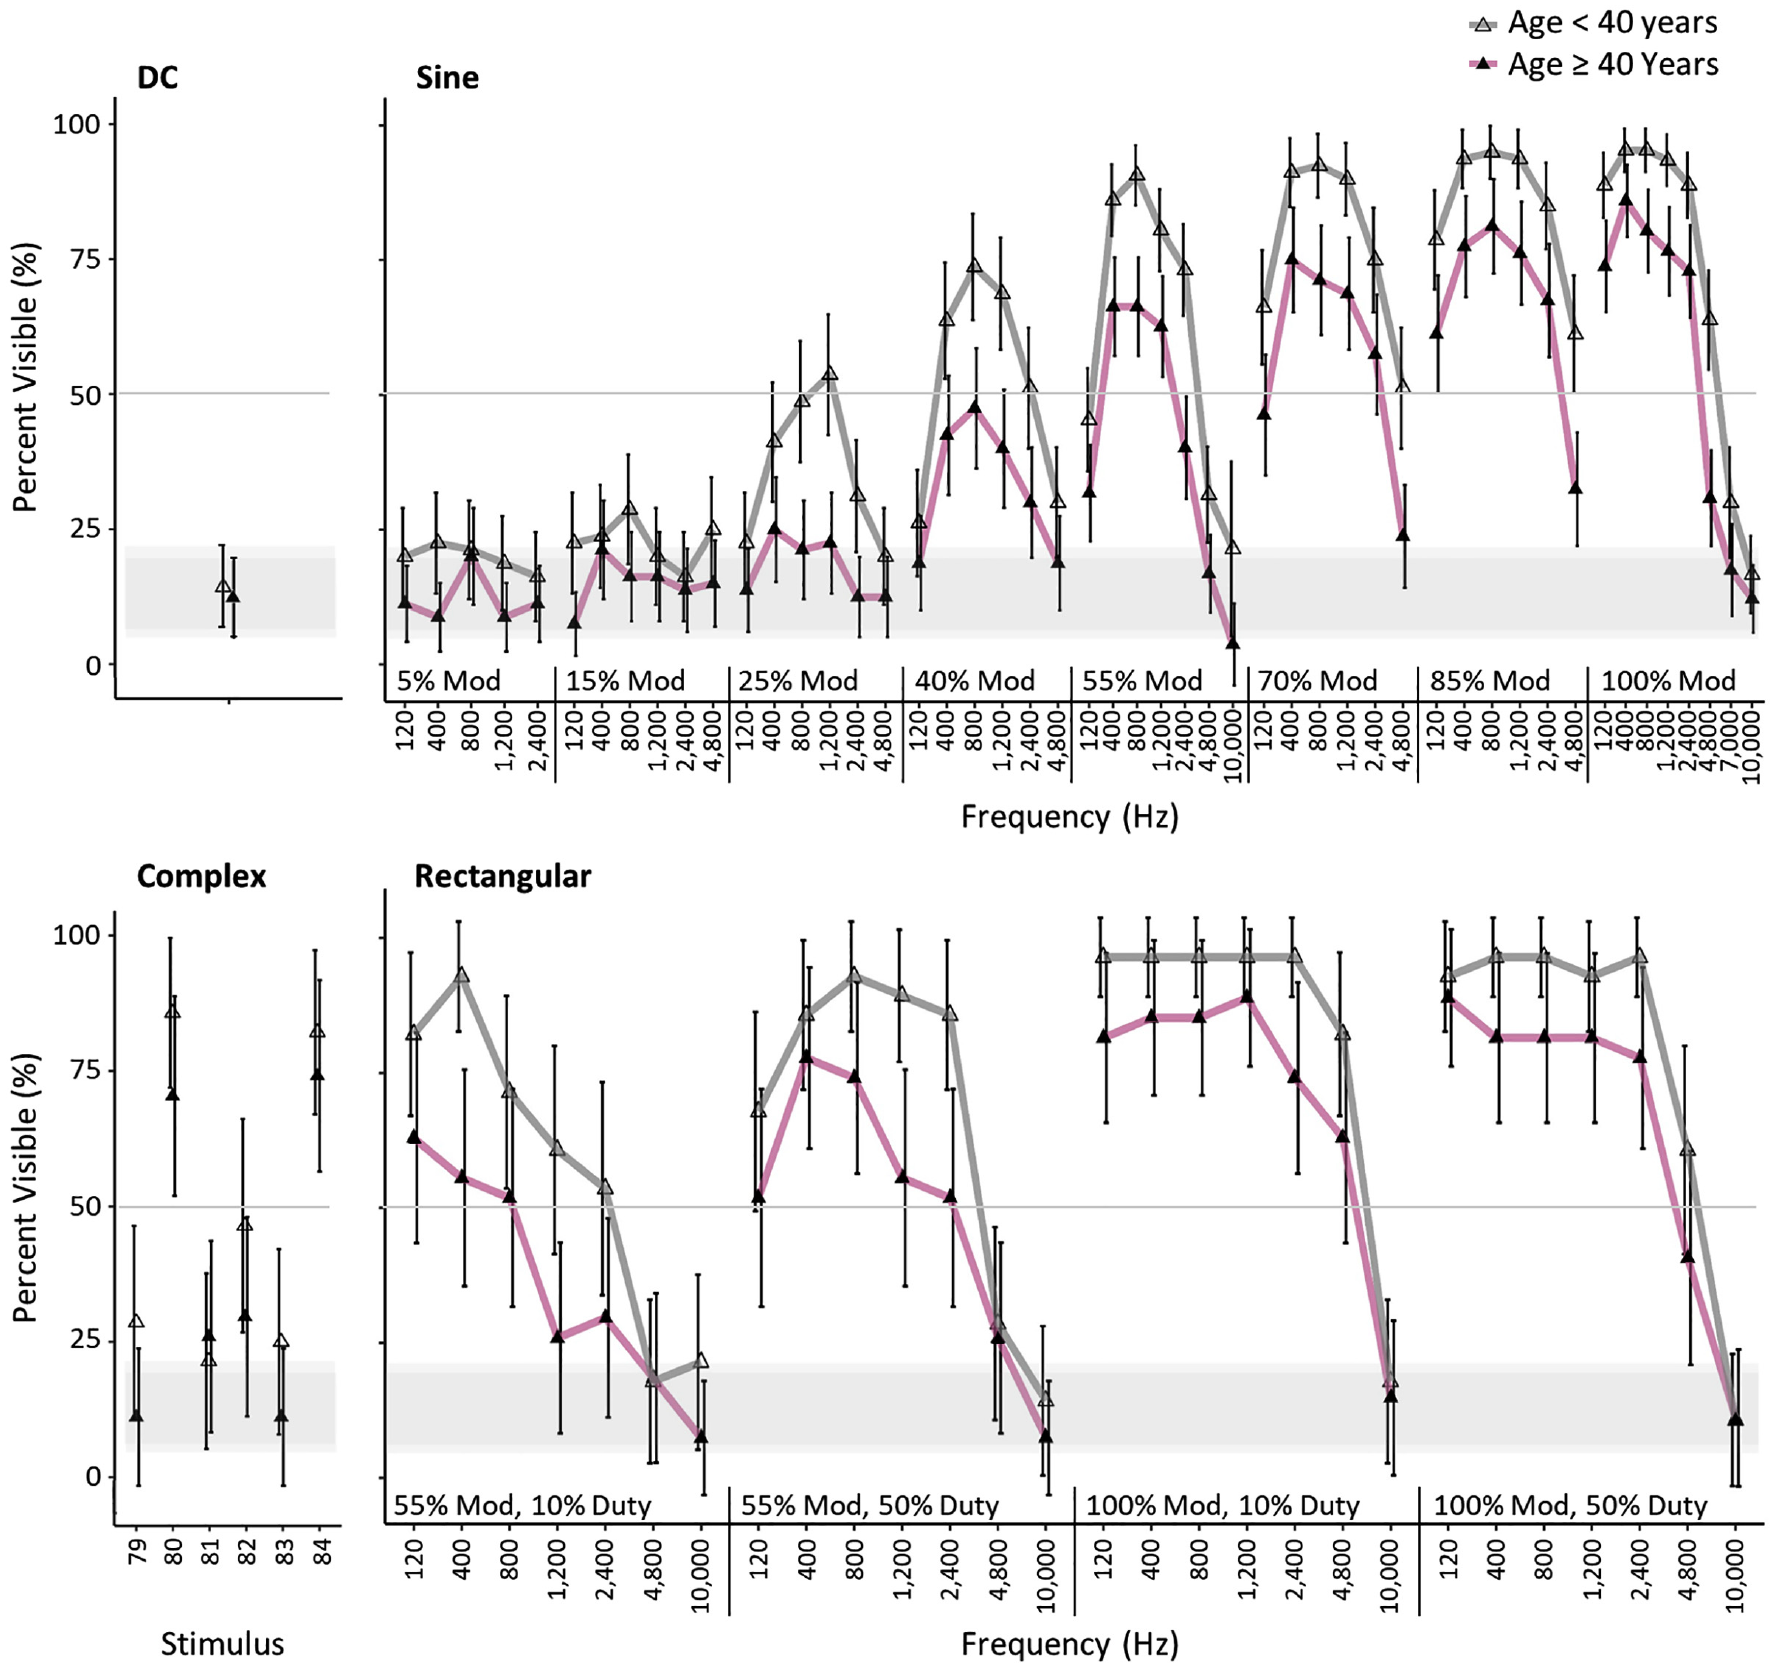
Percent visible and 95% confidence intervals for each unique stimulus for the older and younger groups. The grey shaded area shows the 95% confidence interval for the DC waveform
3.4 Threshold modulation
Figure 9 shows the threshold modulation depth for sine-shaped stimuli, which were evaluated repeatedly and operationalized for this purpose. To determine the threshold modulation depth (i.e. the point at which a stimulus would be predicted to be recorded as visible for half of the presentations across the group of interest), a fourth-order polynomial was fit to the mean visibility response at each frequency for the discrete modulation depths of each stimulus. To reiterate, the percent visible responses for each stimulus was averaged over the observers in the group (e.g. all observers, migraine group, etc.), then a function was fit for each frequency level to model the effect of modulation depth. The fourth-order polynomial allows for variability in the eight data points compared to an interpolating polynomial (which for most frequencies would be an eighth-order function in this dataset). Finally, an inverse log-normal function was fit to the threshold data for each subgroup, following the approach of Tan et al. 10 The R2 for each fitted function exceeded 0.97, except for the all group which was 0.92.
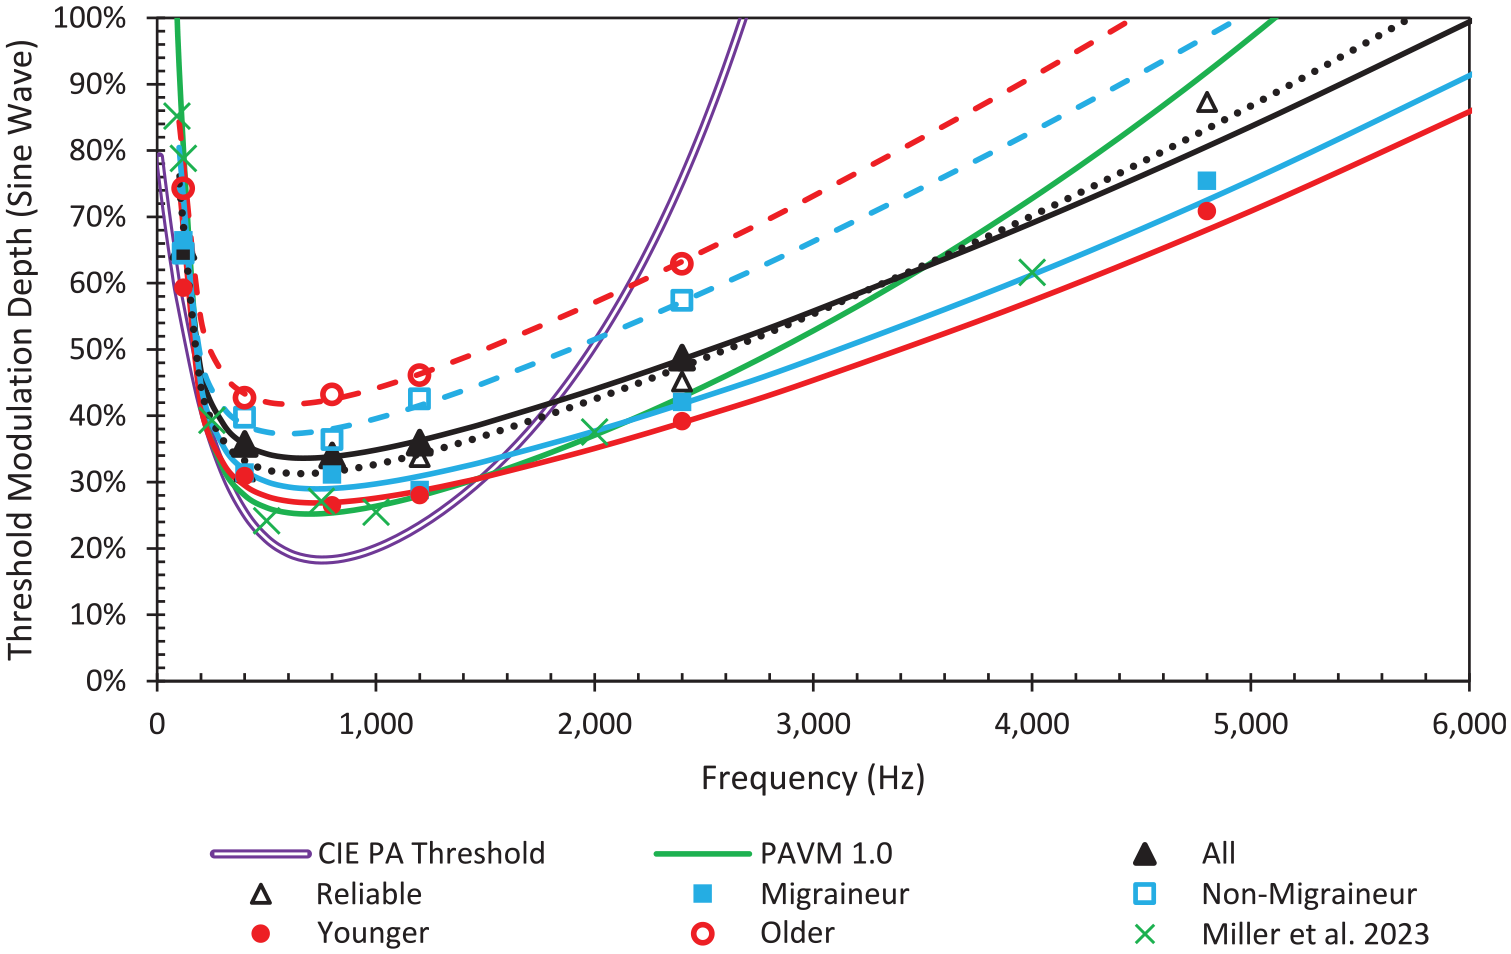
Threshold modulation depth (sine waves) for all participants and the four groups compared to functions generated from past data (CIE 249:2022 and Tan et al. 10 )
Figure 9 does not account for differences in age distribution within the M and NM groups. Likewise, it does not account for difference in migraine status within the age groups (14 of 28 older participants were among the migraine group, whereas 11 of 27 younger participants were migraine group members). Also shown in Figure 9 are previously developed threshold modulation functions, from CIE 249 and PAVM. The CIE 249 function was developed using data up to 1200 Hz, and the PAVM threshold function was developed using data up to 2000 Hz. 10 With additional high-frequency data, relative sensitivity at higher frequencies increases.
Visibility extends to much higher frequencies than the function from CIE 249 suggests – CIE 249 suggests threshold visibility at 76% modulation for 2400 Hz sine waves, but threshold visibility was 49% in this experiment. Data from this experiment are much more closely aligned with the threshold modulation function used in PAVM, although visibility at higher frequencies was still relatively higher than predicted by PAVM. From the model for this experiment, threshold visibility would saturate at 100% modulation at approximately 6000 Hz. However, the all-participants function for 4800 Hz reached 49% visible, and the 4800 Hz threshold was at 87% modulation for reliable observers. Notably, threshold would occur at 2700 Hz using the CIE model and 5100 Hz using the PAVM model.
Aside from relative differences, both the CIE 249 function and PAVM function predict lower absolute threshold modulation. Likewise, another recent experiment by Kong et al. 7 demonstrated lower threshold modulation depths at the peak. Importantly, absolute visibility thresholds are dependent on application characteristics (e.g. background/contrast, ambient illumination level, stimulus size, stimulus shape, size of scanning angle) and individual characteristics (e.g. saccade speed, personal sensitivity, etc.). Experimental methods may also lead to different results.
3.5 Rectangular versus sine waves visibility ratio
Figure 10 demonstrates the ratio of rectangular wave to sine wave visibility and annoyingness for equal frequencies, for all participants. (Trends persisted through all groups.) The visibility chart utilizes the binary response (i.e. percent of people at or above 50% visible responses = 1, less than 50% visible responses = 0) because the rectangular waves were not evaluated repeatedly. Each modulation depth (100% and 55%) that was repeated for both shapes is shown for both 50% duty cycle and 10% duty cycle for the rectangular waves. Values below 1 indicate the sine wave was more visible or more annoying than the rectangular wave of the same frequency and modulation depth, whereas values above 1 indicate the sine wave was less visible or less annoying. The overall average ratio for visibility was 1.0, and the average ratio for annoyingness was 1.3. If limited to only 50% duty cycle, which is most like sine waves, the ratios were 1.0 and 1.2, respectively.
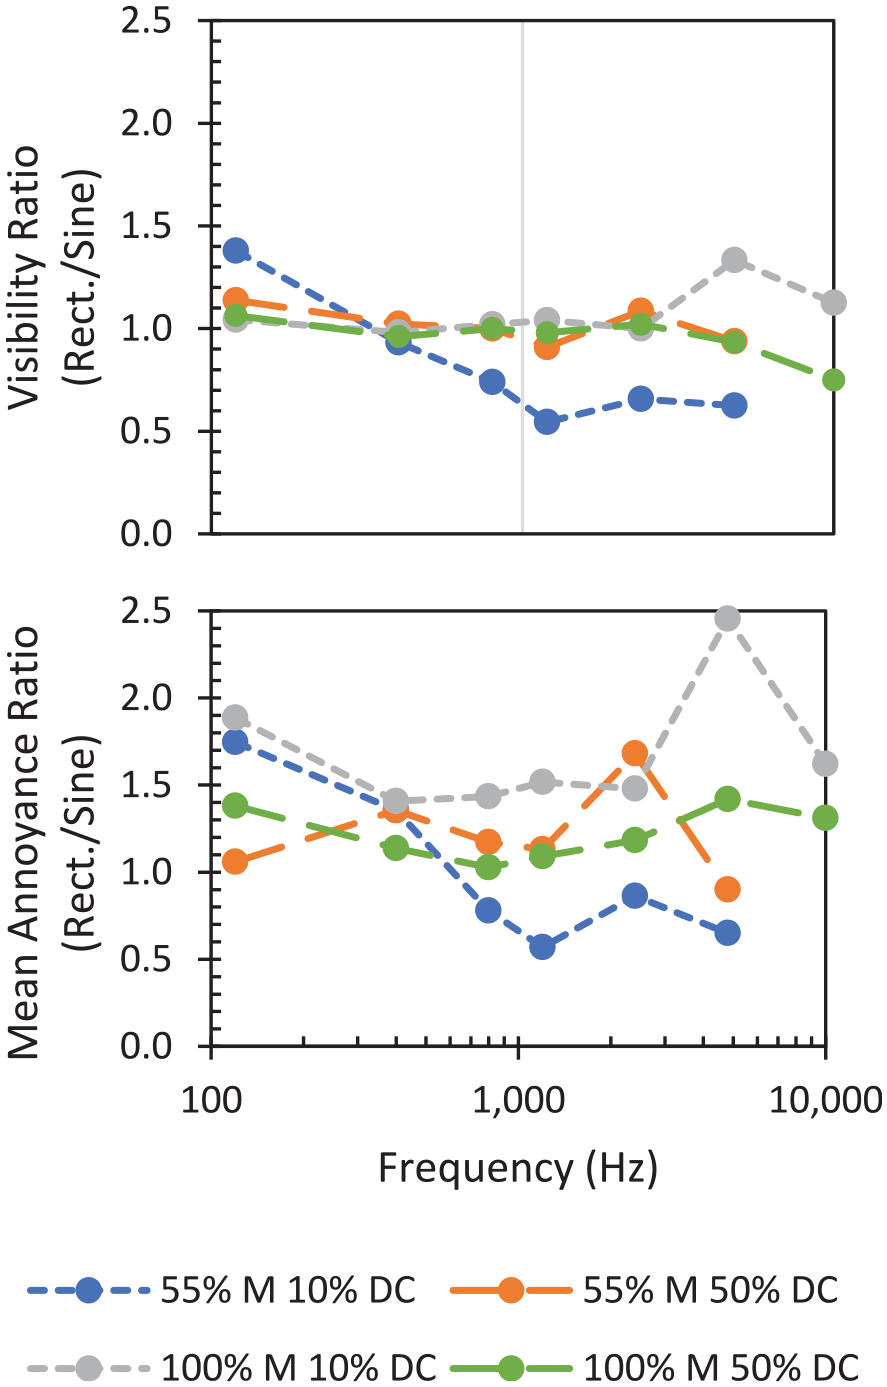
Comparison of the visibility and annoyance of rectangular waves to sine waves
Generally, the visibility ratio for sine waves compared to 50% duty cycle rectangular waves was lower in this experiment than prior experiments,19,31 indicating relatively higher visibility for sine waves compared to equivalent rectangular waves, with near equal visibility in many scenarios. Several factors may contribute to this finding. First is separating out simple visibility from annoyance: if rating visibility on a scale, there may be a tendency to equate greater annoyance with greater visibility. In the 400 Hz to 1200 Hz range, all 100% modulation stimuli, rectangular and sine, were visible to almost all people – the only people who did not report them as visible did not report any stimuli as visible. This may create ‘compression’ in the visibility responses for the rectangular waves. Furthermore, the annoyance ratio – generated from rating scale data – was closer to the anticipated value of 4/π = 1.27. Secondly, the participants viewed more sine waves than rectangular waves, and the instructions and anchoring included examples of the ‘sausage’ patterns that result from sine waves, which may have helped participants recognize their visibility.
Similar to prior work, 9 the rectangular:sine ratio was greater at 120 Hz. We can hypothesize that the sharpness of the rectangular phantom array images and wider gap is more easily reconciled to the true position (i.e. visually processed as a single light source without phantom repetitions), but this requires further inquiry. Additionally, there was reduced consistency at high frequencies, which may result from the overall reduction in visibility at these conditions.
One other result of note is that as predicted by the PAVM metric, rectangular waves with 55% modulation and 10% duty cycle were less visible than rectangular waves with 55% modulation and 50% duty cycle, or than sine waves. Contrast this with the visibility of 100% modulation rectangular TLM, where 10% duty cycles were more visible than 50% duty cycle waveforms. We believe this is a combination of less high-frequency Fourier content in the 55% modulation waveforms, and the higher DC component. Effectively, it is like beads on a necklace being easier to see on a thin thread than on a very thick cord. With an increasing DC component, the short duration bright spot becomes harder to detect in an otherwise smooth streak of light. Notably, rectangular waves with 10% duty cycle and 100% modulation are more visible, as the light is completely off during the remainder of the cycle.
3.6 Annoyance
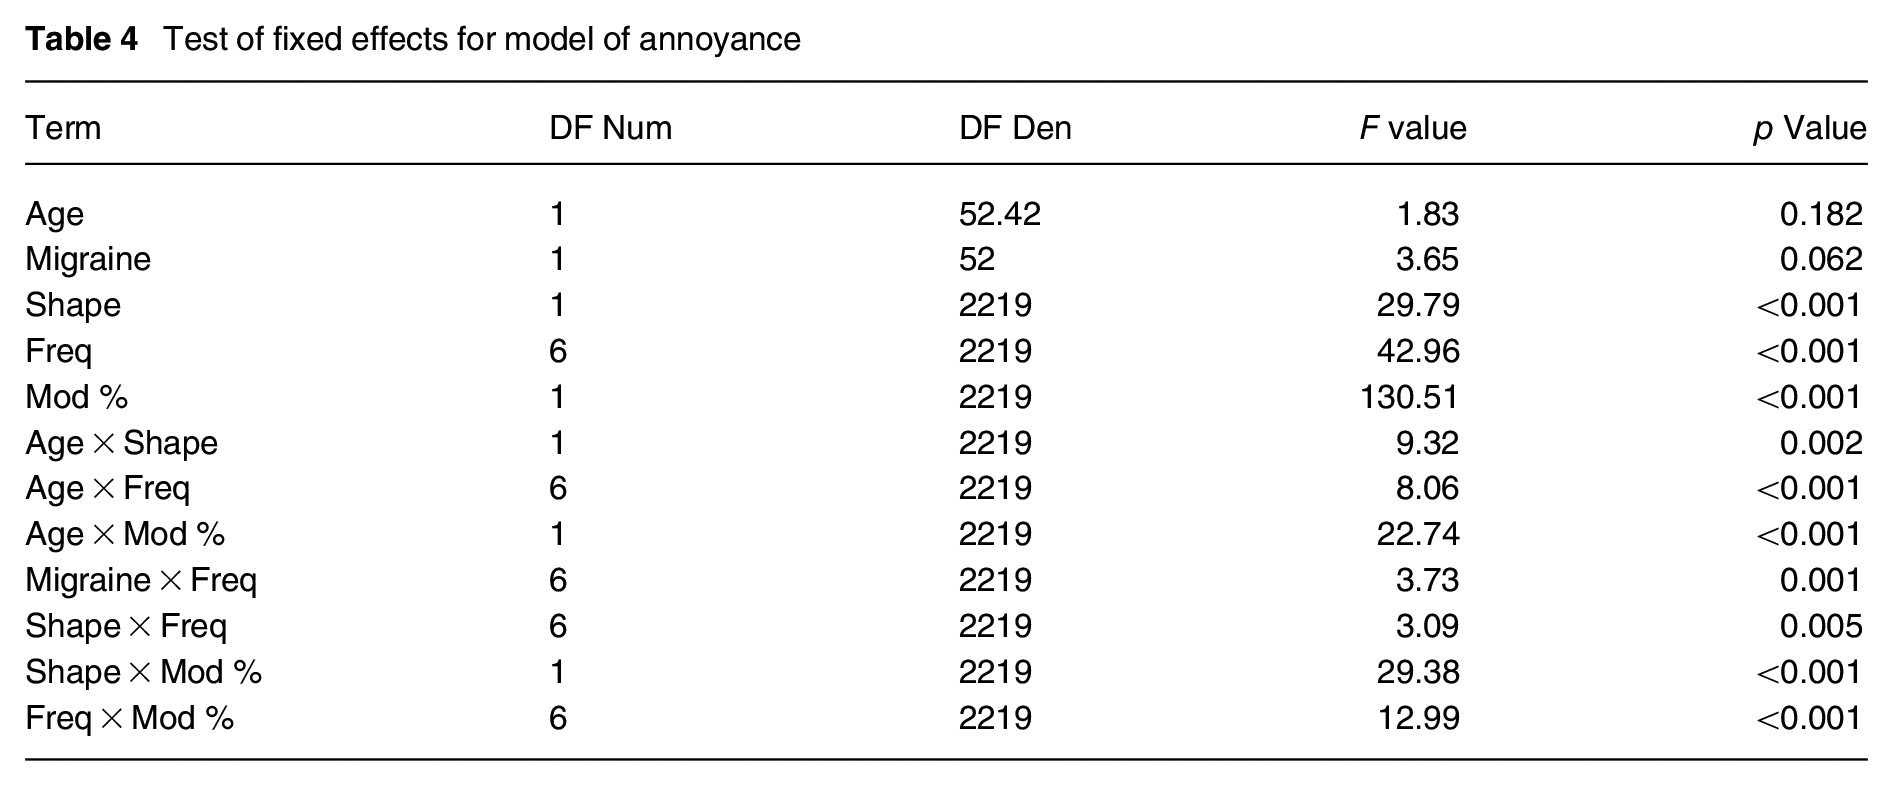
Figure 11 demonstrates the strong exponential relationship between percent of visible responses (across all observations of the stimuli) and mean annoyance rating. For all participants, the coefficient of determination (R2) was 0.91. It was similarly high for the migraine group (R2 = 0.86), the non-migraine group (R2 = 0.91) and older (R2 = 0.88) participants, while being lower (R2 = 0.53) for younger participants. The younger participants had more varied annoyance ratings (from 1.4 to 5.0) for stimuli that were visible more than 80% of the time compared to the other groups. In general, the younger participants had slightly lower annoyance ratings at equal visibility, with older participants being the most annoyed at a given visibility level – although there were statistically significant interaction effects. Table 4 shows the results for a linear mixed model of annoyance responses for the rectangular and sine waveforms. Although the main effects of age (continuous covariate) and migraine status were not statistically significant, the presence of significant interaction terms for both indicate they should not be interpreted in isolation.
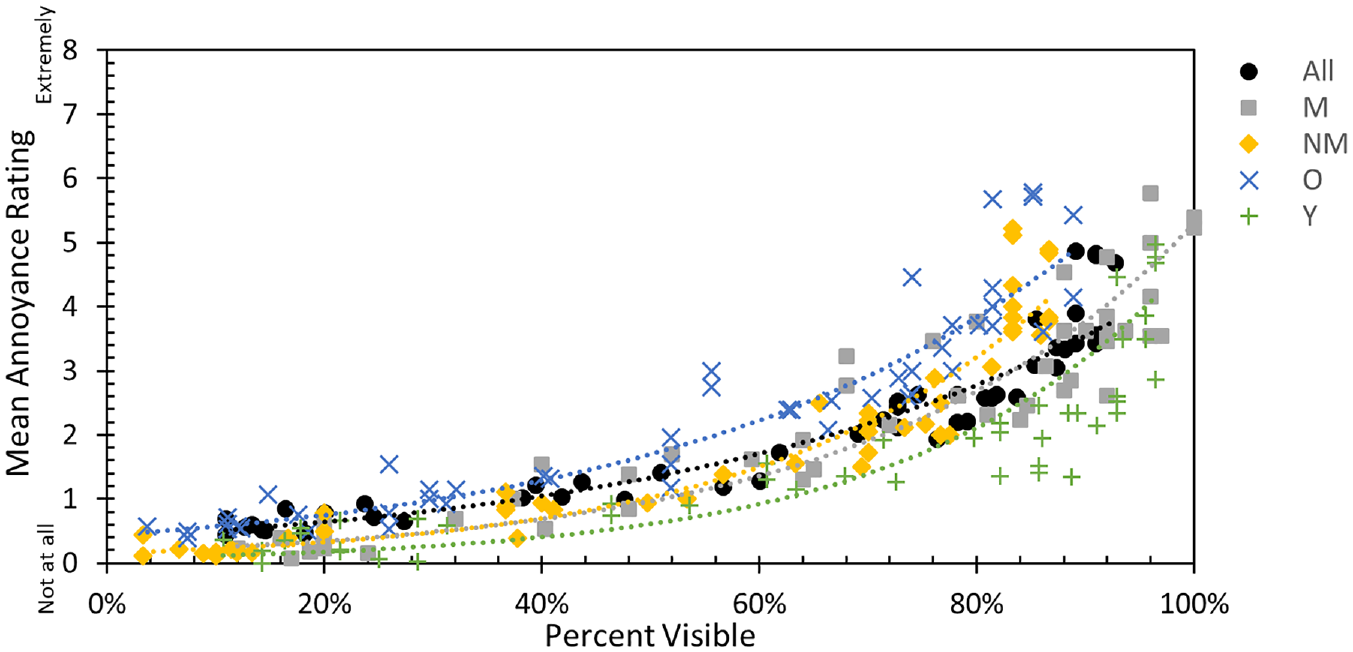
Mean annoyance rating for each stimulus vs. the percent of visible responses among participants in each group (across all evaluations of the stimulus)
Test of fixed effects for model of annoyance
Overall, the stimuli rated more annoying were rectangular waves with 100% modulation, which mimic the common dimming technique of PWM (Figure 12). The six stimuli with the highest annoying ratings were 100% modulation, 10% duty cycle rectangular waves. The 13 stimuli with the highest annoying ratings were all 100% modulation (10 rectangular, 3 sine).
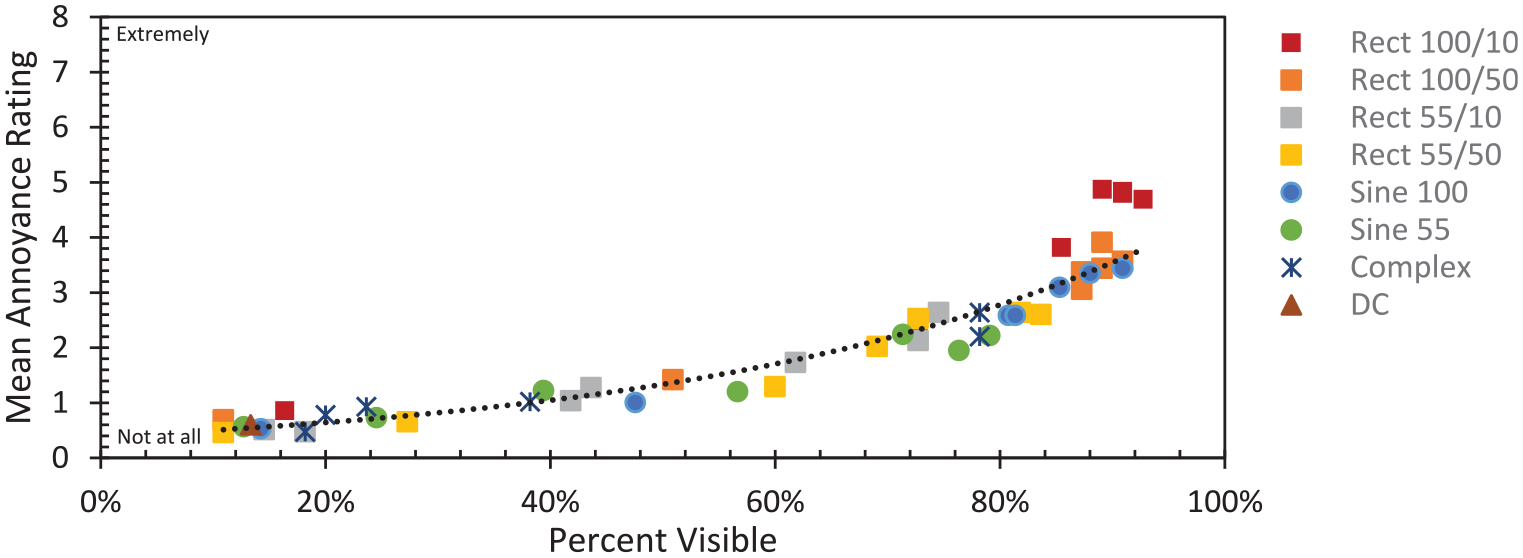
Mean annoyance rating vs. percent visible (all participants) for different types of stimuli
3.7 PAVM performance
Figures 13 and 14 demonstrate the relationship between PAVM and proportion visible (left) and mean annoyingness (right) for different types of stimuli (top) or groups of participants (bottom). While some of the stimuli were like those used to develop PAVM, many extended beyond those in terms of modulation depth, frequency, shape or complexity. As with the relationship between PAVM and the underlying data used in its development, the relationships between the current visibility and annoyingness data are nonlinear, due primarily to major differences in PAVM for very high visibility/annoying stimuli. However, these stimuli would not be recommended for use in architectural environments, as their PAVM values substantially exceed TM-39’s maximum recommended criterion (i.e. minimally acceptable) of 1.6. Similarly, PAVM values less than 0.4 (the most restrictive recommended performance criterion) do not substantially differ in visibility – and would be essentially equivalent to DC, indicating an effective criterion. Between these limits, the relationship between PAVM and visibility is approximately linear (R2 = 0.74) for all participants. It was lower for annoyance (R2 = 0.54), with some complex and 100% modulation sine stimuli being rated as more annoying than otherwise predicted by PAVM. Overall, PAVM and its associated recommended thresholds (1.6, 0.9, 0.4) were effective at differentiating the wide range of stimuli, including complex stimuli.
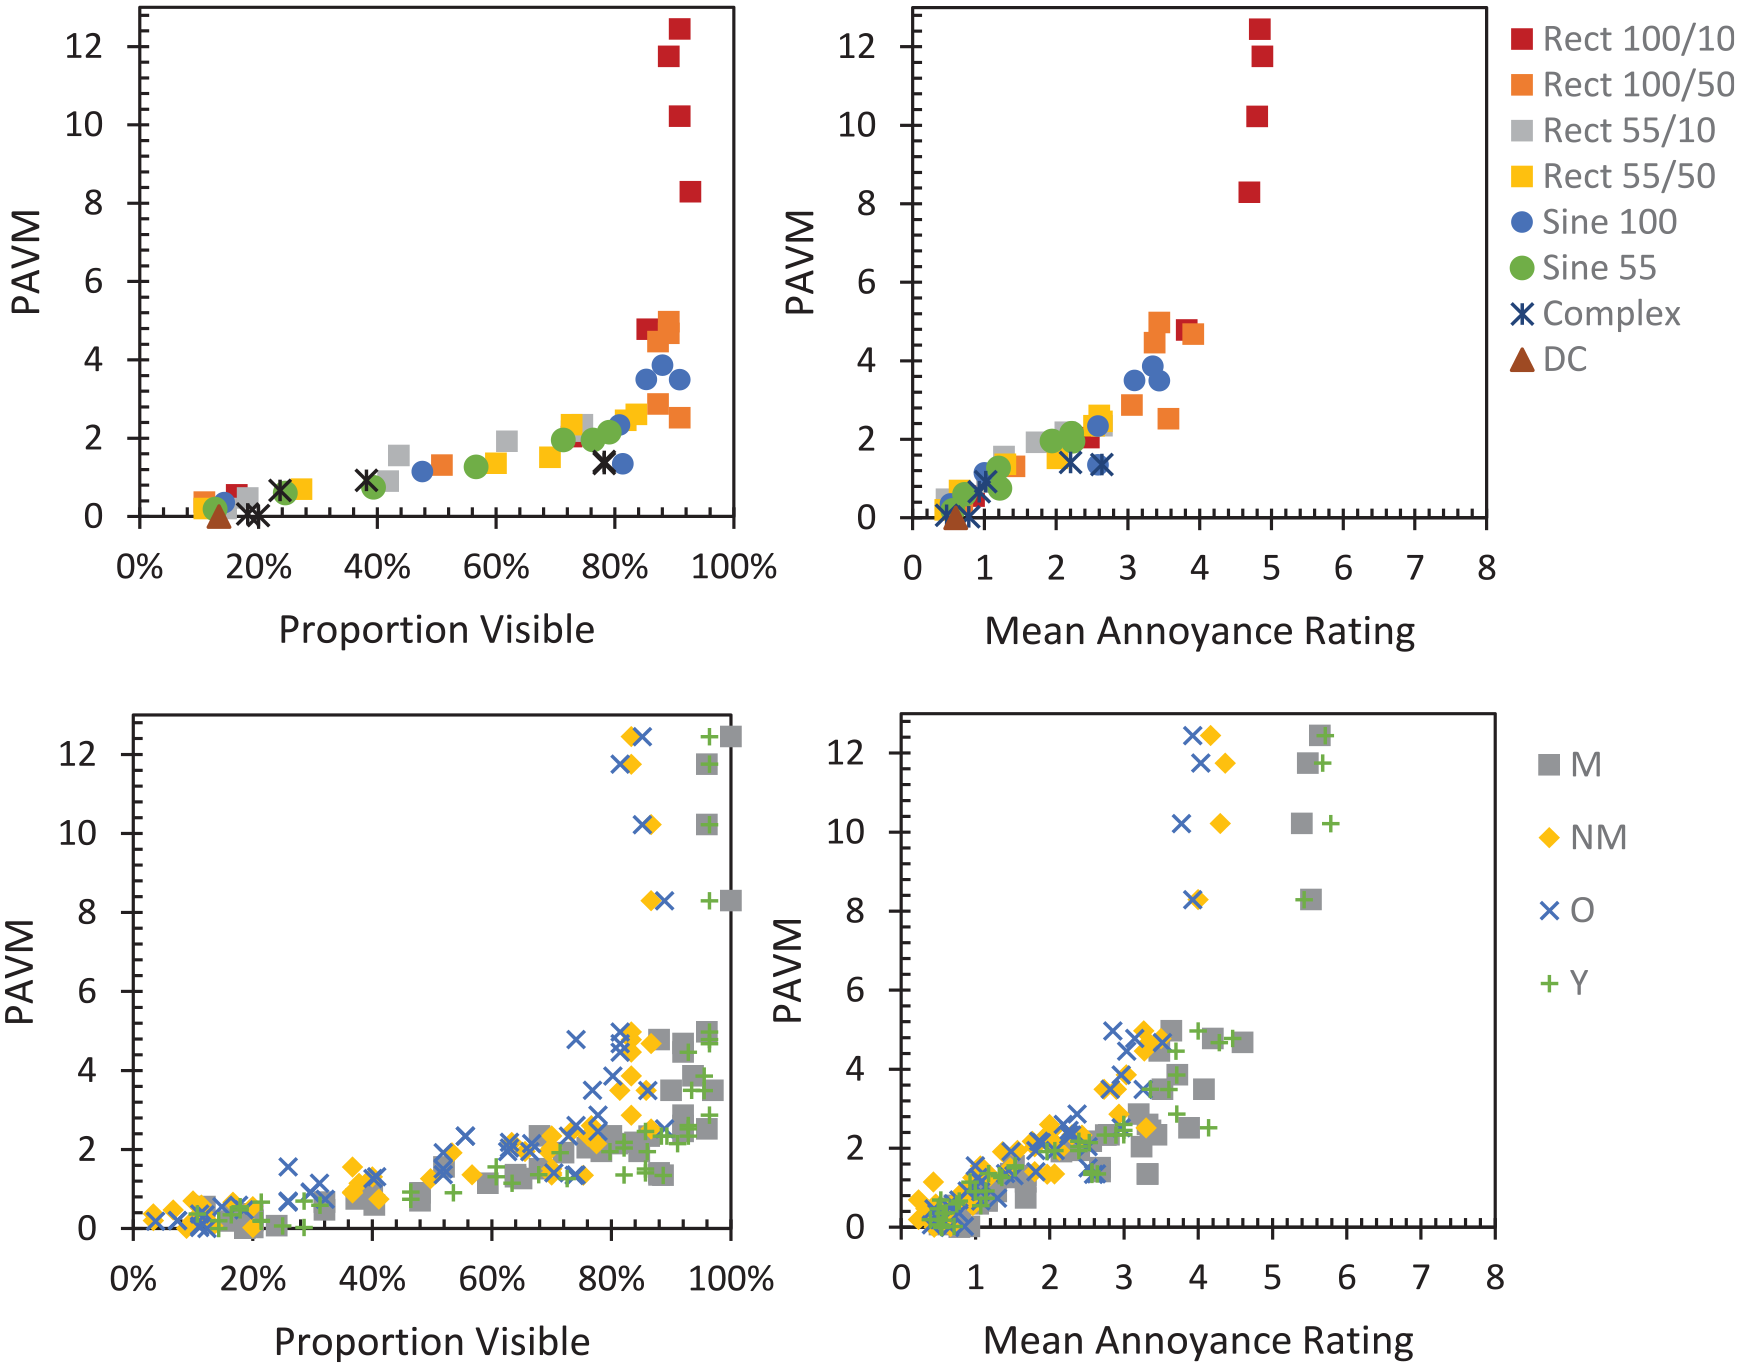
Overall relationship between PAVM and visibility (left) and annoyance (right)
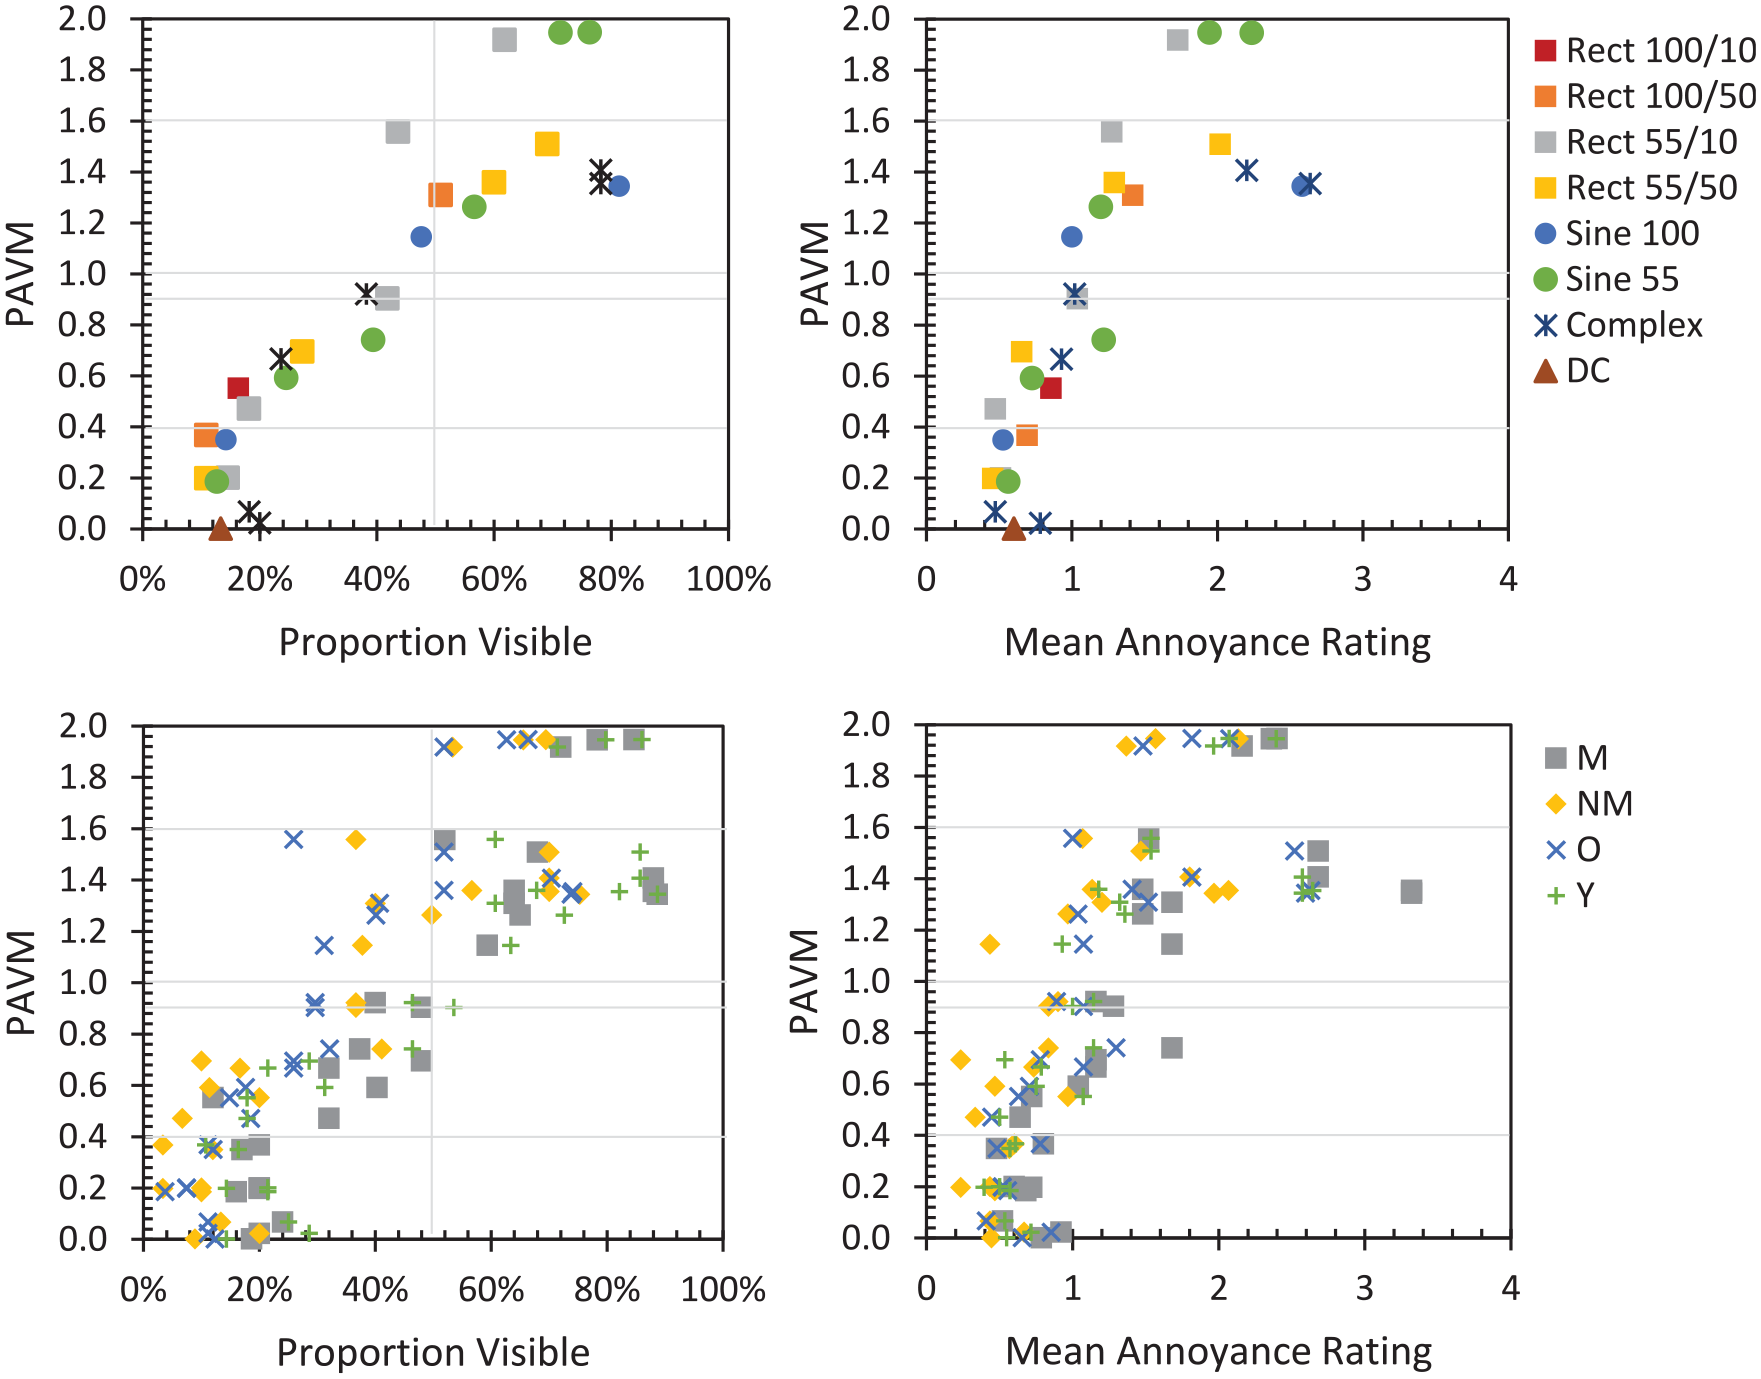
Relationship between PAVM and visibility (left) and annoyance (right) for PAVM values of interest
Stimuli visible in approximately 50% of evaluations had PAVM values slightly above 1, which is the target value used in the development of the metric. Thus, in this application, PAVM values slightly over predicted the visibility of the near-threshold stimuli. Many factors can contribute to variation in the relationship between PAVM and visibility, including ambient lighting conditions, background luminance, adaptation level and saccade speed as well as stimulus size, colour and luminance contrast. For this reason, we warn against globally associating a value of PAVM (or other metrics related to TLM) with the percentage of people that will find it visible. Likewise, it cannot predict any individual’s ability to see the phantom array, as there is extreme variation in sensitivity to the PAE.
3.8 Variation in sensitivity
As in any psychophysical experiment, there are differences in participants’ willingness to say they detected a stimulus, even if they could be determined to be equally visible. However, it is also accepted that there is substantial person-to-person variation in the ability to detect the PAE. The cause of this difference is currently unknown, although saccade speed may play a factor in detecting the PAE at higher frequencies. 6 Ability to detect the PAE has also been linked to pattern glare sensitivity. 14
As with prior data for visibility of the PAE, there is a wide range of sensitivity across people. While six people saw less than 10% of stimuli above threshold (three of them saw none above threshold and two never saw the PAE), seven people saw at least 75% of the unique stimuli (Figure 15), four of which also did not identify the DC waveforms as visible more than one of three times (i.e. visibility was below threshold). A small number of reliable observers were able to detect the PAE above threshold even at only 5% modulation. For example, the visibility threshold of participant 53 – a 31-year-old with migraine – would be less than 5% modulation at 400 Hz and 800 Hz, and between 5% and 15% modulation at 1200 Hz, 2400 Hz and 4800 Hz. Figure 16 shows the percent of visible stimuli for each participant at each frequency, for the sine-shaped stimuli with modulation depths between 15% and 100%. While this further illustrates the disparity in ability to detect the PAE, it shows that the frequency of peak sensitivity is less variable and almost all participants exhibited a nominal peak in sensitivity in the middle frequencies. For 52 of the 55 participants, the peak was between 400 Hz, 800 Hz or 1200 Hz. The median was 800 Hz, the mode was 800 Hz and the mean was 831 Hz. Note that the resolution of the frequency range was not designed for detecting the true average peak sensitivity. Two participants had peak sensitivity at 120 Hz, one at 4800 Hz, and one had a secondary peak at 2400 Hz (in addition to 400 Hz). As previously noted, the interaction of migraine status and frequency was statistically significant in the model of PAE visibility, with the peak shifting higher for the migraine groups. For practical purposes, the variation in sensitivity to the PAE is largely a question of waveform amplitude, which makes using a single threshold modulation function feasible.
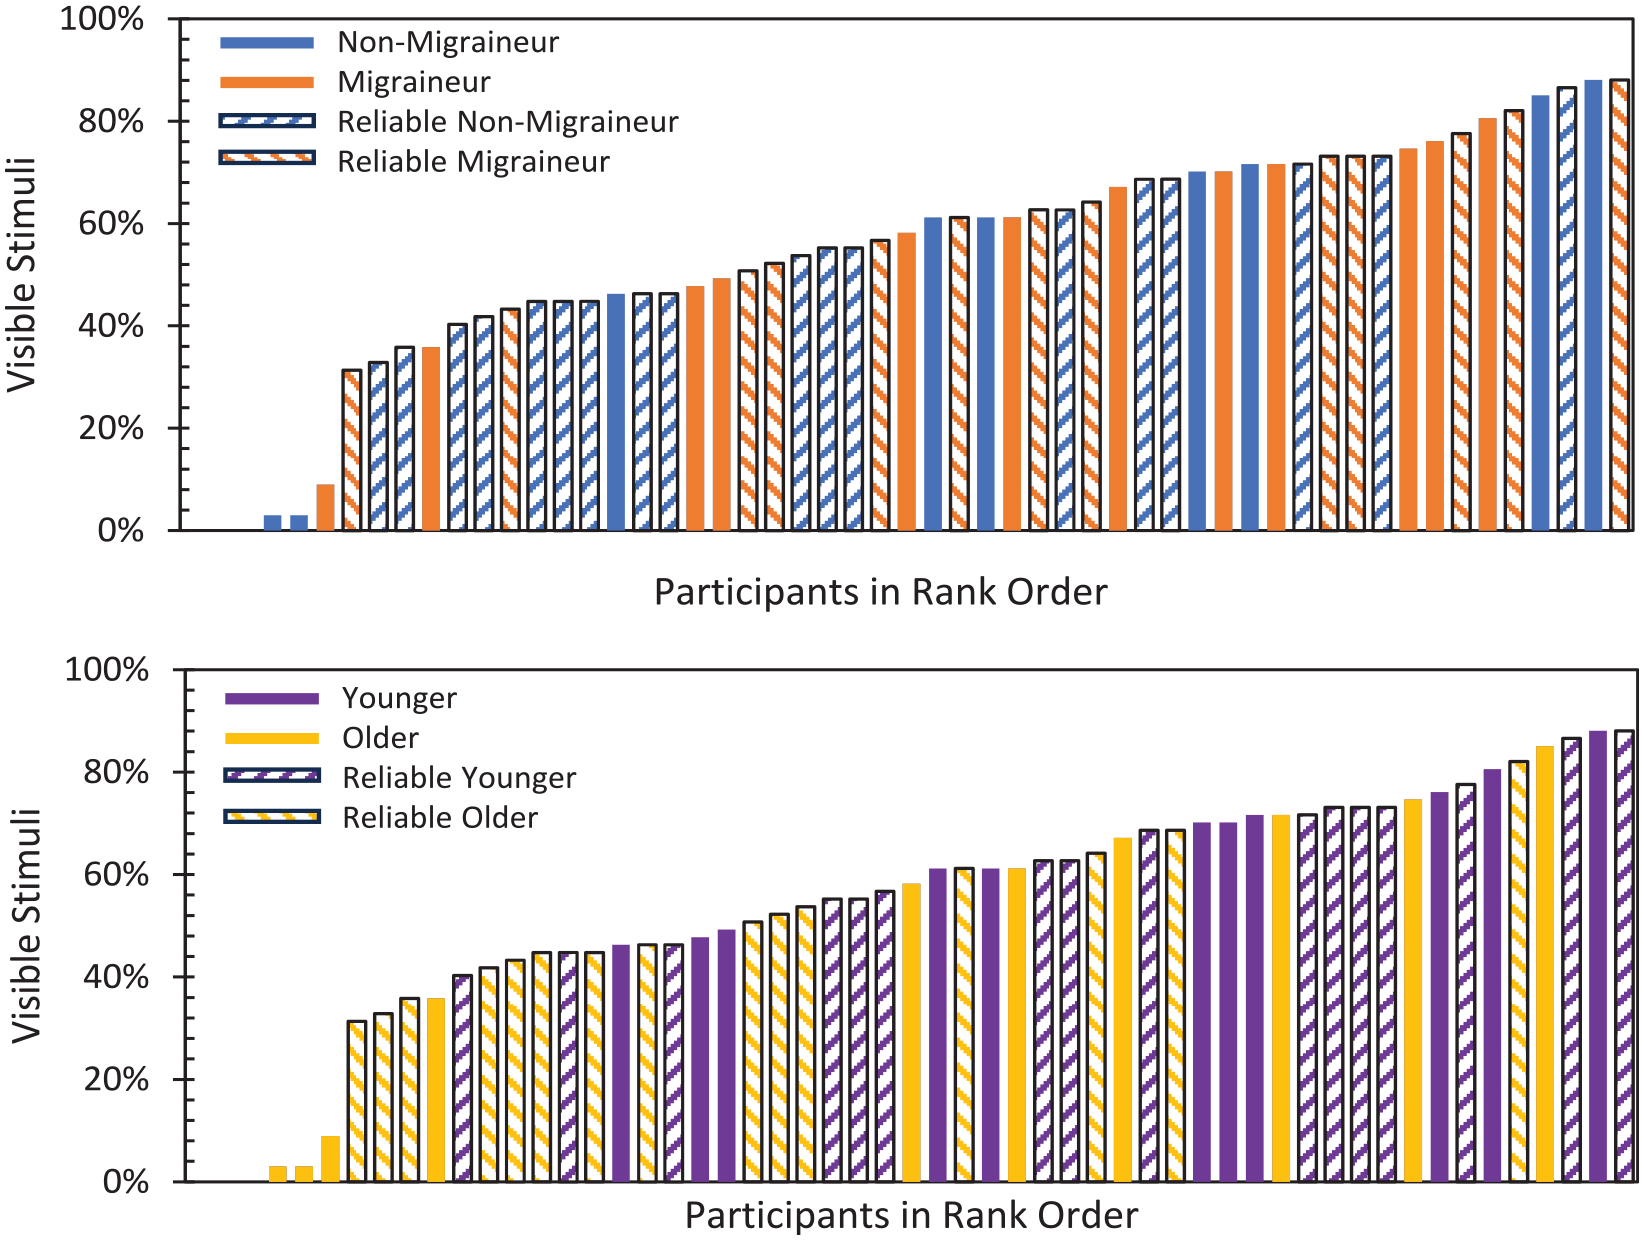
Comparison of the distribution of migraine and older participants, as well as reliable participants, with participants ordered by percentage of stimuli rated as producing a visible phantom array
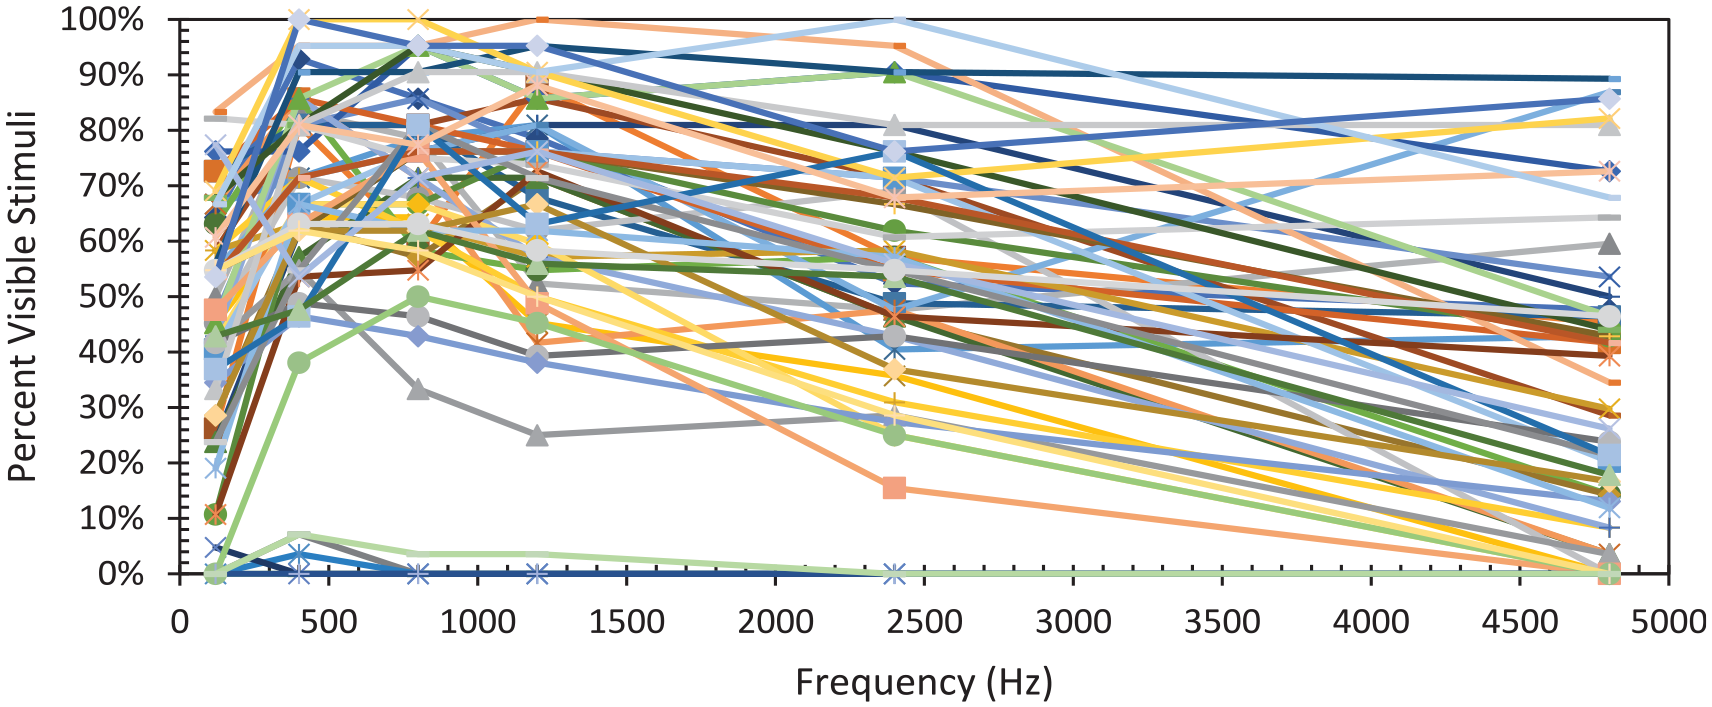
Percent of visible evaluations for sine waves with 15% to 100% modulation (the stimuli repeated across all frequencies) for all participants shown individually
Rectangular waves are of particular interest due to the widespread use of PWM. PAE from rectangular waves with 100% modulation, and 10% duty cycle at a frequency of 4800 Hz was accurately detected by 84% of reliable observers and 73% of all observers. At 10 000 Hz, it was 13% of reliable observers and 16% of all observers (although 15% of all observers indicated DC waveforms were visible above threshold).
3.9 Interesting anecdotes
Participants reported a wide variety of reactions to different waveforms. For some people, a particular stimulus (or a small number of stimuli) was egregious, necessitating a break or instantaneous physical symptoms (e.g. nausea, fatigue, pulsing or a strong aversion response). A small number of participants required extended breaks during their participation. There was no obvious trend in which stimuli were causing these effects.
A small number of participants reported annoyance or discomfort from some stimuli without being able to see the PAE. Again, there was not a consistent pattern to these between participants. Other participants reported seeing a halo, flash, star, ‘side lighting’ or other effects for different stimuli.
In the instructions, both a steady dot and a streak were included as examples of the phantom array not being present. This reflected the different experiences of the experiment team in response to DC stimuli. Likewise, the experience of the participants was varied. Notably, some people who reported seeing dots for DC example stimuli reported seeing a streak, but not arrays, for some modulating stimuli. That is, in these cases the modulating light was changing the perceptual experience, but not by inducing a phantom array.
Finally, at least one participant likened the experience to a ‘Magic Eye’ (technically referred to as a random dot stereogram). Like the PAE, some people are unable to perceive depth in random dot stereograms, which are used medically as a screening tool for visual deficiencies (e.g. stereo blindness). At this point, we cannot speculate a link between the two.
4. Discussion
Much work on the PAE has focused on visibility, which has led some to question whether visibility alone is problematic. While visibility was a major component of this experiment, annoyance was another dependent measure and participants were questioned regarding their experience with phantom arrays in everyday life, as well as any impacts that followed participation. Most participants reported being bothered by the PAE and having physical symptoms as a result. More than a third reported changing their behaviour due to seeing the PAE. These numbers were substantially higher for the migraine group, a majority of which also reported discomfort or other adverse reactions following the experiment. The primary complaints were headache and eye fatigue. Younger participants – who, like the migraine group, were more likely to see the PAE – also experienced more headaches and eye fatigue/strain following the experiment. Given that the experiment was visually demanding – requiring the participants to scan their eyes back and forth for an hour or more – the negative outcomes (for the migraine group in particular) cannot be explicitly linked to the TLM itself. Nonetheless, this is strong evidence that TLM is a major problem in lighting and should be remedied, even if it requires trade-offs with other performance attributes.
Waveforms mimicking PWM (i.e. 100% modulation rectangular waves) were generally found to be the most annoying and were evaluated as visible by a majority of participants even at 4800 Hz. At 10 000 Hz, it was not statistically more visible or more annoying than DC, making this a reasonable target minimum frequency if PWM is utilized in lighted environments similar to those in the experiment space (i.e. not areas with larger eye movements, darker finishes or very low ambient light conditions). Sine waves with otherwise equivalent characteristics were generally less annoying, but 100% modulation sine waves were still problematic – and more visible than DC at 7000 Hz.
Overall, sensitivity to the PAE was slightly different from the data that underlies PAVM. While the use of a black background instead of a grey background would typically lead to greater visibility, the range of stimuli was different, the task was different and the sample of people was different. Even with the differences in threshold modulation, PAVM and the associated performance levels proposed in IES TM-39 were effective at differentiating stimuli with DC-like performance (i.e. low visibility) and those that would be highly visible/annoying. This experiment does not support the use of the PAE threshold modulation function published in CIE 249.
One of the challenges in creating a metric for the PAE that can allow for harm reduction is addressing the wide individual variation in visual sensitivity and adverse reactions. Even if application factors affecting visibility are ignored – resulting in a relative metric, which can still be useful – the metric must be designed to address a specific population. That is, because the typical form for metrics addressing responses to TLM has a normalized form, a specific group is set to have threshold visibility at a metric value of 1. Traditionally this has been the average value of the population used in the experimental work used to derive it. It could be all people, just college-age men or just sensitive people, for example. The choice of the population to model ultimately informs the thresholds and the resulting metric’s target values for use in specifications, as they can counteract one another. That is, if a general population is used to model threshold visibility, and individuals with migraine and other sensitive individuals were excluded as subjects, then the average values may not be protective for some at the more sensitive end of the normal distribution. In that case, more strict performance criteria can be set to account for more sensitive observers.
4.1 Limitations and future work
This experiment used a hybrid of the constant stimuli method and staircase method to primarily address group-level threshold visibility for sine waves. Additional work can increase the focus on individual variation in threshold modulation by presenting more stimuli per person.
This study included a wide range of frequencies and modulation depths to induce PAEs; it was not designed to differentiate which stimuli may cause adverse physiological reactions. Additional inquiry into whether visibility is necessary to cause unwanted physiological symptoms is warranted. Likewise, it would be valuable to know if all frequencies lead to adverse reactions (i.e. any observable phantom array is a problem), or if some conditions causing the phantom array are more problematic than others (i.e. the problems are caused by TLM at specific frequencies, but not necessarily visual detection of the PAE).
As required by Institutional Review Board policies during recruitment, both participants with migraine and without migraine were presented with information that physiological symptoms from flicker were a possibility. However, the migraine group received an additional symptom history questionnaire for screening purposes. The Informed Consent form for all participants also acknowledged possible consequences, offering breaks, respite or stopping participation in case of illness. It is possible the migraine group inferred a higher likelihood of headaches afterward, which could have increased the number of post-experiment headaches reported.
This experiment included momentary viewing of individual stimuli. While the total duration was between about 60 min and 120 min depending on the participant, this is still only a fraction of the duration of a typical workday. Longer durations of exposure may increase the annoyance level or the prevalence of adverse physiological responses.
5. Conclusions
This experiment investigated the visibility of phantom arrays resulting from 85 stimuli with variable TLM. Fifty-five participants (25 with migraine, 30 without migraine; 27 less than 40 y old and 28 aged 40 y or older) evaluated the stimuli and answered questions about their experience with the PAE. The migraine group and younger people exhibited greater visibility of the PAE. The overall sensitivity was more similar to the threshold modulation function implemented in PAVM than the one proposed in CIE 249:2022.
The participants also evaluated the annoyance of a subset of 51 stimuli. Annoyance was strongly correlated with visibility. Stimuli with PWM-like waveforms (e.g. repetitive rectangular waves with 100% modulation) were particularly annoying. With a 10% duty cycle, they were visible to 73% of the participants. At frequencies less than 1200 Hz, they were visible to all participants who were able to reliably detect the phantom array affect, and the mean annoyance ratings were above 4 on a scale from 0 (not annoying at all) to 8 (extremely annoying, I need to leave the room).
The questionnaire administered at the end of the evaluations, and another administered 1 day to 3 days following completion of the evaluations revealed that the migraine group was substantially more affected by participating in the experiment – in particular 41% experienced a headache following participation compared to 8% of the non-migraine group. Furthermore, 72% (vs. 40%) of the migraine group reported being bothered by the PAE more than rarely, 84% (vs. 47%) of the migraine group reported having physical symptoms due to the PAE and 60% (vs. 17%) of the migraine group reported changing their behaviour due to the PAE. Younger participants, who also demonstrated increased visibility, also reported greater incidence of headache (36% to 9%) and visual fatigue (36% to 9%). These findings speak to the serious consequences of the PAE in architectural lighting. We advocate for rapid uptake of metrics and specifications to mitigate the PAE – and other responses to TLM – such as those proposed in IES TM-39.
Footnotes
Acknowledgements
The authors received insightful experimental design guidance from Dr. Jennifer Veitch of the National Research Council of Canada. Dr. Susan Varnum of the Pacific Northwest National Laboratory’s (PNNL) Institutional Review Board provided invaluable help in procuring approval to recruit participants, and designing protocols to protect all participants, including those with migraine. Dr. Lester Caudle of PNNL guided the questionnaires for intake, post-experiment debriefing and follow-up. He also provided timely reviews of migraine participant histories to ensure participants faced minimal harm from participating.
Declaration of conflicting interests
The authors declared no potential conflicts of interest with respect to the research, authorship, and/or publication of this article.
Funding
The authors disclosed receipt of the following financial support for the research, authorship, and/or publication of this article: This work was supported by the U.S. Department of Energy’s Lighting R&D Program, part of the Building Technologies Office within the Office of Energy Efficiency and Renewable Energy (EERE).
Supplemental material
Supplemental material for this article is available online at: https://docs.google.com/spreadsheets/d/1t6H5PVLmDo_sM-6ktDiNbXlcYHt4sD4-/edit?usp=sharing&ouid=100777044244870468347&rtpof=true&sd=true.