
Abstract
This study examined the effects of the visual environment conditions of evacuation routes on walking time and psychology, and the lighting requirements for effective evacuation guidance in smoke environments. The results of this study indicate that smoke density has a significant effect on evacuation behaviour, and that the thicker the smoke density, the slower the walking speed and the greater the psychological burden. However, the use of high luminance of light source and continuous installation of lighting in low positions for reliable evacuation guidance can support evacuation behaviour even in a high smoke density environment. In addition to conventional guide lights and emergency lighting, lighting design of evacuation routes based on the luminance distribution of the evacuees’ field of view is necessary to properly and actively guide evacuees to exits and eliminate their sense of uneasiness and will be further studied.
1. Introduction
During a fire, evacuees are required to evacuate quickly, but smoke deteriorates the visual environment, making it difficult to find evacuation routes. In particular, when a space is compartmentalised by shutters being lowered, the spatial configuration differs greatly from that of everyday life, and there have been cases in the past where people were caught in fires because they were unable to find evacuation routes. The number of fatalities due to delayed evacuation accounts for about 40% of all fatalities. 1 A lighting plan that actively directs evacuees to refuges should be implemented so that they can act even when the visual environment deteriorates.
There are many studies on walking speed and environmental conditions during evacuation. For example, Fujii et al. 2 studied walking speed in a corridor with an exit light at the end of the corridor and found that walking speed decreased with smoke density and increased when the corridor was close to the exit light. However, there are no enough findings examining the relationship between visibility and evacuation behaviour using luminance information in smoke environments. Evacuation studies have been conducted using VR technology and other methods. Ronchi et al. 3 conducted virtual reality experiments with a large number of subjects on the behavioural characteristics of evacuation routes in tunnels and high-rise buildings. However, there is currently no technology that can accurately reproduce luminance distribution, including light source luminance of 500 cd m−2 or higher.
Boyce 4 discusses escape lighting, including the NFPA Life Safety Code, ISO standards and other standards and existing research and presents a number of references on the lighting of evacuation routes. For example in smoke-free environments, these references suggest that light sources with a lot of energy at the short-wavelength end of the visible spectrum are more suitable for escape route lighting than those with less, and that low-mounted path marking systems support evacuation better than traditional ceiling-mounted escape lighting. Boyce also discusses the results of various experiments regarding smoke. However, these findings alone are not sufficient for lighting design to actively guide people to the exit in smoke during a fire.
LEDs have been widely used as a general light source as an energy-saving measure after the Great East Japan Earthquake. LEDs are being used in various ways in architectural spaces, such as indirect lighting and architectural lighting. In this study, we examine the effects of the visual environment conditions of evacuation routes on walking time and psychology, understand the lighting requirements for effective evacuation guidance in smoke environments and explore the potential of LEDs.
2. Method
2.1 Test space and equipment
The experiment was conducted in a maze evacuation room in the Toyama Fire Academy. The maze evacuation room size was 12 m in length by 5 m in width by 2.1 m in height. A grid of angles is set up at 1 m intervals, and partitions can freely set the path. In this experiment, a linear path which was 12 m length by 1 m width was set up in the room. The partitions were matt aluminium with a reflectance of 0.60, and the floor was concrete finished with a reflectance of 0.32.
As the experimental spaces were simple and easy to walk, preliminary experiments showed that when nothing was placed on the floor, people walked with little or no slowing down, even in unlit conditions. In actual disasters, especially in unfamiliar environments, people need to check their footing while walking. Therefore, in this experiment, cubic blocks (of dimension 0.1 m or 0.05 m, reflectance 0.20, luminance contrast with the floor 0.38) were put on the floor at random locations to impose visual tasks on subjects, observe them and avoid kicking them. Eight large and small cubic blocks were placed randomly on the floor, approximately one in each 1.5 m−2. As they were made of paper, they would not cause injury if stepped on, but they made a noise when kicked. Subjects were asked to kick the cubic blocks deliberately during practice to check the sound and were firmly instructed to walk away from them during the experiment. The experimenter did not record the number of kicks, but warned the subjects if they heard more than three kicks and reported that they did not hear more than five kicks. A C-type emergency exit guide light and LED lightings with a light source surface of 857 mm × 19 mm used for reliable guiding evacuation routes were installed in the experimental space. In Japan, emergency lighting fixtures installed in ceilings are switched on at a light intensity of 1 lx floor level by the Building Code, for a certain period in the event of a power failure or disaster. However, in the event of a fire, hot smoke covers the ceiling and the ceiling-mounted lighting fixtures are damaged by the heat during evacuation under thick smoke. Furthermore, in Japan, passageway guide lights are installed on ceilings, walls and floors at regular intervals by the Fire Service Act, but they are generally installed at intervals of 20 m or more, making it impossible to see the next passageway guide light under thick smoke. The experimental space and the lighting patterns for reliable evacuation guidance are shown in Figure 1.
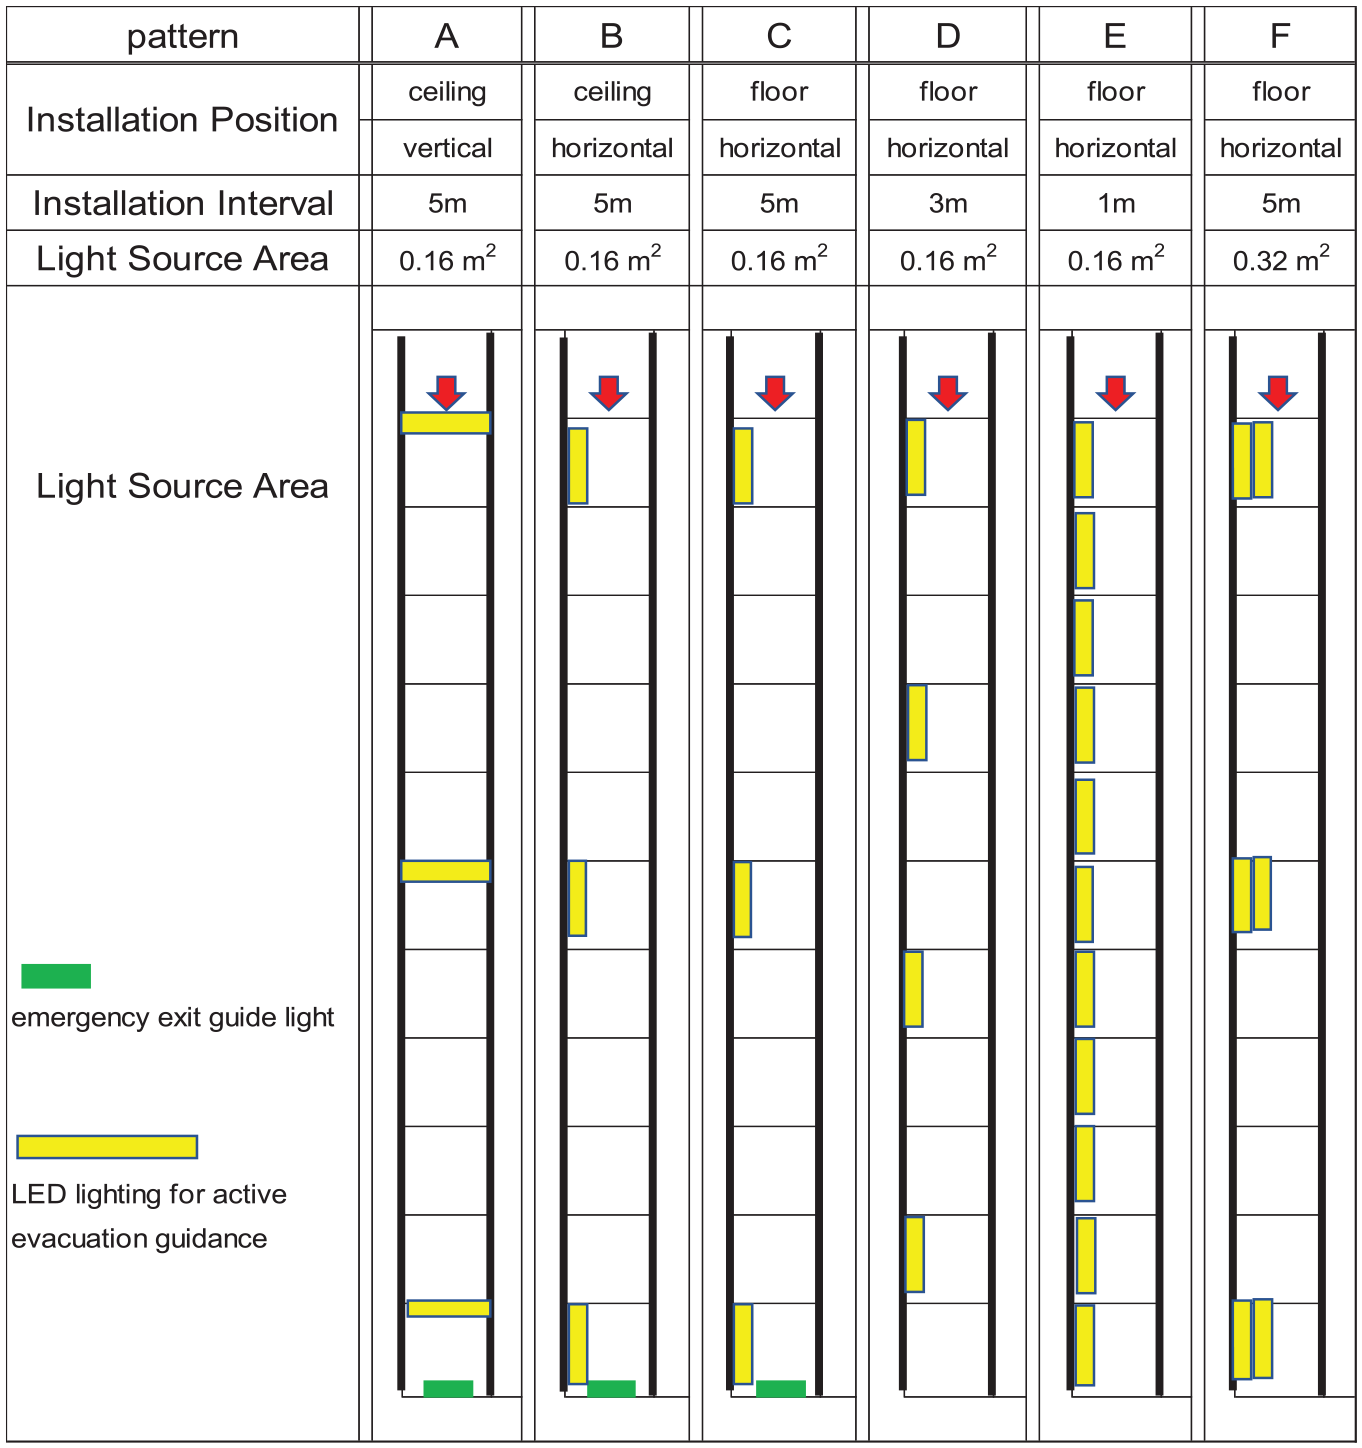
Lighting patterns for reliable evacuation guidance
The maze evacuation room had a smoke input device, which was stirred by four circulators to ensure that the room is uniformly filled with harmless white smoke. Smoke density meters were installed vertically at four locations in the centre of the experimental space (0.8 m, 1.2 m, 1.6 m and 2 m height from the floor) and horizontally at five locations (0 m, 2.5 m, 5 m, 7.5 m and 10 m from the assessment point) at a height of 2 m from the floor. The smoke density values were measured at any time during the experiment (Table 1).
Experimental conditions
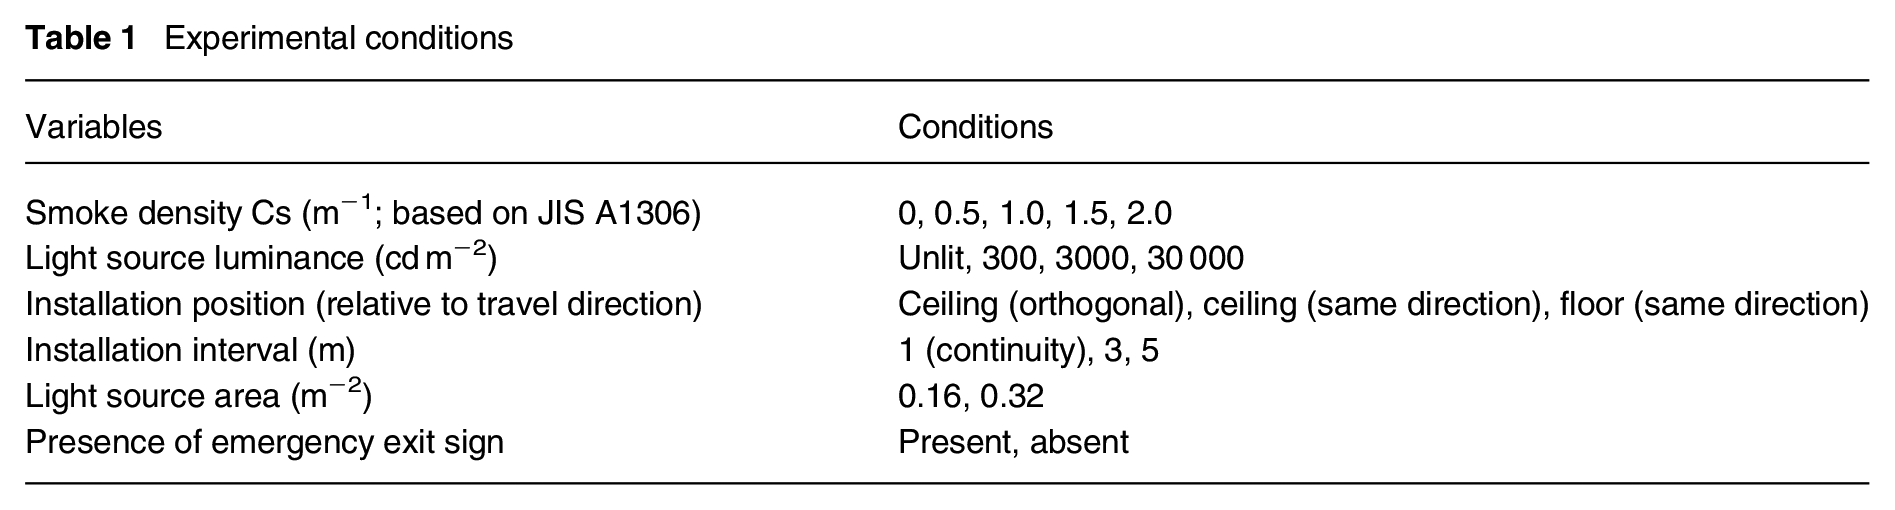
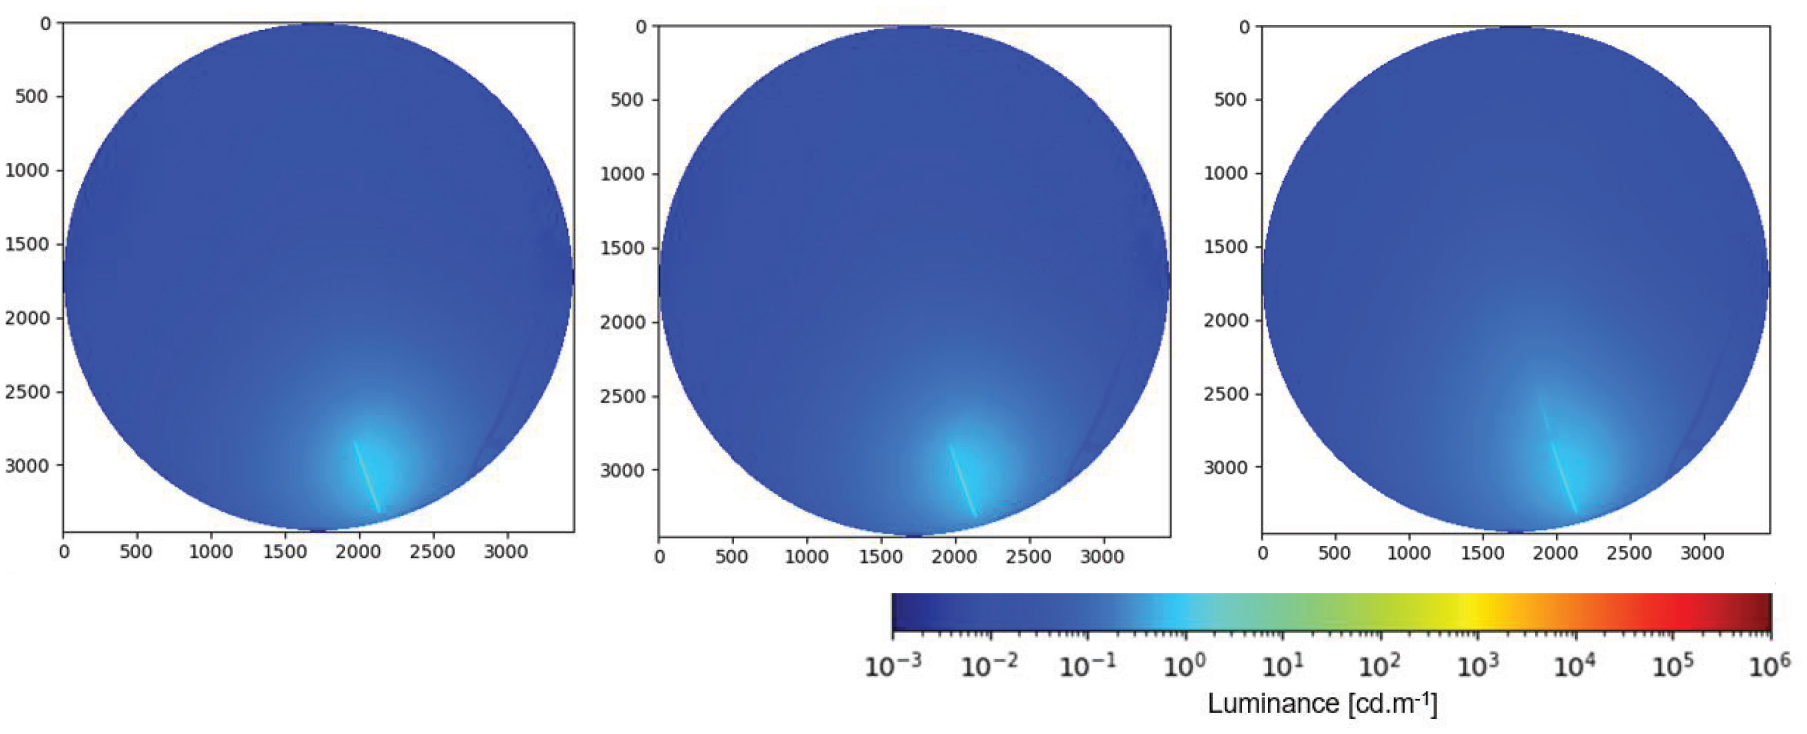
Experimental conditions included five smoke density conditions 5 (Cs = 0 m−1, 0.5 m−1, 1.0 m−1, 1.5 m−1 and 2.0 m−1), three light source luminance conditions (300 cd m−2, 3000 cd m−2 and 30 000 cd m−2), installation position, installation interval, light source area and the presence of an emergency exit guide light. Light source luminance was measured by capturing the centre of the light source directly in front of it. Figure 2 shows the example gallery of luminance distribution of six lighting patterns (300 cd m−2, no emergency exit guide light).
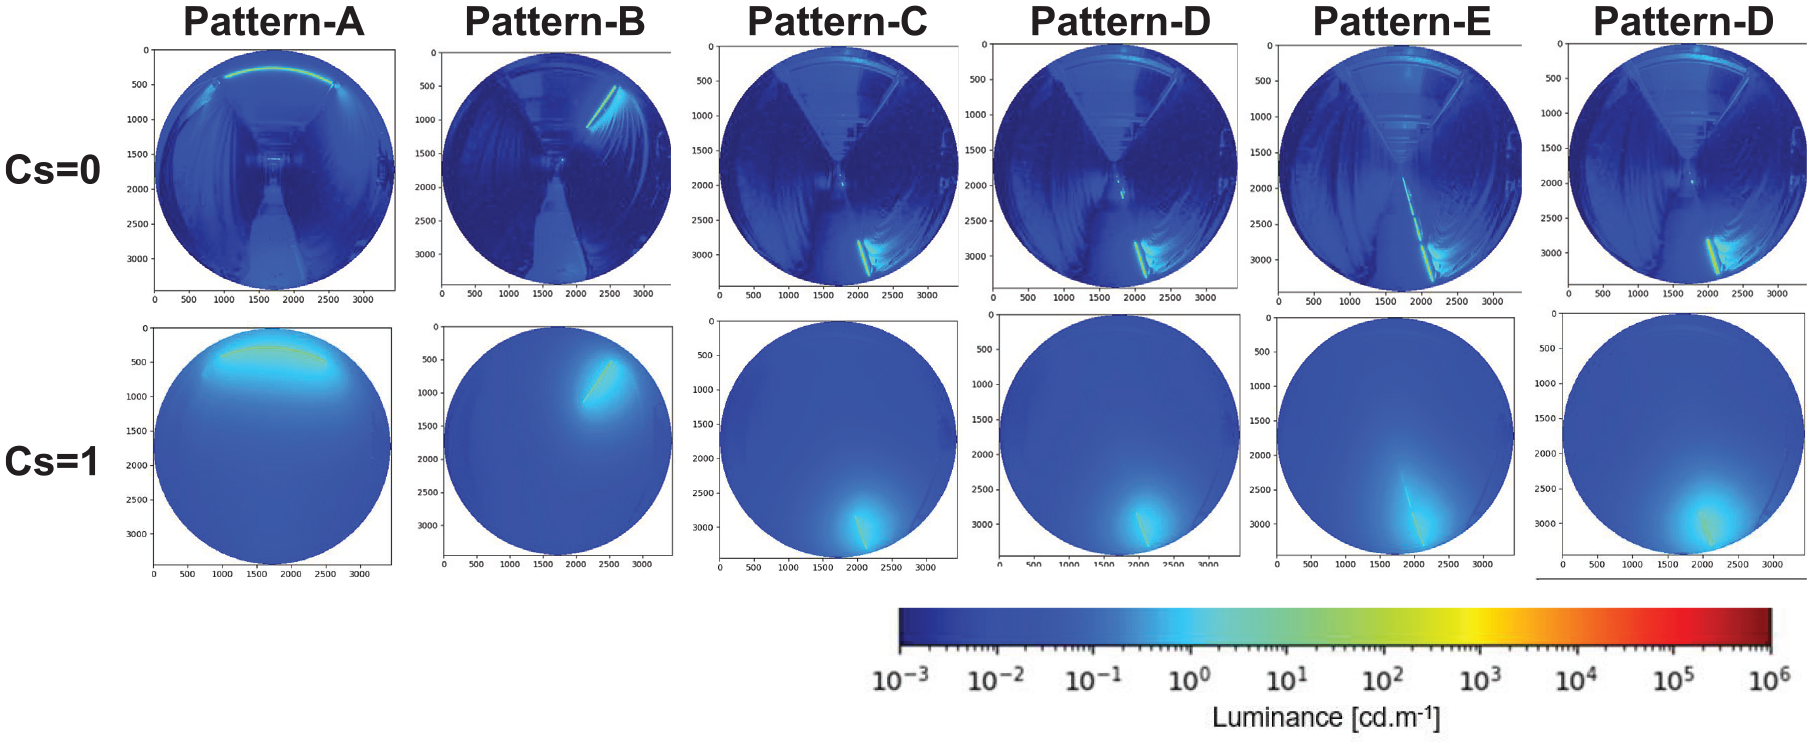
Gallery of luminance distribution of six lighting patterns (300 cd m−2 of LED light source luminance, no emergency exit guide light)
2.2 Procedure
The experiment was conducted one subject at a time. After acclimatising a subject to the brightness of the experimental space for at least 5 min before the experiment, the subject was evaluated at the starting point (red arrow in Figure 1) for visibility of the emergency exit guide light, visibility of the next LED guidance lighting, difficulty in moving forward and tolerance level. As the effect on walking time of rapidly different adaptation states has already been examined in another study, 6 it was decided not to deal with that factor in this study. Then the subject operated a stopwatch while measuring their walking time to the end of the passage. Finally, the subject was asked to evaluate his tolerance level after walking.
The evaluation items and rating scales are shown in Figure 3. There are no emergency exit guide lights in lighting pattern-D, pattern-E and pattern-F, so ‘visibility of the emergency exit guide light’ was not performed. Subjects first participated in the experiment for the condition in which nothing was lit except the emergency exit guide light. In order to stabilise the subject’s adaptive state, the experimental conditions presented thereafter were considered to be in the order of dark to light, with the conditions presented randomly within that order.
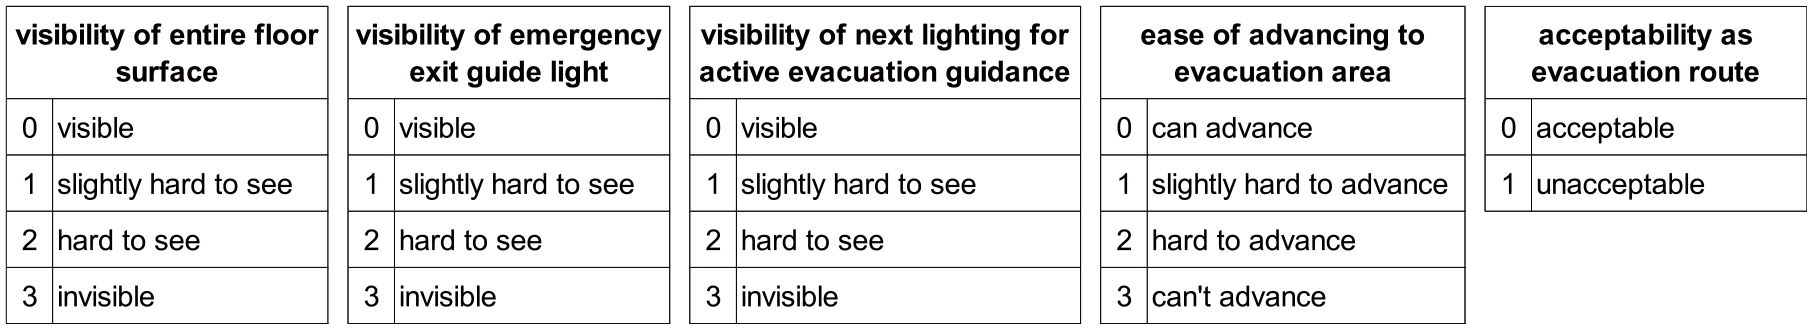
Evaluation items and rating scales
All subjects participated in all experimental conditions. The experiment was divided into separate experiments for each of the five smoke density conditions, with 10-minute to 15-minute or 45-minute breaks between each experiment, or on separate days. There were 29 conditions performed at a single smoke density condition, with two subjects taking turns to evaluate and walk, and the experiment took approximately 60 min, including setting lighting conditions and smoke density conditions.
2.3 Participants
The study recruited 26 participants (13 elderly and 13 young adults), all of whom reported no difficulty with daily walking activities and had their binocular visual acuity measured in the stationary state. The elderly group had a median age of 71 y (range 66 y to 79 y) and the young group had a median age of 21 y (range 20 y to 55 y). The distribution of numbers in each age group (high vision group: low vision group) was 12:1 for the young group and 2:11 for the elderly group, where binocular vision of 0.9 or more was defined as high vision and less than 0.9 as low vision. The mean and standard deviation of visual acuity for each age group was 1.15 ± 0.30 for the young group and 0.71 ± 0.24 for the elderly group. Previous studies 4 have shown that participants’ visual acuity and age affect their walking speed and psychological evaluation. As the results of the present experiment were also considered to be influenced by visual acuity and age, a significance difference test was conducted by classifying the two groups a priori. Some results showed significant differences between the two groups, but no significant differences were found across all conditions. Since there were no significant differences in walking time or psychological evaluation results among age groups, the results were handled without dividing them into attributes.
2.4 Photometric characteristics
2.4.1 Illuminance of experimental environment
The relationship between illuminance, light source luminance and smoke density for each lighting pattern of reliable evacuation guidance was measured. A micro-plane illuminance meter (T-10M, Konica Minolta, Chiyoda-ku, japan) was used for the measurements.
In terms of average floor illuminance in Figure 4, lighting pattern-A and pattern-B, in which luminaires were installed in the ceiling, showed a decrease in floor illuminance as smoke density increased, while lighting pattern-C, pattern-D, pattern-E and pattern-F, in which luminaires were installed on the floor, showed an increase in floor illuminance as smoke density increased. As in a normal lighting scheme, when lighting for reliable evacuation guidance is installed on the ceiling, the lights enter the floor surface, and floor illumination can be secured efficiently. As smoke density increases, the light is reflected and scattered by white smoke particles, but is absorbed by the smoke present for the distance from the ceiling to the floor, reducing floor illuminance. On the other hand, when lighting for reliable evacuation guidance is installed on the floor, light from the emitting surface is reflected by smoke particles and re-enters the floor surface, increasing floor illuminance. These phenomena were similar regardless of the light source luminance.
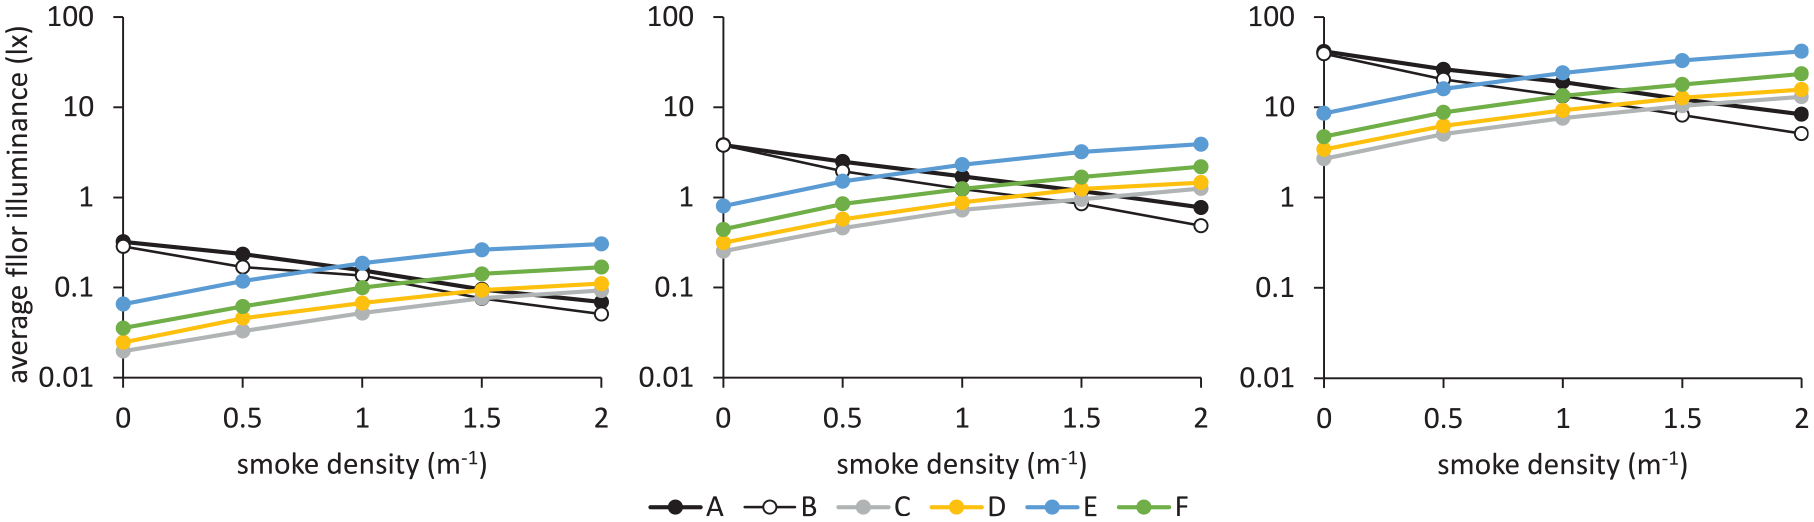
Floor illuminance under the conditions of lighting patterns, light source luminance and smoke density. These illustrate 300 cd m−2 (left), 3000 cd m−2 (middle) and 30 000 cd m−2 (right) of LED light source luminance
In terms of vertical illuminance on the subject’s face at the starting point in Figure 5, vertical surface illuminance remained almost the same or slightly increased with increasing smoke density for lighting patterns pattern-A and pattern-B installed on the ceiling, while for lighting pattern-C, pattern-D, pattern-E and pattern-F installed on the floor, the vertical illuminance decreased with increasing smoke density. The opposite trend from the floor illuminance was due to the different balance between the decrease due to smoke absorption and the increase due to scattered light, depending on the positional relationship between the illuminance meter and the light source.
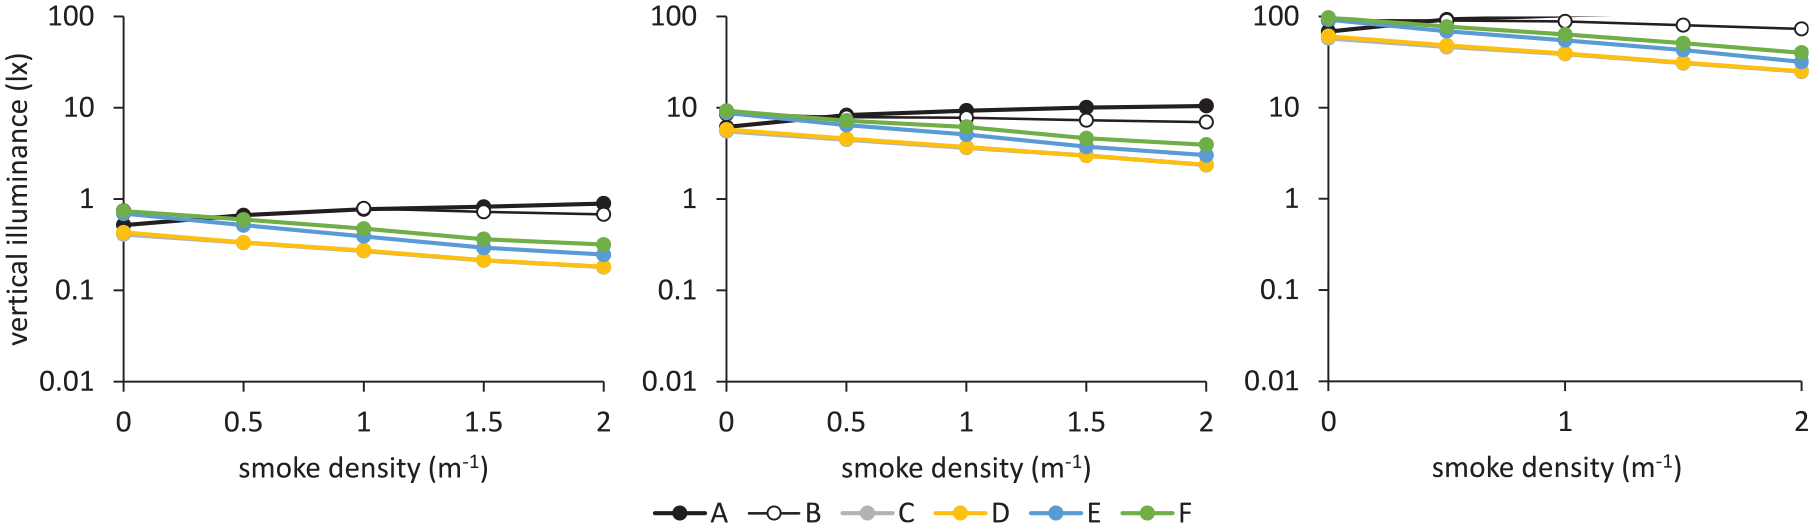
Vertical illuminance under the conditions of lighting patterns, light source luminance and smoke density. These illustrate 300 cd m−2 (left), 3000 cd m−2 (middle) and 30 000 cd m−2 (right) of LED light source luminance
2.4.2 Luminance distribution of participants’ view
The luminance distribution was measured using a fisheye lens digital camera ThetaZ1 (RICHO), and the luminance chromaticity measurement program L-CEPT 7 developed by Yamaguchi at 3 m, 5 m and 11 m from the location of the emergency exit guide light.
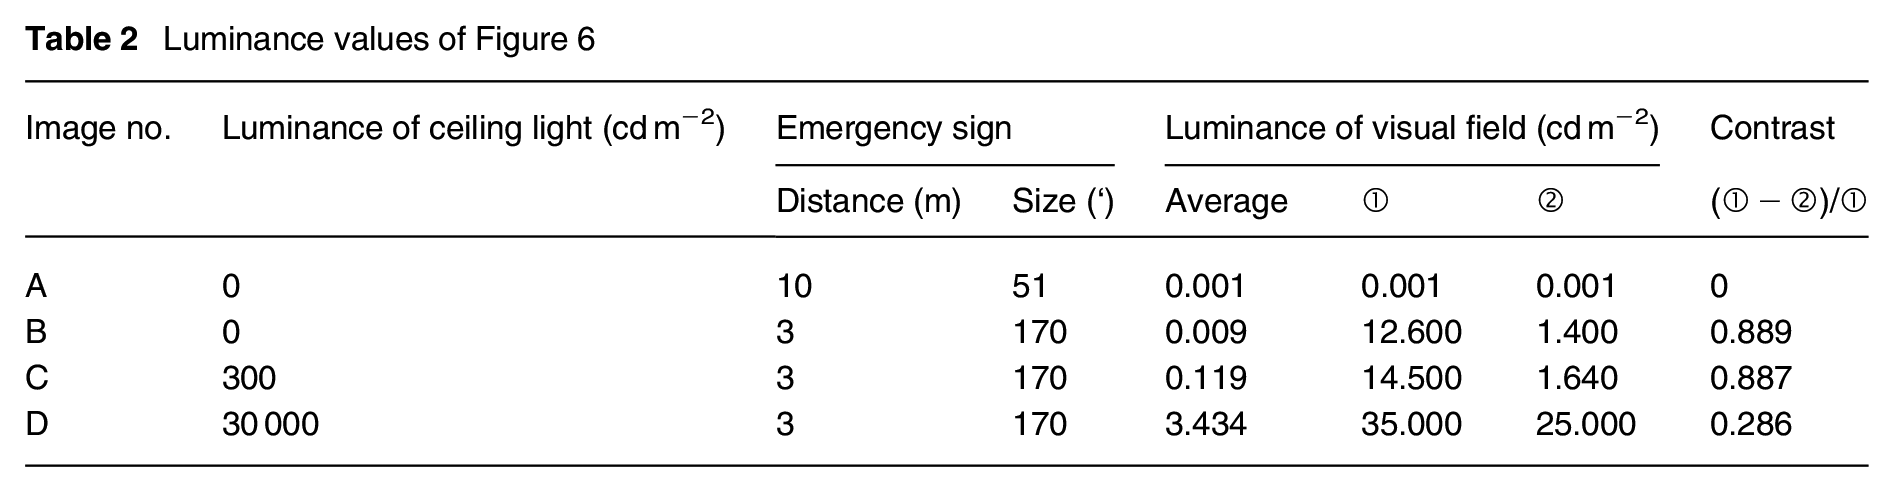
An example of the results for smoke density Cs = 1.0 m−1 is shown in Figure 6 and Table 2. When only the emergency exit guide light is lit, the light is visible at 3 m in Cs = 1.0 m−1, but at 11 m it is not visible because it is assimilated with the surrounding luminance. When the lighting for reliable evacuation guidance was on the ceiling, the luminance contrast between the evacuation guide light and its surroundings was poor due to light scattering by white smoke, which was especially noticeable at 30 000 cd m−2. Jin 8 showed a constant CsV = 8 relationship between the visible distance of an emergency guide light V (m) and smoke density Cs (m−1). Figure 6(a) and (b) shows the luminance distribution for Cs = 1 in a path with only the emergency exit guide light, which is generally consistent with Jin’s results. However, Jin’s approach cannot explain the phenomenon in Figure 6(d), where other light sources are present in the path and their scattered light obscures the emergency exit guide light.
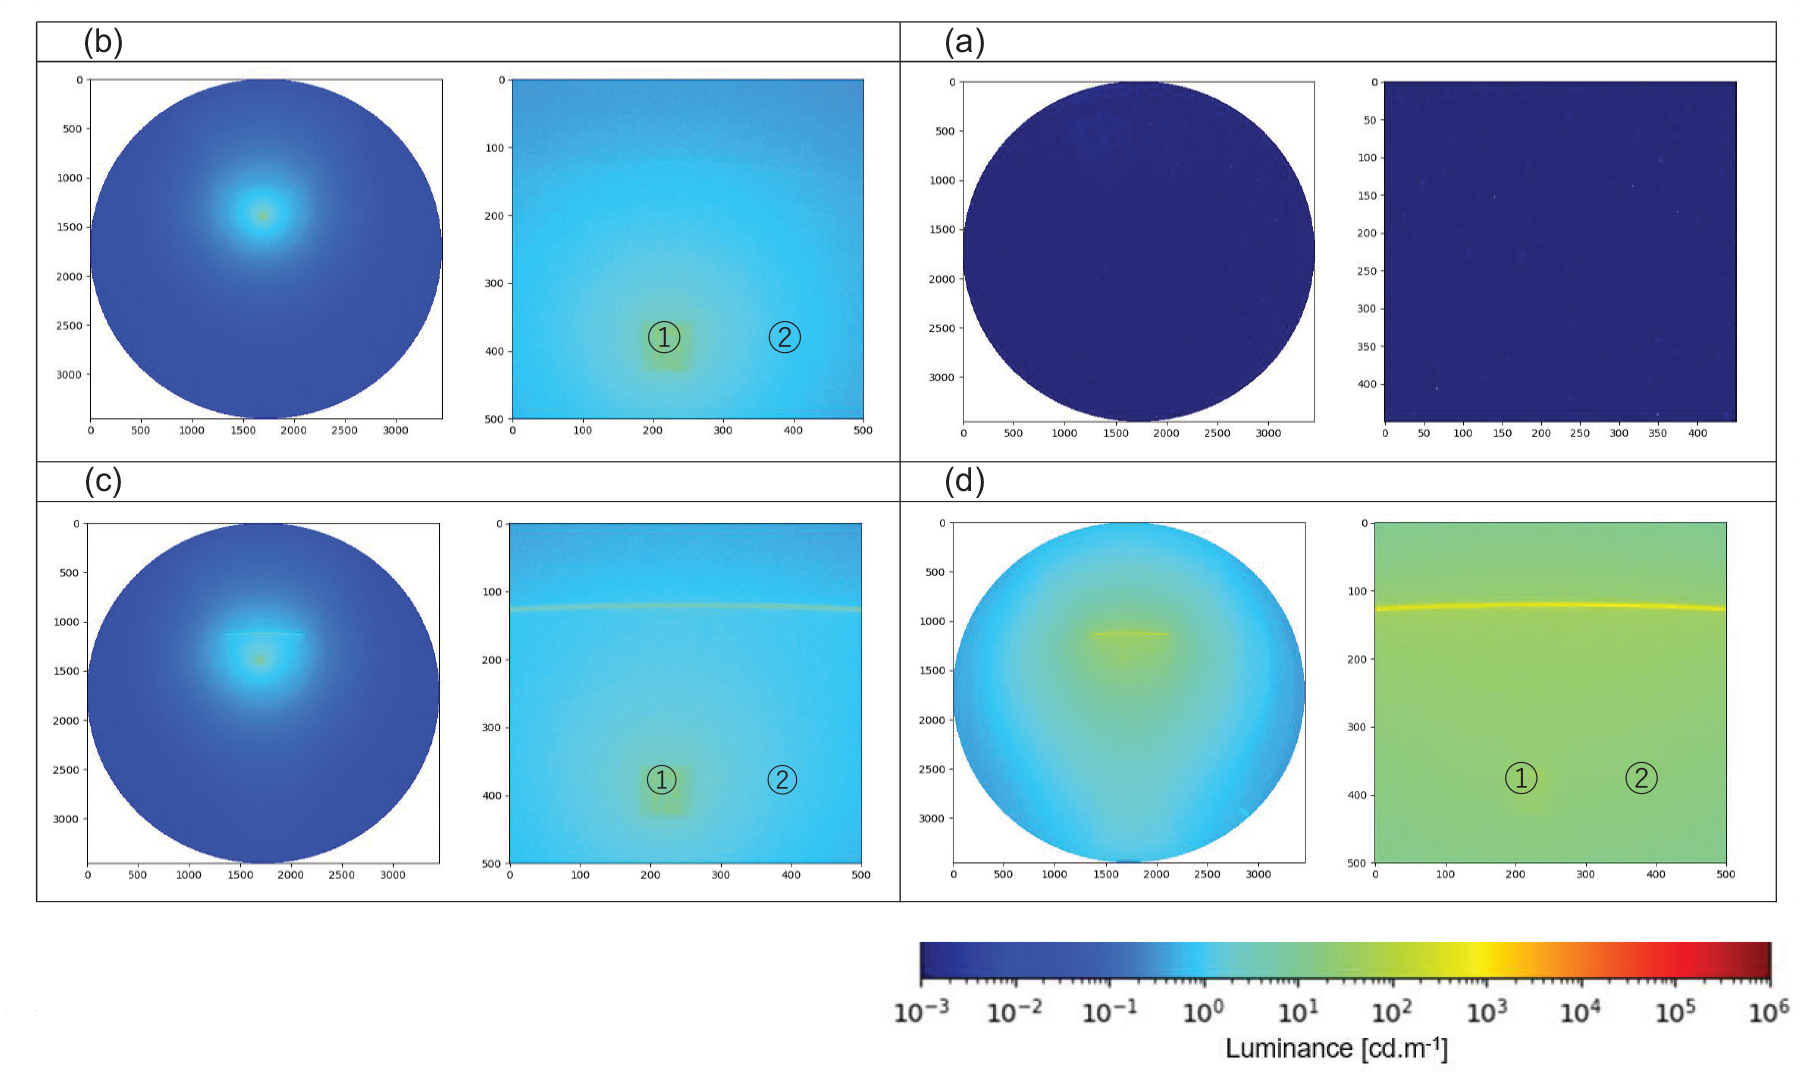
Luminance distribution surrounding an emergency exit guide light at several lighting patterns in an evacuation route when smoke density Cs = 1.0 m−1. (a) 10 m distance, Cs = 1.0, no ceiling light; (b) 3 m distance, Cs = 1.0, no ceiling light;(c) 3 m distance, Cs = 1.0, ceiling light luminance 300 cd m−2; (d) 3 m distance, Cs = 1.0, ceiling light luminance 30 000 cd m−2
Luminance values of Figure 6
3. Effects of reliable evacuation guidance light on walking time
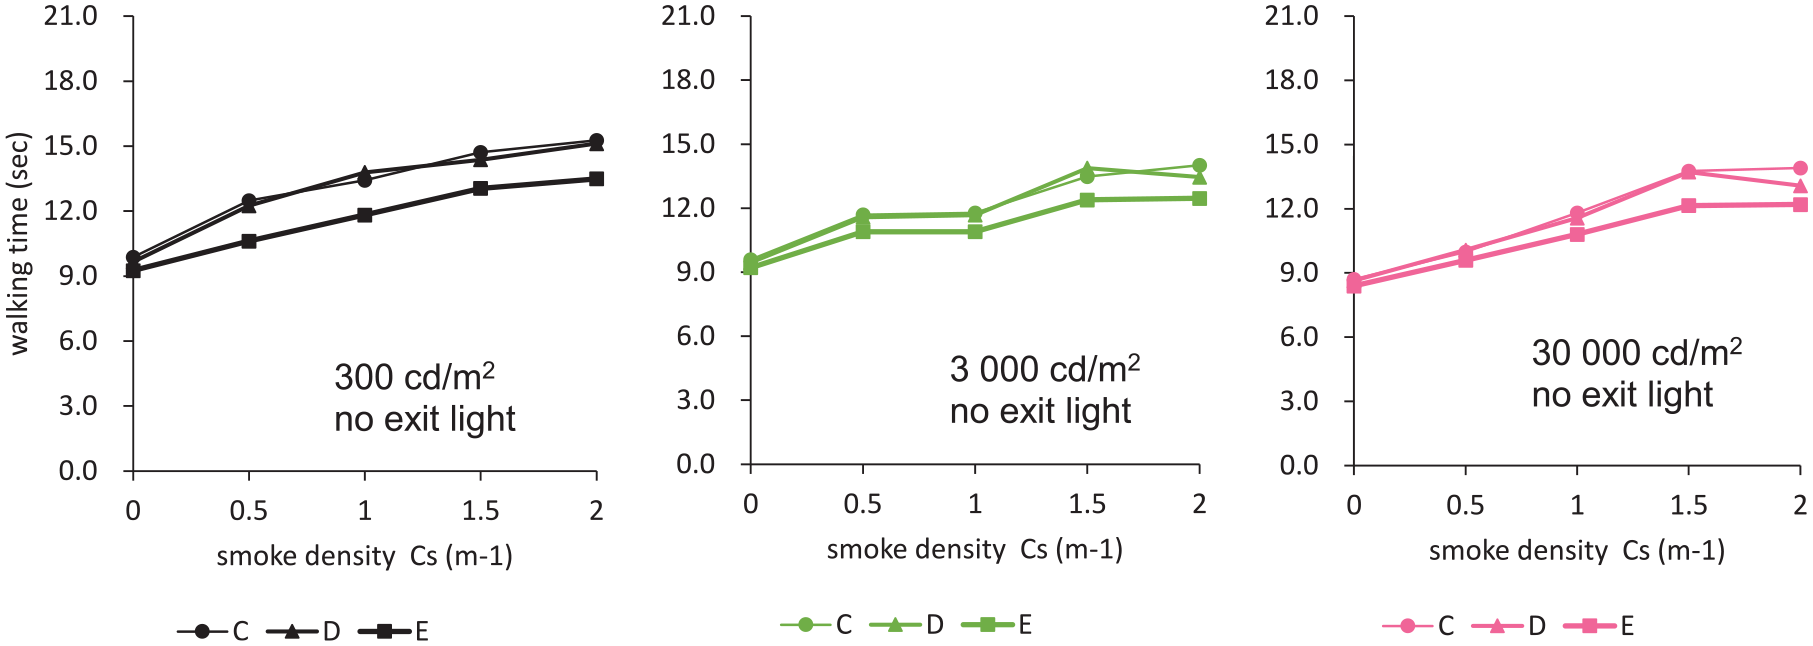
3.1 Effect of light source luminance
The light source luminance of each pattern for reliable evacuation guidance was compared, and the results for walking time are shown in Figure 7. The values of average walking time of Figure 7 are shown in the Appendix. An example of luminance distribution is shown in Figure 8. Walking time increases as smoke density Cs increases. In many conditions, the average walking time at the highest luminance of 30 000 cd m−2 was significantly shorter. The results of the significant difference test (p< 0.05, *) for walking time at different light source luminance are shown in Figure 7. A multiple comparison test using the Bonferroni method was performed to check which light source luminance had significant differences. The results confirmed a significant difference between 300 cd m−2 and 3000 cd m−2 with the largest difference in luminance. This means that in the early stages of a fire (Cs = 0.5 and 1), increasing the light source luminance of the reliable evacuation guidance light effectively reduces walking time.
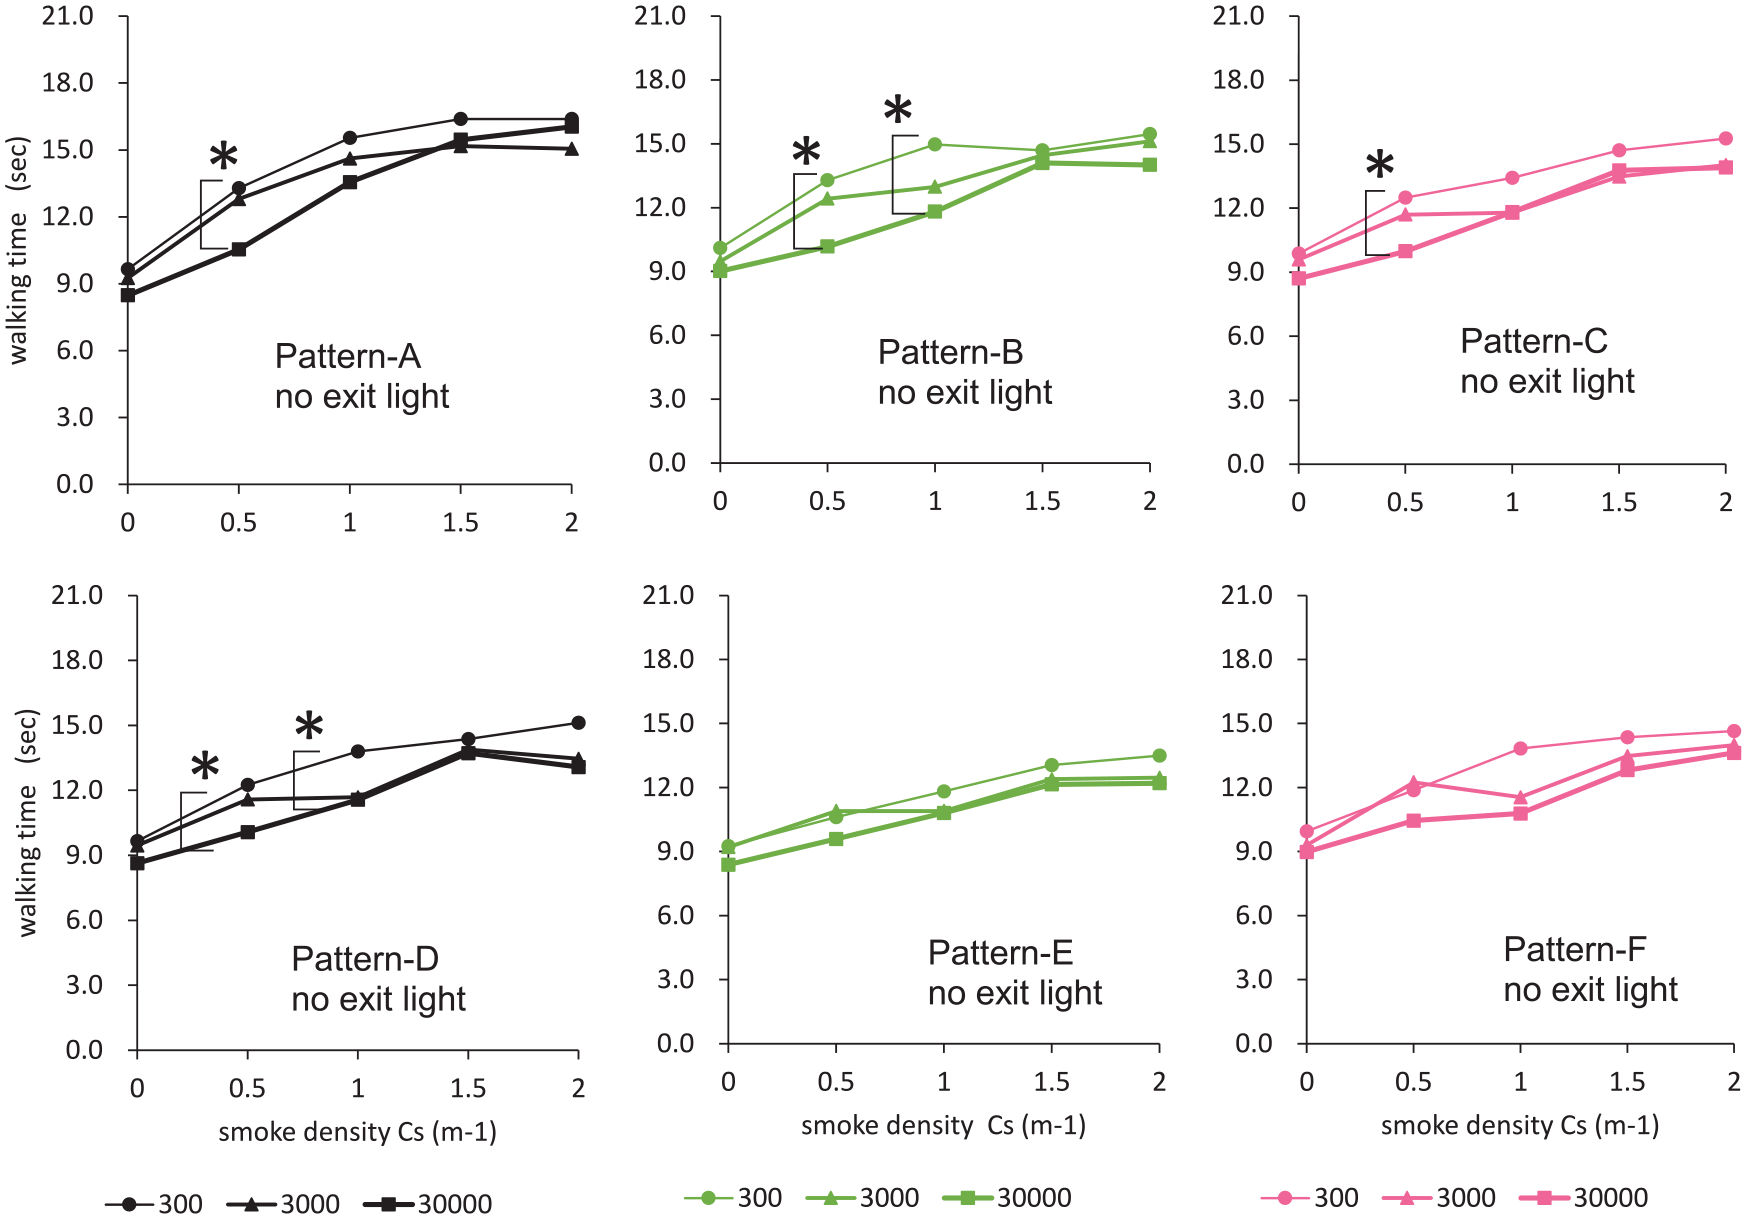
Effect of light source luminance on walking time
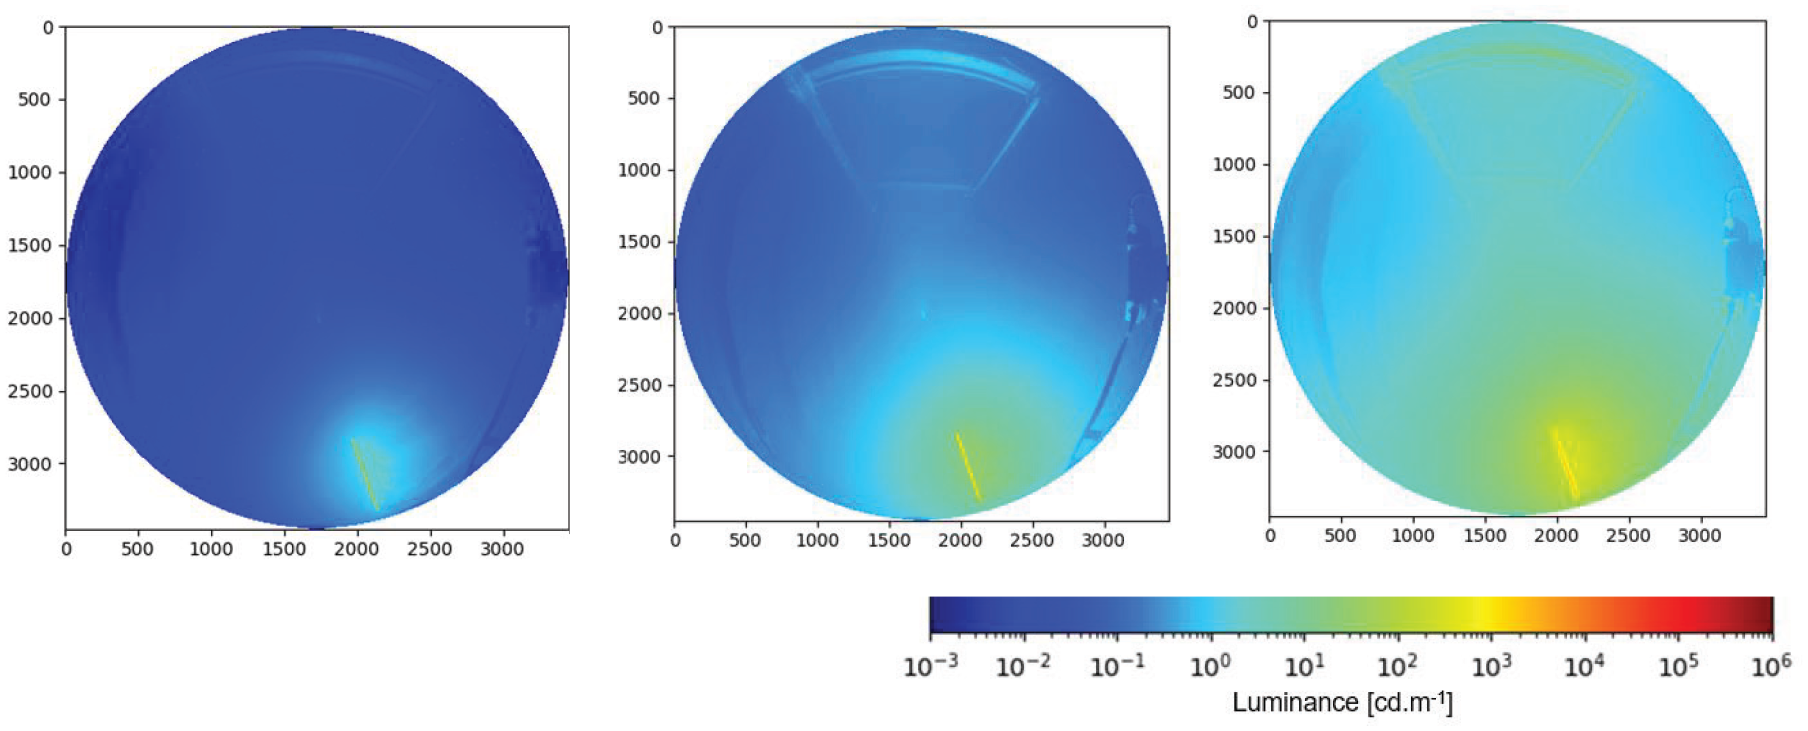
Luminance distribution from 11 m distance (pattern-C, Cs = 0.5). These illustrate 300 cd m−2 (left), 3000 cd m−2 (middle) and 30 000 cd m−2 (right) of LED light source luminance
3.2 Effect of lighting installation position
The installation position of each pattern for reliable evacuation guidance was compared, and the results for walking time are shown in Figure 9. The values of average walking time of Figure 9 are shown in the Appendix. An example of luminance distribution is shown in Figure 10. In the comparison of installation positions, the average walking time was significantly shorter in patterns-B (ceiling) and pattern-C (floor), in which the lighting for reliable evacuation guidance was installed in parallel with the direction of travel, than in pattern-A (ceiling), in which the lighting was installed perpendicularly. To ensure the visibility of evacuation exit guide lights, it would be better to install guide lighting fixtures in places other than the ceiling surface (floor surface or handrail) to guide people to evacuation sites effectively. Significant difference tests for walking time at different installation locations were conducted, but no significant differences were identified in any of the conditions.
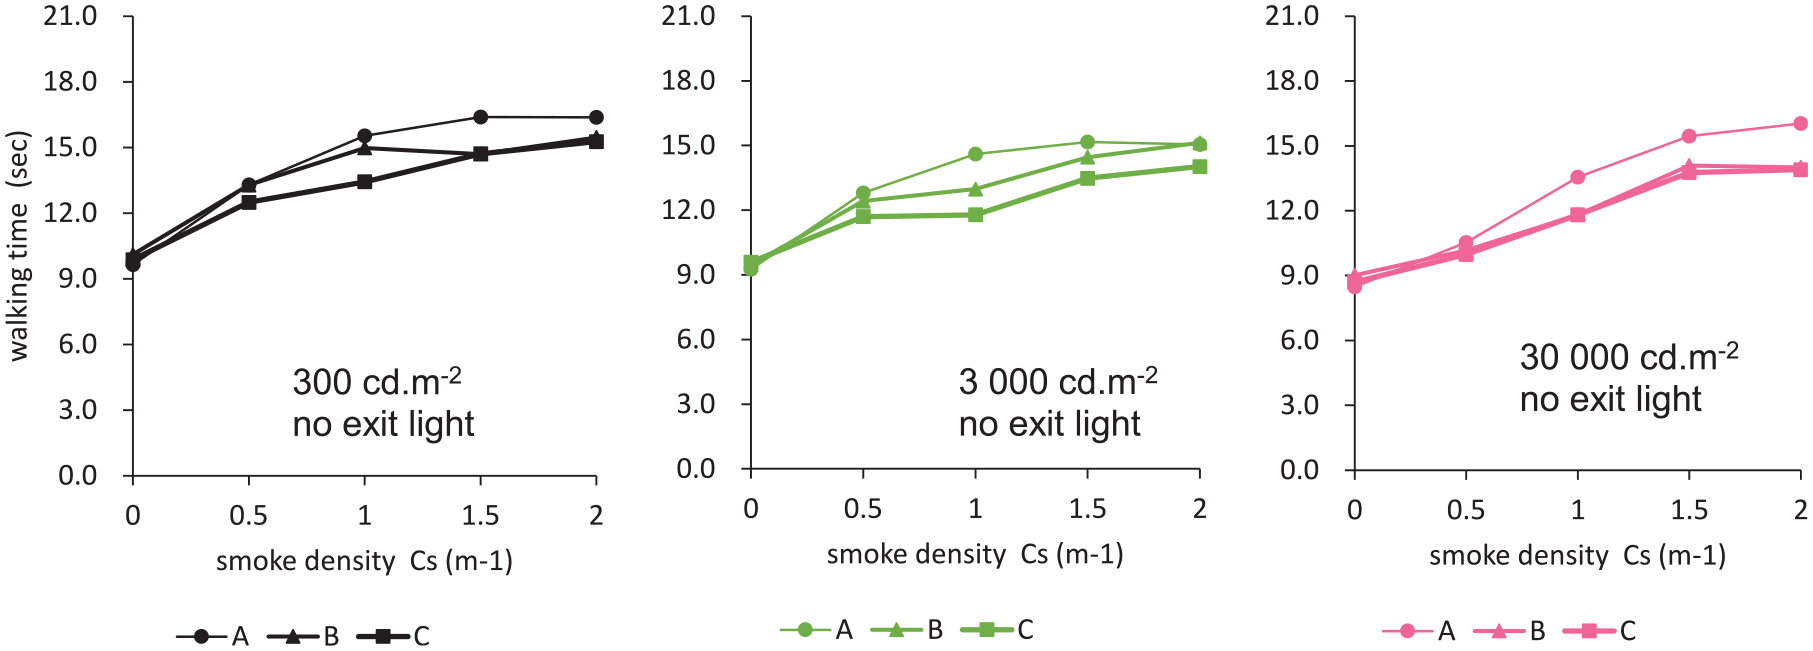
Effect of lighting installation position on walking time
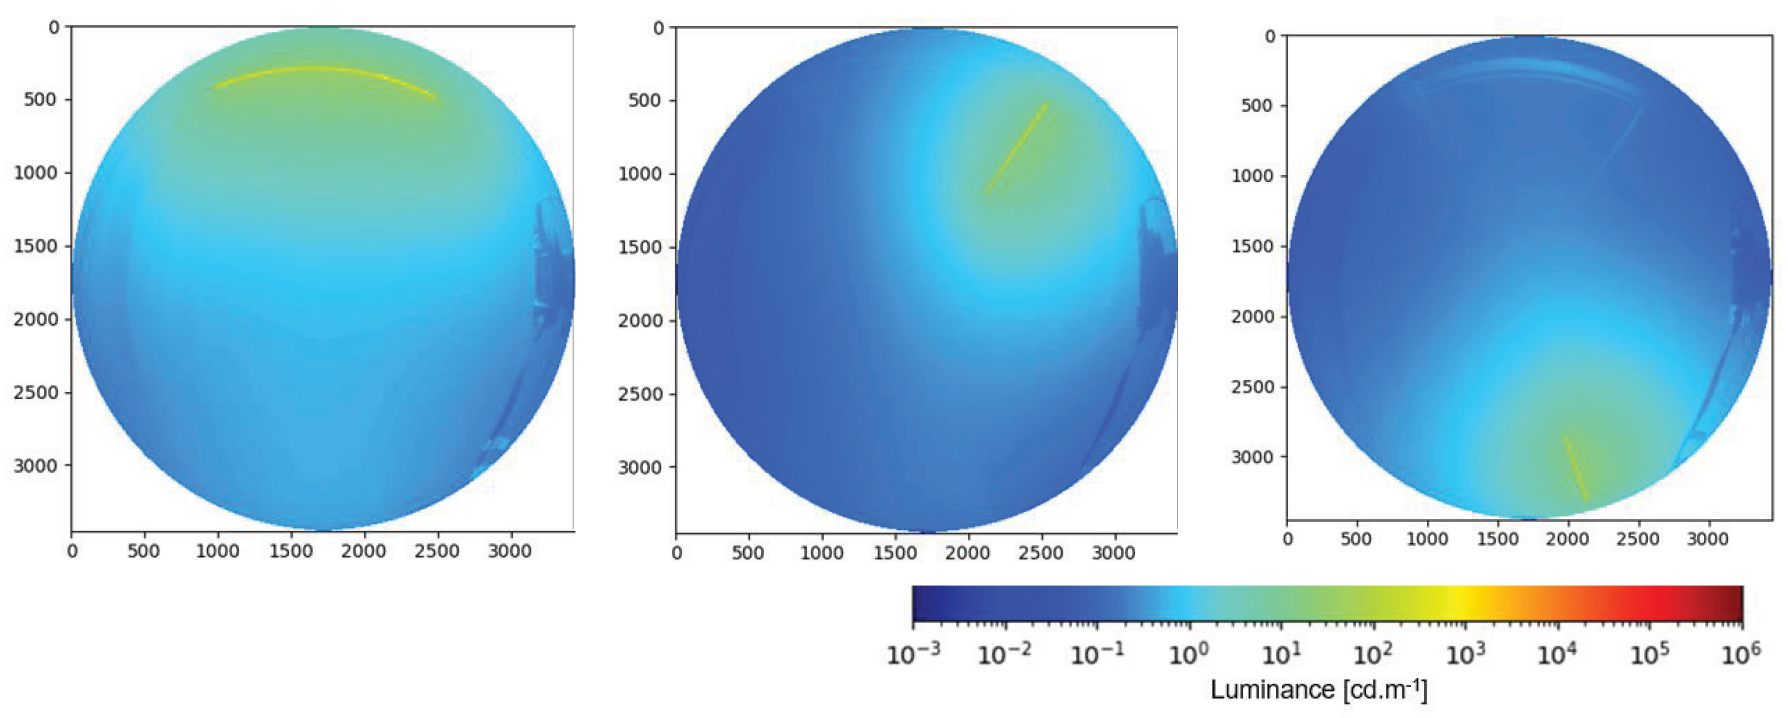
Luminance distribution from 11 m distance (3000 cd m−2, Cs = 1.0). These illustrate pattern-A (left), pattern-B (middle) and pattern-C (right)
3.3 Effect of lighting installation interval
The installation interval of lighting for reliable evacuation guidance was compared, and the results for walking time are shown in Figure 11. The values of average walking time of Figure 11 are shown in the Appendix. An example of luminance distribution is shown in Figure 12. The average walking time for lighting pattern-E, which was installed continuously, was shorter in many conditions than lighting pattern-C (installation interval 5 m) and pattern-D (installation interval 3 m), although no significant difference was confirmed. The luminance distribution showed that even if the scattering from the high-luminance induction lightings increased due to high smoke density, the lightings were still visible if they were installed continuously (pattern-E).
Effect of lighting installation interval on walking time
Luminance distribution from 11 m distance (300 cd m−2, Cs = 1.5). These illustrate pattern-C (left), pattern-D (middle) and pattern-E (right)
3.4 Effect of lighting source area
Light source area comparisons were small, with area changes of 0.16 m2 (lighting pattern-C) and 0.32 m2 (lighting pattern-F), and although there were cases where the average walking time for lighting pattern-F was shorter, no significant differences were identified.
4. Contribution of emergency exit guide light to walking time
In this study, walking time was also measured at varying smoke density for the conditions in which the lighting for reliable evacuation guidance was not lit (no lights) and for the conditions in which only an emergency exit guide light was turned on.
A comparison of the relationship between smoke density and walking time with/without an evacuation exit guide light is shown in Figure 13. The values of average walking time of Figure 13 are shown in the Appendix. The condition of no lights and smoke is the visual equivalent of black smoke during a fire, when all light is absorbed. The first condition subjects experienced was no lights and no smoke (Cs = 0 m−1), which showed the effect of condition presentation and resulted in the longest walking time, while the other walking times without light were not significantly different. When an emergency exit guide light was illuminated on the evacuation route, the walking speed was significantly shortened by the suggestion of the evacuation direction and the illumination of the road surface, similar to the results of a previous study.2,9 The results of the significant difference test (p < 0.05, *) for walking time are shown in Figure 13. Except for Cs = 2.0, walking times differed significantly depending on whether the emergency exit guide light was present or not.
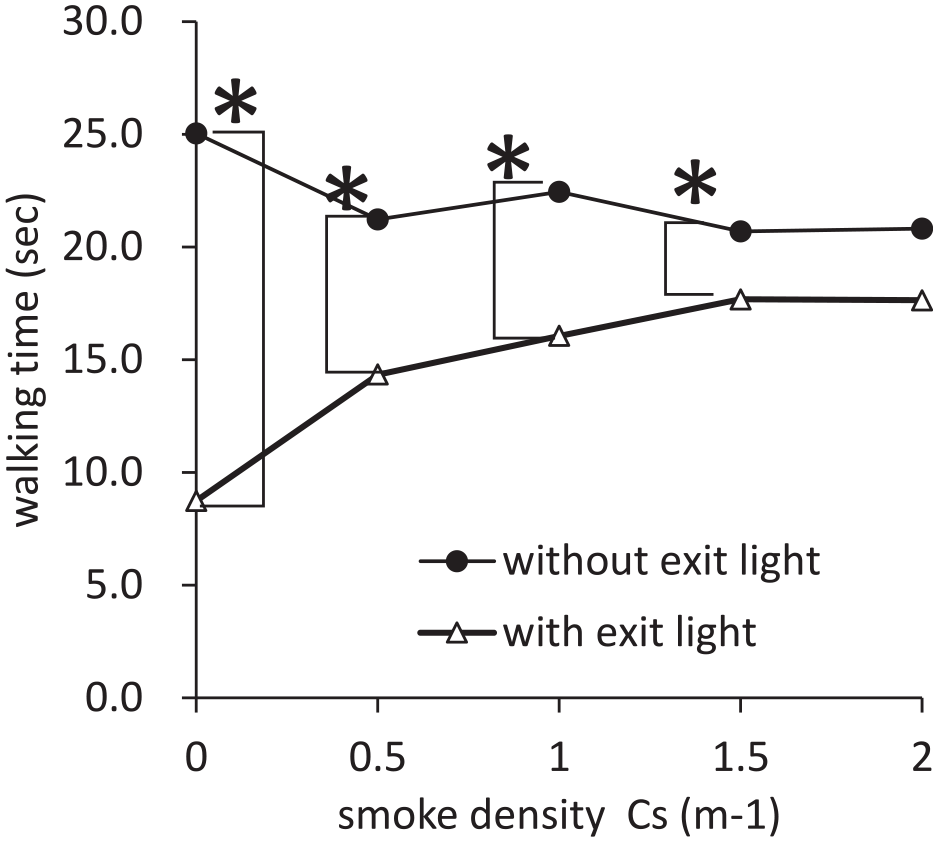
Comparison of walking time with/without an emergency exit guide light
Figure 14 shows the comparison of the effect of the presence of an emergency exit guide light for walking time. The walking time with an emergency exit guide light was about 0.9 times shorter than without the light, indicating that the relationship was independent of the light source luminance of lighting for reliable evacuation guidance. The emergency exit guide light is an important sign that indicates the final exit point. Since the experimental space was only 11 m long, the difference between the presence and absence of the emergency exit guide light may vary depending on the length and complexity of the evacuation route and differences in lighting conditions. Future studies are needed.
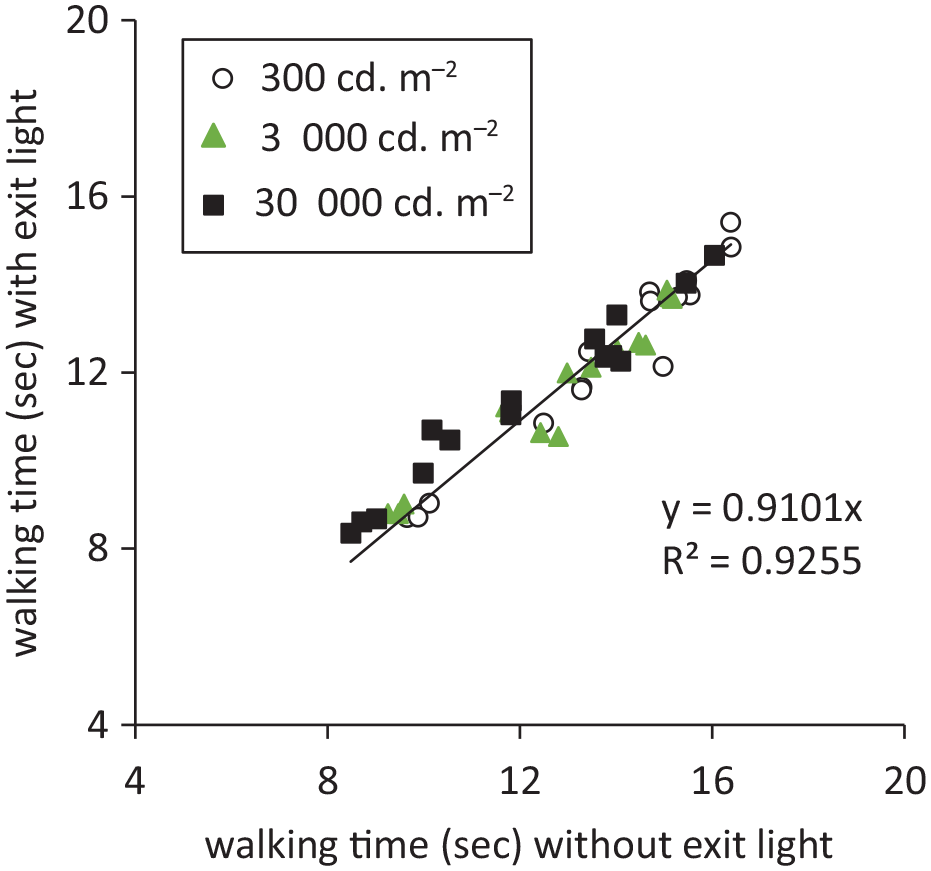
Comparison of the effect of an emergency exit guide light on walking time
5. Visibility of evacuation exit guide light
The rating scales of Figure 3 used in this research are considered to be equally spaced. In the preliminary analysis, the results of all the scales were checked, and the scales to be focused on were discussed and confirmed to be possible. The light source luminance of each pattern for reliable evacuation guidance was compared, and the results for the ‘invisible’ evaluation ratio of ‘visibility of evacuation exit guide light’ are shown in Figure 15. The values of the ‘invisible’ evaluation ratio of visibility of the evacuation guide light in Figure 15 are shown in the Appendix. At Cs = 0.5, the visibility of the evacuation guide light 11 m away became ‘invisible’ depending on the light source luminance, indicating that the effect of scattered light was greater at higher luminance. The results of the significant difference test (p < 0.05, *) for ‘invisible’ evaluation ratio at different light source luminance are shown in Figure 15. A multiple comparison test using the Bonferroni method was performed to check which light source luminance had significant differences. The results confirmed a significant difference between 300 cd m−2 and 3000 cd m−2 with the largest difference in luminance. This means that in the early stages of a fire (Cs = 0.5), low luminance of the light source of the reliable evacuation guidance light effectively reduces invisible evaluation.
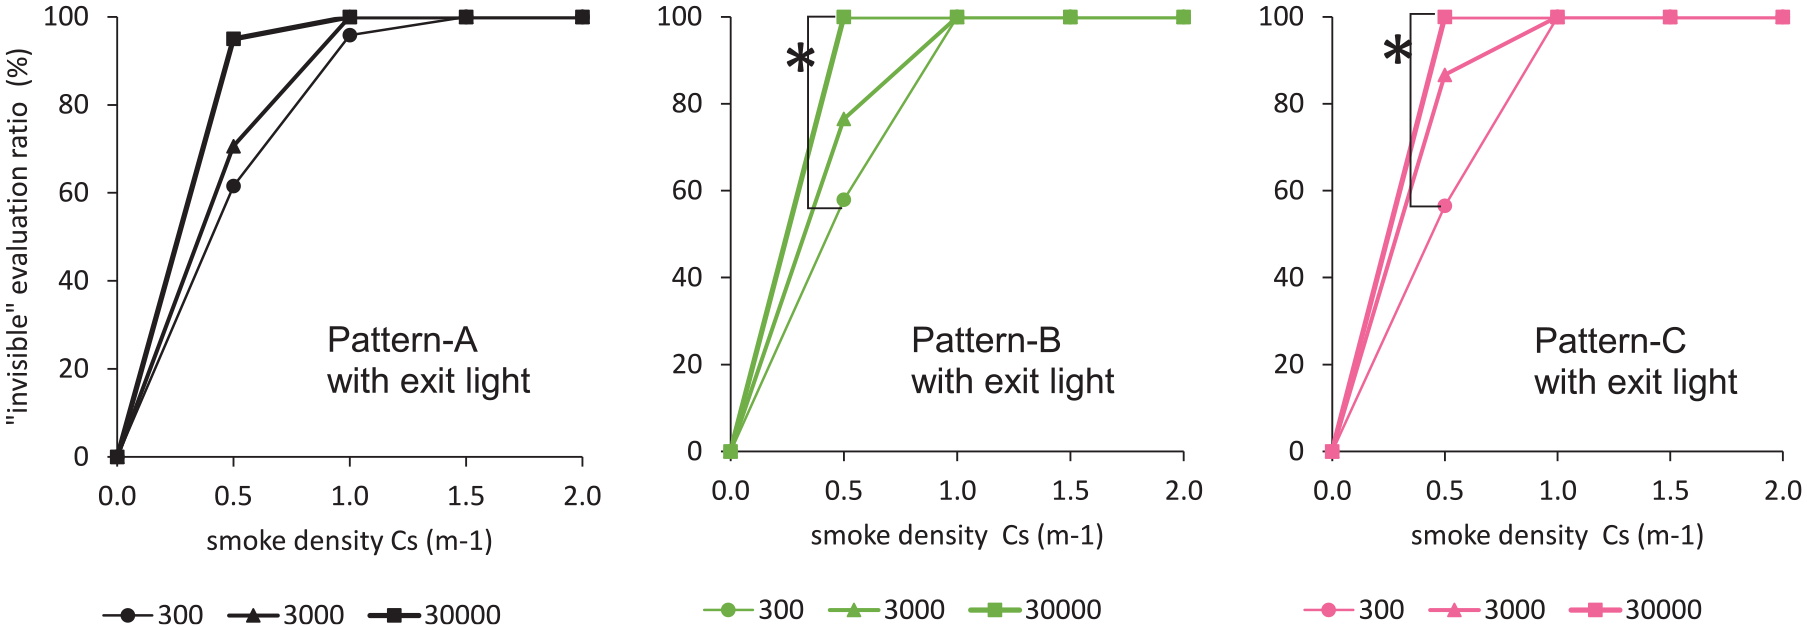
Effect of light source luminance on visibility of the evacuation guide light
6. Visibility of next lighting for reliable evacuation guidance
6.1 Effect of lighting installation position
The installation position of each pattern for reliable evacuation guidance was compared, and the results for the ‘invisible’ evaluation ratio of ‘visibility of next lighting for reliable evacuation guidance’ are shown in Figure 16. The values of the ‘invisible’ evaluation ratio of visibility of the next LED light in Figure 16 are shown in the Appendix. To ensure the visibility of evacuation exit guide lights, it would be better to install guide lighting fixtures in places other than the ceiling surface (floor surface or handrail) to effectively guide people to evacuation sites. ‘Invisible’ evaluation ratio of the next LED lighting visibility was A (ceiling, perpendicular) > B (ceiling, parallel) > C (floor, parallel) in many conditions as shown in Figure 16. To ensure the visibility of evacuation exit guide lights, it would be better to install the lighting for reliable evacuation guidance in places other than the ceiling surface (floor surface or handrail) in order to effectively guide people to evacuation sites.
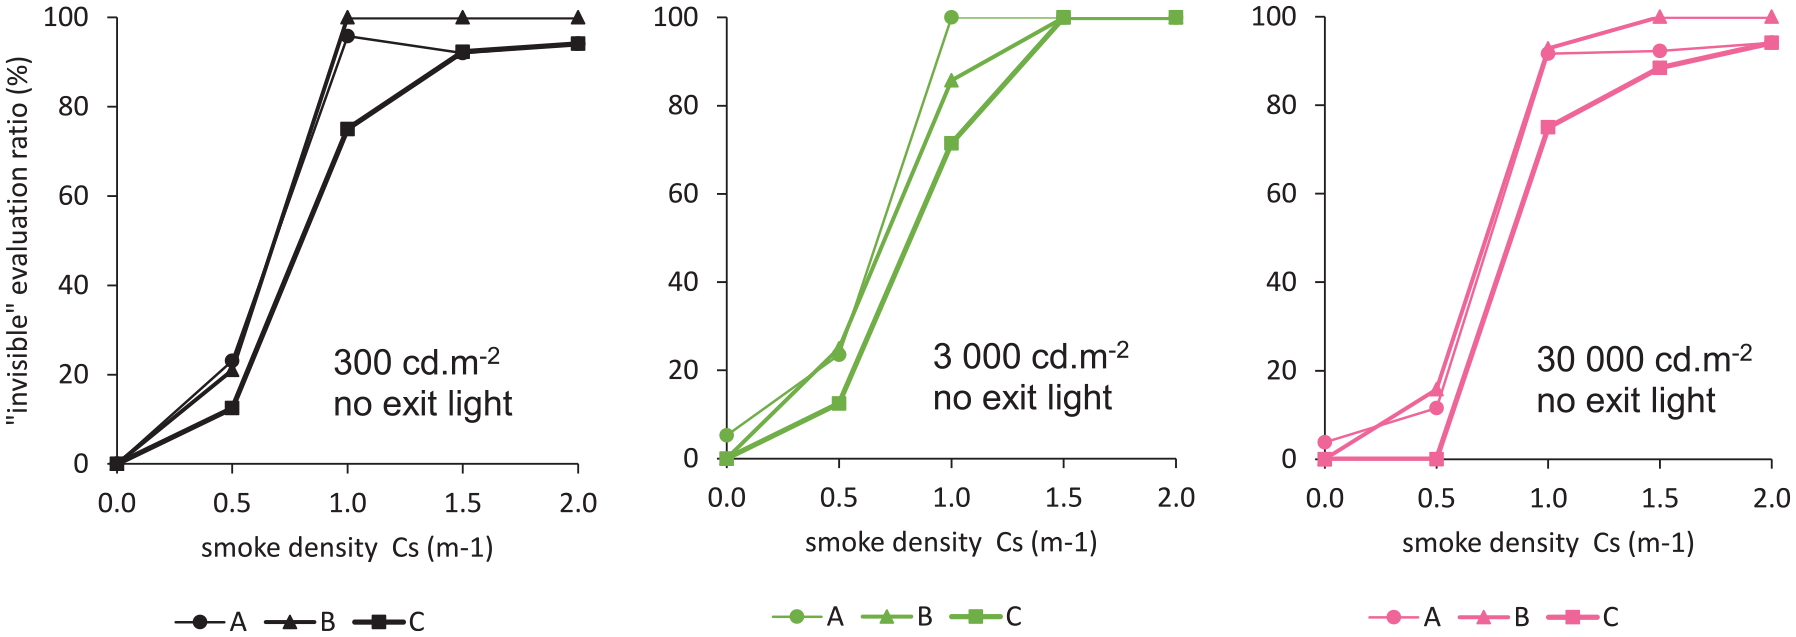
Effect of lighting installation position on visibility of next lighting for reliable evacuation guidance
6.2 Effect of lighting Installation interval
The installation interval of lighting for reliable evacuation guidance was compared, and the results for the ‘invisible’ evaluation ratio of ‘visibility of next lighting for reliable evacuation guidance’ are shown in Figure 17. The values of the ‘invisible’ evaluation ratio of visibility of the next LED light in Figure 17 are shown in the Appendix. The ‘Invisible’ evaluation ratio of the next lighting visibility was significantly different between installation intervals, and most people could see the next lighting for reliable evacuation guidance which was continuously installed, even when the smoke density was Cs = 1.5 or more. The luminance distribution in Figure 12 showed that even if the scattering from the high-luminance induction lightings increased due to high smoke density, the lightings were still visible if they were installed continuously. Considering that 60% of the respondents answered that they could not see the lighting when the installation interval was 3 m, it is considered important to install the induction lighting continuously from below to effectively guide people towards the evacuation direction during a fire smoke. The results of the significant difference test (p < 0.05, *) for ‘invisible’ evaluation at different intervals are shown in Figure 17. A multiple comparison test using the Bonferroni method was performed to check which installation interval had significant differences. The results confirmed significant differences between pattern-C and pattern-E, which differ by 4 m in installation spacing, as well as between pattern-C and pattern-D, and pattern-D and pattern-E, which differ by 2 m in installation spacing.
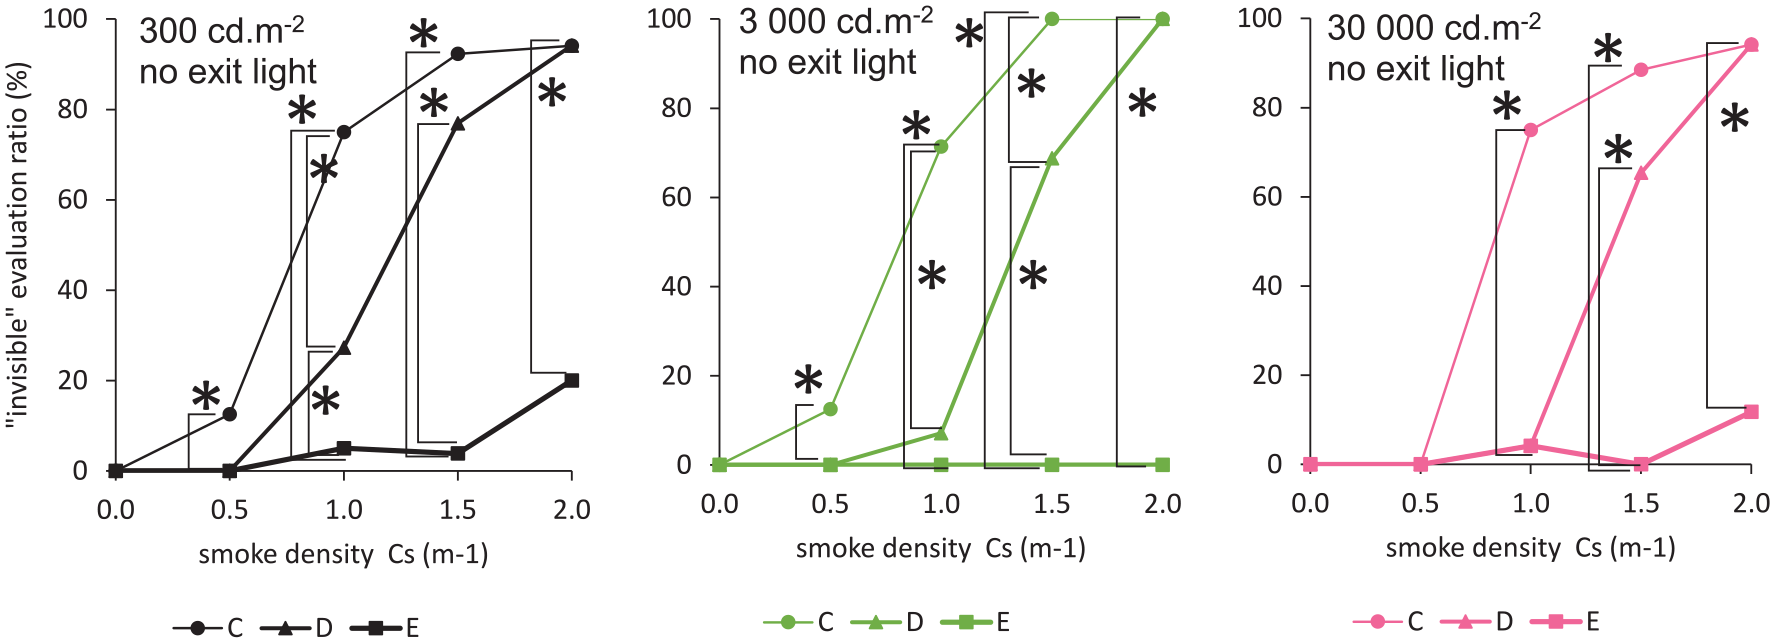
Effect of lighting installation interval on visibility of next lighting for reliable evacuation guidance
7. Ease of advancing with lighting for reliable evacuation guidance
Figure 18 shows the results of ‘can’t advance’ evaluation ratio of ‘ease of advancing to evacuation area’ for lighting pattern-A to pattern-F. Lighting pattern-E, in which guidance lighting is continuously installed on the floor, has the smallest evaluation ratio. The values of the ‘can’t advance’ evaluation ratio of ease of advancing to evacuation in Figure 18 are shown in the Appendix. The higher the light source luminance, the smaller the evaluation ratio, even in high smoke density conditions where the next LED lighting for reliable evacuation guidance was not visible. This indicates that light sources scatter white smoke and make the path brighter, as higher light source luminance naturally results in more scattered light, thus increasing the percentage of people willing to move forward. The results of the significant difference test (p < 0.05, *) for ‘can’t advance’ evaluation at different patterns are shown in Figure 18. A multiple comparison test using the Bonferroni method was performed to check which pattern had significant differences. The results confirmed significant differences among three combinations of patterns C, D and E. No significant differences were identified for the three combinations of patterns A, B and C.
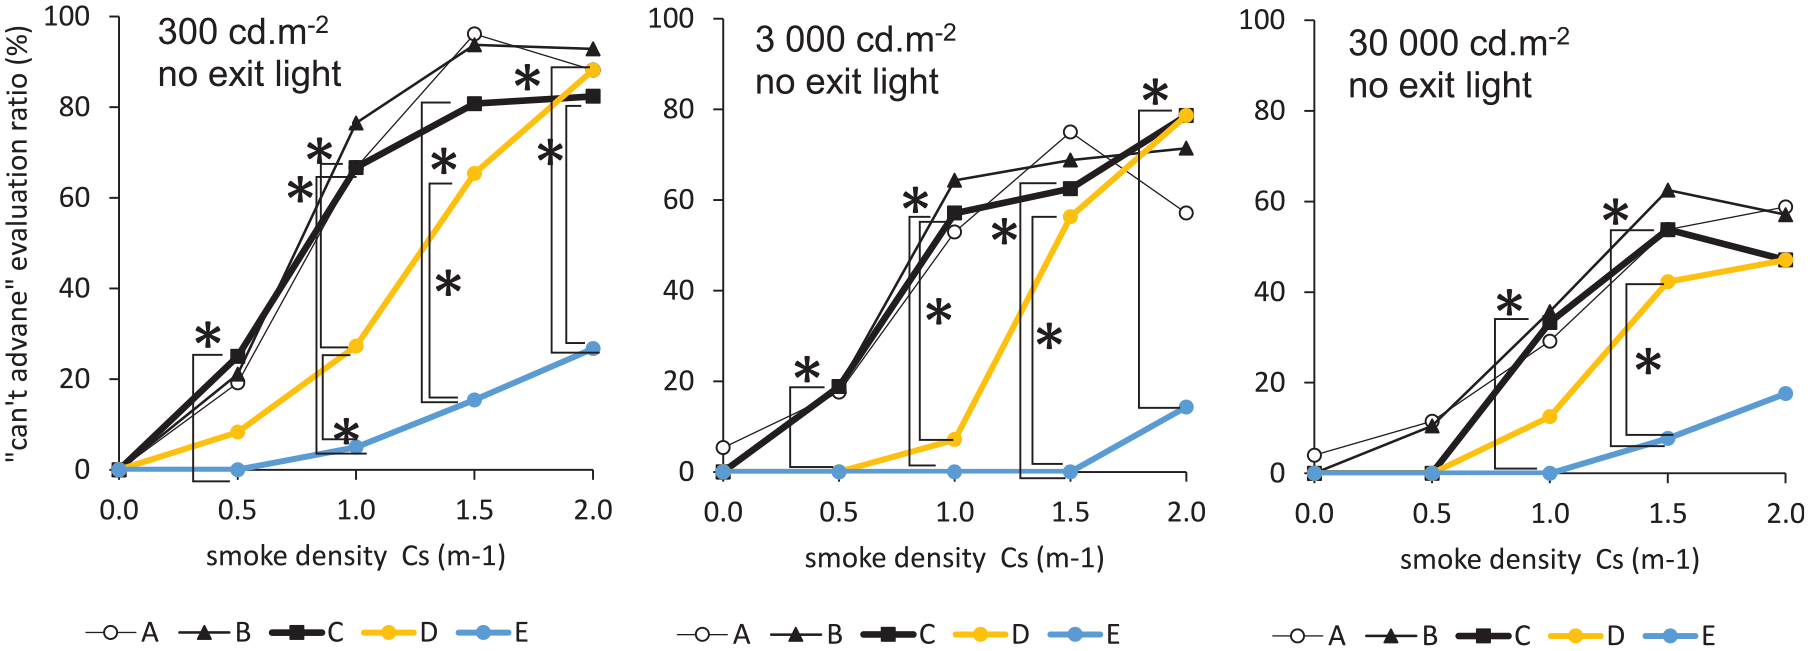
The ‘can’t advance’ evaluation ratio of ‘ease of advancing to evacuation area’
Since it was thought that the brightness of the evacuation route itself mitigated the difficulty of advancing, the relationship between vertical illuminance at the starting point and the ‘can’t advance’ evaluation ratio is shown in Figure 19. Although there are many data where the evaluation ratio decreases as the vertical illuminance increases, there are some data in which the evaluation ratio is less than 30% even at low illuminance, as in lighting pattern-E. It suggests that the luminance distribution in the field of view also affects the evaluation.
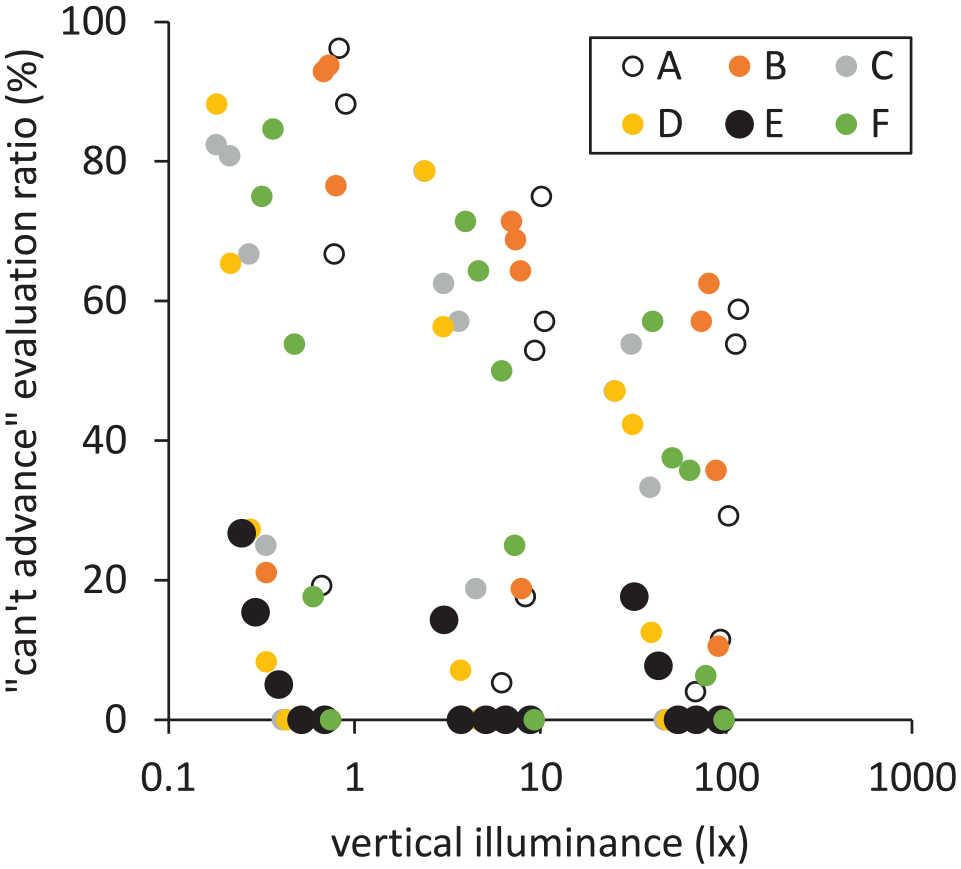
Relationship between the ‘can’t advance’ evaluation ratio of ‘ease of advancing to evacuation area’ and vertical illuminance
8. Acceptability as an evacuation route and lighting for reliable evacuation guidance
Acceptability, as well as difficulty in advancing, tended to be more acceptable with shorter intervals and higher luminance of the lighting for reliable evacuation guidance. Comparing the pre- and post-walking evaluations, the post-walking evaluations were better than the pre-walking evaluations, and this was especially true under conditions of low smoke density.
9. Discussion
As in many fire evacuation behaviour studies, this study uses a smoke generator that simulates white smoke. This device has been used in a variety of applications, including fire drill activities and stage sets, and can be used in combination with a circulator to create a uniform and constant concentration in a compartment. The smoke solution for the smoke generator is easy to manage, and the white smoke produced by it does not adhere to walls and other surfaces, making it easy to return the experimental space to its original state. The actual fire conditions assumed in this experiment were the white smoke generated during the initial stages of combustion and the scattering of water particles in the air during firefighting, including sprinklers, when the temperature in the compartment was not high and people could evacuate. However, when the fire progresses to flaming combustion, soot and other substances are generated in large quantities as a result of the intense combustion and become black smoke, which adheres to all objects, including walls and light sources, and significantly affects reflectance and transmittance. Light emitted from lighting fixtures in this state is absorbed rather than scattered, but the lighting fixtures are damaged by the hot fire smoke in the first place, making it difficult for evacuees to survive. In other words, it is very important to evacuate quickly in the limited time and severe environment of a fire, and the results of this research have revealed new possibilities and effectiveness in the lighting design of evacuation routes.
The roles of lighting during evacuation are to ‘grasp the shape of the evacuation route’, ‘ensure visibility of the evacuation route’, ‘guide people to the exit’, ‘clearly indicate the exit’ and ‘relieve a sense of uneasiness’. The results of this study indicate that smoke density has a significant effect on evacuation behaviour, and that the higher the smoke density, the slower the walking speed and the greater the psychological burden. However, the use of high light source luminance and continuous installation of lighting for reliable evacuation guidance can support evacuation behaviour even in a high smoke density environment. In addition to conventional emergency exit guide lights (‘clearly indicating exits’) and emergency lighting (‘ensuring minimum visibility of evacuation routes’), to properly and actively ‘guide evacuees to exits’ and ‘eliminate their sense of uneasiness’, lighting design of evacuation routes based on the distribution of luminance of evacuees’ visual field is necessary and will be further studied.
The experimental space in this study was a simple, straight corridor with a length of only 12 m. However, actual urban and architectural spaces are complex and vast, making route finding difficult. The Fire Service Law obliges passageway guidance lights to be installed in passageways with bends, but the light source luminance is less than 300 cd m−2, making it difficult to see through smoke. Therefore, lighting that actively guides people to evacuate, as proposed in this study, will be necessary. These issues will be studied in the future.
Footnotes
Appendix
‘Can’t advance’ evaluation ratio of ease of advancing to evacuation concerning Figure 18
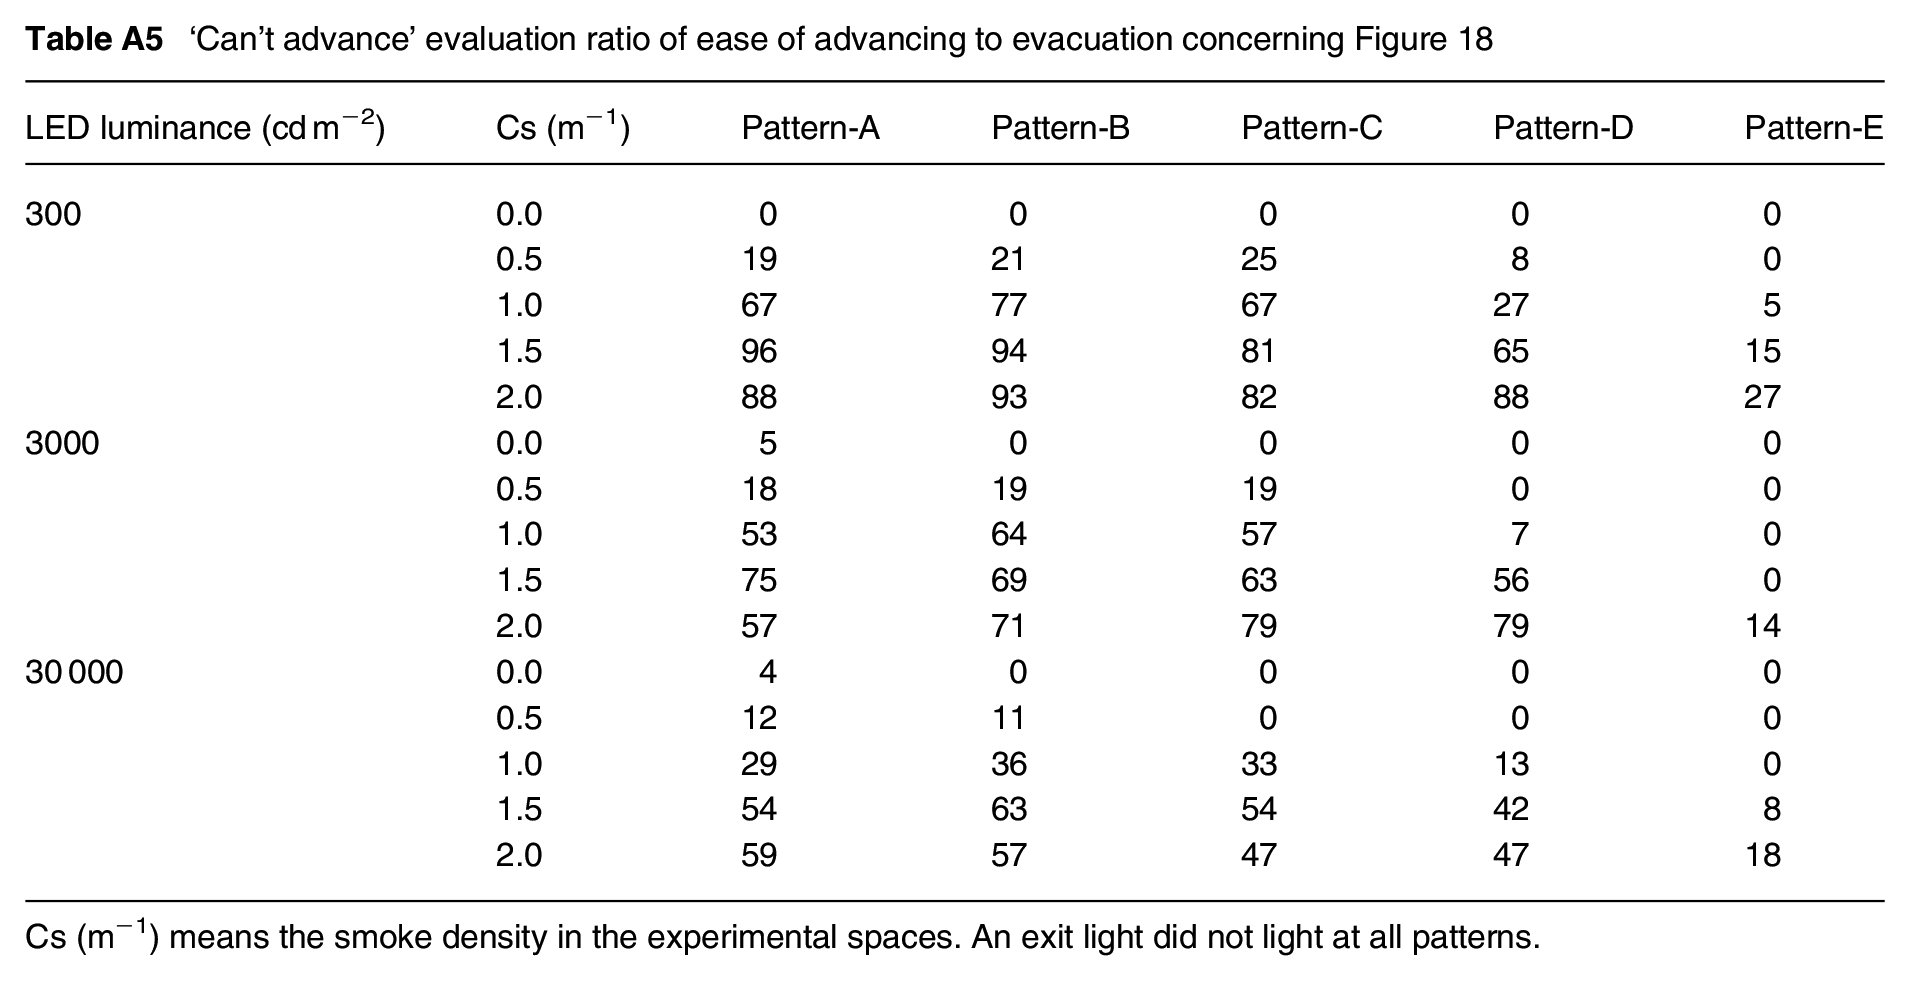
| LED luminance (cd m−2) | Cs (m−1) | Pattern-A | Pattern-B | Pattern-C | Pattern-D | Pattern-E |
|---|---|---|---|---|---|---|
| 300 | 0.0 | 0 | 0 | 0 | 0 | 0 |
| 0.5 | 19 | 21 | 25 | 8 | 0 | |
| 1.0 | 67 | 77 | 67 | 27 | 5 | |
| 1.5 | 96 | 94 | 81 | 65 | 15 | |
| 2.0 | 88 | 93 | 82 | 88 | 27 | |
| 3000 | 0.0 | 5 | 0 | 0 | 0 | 0 |
| 0.5 | 18 | 19 | 19 | 0 | 0 | |
| 1.0 | 53 | 64 | 57 | 7 | 0 | |
| 1.5 | 75 | 69 | 63 | 56 | 0 | |
| 2.0 | 57 | 71 | 79 | 79 | 14 | |
| 30 000 | 0.0 | 4 | 0 | 0 | 0 | 0 |
| 0.5 | 12 | 11 | 0 | 0 | 0 | |
| 1.0 | 29 | 36 | 33 | 13 | 0 | |
| 1.5 | 54 | 63 | 54 | 42 | 8 | |
| 2.0 | 59 | 57 | 47 | 47 | 18 |
Cs (m−1) means the smoke density in the experimental spaces. An exit light did not light at all patterns.
Acknowledgements
We would like to express our gratitude to the staff of the Toyama Fire Academy for providing the experimental environment, and to Masashi Niwa of the University of Toyama for his cooperation in data analysis. A version of this work was also published in the Proceedings of the CIE 2023 Session.
Declaration of conflicting interests
The authors declared no potential conflicts of interest with respect to the research, authorship, and/or publication of this article.
Funding
The authors disclosed receipt of the following financial support for the research, authorship, and/or publication of this article: Yuki Akizuki was supported by the Japan Society for the Promotion of Science (JSPS) KAKENHI Grant Number JP20K04805.
Ethics approval and consent to participants
This study was approved by the research ethics committee for non-medical research of the University of Toyama (J2020009) and conformed to the principles outlined in the Declaration of Helsinki. Written informed consent was obtained from all the participants.