
Abstract
Existing colour gamut metrics for solid-state lighting and displays are typically three-dimensional descriptions that do not explicitly capture how chromatic boundaries change under electrical and thermal operating conditions. Consequently, there is a lack of quantitative understanding of two-dimensional (2D) colour gamut behaviour of RGB LED devices as a function of driving current and device temperature. This work bridges the gap by experimentally mapping the 2D colour gamut boundaries of RGB LED pixels across current and temperature ranges and proposing a model that links operating conditions to observed gamut shifts. These operating conditions are optimized by simultaneously maximizing the 2D colour gamut area and the wall-plug efficiency via a multi-objective scaled merit function. Furthermore, integrating of RGB LEDs with an added white LED (RGBW system) enabled dynamic correlated colour temperature regulation from 2000 K to 9000 K under the tested conditions, via adjustment of the white-LED drive current with compensatory RGB currents and device temperature. The 2D colour gamut variation exhibits a strong dependence on white-LED compensation, shifting from minor to significantly under specified conditions. Given this strong dependence, a novel multi-physical model integrating electrical, thermal and optical characteristics was developed to accurately predict gamuts and luminous fluxes.
1. Introduction
Increasing demand for high-performance displays has accelerated the development of micro-LED technology. In the quest for superior display performance, users generally seek features such as high brightness and vivid, high-fidelity colour reproduction. Several display parameters are critical for assessing colour performance; among these, dynamic correlated colour temperature (CCT) control and the two-dimensional (2D) colour gamut are widely used metrics for quantifying a device’s colour reproduction capabilities. 1
The 2D colour gamut denotes the area on the International Commission on Illumination (CIE) 1931(x, y) chromaticity diagram that a device can reproduce and thus directly influences perceived image quality. 2 Dynamic CCT adjustment is also important for particular applications: for example, museum lighting and cinematic rendering often require adjustable CCTs to meet conservation and artistic needs, respectively. In such contexts, a practical CCT adjustment range on the order of a few thousand kelvin (e.g. ~2000 K to 9000 K) is highly desirable.
Material and device engineering introduce specific challenges in RGB micro-LED displays. Red pixels are commonly fabricated from AlGaInP, while blue and green pixels use InGaN; this material heterogeneity leads to differences in pixel size, carrier recombination dynamics and far-field radiation patterns, all of which can affect perceived colour uniformity and gamut coverage. 3 InGaN-based green and blue pixels typically permit smaller pixel geometries and exhibit lower surface recombination rates than AlGaInP red pixels, resulting in unequal sensitivity to scaling and manufacturing variation.
Colour gamut and CCT are sensitive to changes in the chromaticity of individual primaries. In RGB trichromatic LED displays, the 2D colour gamut can shift when the chromaticity coordinate of any primary LED channel changes. 4 In particular, a shift in the chromaticity coordinate of any R, G or B primary will alter the 2D gamut boundary, and self-heating of LEDs often causes electroluminescence spectra to redshift and broaden with increased drive power, producing measurable gamut shifts. 5 These effects highlight the need to consider both electrical (drive current) and thermal (junction/device temperature) variables when assessing real-world gamut performance.
Integration of a white LED with RGB primaries (RGBW architectures) provides additional degrees of freedom for colour control. 6 Adding a white channel can enlarge the representable chromaticity region and permit dynamic CCT regulation via RGB compensation while holding the white LED CCT fixed. Experimental reports indicate that, through appropriate RGB compensation, the effective CCT can be modulated over several thousand kelvins in practice. 7
A range of technical strategies has been developed to improve LED display performance and achieve strict colour tolerances. Packaging and phosphor-engineering methods such as optimized chip-on-board processes and controlled phosphor formulations improve spectral accuracy and reduce variability.8,9 Spectral optimization algorithms, including genetic algorithms and multi-objective solvers, have been applied to maximize gamut area or to tune circadian efficacy while meeting gamut and luminance constraints.10,11 Real-time colour-mixing and multi-channel control algorithms have also been proposed to enhance spectral quality in five- and four-component LED systems.12,13
Robust characterization and modelling complement these engineering approaches. Studies of photometric, electrical and thermal behaviour have produced models that relate junction temperature, drive current and spectral shifts to metrics such as luminous flux, circadian action factors and peak-wavelength distributions; such models are valuable for driver design and thermal management in commercial displays.14–17 Nonetheless, a systematic experimental mapping of 2D colour gamut boundary changes across combined electrical and thermal operating ranges, together with an assessment of how RGBW integration affects those boundaries, remains limited in the literature.
Here, the 2D colour gamut boundaries of RGB and RGBW pixel configurations are experimentally mapped as functions of drive current and device temperature, and a predictive framework linking operating conditions to the observed gamut shifts is presented. These results provide practical guidance for colour management and thermal/electrical design in LED-based display and lighting systems.
This study experimentally investigates the 2D colour gamut of RGB LED sources, with additional optical contribution from a white LED channel used for colour compensation. In RGBW LED systems, the stabilized 2D colour gamut results from the combined interaction of RGB drive currents, heatsink temperature and the compensatory optical contribution of the white channel. The resulting deviations in colour under variations of temperature and current in compensated RGB LED systems are more intricate than those observed in conventional tricolour LEDs, due to additional spectral contributions from the compensating light source. To validate our proposed multi-physical model, we compare its predictions with measured colour gamuts boundaries, demonstrating close agreement between simulated and experimental results. Finally, the 2D colour gamuts were modelled using experimental measurements of electrical, thermal and optical characteristics, and LED electroluminescence principles were applied to predict gamut variations across the tested operating conditions.
2. Background
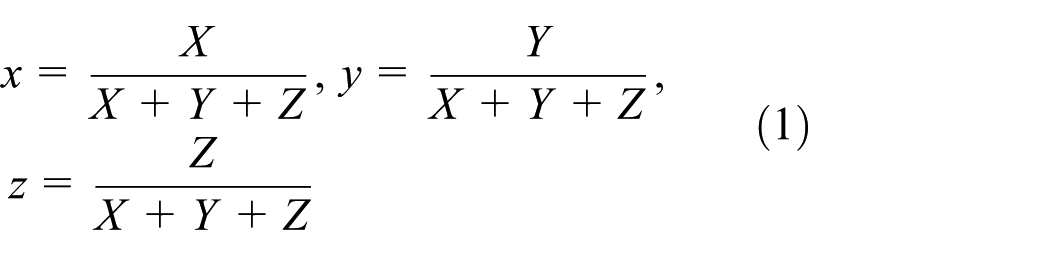
In the CIE 1931 colour space, 18 the chromaticity coordinates (x, y, z) are defined from the tristimulus values X, Y and Z as shown in Equation (1).
Since the Y tristimulus value is a proportional to the luminance (and thus to the luminous flux Φv), we can express chromaticity coordinates (x, y) directly in terms of Φv as shown in Equation (2).
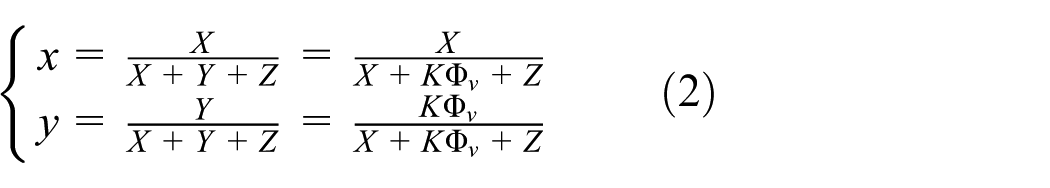
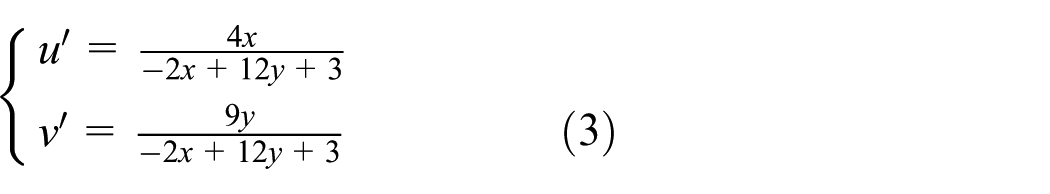
where K is the coefficient that relates the CIE Y tristimulus value to the luminous flux Φv. The conversion between the CIE 1931 (x, y) chromaticity coordinates and the CIE 1976 UCS diagram (u′, v′) is defined by Equation (3).
Under the classical, linear colour-mixing assumption (Grassmann’s law), 19 any target colour with mixture tristimulus values (Xm, Ym, Zm) can be matched by summing the contributions of red, green and blue primaries, as given in Equation (4).
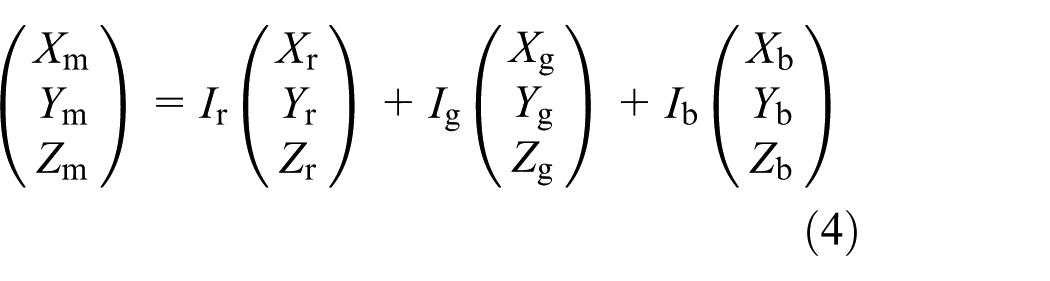
where Ir, Ig and Ib are driving current for red, green and blue LEDs, respectively, and (Xr, Yr, Zr) are the tristimulus values for red LED per unit current at a reference heatsink temperature. Grassmann’s law asserts that these contributions add linearly to the tristimulus domain.
However, real LEDs exhibit nonlinear dependencies of both spectral output and flux on current and junction temperature.20–22 Consequently, the stabilized 2D colour gamut of compensated RGB sources emerges from the coupled effects of Ir, Ig, Ib and heatsink temperature Ths. In our work, we first experimentally characterized how variations in driving currents (Ir, Ig, Ib) and heatsink temperature Ths induce nonlinear shifts in the chromaticity coordinates – deviations that cannot be captured by simple linear mixing. We then embedded these empirical relationships into a multi-physical model that integrates electrical, thermal and optical behaviours. This combined approach enables accurate prediction of the nonlinear 2D colour gamut under compensation-light adjustments, capturing the true performance envelope of RGB LED sources.
The chromaticity stability in RGB LED sources is strongly influenced by the heatsink temperature (Ths) and electrical current (Ir, Ig and Ib) of the red, green and blue LEDs. Therefore, the chromaticity coordinates of each LED can be expressed as functions of these operating parameters as shown in Equation (5).

where fi captures the nonlinear dependence of the CIE 1931 tristimulus ratios on current and temperature. The 2D colour gamut S is defined as the triangular area in the CIE 1976 chromaticity diagram enclosed by the three primary coordinates as shown in Equation (6).
Since each
3. Method
3.1 Nonlinear relationship between 2D colour gamut and luminous flux in RGBW LEDs
The combined luminous flux of an RGB LED source was defined as the sum of individual fluxes from the red, green and blue channels (Φr, Φg, Φb). Because luminous flux was determined by the spectral power distribution (SPD) of each LED, typical operating ranges yielded an ordering of channel outputs such that Φg > Φr > Φb. Let Φt denote the target luminous flux of the combined source. There were four operating regimes in the following:
(a) If Φt < min{Φr, Φg, Φb}, all three channels could individually reach Φt at full drive. The achievable 2D colour gamut was the maximal triangle defined by the primary chromaticities
(b) If Φr > Φt > Φb, the blue channels alone could not meet Φt. A white LED with flux
(c) If Φg > Φt > Φr > Φb, both blue and red channels fell short individually. Compensation fluxes
(d) If Φt > Φg > Φr > Φb, no primary channel could achieve required target luminous flux Φt alone. Compensation fluxes
Each case illustrated how compensation light intensity modified the corner points of the chromaticity triangle and thus altered the 2D colour gamut. Once Φt was met, the resulting CCT was then determined by the mixing ratios of RGB and white channels and therefore varied according to the chosen compensation strategy. This approach cleanly separated the luminous-flux requirement Φt from the CCT outcome, while Figure 1 illustrated exactly when and how white-LED compensation was invoked to satisfy the flux target. By explicitly linking Φt, currents (Ir, Ig and Ib), and heatsink temperature Ths to SPD-dependent fluxes and chromaticities, the proposed model captured these nonlinear gamut variations under real operating conditions.
The 2D colour gamut variation of RGB LED sources with compensatory luminous flux of white LED: (a) without compensation, (b) compensation to blue LED, (c) compensation to red and blue LED and (d) compensation to red, green and blue LED
It was noted that LED power increased with decreasing luminous flux and lower luminous efficacy after reaching the maximum point. 23 As current and temperature increased, the luminous efficiency of InGaN/GaN interfaces decreased, which could be explained by tunnelling of electrons from the interfaces and by auger recombination and built-in piezoelectric fields. 24 These thermal and electrical effects also induced chromaticity shift, making both the 2D colour gamut and wall-plug efficiency highly dependent on photometric, chromatic, electrical and thermal characteristics.
In this work, the operated conditions (Ir, Ig, Ib, Ths) of RGB LED sources were optimized to maximize an objective function F that balanced colour gamut area S and wall-plug efficiency η of RGB LED sources, as shown in Figure 2 and Equation (7).
where wη denotes the weight assigned to wall-plug efficiency and wS denotes the weight assigned to 2D colour gamut; ηi and Si represent wall-plug efficiency and 2D colour gamut of RGB LED sources under ith operated condition, respectively; ηmin and Smin denote minimum wall-plug efficiency and 2D colour gamut, respectively and ηmax and Smax denote maximum wall-plug efficiency and 2D colour gamut, respectively. A balanced weighting wη = wS = 0.5 was adopted for the representative results. The chosen weights encoded application preferences and were not unique. If an application prioritized colour fidelity (e.g. museum lighting), a larger wS was recommended; conversely, if efficiency was critical (e.g. emergency lighting), a larger wη was appropriate. The optimization was performed for a specific target luminous flux ΦT. In practice, the differential evolution (DE) algorithm was invoked once per ΦT value: the population of candidate vectors (Ir, Ig, Ib, Ths) was initialized within the allowable bounds, and the objective function F from Equation (7) was evaluated for each candidate. Within the DE loop, the following steps were repeated until convergence (or until maximum number of generations were reached). Firstly, for each target vector xi, a mutant vector vi was formed by adding the weighted difference of two randomly chosen population members to a third (Storn & Price’s DE/rand/1 strategy). 25 In the following step, a trial vector ui was constructed by mixing components of vi and xi using binomial crossover with a fixed recombination probability. Finally, the objective F from Equation (7) was computed for ui; if F(ui) > F(xi), then xi was replaced by ui, and the global best was updated.
Flowchart of the optimisation process
A flowchart of the optimization process was shown in Figure 2. Specifically, the DE algorithm of Storn and Price was used, as implemented in Python (version 3.8.10) is an open-source programming language developed and maintained by the Python Software Foundation (PSF). The algorithm iteratively generated candidate solutions via mutation, crossover and selection to approximate the global optimum in continuous spaces. Default hyperparameters were employed (strategy = ‘DE/rand/1’, popsize = 50, mutation = [0.5, 1], recombination = 0.8, maxiter = 1000, tol = 1e−6). During each generation, DE maintained a population of candidate vectors (Ir, Ig, Ib, Ths); mutant vectors were formed by adding weighted differences between randomly selected members, followed by binomial crossover to produce trial solutions. Each trial was evaluated by the direct solver to compute the objective F in Equation (7), and superior vectors replaced their predecessors. This loop continued until convergence, driving ηi and Si towards ηmax and Smax. All numerical routines and the DE optimizer were executed in Python using NumPy and SciPy.
3.2 Nonlinear CCT control and electrothermal coupling in white LED-dominated hybrid systems
Based on the CIE 1931 colorimetric framework, this study employed McCamy’s empirical approximation to compute CCT from (x, y) chromaticity coordinates, and its expression was given as Equation (8). 19
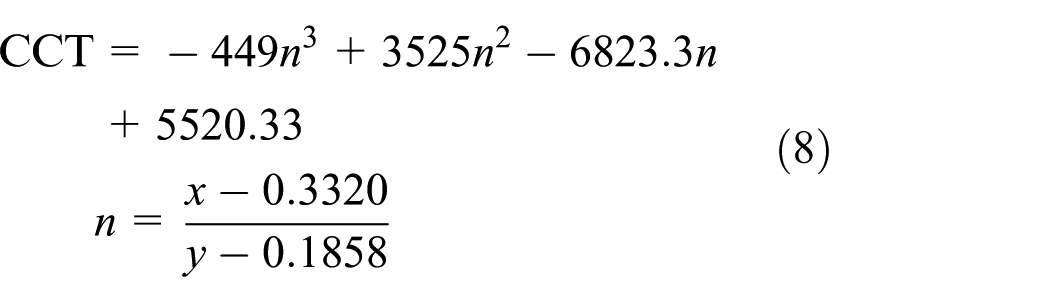
CCT describes the perceived warmth or coolness of white light along the Planckian locus, while the chromaticity difference (Δu′v′) characterizes the actual shift in the source’s chromaticity coordinates. 26 Chromaticity differences of light sources (any colour) are generally expressed by the distance in (u′, v′) coordinates, which is denoted as Δu′v′ and is calculated as the distance between two points (u′1,v′1) and (u′2,v′2) on the (u′, v′) diagram as defined in Equation (9).
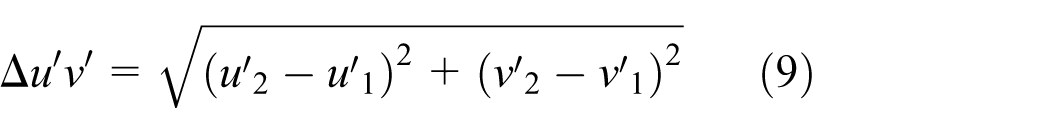
To characterize CCT and Δu′v′ modulation in the hybrid white LED RGB system, each monochromatic LED channel (red, green and blue) was combined with the white LED, maintaining the white LED’s drive current above that of the RGB sources. The absolute SPDs of the red, green, blue and white LEDs were measured as shown in Figure 3. By independently modulating the current ratios of each LED channel, the influence of auxiliary RGB components on the resultant white-light CCT was quantitatively investigated under electrothermal coupling; Δu′v′ was used to objectively evaluate the colour quality of the hybrid illumination. This approach captured the nonlinear interplay between electrical drive, junction temperature and spectral emission, and it enabled precise CCT regulation over the 2000 K to 9000 K span.
Absolute SPD of the red, green, blue and white LEDs at 50 mA (dotted lines) and 500 mA (straight lines)
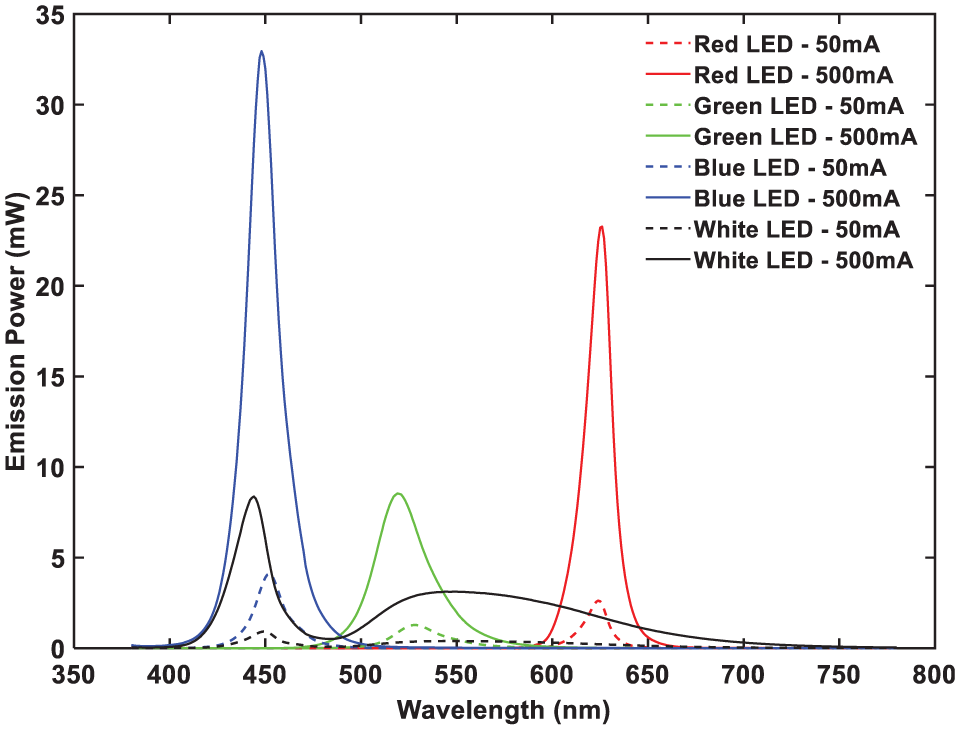
CCT modulation of white LEDs via RGB hybrid control can be categorized into three modes, each driven by independent channel adjustments:
(a) Red-channel modulation: Increasing the red contribution (620 nm) shifted chromaticity towards longer wavelengths along the Planckian locus and enabled dynamic CCT tuning from 2000 K to 6000 K by changing the red-to-white intensity ratio,20,21 as shown in Figure 4(a). It should be noted that tuning the CCT by this compensation method also introduced a chromaticity shift in the white light; the corresponding Δu′v′ values are shown in Figure 4(d).
(b) Green-channel modulation: Adding green emission (500 nm to 600 nm) filled the spectral dip of the white LED, improving colour rendering metrics, such as colour rendering index, ANSI/IES TM-30 fidelity index (Rf) and gamut index (Rg), 27 and reducing input power at a given CCT. 12 Green supplementation had limited effect on CCT range but strongly influenced gamut and efficiency, as shown in Figure 4(b). This compensation also produced shift in the white light during CCT adjustment; the corresponding Δu′v′ values are illustrated in Figure 4(e).
(c) Blue-channel modulation: Increasing blue contribution raised short-wavelength content, shifting chromaticity towards high CCT along the Planckian locus. Varying the blue-to-white intensity ratio controlled the upper CCT limit (up to 9000 K), as shown in Figure 4(c). This compensation consequently produced measurable shifts in the chromaticity of white light, expressed as Δu′v′, which are plotted in Figure 4(f).
CCT and Δu′v′ modulation characteristics of a white LED under RGB spectral compensation: (a, d) red–white, (b, e) green–white and (c, f) blue–white
3.3 Experimental Setup
An important factor affecting the colour properties of RGB LED sources was the variation in individual channel outputs. For the purpose of illustrating this point, an experimental setup had been employed, as shown in Figure 5. Each RGB LED source under test was mounted in a Peltier-cooled fixture, which both stabilized the junction temperature and actively controlled the cold-plate temperature for thermal measurements. The LEDs were optically coupled using an integrating sphere system (Everfine HAAS-2000), The Everfine HAAS-2000 is a high-precision fast spectroradiometer produced by Hangzhou Everfine Photo-E-Info Co., Ltd. ensuring accurate total flux capture. Optical measurements of RGB LED source were performed with an Everfine HAAS-2000 spectroradiometer under steady-state thermal and electrical conditions. All temperature-dependent LED parameters (such as optical power, luminous flux, CCT, chromaticity coordinates, SPD, etc.) were measured and recorded in addition to the thermal and optical measurements. After driving RGB LED sources for 20 min while keeping the heatsink temperature constant, light output and spectrum were measured.
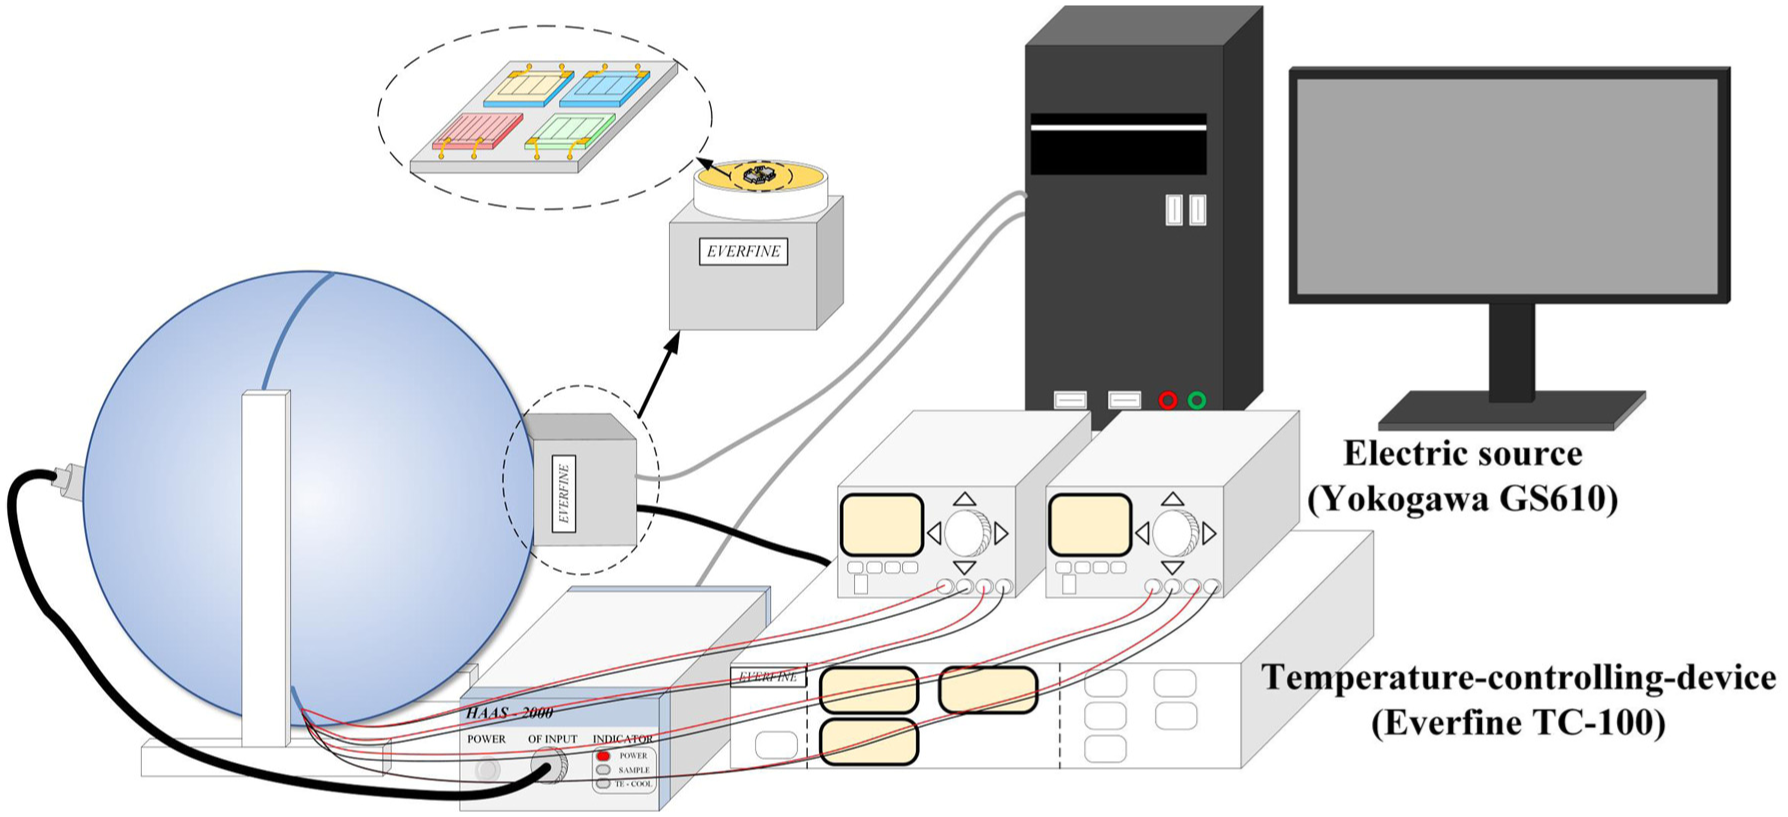
Diagram of experimental equipment
4. Results
Figure 6 shows the measured shifts in the CIE 1976 (u′, v′) chromaticity coordinates of the RGB LED sources as a function of electrical current and heatsink temperature. Figure 6(a) and (d) illustrates the red-channel behaviour in the CIE 1976 chromaticity diagram, where increasing driving current or temperature increased Δu′v′, producing a nearly linear displacement towards the diagram’s bottom-right. At a controlled heatsink temperature of 25°C and a current of 100 mA, the red, green and blue LEDs exhibited the CIE 1976 (u′, v′) chromaticity coordinates of approximately (0.5123, 0.5228), (0.0709, 0.5799) and (0.2015, 0.0807), respectively. When the heatsink temperature was 70°C, the chromaticity coordinates (u′, v′) shifted to (0.5329, 0.5198), (0.0771, 0.5790) and (0.1969, 0.0875), respectively, corresponding to Δu′, v′ offsets distance of 0.0208, 0.0063 and 0.0067, respectively. For comparison, a 50% just-noticeable difference in the white region was reported approximately 0.0013 in the CIE 1976 (u′, v′), and a five-step MacAdam region corresponds to a CIE 1976 (u′, v′) radius approximately 0.0055. 26 These numerical comparisons should be taken as practical guides: the red-channel shift (Δu′v′ = 0.0208) was large and clearly significant, whereas the green and blue shifts (Δu′v′ = 0.0063 and 0.0067) exceeded common five-step tolerances and could be perceptible or outside typical product specifications.
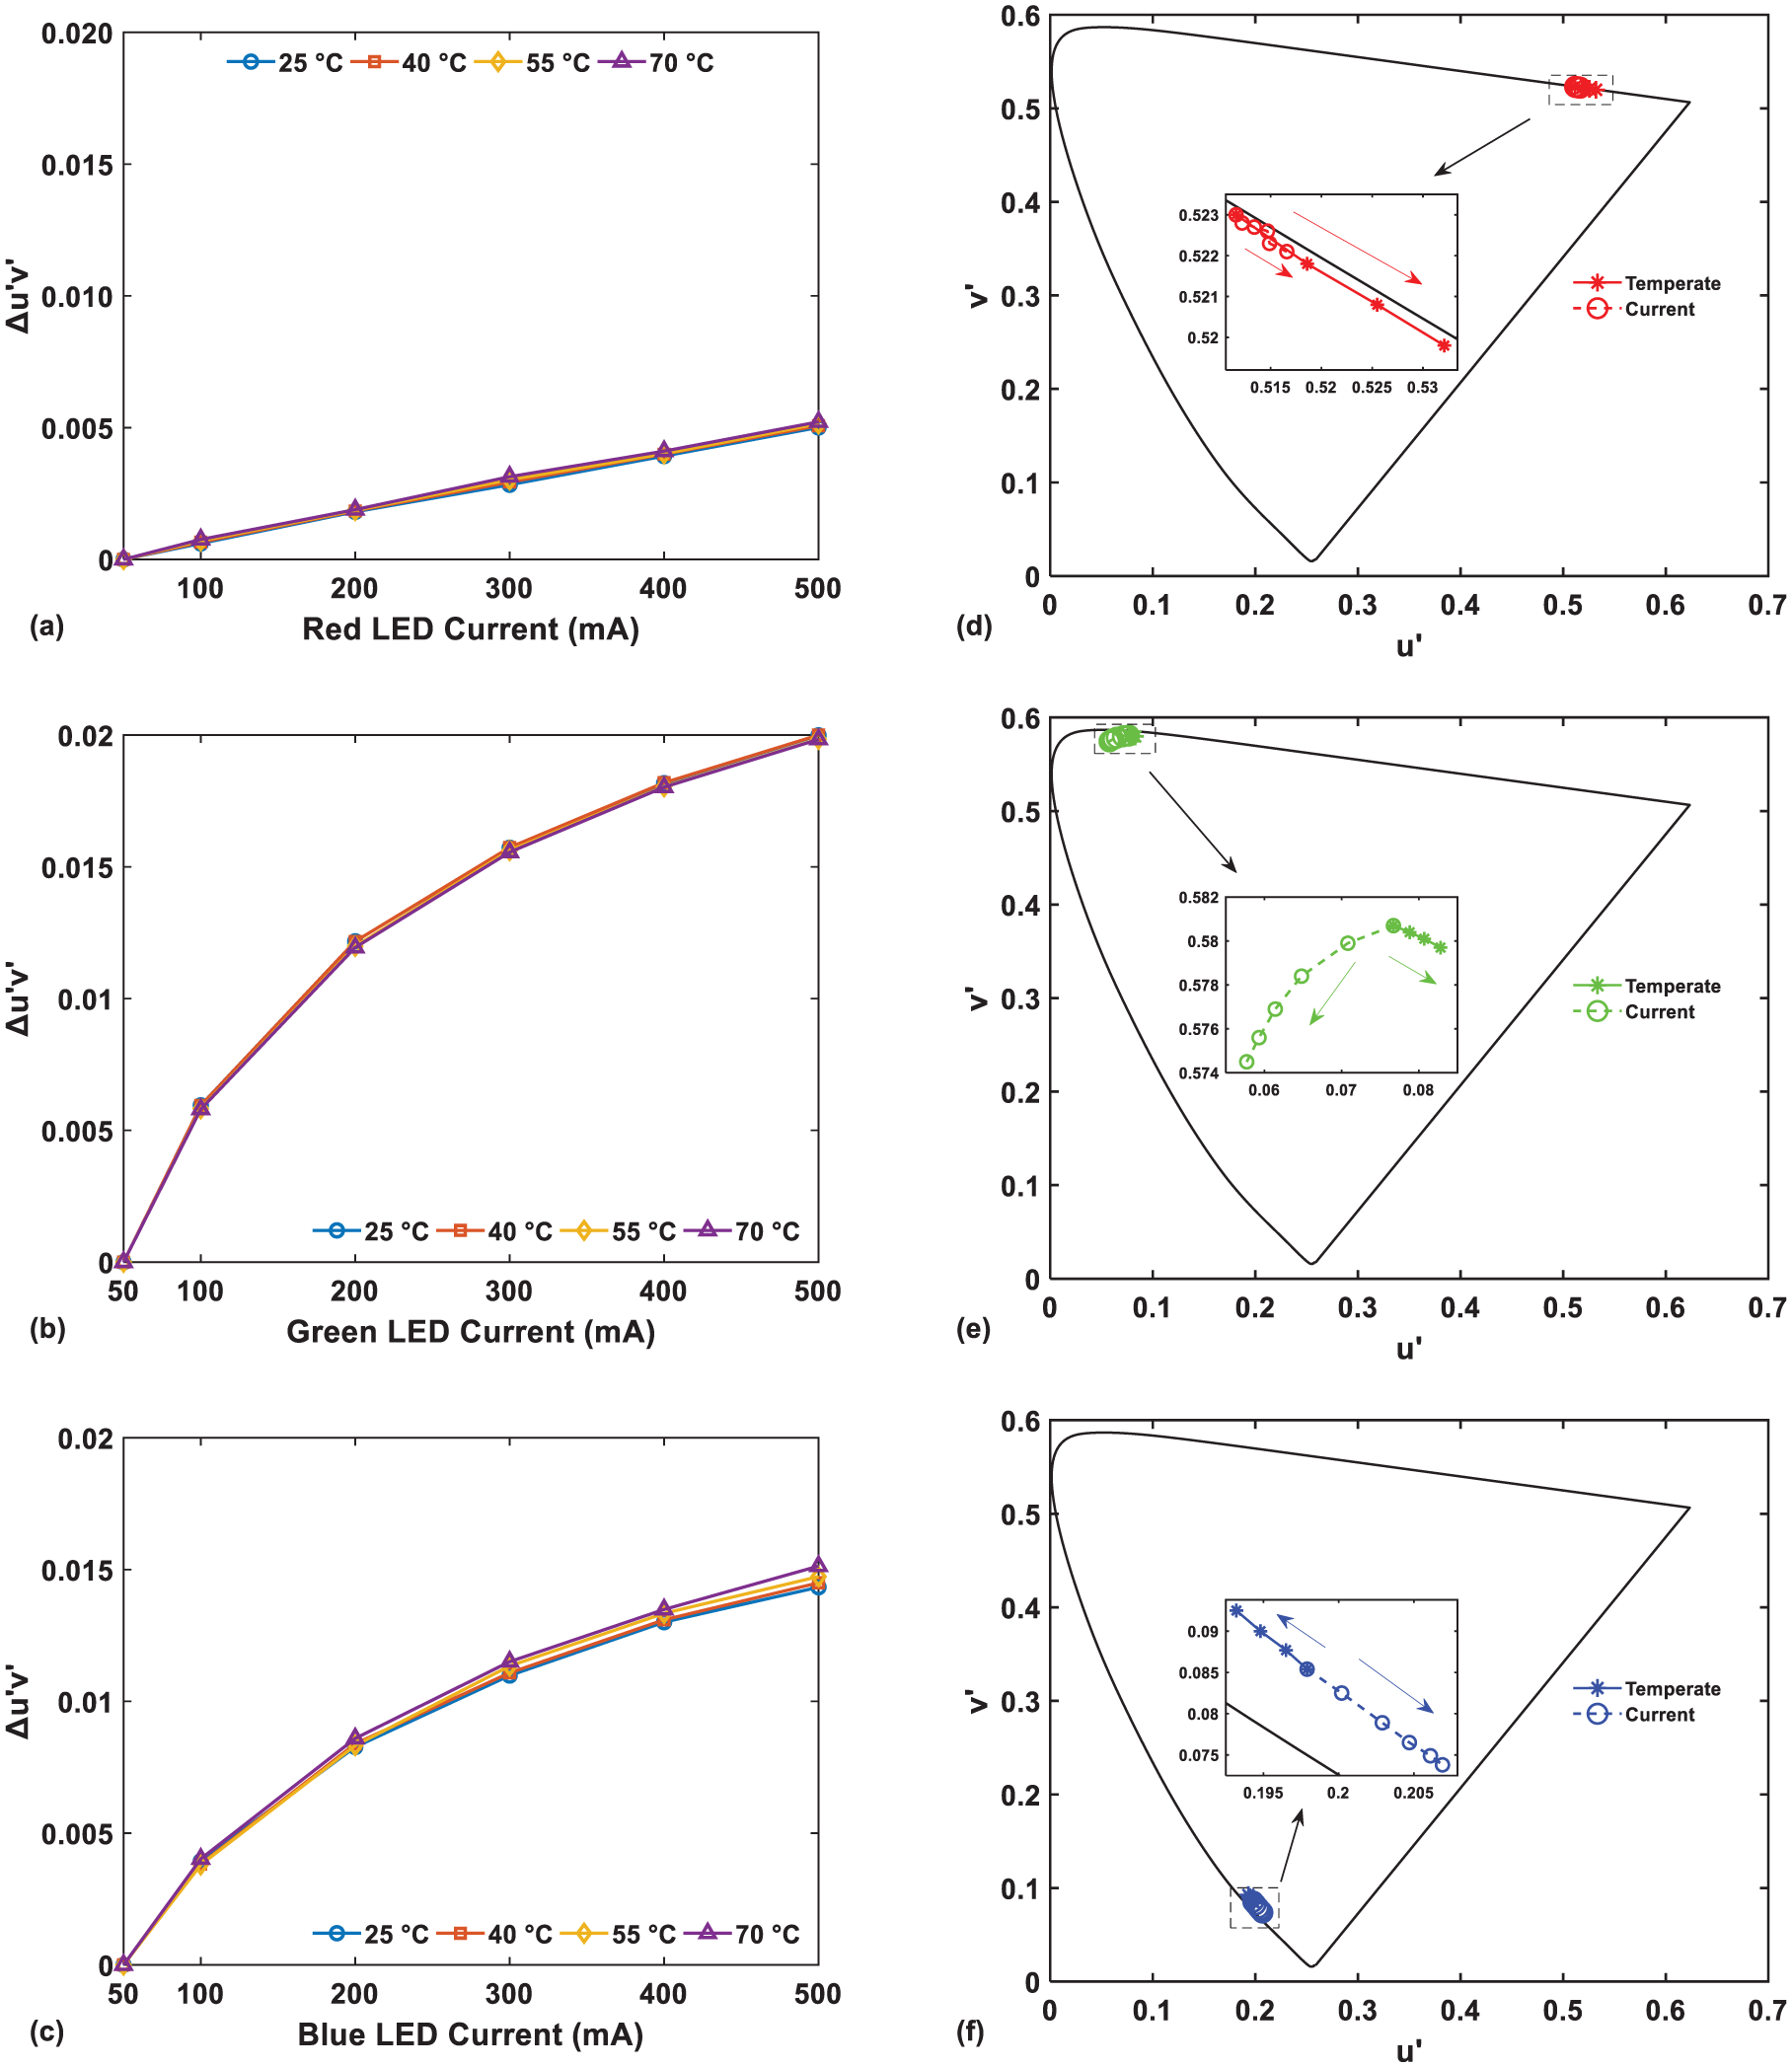
Measured Δu′v′ of RGB LEDs as functions of heatsink temperature and drive current: (a, d) red LED, (b, e) green LED and (c, f) blue LED
Figure 6(b) and (e) illustrates the green-channel behaviour in CIE 1976 chromaticity diagram; higher temperature drove u′ upward and v′ downward, moving coordinates towards the chromaticity diagram’s centre and reducing 2D colour gamut. Increasing current caused u′ to decrease and v′ to rise at low currents before falling at high currents, tracing an approximately parabolic locus in the CIE 1976 chromaticity diagram. The blue LED exhibited the opposite thermal trend, as illustrated in Figure 6(c) and (f): increasing temperature decreased u′ and increased v′, shifting the coordinates towards the top-left; at elevated temperatures, the triangular area formed by the primaries became smaller and the 2D colour gamut narrowed. Additionally, with increasing drive current, the blue-channel u′ increased and v′ decreased, shifting the chromaticity coordinates to the right at the tested temperatures. These experimental observations confirmed that chromaticity stability in RGB LEDs was governed by coupled electrothermal effects, with both junction temperature and drive current inducing measurable spectral shifts and gamut variations.
From the experimental results shown in Figure 6, the required parameters in (5) were extracted and fitted the model to predict chromaticity coordinates (u′, v′) as function of electrical current and heatsink temperature. The maximum discrepancies between the measured and calculated (u′, v′) coordinates were 0.3%, 3.81% and 2.47% for red, green and blue LEDs (at Ir = 50 mA, Ig = 50 mA, Ib = 50 mA), with average errors of 0.21%, 2.32% and 1.56%, respectively.
Substituting the predicted coordinates into Equation (6) produced the modelled 2D colour gamut polygons. Figure 7 compares the experimentally measured and calculated 2D colour gamut with different operated conditions. The maximum and average deviations between experimental and theoretical was around 0.98% and 0.48%, respectively. Therefore, the proposed nonlinear gamut model predicted 2D colour gamut model for RGB LED sources within 1% accuracy under varied operating conditions.
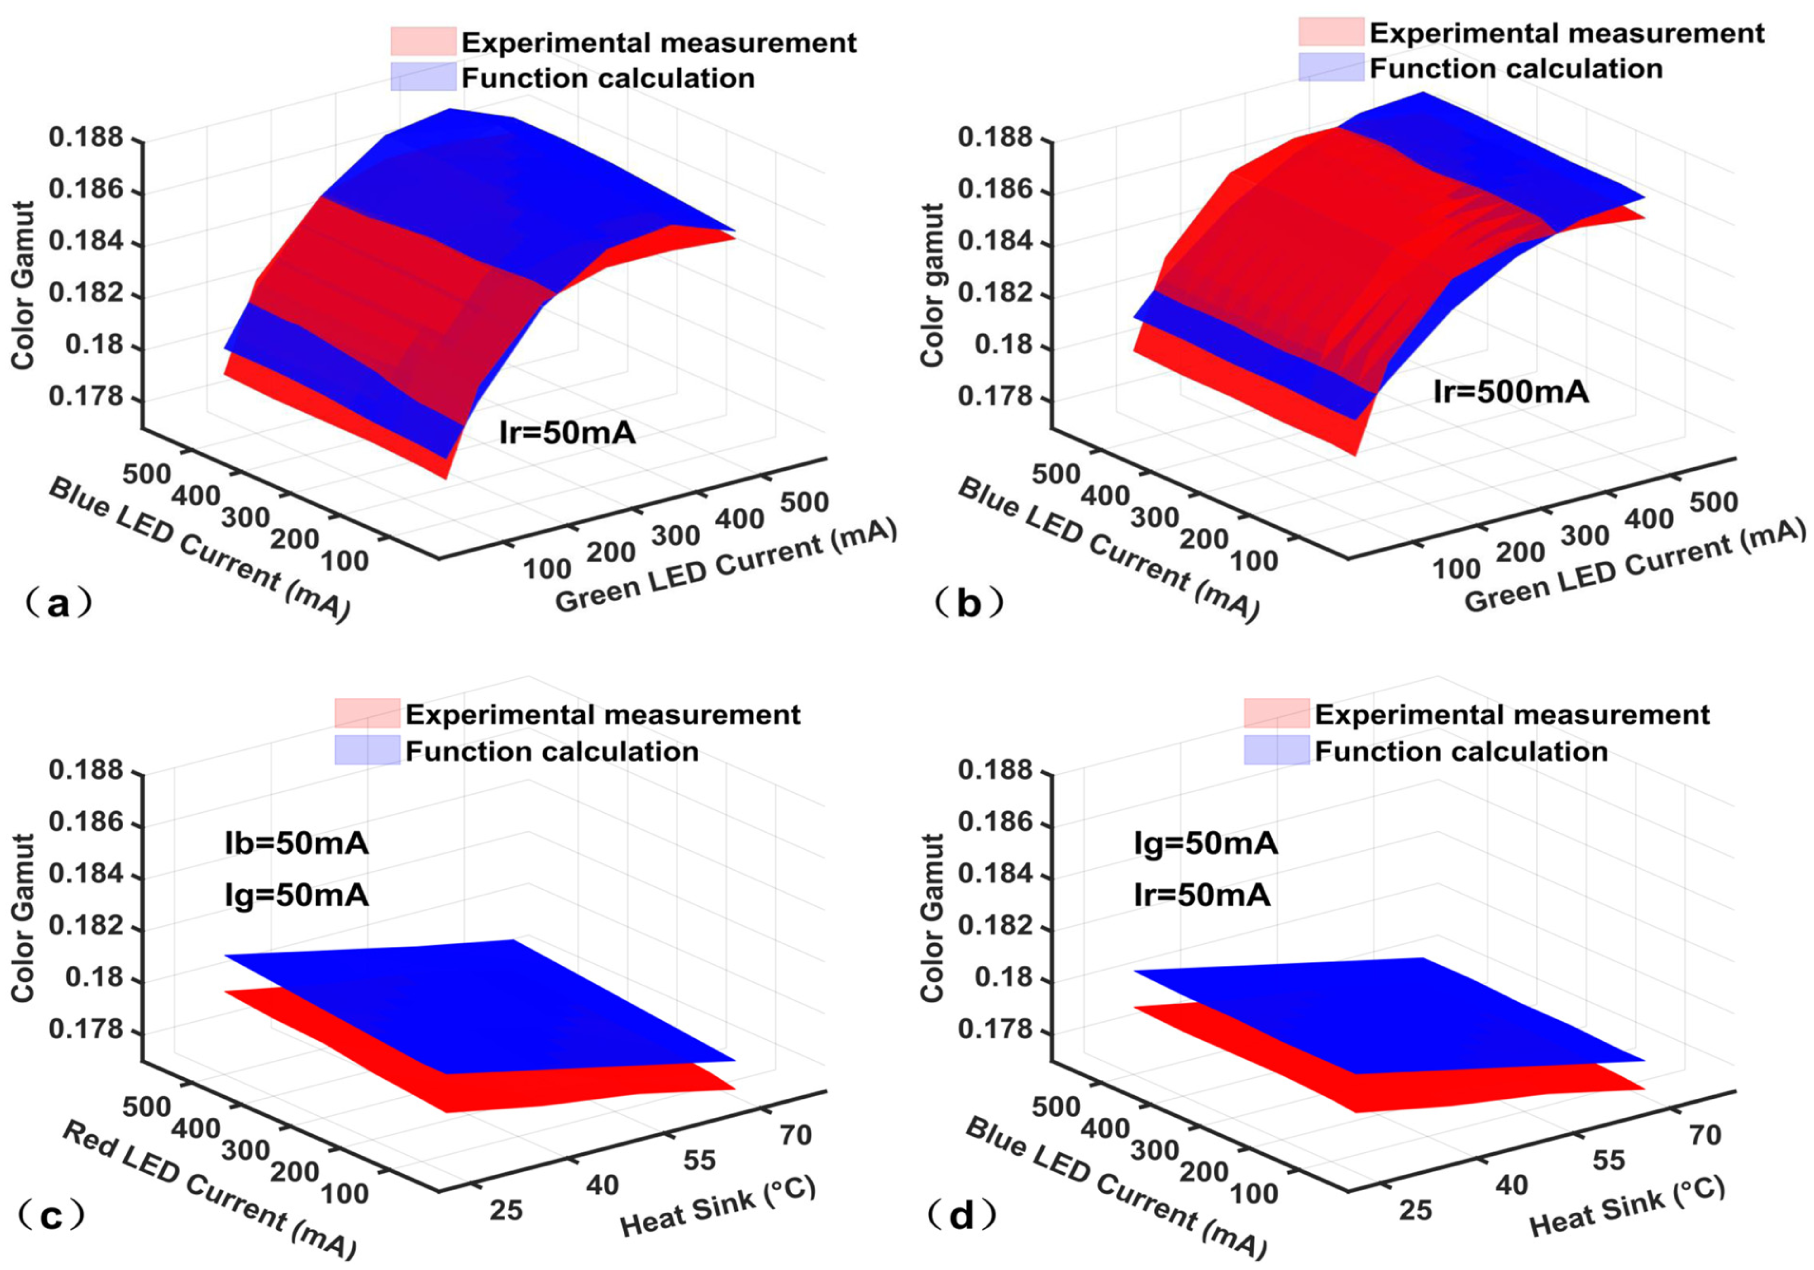
Calculated and measured 2D colour gamut of RGB LED sources under different operating conditions: (a,b) adjust the current of the green and blue LED, (c) adjust the current of the red LED and temperature of heat sink, and (d)adjust the current of the blue LED and temperature of heat sink.
The electrical current for red and blue LEDs were from 50 mA to 500 mA with other two LEDs in both conditions of 50 mA, a maximum variation of 0.5% and 0.17%, respectively, on the 2D colour gamut of RGB LED sources can lead to the mixed colour shift, which exceeded the typical three times of MacAdam ellipse tolerance of 1.5% for perceptible colour differences. 20 In contrast, an identical current sweep in the green LED source produced a larger gamut shift (ΔS = 0.0066 with variation of 3.7%), reflecting its stronger influence on the gamut boundary. Finally, thermal effects reduced LED output and further altered the gamut: the red-channel gamut variation was nearly linear with current and temperature, whereas green-channel gamut exhibited a parabolic dependence on current. These findings underscored the importance of incorporating electrothermal coupling into accurate, predictive models of RGB LED colour performance.
It was noted that the term 2D colour gamut referred to the area on a chromaticity plane that was formed by the RGB primaries. This metric was chosen because the study specifically examined how chromatic-boundary positions depended on electrical drive and heatsink temperature, representing gamuts in 2D isolated spectral/chromatic shifts from luminance effects and therefore provided a clear, compact measure of boundary displacement as a function of (Ir, Ig, Ib, Ths).
It is acknowledged that a full 3D gamut (representing chromaticity and luminance) provides a more complete description of colour reproduction for applications where luminance variation is critical. The present 2D representation therefore emphasizes spectral boundary shifts and simplifies comparison across current or temperature conditions; extension to 3D gamut volume is straightforward using the measured SPDs and luminance data and is proposed as follow-on work to evaluate perceptual and application-specific impacts.
In our RGBW hybrid system, the white LED (Cree XLamp XMLCTW-A0-0000-00C3AAAA1, Cree, Inc., USA) functioned as a dynamic compensation source, which combined a blue InGaN die with a YAG:Ce phosphor layer. According to the datasheet, 28 the white emitter typically exhibited CCT of approximately 6850 K at the rated operated conditions, with a thermal resistance from junction to case of 3.5°C/W and a temperature coefficient of voltage was −3 mV/°C. Experimental measurements under controlled conditions (drive current: 50 mA to 500 mA; heatsink temperature: 25°C to 70°C) indicated that the CCT of the white LED varied between 6403 K and 7576 K. The chromaticity coordinates shifted from (0.2001, 0.3117) to (0.2019, 0.2999) across this range. The primary role of white LED was to supplement the total luminous flux when the combined output of the red, green and blue LEDs was insufficient to meet the target luminous flux. The mixing ratio between white light and RGB light was adjusted so that target luminous flux was met while maintaining chromaticity constraints. Integrating the white LED into the RGB system expanded the tuneable range of the composite spectral system’s CCT to cover 2000 K to 9000 K. This coordinated regulation mechanism between RGB and white LEDs provided a theoretical foundation for the synergistic optimization of dynamic CCT adjustment and energy efficiency.
As shown in Figure 1, when the target luminous flux Φt did not exceed 25 lm, no white-LED compensation was required; for Φt > 25 lm, at least one channel was supplemented by the white LED, as shown in Figure 1(b) to (d). As shown in Figure 8(a), at a heatsink temperature of 25°C and Φt = 10 lm, the RGB LED sources covered 118.2% of DCI-P3 and 84.6% of Rec. 2020, respectively. Increasing Φt to 25 lm raised these coverage ratios of DCI-P3 and Rec. 2020 to 119.1% and 85.3%, respectively. When the heatsink temperature was raised to 55°C, coverage ratios over Φt = 10 lm to 25 lm varied by only 1.5% and 0.83%, specifically for the DCI-P3 and Rec. 2020 colour gamuts, respectively, whereas wall-plug efficiency dropped from 62.2% to 49.1% due to thermal droop, as shown in Figure 8(b). The peaks in coverage ratios of DCI-P3 and Rec. 2020 as the red and blue chromaticity coordinates shifted towards the diagram’s bottom-right with increasing current, enlarging the gamut triangle. In contrast, the green channel exhibited a parabolic dependence on temperature and current: its optimal luminous flux for maximum coverage shifted from 10 lm at 25°C to 25 lm at 55°C, as shown in Figure 8(c), indicating that careful selection of green-LED operating conditions was required to avoid gamut instability. Optimizing the operated conditions (Ir, Ig, Ib, Ths) via Equation (6) produced a maximum gamut Smax and maximum wall-plug efficiency ηmax of 0.1803 and 56.9%, respectively, at Ir = 74.3 mA, Ig = 26.2 mA, Ib = 319.4 mA and Ths = 25°C with Φt = 17.1 lm. Within the non-compensation flux range, the RGB LED sources therefore maintained a remarkably stable 2D colour gamut under prescribed optical and thermal conditions.
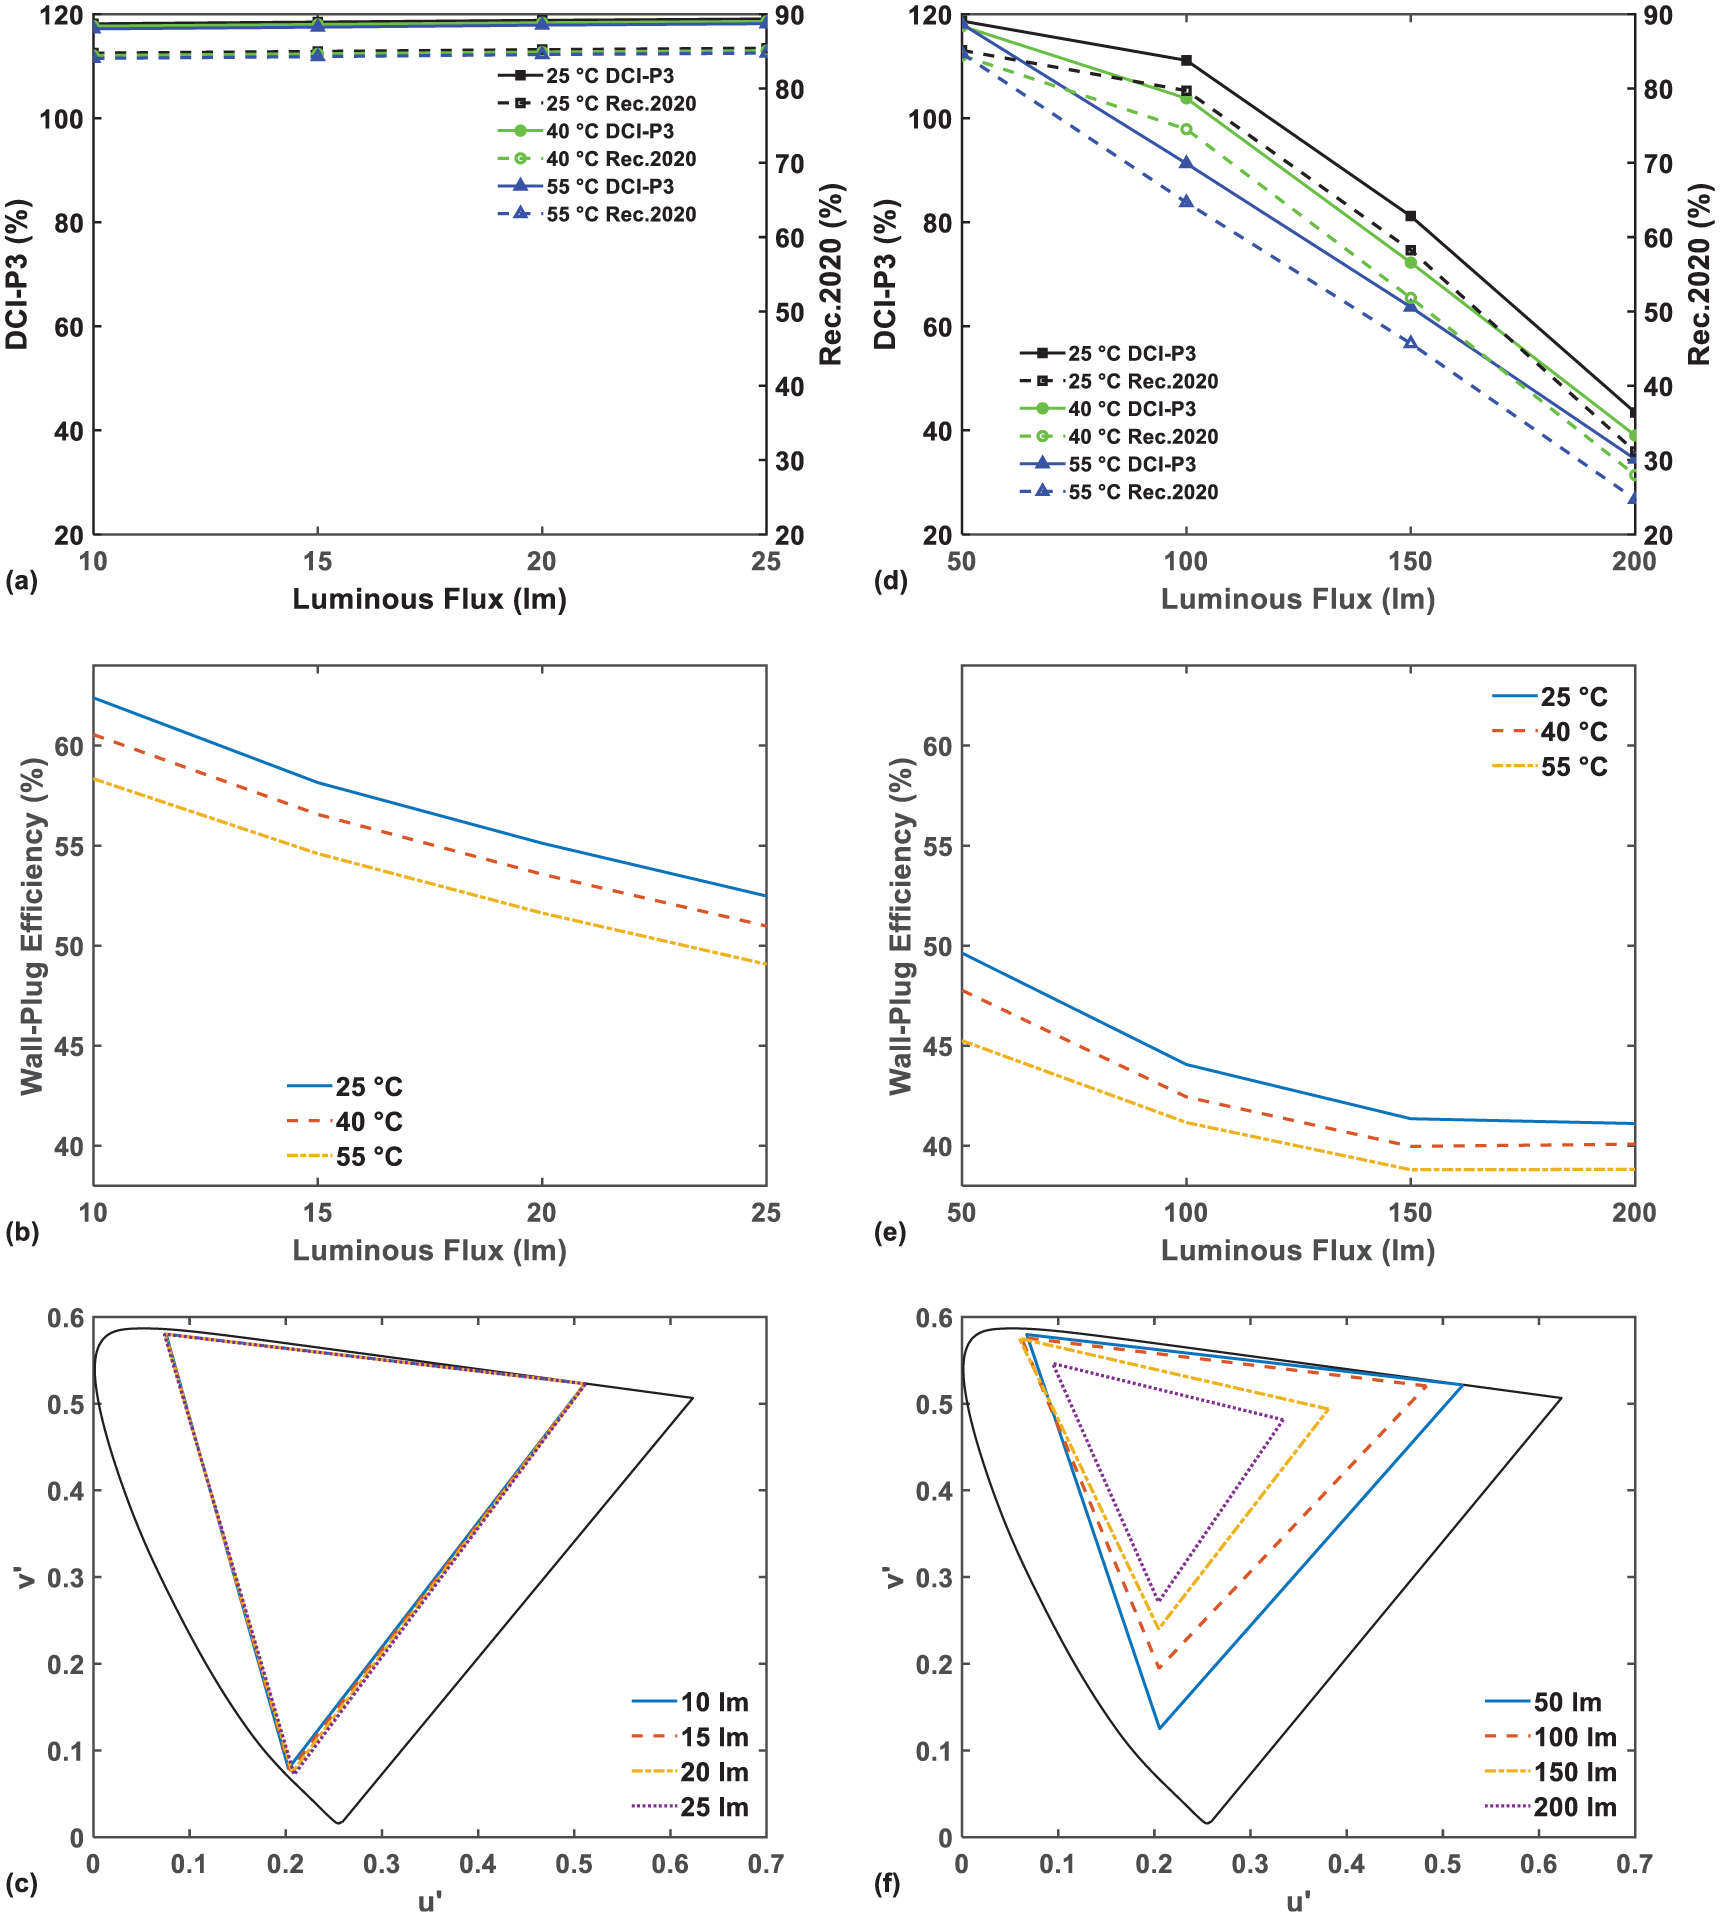
Effects of white-LED supplementation on 2D colour gamut and wall-plug efficiency of RGB LED sources across varying target luminous flux Φt. Left row (a–c): low-flux range (Φt = 10 lm to 25 lm); Right row (d–f): high-flux range (Φt = 50 lm to 200 lm). (a, d) Coverage ratios of DCI-P3 and Rec. 2020, (b, e) wall-plug efficiency, (c, f) chromaticity plots in CIE 1976 (u′, v′)
For higher flux targets, the gamut contracted. At a heatsink temperature of 25°C, increasing the target luminous flux Φt from 50 lm to 200 lm reduced DCI-P3 and Rec. 2020 coverage to 48.6% and 31.2% respectively, as shown in Figure 8(d). For the heatsink temperature of 55°C and Φt = 200 lm, these coverage ratios further dropped to 38.6% (DCI-P3) and 21.2% (Rec. 2020), corresponding to overall variations of approximately 145.5% and 187.8% across the 50 lm to 200 lm range and heatsink temperature of 25°C to 55°C span, as shown in Figure 8(f), while wall-plug efficiency dropped from 49.2% to 38.9%, as shown in Figure 8(e). This decline mirrored the well-known efficiency droop phenomenon, in which increased drive current and junction temperature elevate nonradiative recombination and reduce wall-plug efficiency, thereby highlighting the trade-off between high flux and gamut stability. Although peak DCI-P3 coverage could exceed 110%, it coincided with suboptimal wall-plug efficiency and higher power consumption, which increased system cost. Crucially, once c surpassed the white-LED compensation threshold, full 2D colour gamut operation could not be guaranteed. These practical insights motivated our multi-physical model, which predicted both 2D colour gamut and luminous flux from electrical, thermal and optical parameters and thus reduced reliance on external colorimetric instrumentation. The proposed model explained the nonlinear interdependence of factors affecting RGB LED performance and highlighted relevant characteristics reported in LED datasheets. It was therefore more meaningful to discuss 2D colour gamut around maximum wall-plug efficiency if the efficiency and cost of the wall plugs were taken into consideration.
Finally, the energy benefits of hybrid control were quantified. In RGB-based white-light CCT regulation systems, each primary channel produced distinct tuning effects. The red primary could lower the CCT from the baseline 6400 K down to approximately 2000 K, while the blue primary increased short-wavelength content and could raise the CCT into approximately 7600 K to 9000 K range. Notably, under equivalent CCT and luminous flux conditions, hybrid operation of green and white LEDs reduced system power consumption compared to standalone white-LED operation mode.
At a heatsink temperature of 25°C and within the CCT regulation band of 6600 K to 7400 K, the green–white hybrid system achieved a reduction in input power ranging from 0.12 W to 0.18 W, with an average of 0.14 W, whereas the standalone white LED consumed 0.34 W to 1.51 W. In contrast, the red–white and blue–white hybrid systems increased the input power by an average of 0.05 W and 0.07 W, respectively (Figure 9). This measurable saving underscores the practical benefit of leveraging green-channel supplementation for both colour fidelity and energy efficiency in dynamic CCT control.
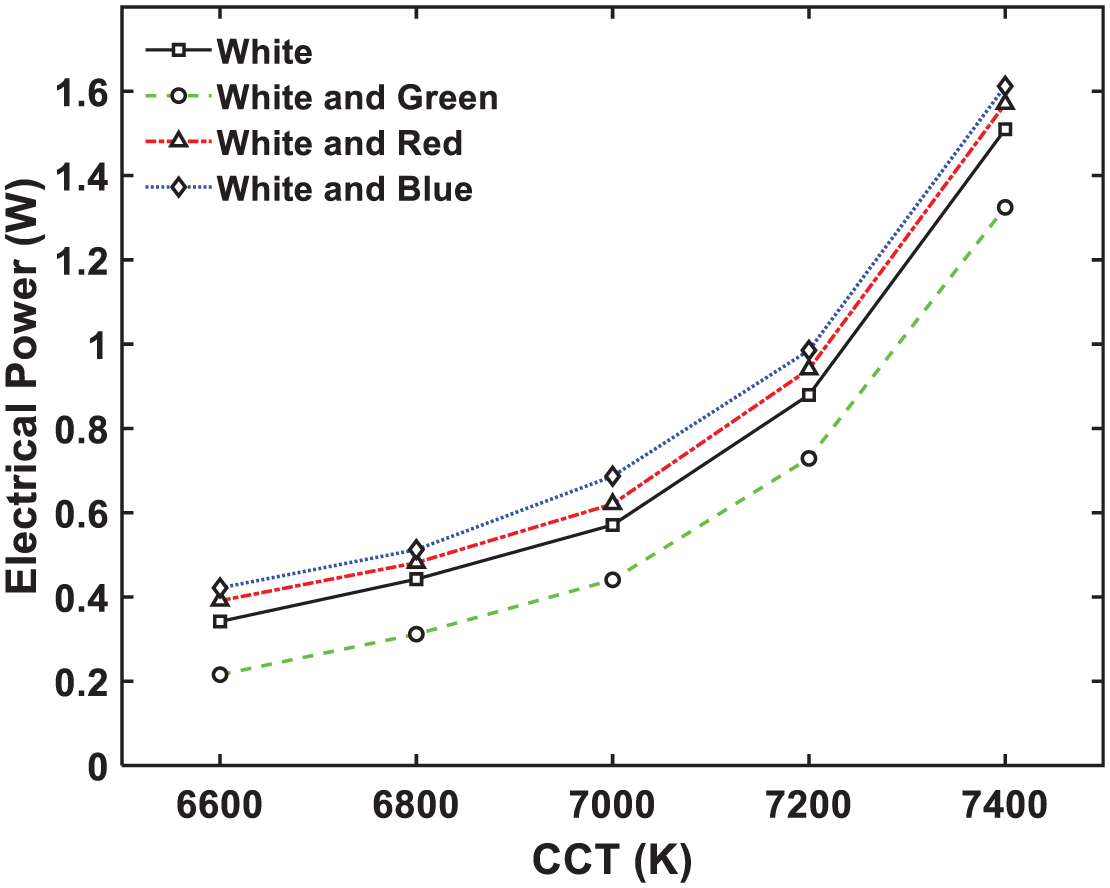
CCT versus input electrical power for the standalone white LED (black continuous line) and three hybrid configurations: white + green LED (green dashed line), white + red LED (red dashed line), white + blue LED (blue dotted line)
Several limitations should be noted. The study was purely measurement-based and did not include psychophysical testing, so the reported chromaticity shifts may not have corresponded directly to perceived colour differences in real images or video, which depended on content, local luminance distribution and observer adaptation. CCT and 2D gamut area were used as compact descriptors of spectral change, but CCT was a one-dimensional reduction and could poorly predict perceptual or biological responses for non-Planckian sources. Experimental sampling was limited in terms of drive currents, temperatures and device types; device-to-device variability, long-term ageing and differences in packaging or phosphor design may have affected the quantitative results. Accordingly, follow-up work that combines objective spectral (colorimetric) measurements with controlled psychophysical studies across a wider range of content and devices is required to establish the practical perceptual impact of the reported electrothermal gamut shifts.
Notwithstanding these limitations, the results have practical relevance. The quantified relationships between electrothermal coupling and white-channel compensation can inform driver strategies, thermal design and run-time control to stabilize colour and improve energy efficiency at the device and module levels. For display applications, CCT and gamut area alone are insufficient to capture content-dependent perceptual effects; therefore, content-aware colour management and perceptually weighted metrics should be applied alongside the device models. For architectural and museum lighting, reliance on CCT alone is discouraged; full-spectrum metrics and established indices (e.g. ANSI/IES TM-30, 27 spectral-similarity measures and relevant biological or conservation metrics) should be used in concert with application-specific constraints.
5. Conclusion
This study examined how drive currents and heatsink temperature influence the 2D colour gamut of RGB LED systems. A predictive electrothermal–optical model was developed and validated experimentally to quantify gamut shifts and to assess white-LED compensation strategies for extended CCT control. Gamut-area predictions within 1% of the measured values across diverse operating conditions were achieved by characterizing how the drive currents and heatsink temperatures of individual red and blue channels induced chromaticity shifts and by fitting those dependencies into the framework. A differential-evolution optimizer was then employed to identify operating points that balanced gamut area and wall-plug efficiency, yielding a maximum efficiency of 56.9% at 17.1 lm. The analysis also revealed practical trade-offs: high luminous flux reduced gamut coverage and efficiency, while green–white hybrid operation produced a mean power saving of 0.14 W within the CCT regulation band of 6600 K to 7400 K, whereas the standalone white LED consumed 0.34 W to 1.51 W. These findings underscored the importance of electrothermal coupling in dynamic CCT control. The proposed nonlinear electrothermal–optical model can be extended to predict full SPDs from electrical and thermal inputs, which enables direct calculation of CIE XYZ tristimulus values for device-level colour characterization and calibration. Given the model’s validated accuracy for gamut prediction, this approach has potential utility for display profiling, colour management workflows and spectral optimization. Overall, this instrument-free predictive approach not only streamlines the design of high-performance, energy-efficient LED lighting systems but also lays the groundwork for future extensions to lifetime optimization and real-time adaptive control.
Footnotes
Declaration of conflicting interests
The authors declared no potential conflicts of interest with respect to the research, authorship, and/or publication of this article.
Funding
The authors disclosed receipt of the following financial support for the research, authorship, and/or publication of this article: The work was supported by Industry-University-Research Collaboration Foundation of the Fujian Province (2024H6014).