
Abstract
Light is considered to have a range of important non-visual effects on the human body, including its influence on alertness. However, it remains unclear which lighting factors directly influence alertness: although rising photopic illuminance has been reported to enhance alertness, it may not be the fundamental factor; the roles of photoreceptor-weighted spectral metrics, such as melanopic equivalent daylight illuminance (m-EDI) and cyanopic illuminance, remain to be further investigated. This study conducted a human-factor experiment involving 22 participants to investigate the effects of m-EDI and cyanopic illuminance on alertness, which was assessed using electroencephalography and Karolinska Sleepiness Scale (KSS). The results showed that as m-EDI increased, the ratio of β-wave energy to total brain wave energy significantly increased while KSS scores decreased, indicating an enhancement in alertness. On the other hand, no significant differences in alertness were observed with varying cyanopic illuminance levels based on both assessment methods. Additionally, regression analysis indicated that, compared to photopic illuminance, m-EDI was more accurate in predicting individual alertness. Furthermore, we investigated the quantitative relationship between m-EDI and alertness levels and observed that at higher m-EDI intensities, changes in alertness tended to reach saturation, with an m-EDI threshold around 260 lx. In conclusion, our study shows that m-EDI is a key lighting parameter that influences alertness.
1. Introduction
In modern society, artificial lighting has become an integral part of indoor environments. Beyond meeting visual needs, light also exerts non-visual biological effects that can influence both the physiological and psychological states of individuals.1–5 Among these effects, the impact on alertness is particularly notable.6–8 Alertness refers to an individual’s ability to stay awake and respond rapidly to external stimuli, playing a crucial role in cognitive function, emotional state and other aspects.9–11
Previous studies have reported that the light environment can affect human alertness. Early studies primarily focused on the impact of photopic illuminance on alertness. In 2000, Cajochen et al. 12 used fluorescent lamps with a fixed correlated colour temperature (CCT) of 4100 K to study the effect of illuminance, ranging from 3 lx to 9000 lx, on alertness, and found a positive correlation between alertness and illuminance. A study by Smolders et al. 13 showed that, with a CCT of 4000 K and illuminance of 1000 lx, lower sleepiness and shorter reaction times were observed compared to 200 lx. Shekleton et al. 14 found that, in a high illuminance of 1000 lx, participants showed less subjective sleepiness and performed better on psychomotor vigilance tasks compared to a low illuminance environment. These studies suggest that increasing photopic illuminance can effectively enhance alertness. However, this effect may not be fundamentally attributable to photopic illuminance; instead, the concurrently increasing stimulation of other photoreceptors with rising photopic illuminance may play the dominant role in the effect of light on alertness. In lighting applications aiming to support non-visual effects, the specific relationships between light-induced alertness and photoreceptor-weighted spectral metrics, such as melanopic equivalent daylight illuminance (m-EDI) or S-cone-weighted cyanopic illuminance, remain to be further investigated.
Illuminance is derived from the spectral luminous efficiency function V(λ), which is primarily determined by the M-cone and L-cone photoreceptors. Therefore, the effect of illuminance on alertness does not account for the role of the intrinsic photosensitive retinal ganglion cells (ipRGCs), which have a spectral sensitivity peak at around 480 nm15,16 and are typically considered to play a crucial role in the non-visual biological effects of light.4,17–19
To quantify the ipRGC-influenced responses to light, various metrics have been proposed. 20 Among them, the International Commission on Illumination (CIE)’s m-EDI and the WELL Building Standard’s equivalent melanopic lux, which differ only in the scaling factor of their absolute values, are widely used.21–24 Note that other standards for non-visual light effects exist, such as the UL DG 2448022. 25 For an extensive review of this field, one can refer to Stefani and Cajochen. 20 Given that m-EDI is a widely used metric and reflects the equivalent illuminance related to the photoreceptor ipRGCs, in this study, we focused on investigating the relationship between m-EDI and light-induced alertness.
Moreover, some studies suggested that the effect of light on alertness is not solely driven by melanopsin. Cone cells, particularly S-cones, may also contribute to this non-visual effect through an indirect pathway via ipRGCs.26–29 This hypothesis is supported by neuroanatomical studies, with Patterson et al. 30 identifying a specialised amacrine cell (S-cone amacrine cell) in the visual system of primates. This cell receives input exclusively from ON bipolar cells downstream of S-cones. It transmits inhibitory electrical signals to ipRGCs, indicating that S-cones are involved in the melanopsin-driven non-visual photoreceptive signal transmission process. On the other hand, Spitschan et al. 31 reported no detectable contribution of S-cones to non-visual effects. Therefore, while signals from S-cones likely participate in the regulation of light-induced non-visual biological effects, their specific contribution, particularly to alertness, remains unclear.
One major limitation of previous studies is the lack of effective control over various spectral parameters. Specifically, as photopic illuminance increases, m-EDI and cyanopic illuminance also rise, making it difficult to isolate the individual contributions of different spectral parameters, such as photopic illuminance, m-EDI and cyanopic illuminance, to light-induced non-visual effects.
As for the evaluation metrics for the influence of light on alertness, subjective evaluation scales, such as the 9-point Karolinska Sleepiness Scale (KSS), are typically used. Moreover, electroencephalography (EEG) serves as an effective objective tool for evaluating alertness. Studies have shown that in a wakeful state, neural activity in the brain becomes more frequent, causing EEG signals to display higher frequencies and lower amplitudes during periods of alertness.32–34 Therefore, the brain’s activity state can be characterised based on the signal strength of different EEG frequency bands. The study by Papadelis et al. 35 suggests that in alertness-related research, EEG data is one of the most promising physiological parameters for objectively and effectively characterising alertness levels. Beta waves in EEG are associated with thinking and processing external information, such as alertness, cognitive activity and attention to external stimuli, 36 and are considered an important indicator of alertness.
In this study, we first examined the impact of varying light stimulus intensity on alertness using the two evaluation methods, KSS and EEG, to validate the experimental approach. Next, through strict control of spectral parameters, we investigated the effects of m-EDI and cyanopic illuminance on alertness. Furthermore, given the strong correlation between alertness levels and the m-EDI index observed in our study, we investigated their quantitative relationship, aiming to provide scientific evidence for the development of more efficient and personalised lighting solutions.
2. Method
The human-factor study was conducted in the laboratory of Healthy and Quality Lighting at Fudan University. The research protocol was reviewed, approved and monitored by the Fudan University Ethics Committee (Approval No. FE232361), and the entire experiment adhered to the principles outlined in the Declaration of Helsinki. All participants provided written informed consent prior to participation and received appropriate financial compensation upon completion of the experiment.
2.1 Participants
A total of 24 healthy young adults were recruited for this study. Data from two participants were excluded due to the use of stimulant medications, resulting in final data from the remaining 22 participants (7 males and 15 females; median age 19 years, range 18 years to 20 years). The inclusion criteria were as follows: participants were aged between 18 years and 30 years without a relevant knowledge background, had normal or corrected-to-normal vision and had no colour vision deficiencies as determined by the Ishihara colour vision test. 37 Individuals with ophthalmic conditions, such as cataracts or glaucoma, and those with psychological health issues were excluded. Additionally, participants who had crossed time zones within the past month were not included in the study. Starting 1 week prior to the experiment, all participants were required to maintain regular sleep and wake times and adhere to the study’s guidelines, which included refraining from consuming alcohol, nicotine or caffeine-containing products (e.g. tea, coffee) within 48 h before the experiment. Participants were also prohibited from napping or engaging in strenuous physical activity lasting more than 30 min on the day of the experiment.
2.2 Protocol
This study employed a within-subjects design, with all participants completing a 7-week experiment. On the day of the experiment, participants engaged in their daily activities on campus during the morning, had a meal between 11.00 and 12.00 and arrived at the laboratory by 13.30. Before the experiment, participants filled out a questionnaire, which included questions about their activities the day before the experiment, whether they had consumed alcohol, nicotine or caffeine and whether they had engaged in strenuous exercise or taken a nap on the day of the experiment. Participants who had consumed stimulant products, engaged in strenuous exercise or taken a nap were rescheduled for the experiment. Only those who had followed a regular schedule without any of the aforementioned activities were eligible to participate in the experiment.
As shown in Figure 1, each experiment session lasted 150 min (from 14.00 to 16.30) and was divided into two stages: during the first hour, a reference lighting condition was applied with the lowest lighting intensity (spectral power distribution, SPD-1), and in the second hour, seven different experimental lighting conditions were applied, forming three groups of experimental conditions: the varying-intensity group (SPD-1, SPD-4, SPD-7), the varying-m/p-ratio group (SPD-2, SPD-4, SPD-6) and the varying-c/p-ratio group (SPD-3, SPD-4, SPD-5). Participants were randomly assigned to the sequence of different lighting conditions. During the experiment, two sets of KSS and EEG data were collected, one after the reference lighting condition and the other after the experimental lighting condition, with each data collection session lasting 15 min. A 7-day washout period was implemented between sessions38,39 to avoid potential residual effects of an experiment session that might influence participants’ alertness in subsequent sessions. Additionally, the seven experimental light conditions were presented in a randomised Latin square design to minimise sequence biases in the results.
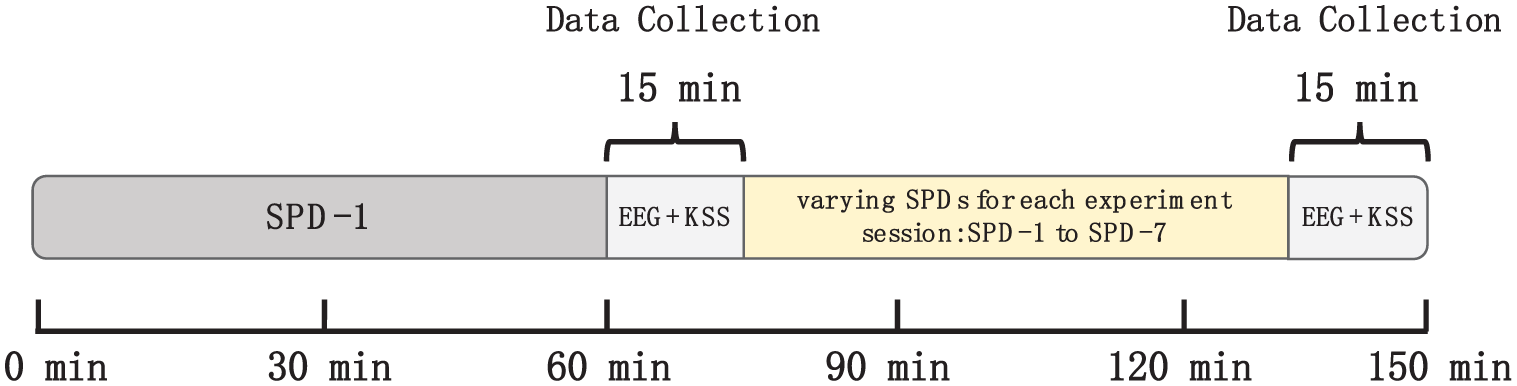
Flowchart of the experimental design
After completing the baseline survey, the experiment operator fitted the participants with EEG caps. Prior to the experiment, participants were instructed to minimise unnecessary eye movements and maintain a steady gaze during EEG recordings to reduce motion-related artefacts. During the experiment, participants were required to maintain an upright seated posture and were prohibited from consuming any food or beverages other than water. To prevent interference from excessive light absorption by clothing, they were required to wear white lab coats. Additionally, participants were instructed to read leisure paper books provided by the experiment operator and were not allowed to read their own books, engage in conversation or use electronic devices. To ensure a consistent viewing direction, a bookstand was used. The bookstand was positioned 0.4 m away from the participant and 1.2 m from the floor. If a participant needed to use the restroom, they were required to wear blue light-blocking glasses (PRiSMA, Innovative Eyewear, Weilheim in Oberbayern, Germany; blocking radiation <550 nm) to prevent exposure to other light sources. During EEG data acquisition, participants remained seated in an upright posture reading the assigned leisure books, which was required by the experimental protocol. This reading activity helped maintain a wakeful, stable and low-cognitive-load attentional state throughout the EEG-data-acquisition session. The KSS was administered after each EEG session to avoid cognitive or motion interference during EEG recording.
2.3 Lighting condition
The luminaires used in the experiment featured 10 independent LED channels, each of which could be individually controlled and adjusted via a computer. The light output was precisely adjusted using a self-developed colour mixing algorithm, enabling the design of contrasting spectra, as shown in Figure 2. A spectral irradiance meter (SPIC-200 BW, EVERFINE, Hangzhou, China) was used to measure the lighting parameters at the participants’ eyes, with detailed data provided in Table 1. All spectral designs adhered to general lighting standards, ensuring white light with a colour rendering index greater than 80. Since the light output from wall-washing luminaires was diffused by the walls, the illumination reaching the participants’ eyes was indirect, which can effectively minimised glare.
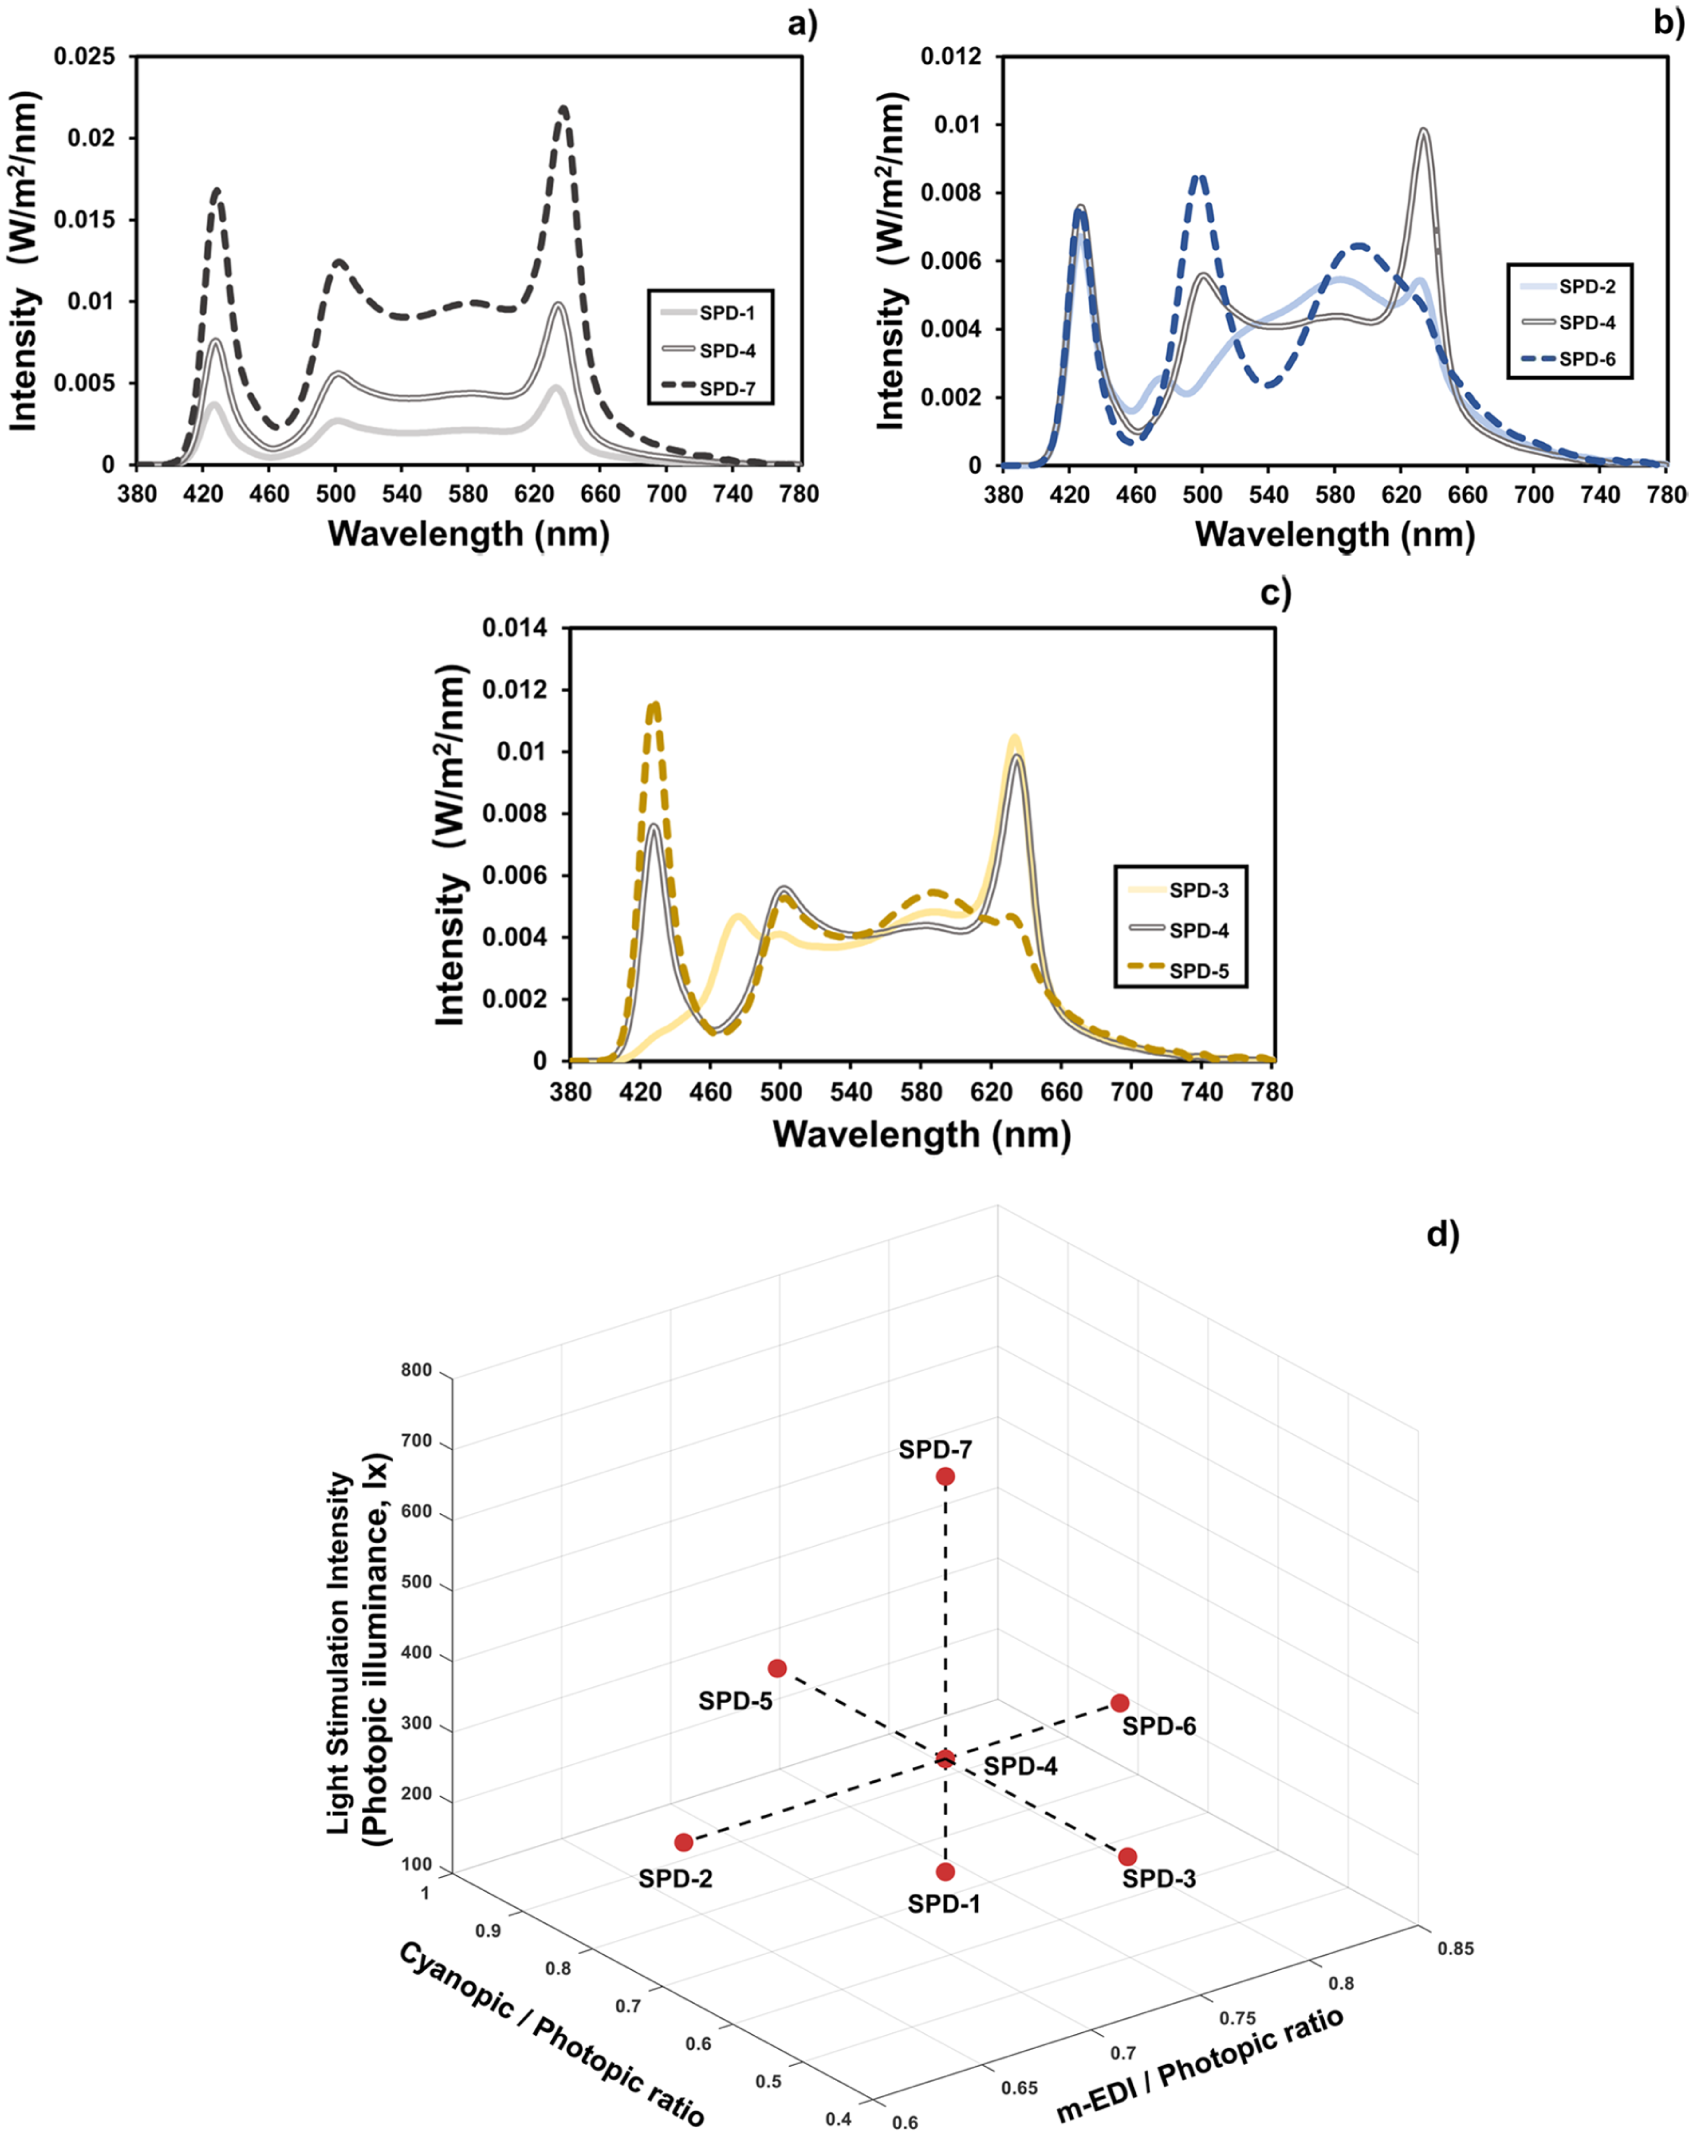
Lighting spectra of (a) the varying-intensity group, (b) the varying-m/p-ratio group and (c) the varying-c/p-ratio group. (d) A diagram showing the parameters of the seven lighting spectra in the intensity-m/p ratio-c/p ratio space
Measured parameters of the seven lighting SPDs
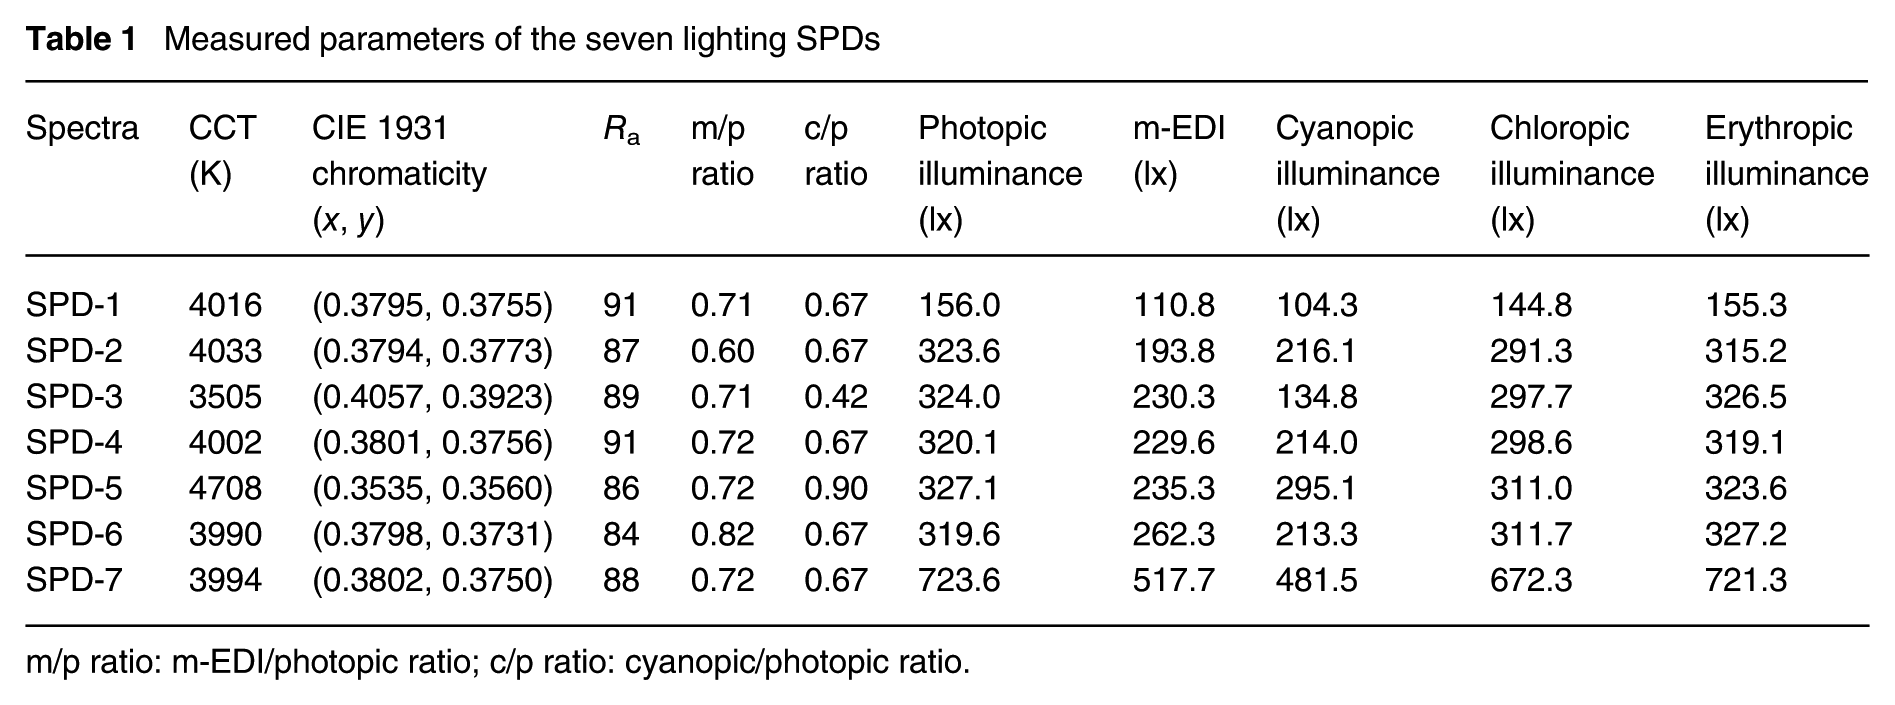
m/p ratio: m-EDI/photopic ratio; c/p ratio: cyanopic/photopic ratio.
2.4 Evaluation method and data collection
2.4.1 Karolinska Sleepiness Scale
The KSS 40 was used to assess alertness level. KSS adopts a 9-point scale ranging from 1 (extremely alert) to 9 (extremely sleepy), with higher scores indicating lower alertness. Each score is accompanied by a corresponding description to help participants understand the level of alertness associated with each score.
2.4.2 Electroencephalogram
EEG signals were recorded using a 32-channel electroencephalograph (SAGA+, TMSI, Oldenzaal, Netherlands). Each recording session lasted 4 min, with a sampling frequency of 1000 Hz. All electrode placements followed the international 10–20 system, 41 and the reference electrodes were placed at M1 and M2. To ensure signal clarity, the impedance of all electrodes was kept below 5 kΩ throughout the experiment.
The recorded EEG signals were imported into MATLAB (EEGLab plugin) for preprocessing, with the following steps: the first and last 30 s of the EEG signals were removed. A band-pass filter was applied to the EEG signals between 1 Hz and 40 Hz, and a notch filter at 50 Hz was used. Independent component analysis (ICA) was performed to remove artefacts such as eye movements, muscle activity and ECG signals. The 3-min resting-state EEG signals were divided into 90 segments, each lasting 2 s, and segments with an absolute amplitude greater than 75 μV were excluded. The power spectral density of the EEG signals was calculated using the Welch method. The EEG signals were divided into δ (1 Hz to 3 Hz), θ (4 Hz to 8 Hz), α (9 Hz to 14 Hz) and β (15 Hz to 30 Hz) bands based on different frequency ranges. Studies have shown that higher power in the β band is associated with higher alertness.42,43 In this study, we primarily selected the CP6 electrode in the temporal lobe region, where β-waves are more concentrated, 44 and the ratio of β-wave energy to total brain wave energy was used as an indicator of alertness.
2.5 Data analysis
Data analysis was conducted using SPSS (version 24; IBM Institute, Armonk, New York, USA). Firstly, the Shapiro–Wilk test was performed on the KSS data, which revealed that the KSS data did not follow a normal distribution (p < 0.050). Therefore, a Friedman test was used to analyse the significant differences between the lighting conditions. To further explore the differences between conditions, pairwise comparisons were conducted using the Wilcoxon signed-rank test, suitable for non-normally distributed data. For the EEG data, normality tests showed that all data followed a normal distribution (p > 0.050). Therefore, a paired-samples t-test was used to analyse the significant differences in EEG data across lighting conditions. In addition, logarithmic regression models were used to examine the relationship between m-EDI and both KSS scores and EEG beta power ratios, based on prior findings that alertness-related responses to light often follow a non-linear pattern with diminishing effects at higher levels of light stimulation.45,46 The regression model for fitting is shown in Equation (1):

where x represents the m-EDI value (lx), y represents the corresponding alertness measure (KSS score or EEG beta ratio) and a and b are fitting coefficients. A p-value of less than 0.05 was considered statistically significant for all statistical tests.
3. Results
3.1 Analysis of KSS data
The results of the Friedman test for the varying-intensity group are shown in Figure 3(a). At time point T1, which was after the same first hour reference lighting condition, KSS scores were very close (SPD-1: Median [IQR] = 6 [4–7], SPD-4: 6.5 [5–7], SPD-7: 6 [6–8]), the Friedman test confirmed the lack of significant differences in alertness level across different experiment sessions (
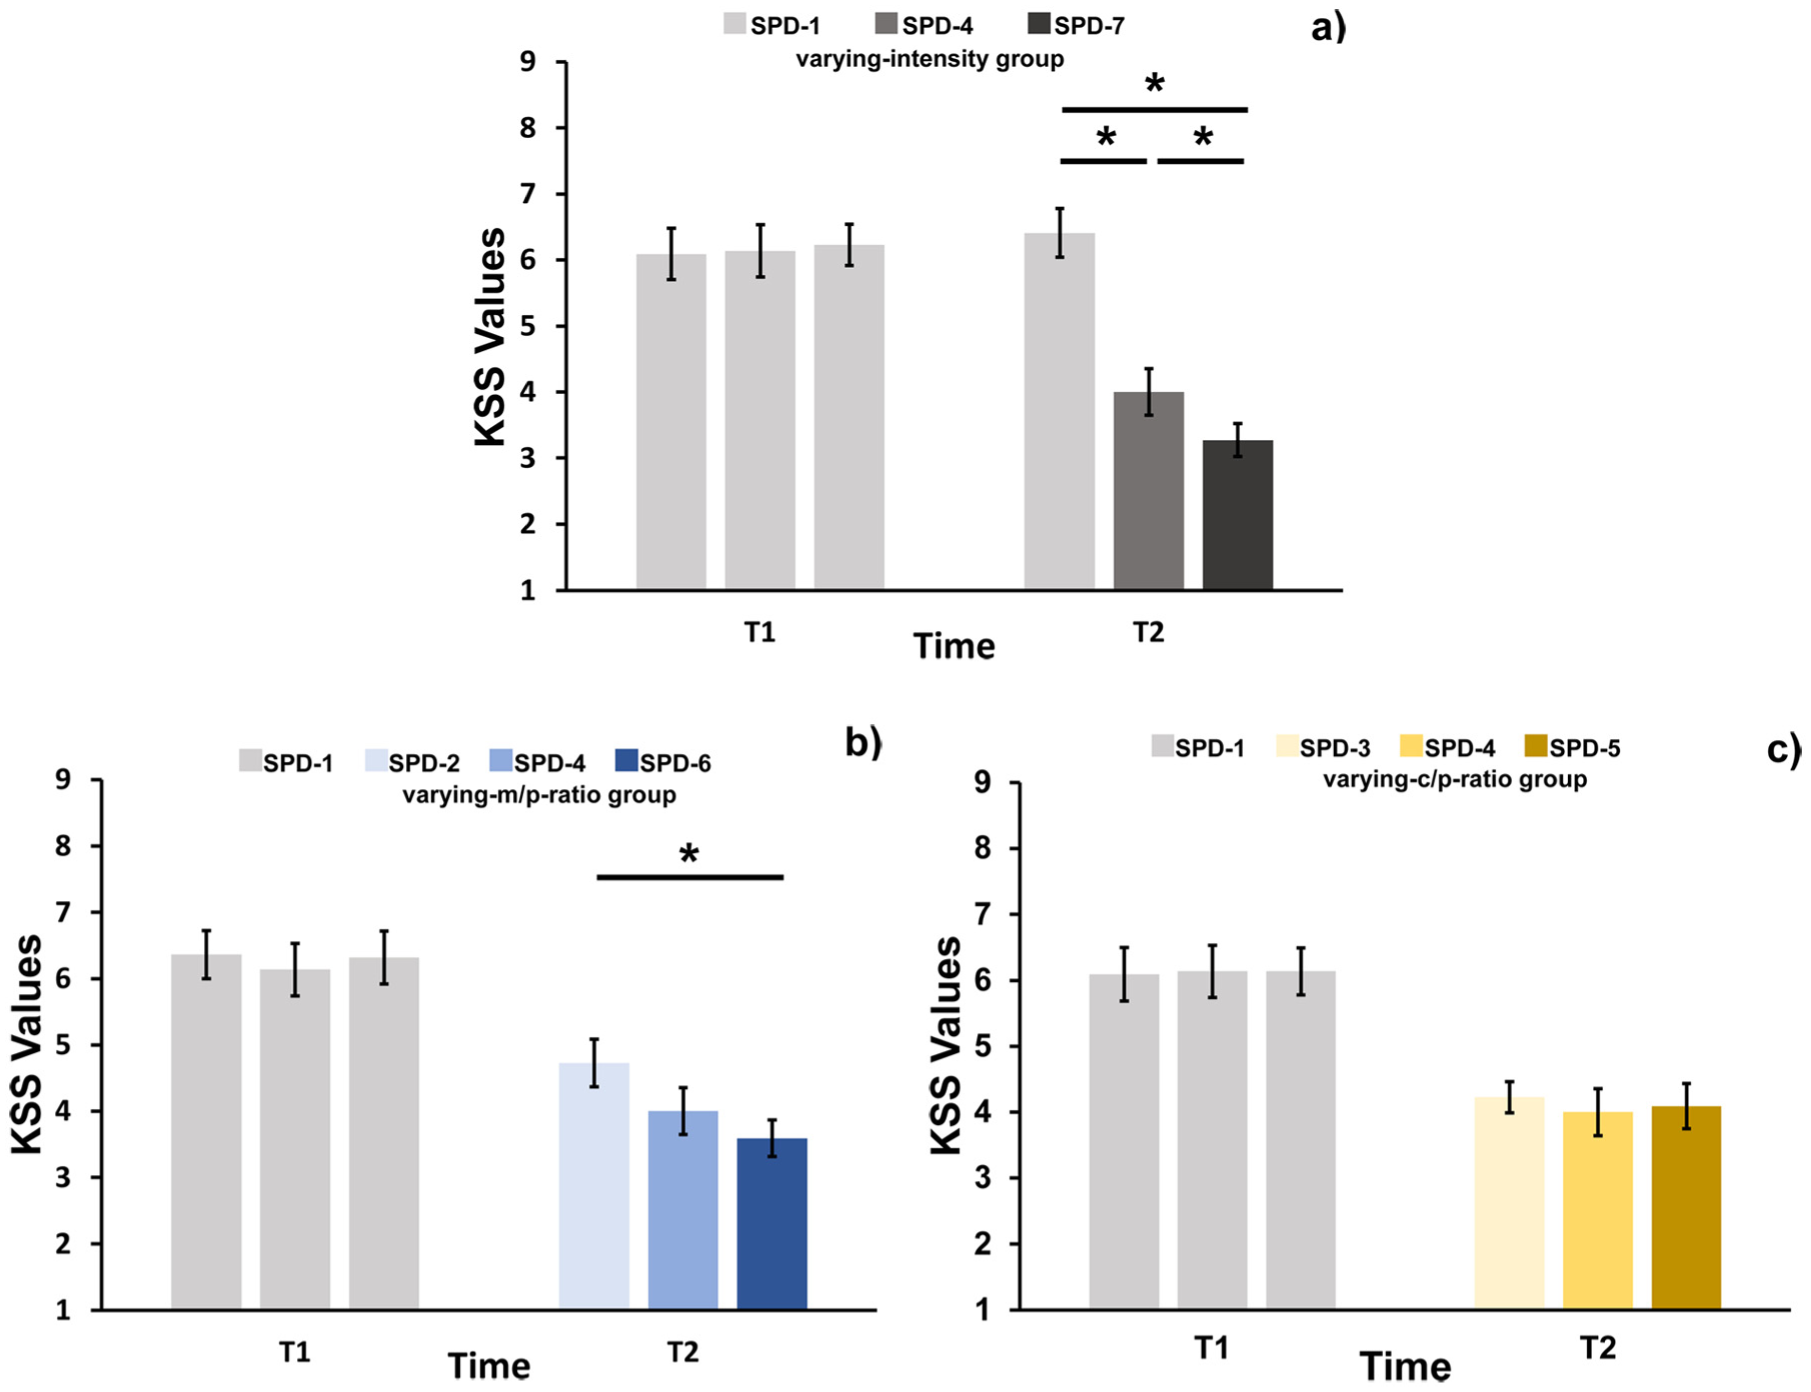
KSS values after the first and second hours for (a) the varying-intensity group, (b) the varying-m/p-ratio group and (c) the varying-c/p-ratio group
To further analyse the alertness data at the time point T2 under different lighting conditions, a Wilcoxon signed-rank test was conducted for pairwise comparisons between conditions. KSS scores showed a progressive reduction (SPD-1: 7 [5–8], SPD-4: 4 [3–5], SPD-7: 3 [2–4]), which corresponds to a steady enhancement in alertness level. The analysis showed a significant difference in alertness level between SPD-1 and SPD-7 (Z = −4.031, p < 0.001). Significant differences were also found between SPD-1 and SPD-4, and between SPD-4 and SPD-7 (Z = −3.598, p < 0.001; Z = −2.015, p = 0.044).
For the varying-m/p-ratio group, which includes three lighting conditions that deliver the same photopic and cyanopic illuminance but different m-EDI levels, the results of the Friedman test are shown in Figure 3(b). At time point T1, under the same reference lighting condition, KSS scores were very close (SPD-2: 7 [5–8], SPD-4: 6.5 [5–7], SPD-6: 6.5 [6–8]), the Friedman test confirmed no significant differences in alertness (
For the varying-c/p-ratio group, the results of the Friedman test are shown in Figure 3(c). At time point T1, under the reference lighting condition, KSS scores remained close (SPD-3: 6 [5–8], SPD-4: 6.5 [5–7], SPD-5: 6 [5–7]), the Friedman test showed no significant differences in alertness (
3.2 Analysis of EEG data
For the varying-intensity group, the EEG results are shown in Figure 4(a). At time point T1, under the same reference lighting condition, β-wave energy ratios were consistent (SPD-1: mean ± SD = 0.250 ± 0.020, SPD-4: 0.249 ± 0.017, SPD-7: 0.251 ± 0.018) and statistical analysis revealed no significant differences. At time point T2, as light intensity increased, the mean ratio of β-wave energy to total energy also increased (SPD-1: 0.230 ± 0.018, SPD-4: 0.275 ± 0.025, SPD-7: 0.310 ± 0.021). Statistical analysis revealed a significant difference between SPD-1 and SPD-7 (p = 0.002) as well as between SPD-1 and SPD-4 (p = 0.019), while the difference between SPD-4 and SPD-7 was marginally significant (p = 0.070). In addition, under the SPD-1 lighting condition for both the reference and experimental lighting conditions, there was no significant difference in alertness between T1 and T2 (0.250 ± 0.020 vs. 0.230 ± 0.018, p = 0.458). These results are consistent with the KSS data, indicating that as light intensity increases, the ratio of β-wave energy to total energy increases, which could serve as a good indicator of an increase in alertness.
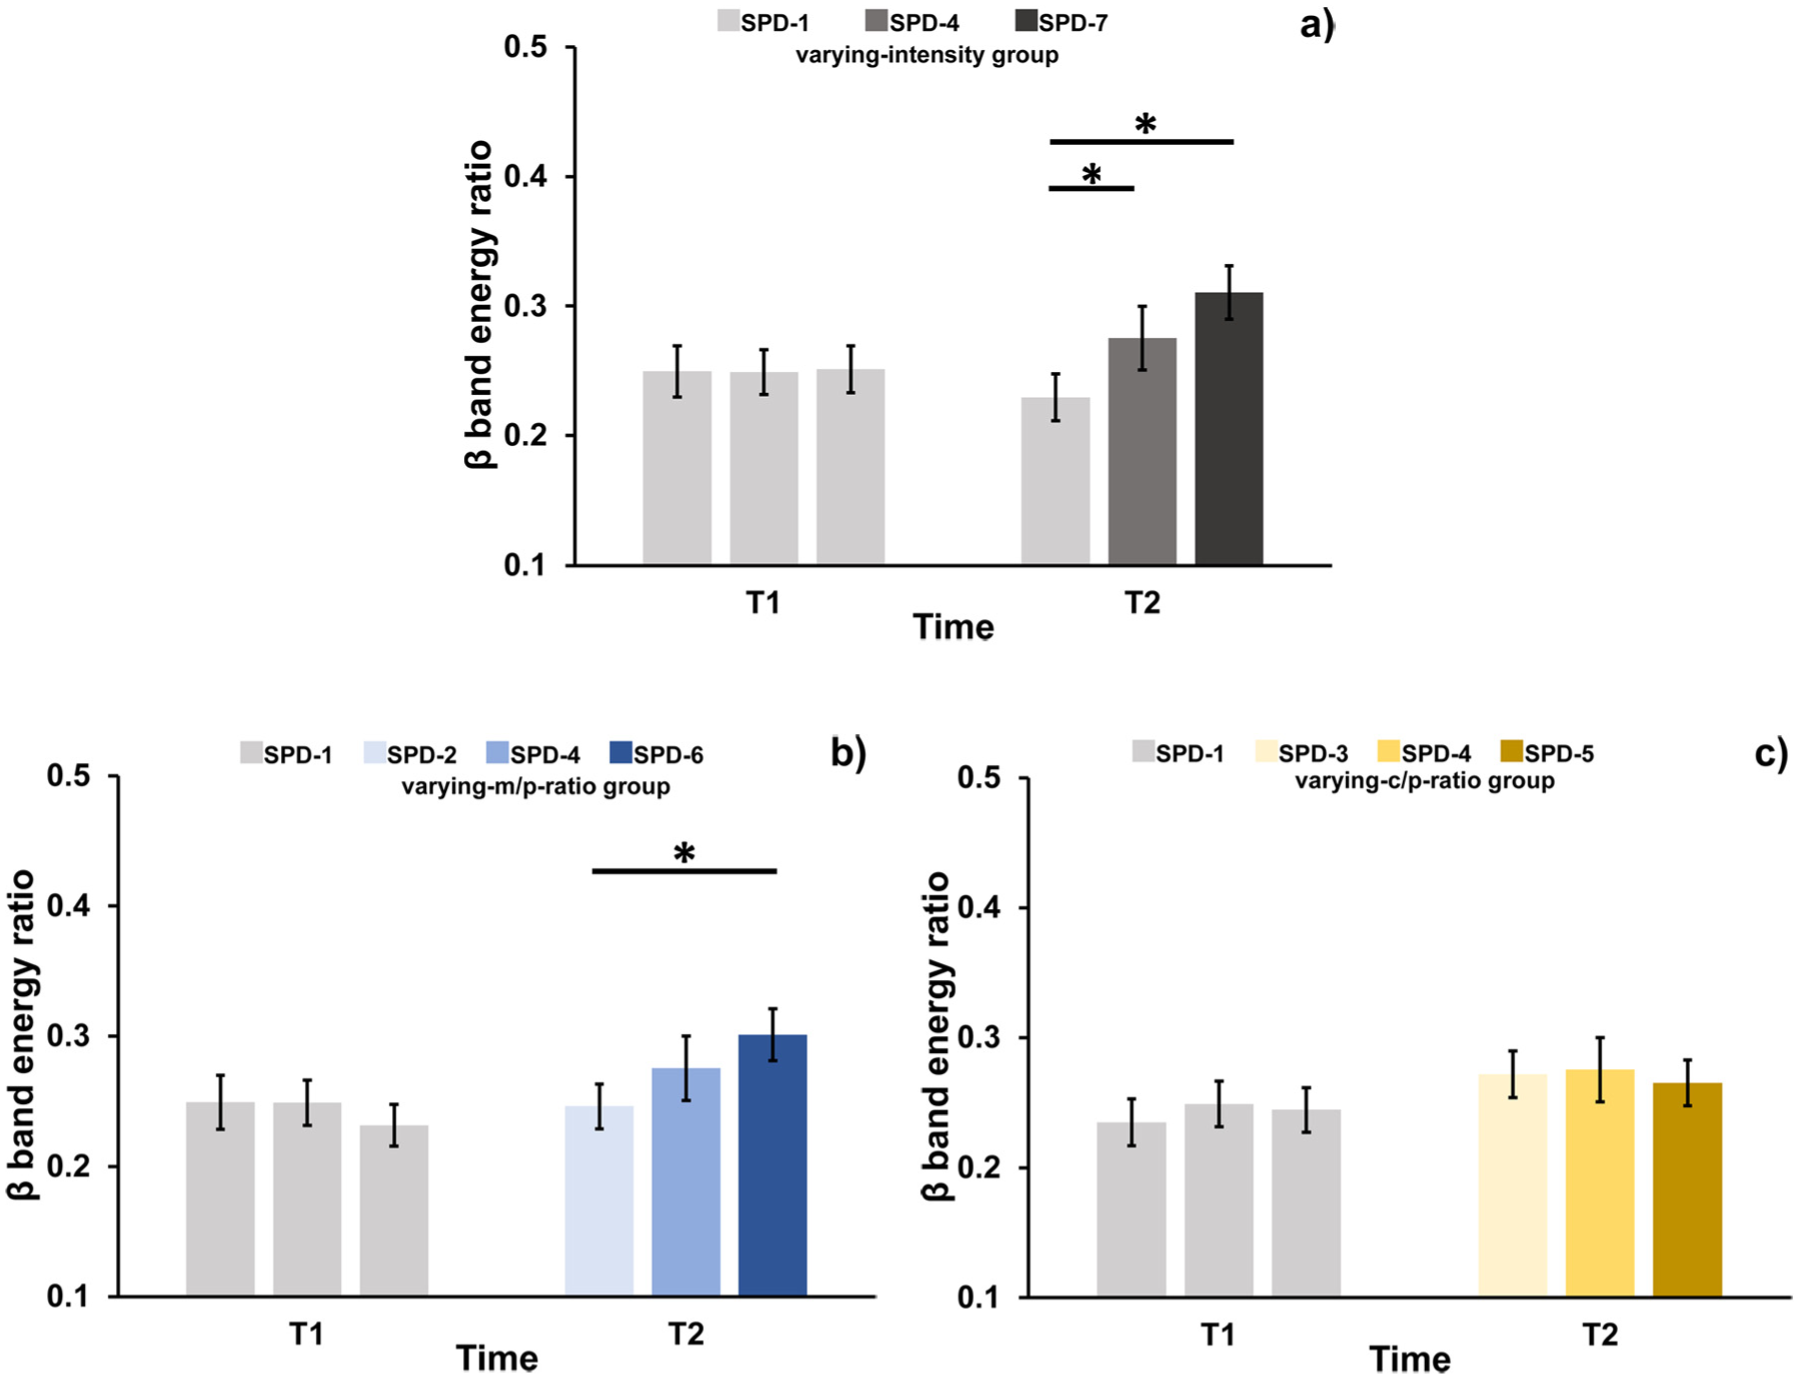
β-wave energy ratio after the first and second hours for (a) the varying-intensity group, (b) the varying-m/p-ratio group and (c) the varying-c/p-ratio group
For the varying-m/p-ratio group, the EEG results are shown in Figure 4(b). At time point T1, under the reference lighting condition, β-wave energy ratios showed close results (SPD-2: 0.249 ± 0.021, SPD-4: 0.249 ± 0.017, SPD-6: 0.232 ± 0.016), and there was no significant main effect in alertness. At time point T2, as the m/p ratio increased, which corresponds to an increase in m-EDI, the mean ratio of β-wave energy to total energy also increased (SPD-2: 0.246 ± 0.017, SPD-4: 0.275 ± 0.025, SPD-6: 0.301 ± 0.020). Statistical analysis showed a significant difference between SPD-2 and SPD-6 (p < 0.001), while the differences between SPD-2 and SPD-4 (p = 0.087) and between SPD-4 and SPD-6 (p = 0.158) did not reach statistical significance.
The EEG results for the varying-c/p-ratio group are shown in Figure 4(c). At both T1 and T2, the mean ratio of β-wave energy to total energy remained stable across different lighting conditions (SPD-3: 0.272 ± 0.018, SPD-4: 0.275 ± 0.025, SPD-5: 0.265 ± 0.018). Statistical analysis revealed no significant differences among these conditions, indicating no substantial change in alertness.
No effects of the experimental sequence were found on the KSS and EEG results, nor was any significant relationship observed between gender and KSS or EEG outcomes (all p > 0.05).
3.3 m-EDI as a predictor of light’s influence on alertness
This study found that cyanotic illuminance’s contribution to light’s influence on alertness was minimal. Therefore, further analysis was performed to evaluate the applicability of m-EDI and photopic illuminance as a predictor of light’s influence on alertness. Regression analysis was performed on the data of KSS value versus photopic illuminance and β-wave energy ratio versus photopic illuminance, and the result revealed that there was no significant correlation between photopic illuminance and KSS or EEG.
On the other hand, from the regression analysis of m-EDI versus KSS value (Figure 5), a significant correlation was found (R2 = 0.814, p = 0.049), showing that the KSS value decreased as m-EDI increased, indicating an enhancement in alertness. Comparing the two lighting conditions with the lowest and highest m-EDI values (SPD-1 vs. SPD-7), KSS scores decreased by approximately 49% as m-EDI increased from its minimum to maximum level. Additionally, the regression analysis between m-EDI and β-wave energy ratio also showed statistical significance, with higher m-EDI levels associated with higher alertness (R2 = 0.830, p = 0.018). Between SPD-1 (m-EDI: 110.8 lx) and SPD-7 (m-EDI: 517.7 lx), the proportion of β-wave energy relative to total energy increased by approximately 35%. These regression analyses further validated the effectiveness of m-EDI in predicting alertness based on both subjective and objective evaluation metrics.
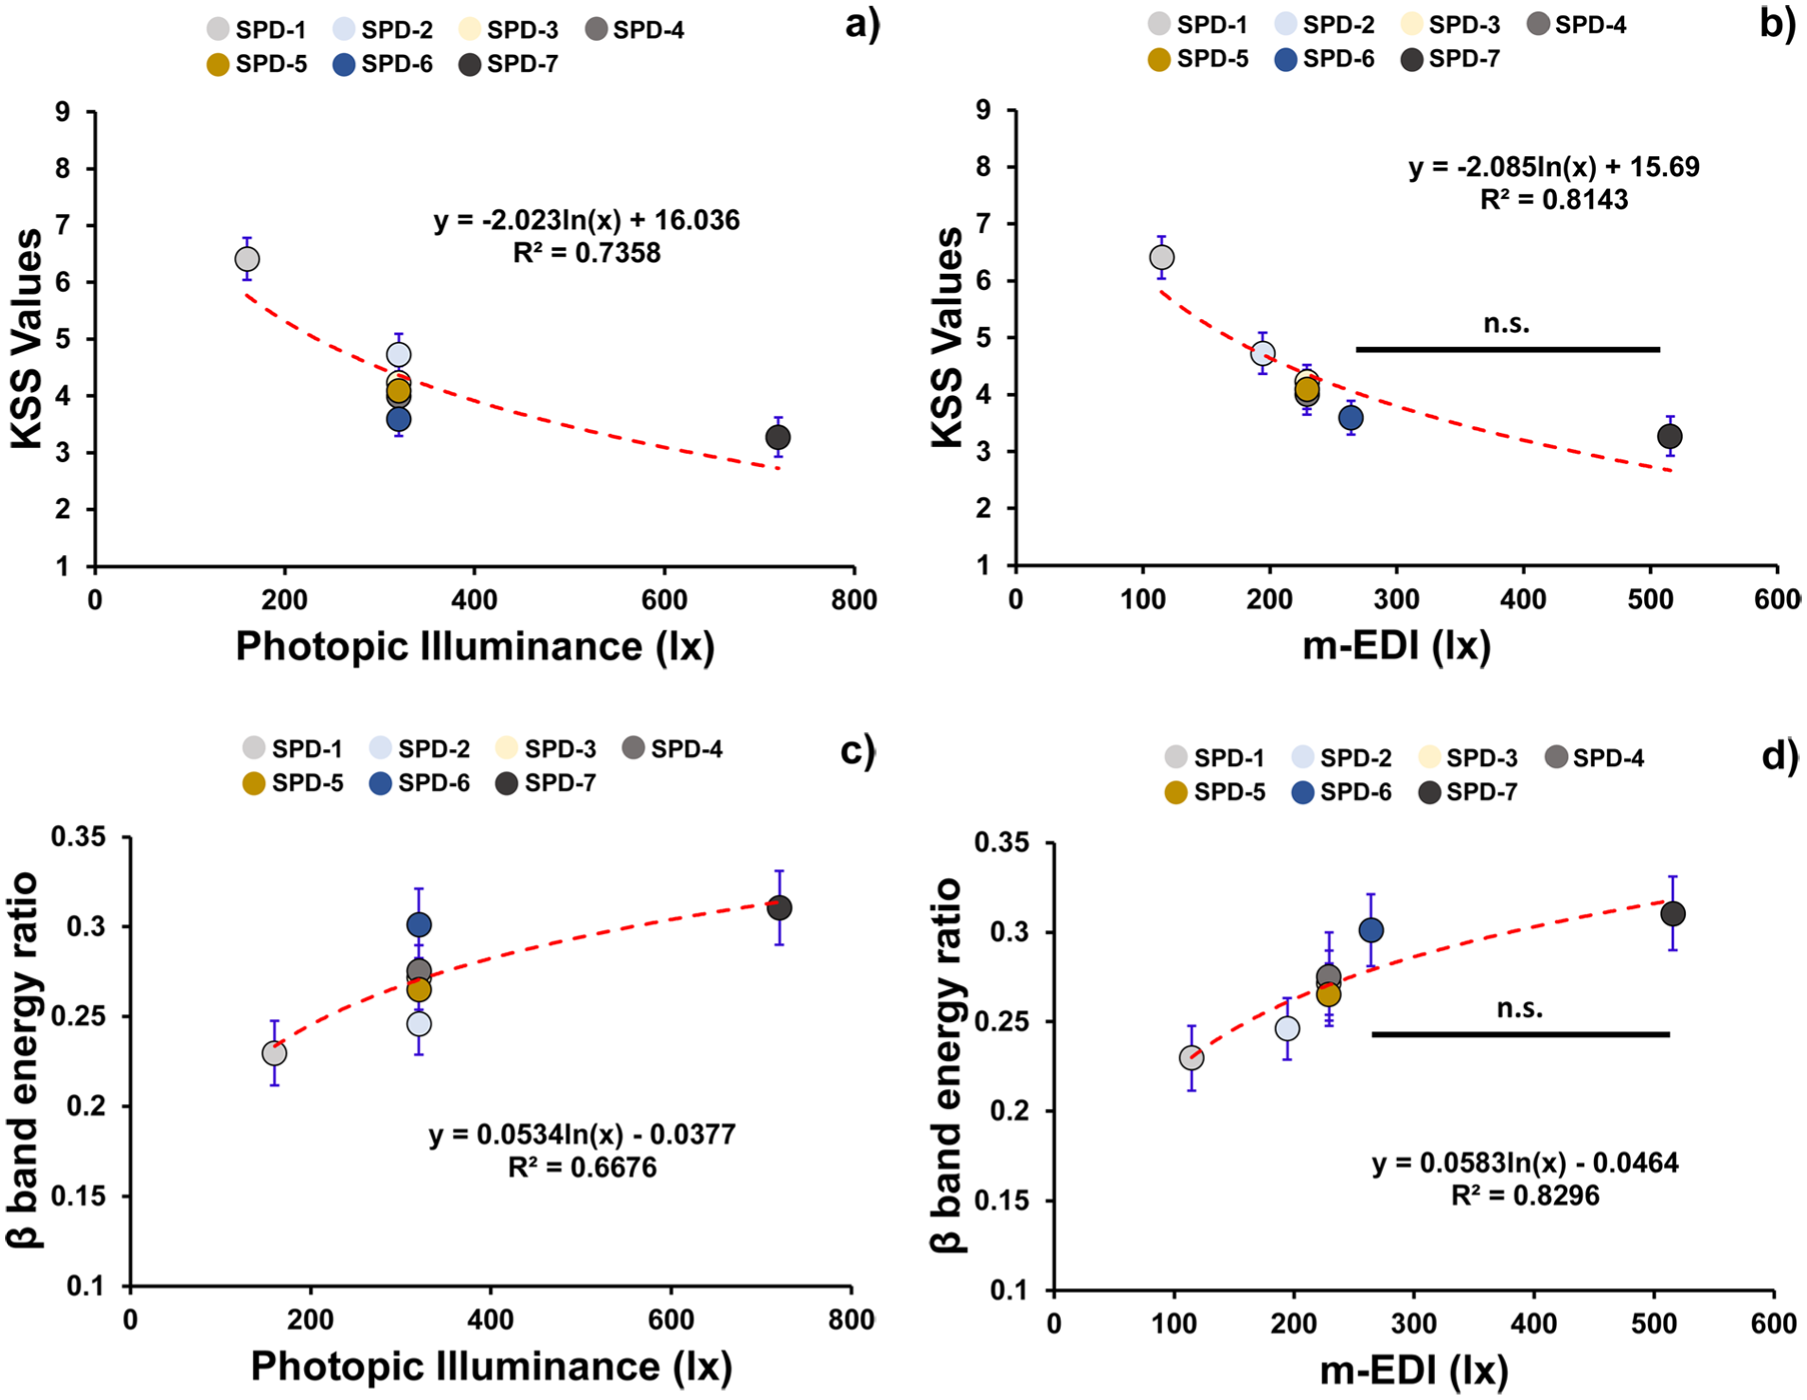
Regression analysis of (a) KSS value vs. photopic illuminance, (b) KSS value vs. m-EDI, (c) β-wave energy ratio vs. photopic illuminance and (d) β-wave energy ratio vs. m-EDI. All fitting curves for KSS/EEG data vs. m-EDI relationships were based on a logarithmic regression mode (n.s. stands for not significant, p > 0.05)
Finally, despite the nearly 100% difference in m-EDI between SPD-6 (262.3 lx) and SPD-7 (517.7 lx), both subjective and objective metrics showed minimal changes in alertness: KSS scores (SPD-6: 3.5 [3–4] vs. SPD-7: 3 [2–4]) and the ratio of β-wave energy to total energy (SPD-6: 0.301 ± 0.020 vs. SPD-7: 0.310 ± 0.021) remained largely unchanged. Statistical analysis confirmed no significant difference, as indicated by both the KSS test (Z = −0.926, p = 0.355) and the EEG analysis (p = 0.158). These results suggest that the effect of increasing m-EDI on alertness reaches a saturation point, with an approximate threshold of 260 lx beyond which additional increases yield diminishing effects.
4. Discussion
In this study, the experimental design was first validated in the varying-intensity group. All participants were exposed to the same low-intensity light stimulus during the first hour. As expected, alertness levels measured at different time points using KSS and EEG showed high consistency. This validated the effectiveness of baseline control and ensured that prior light exposure, fatigue and other potential confounding factors had minimal impact on the results. Moreover, when SPD-1 was reapplied during the second hour (T2), no significant changes in alertness were observed compared to T1, demonstrating that extended exposure to low-intensity light did not induce time-dependent confounding effects. In contrast, exposure to higher light intensities during the second hour induced dose-dependent responses: KSS scores decreased by approximately 49%, and the β-wave energy ratio increased by approximately 35%. These results collectively validate the validity of the experimental protocol.
Subsequently, through strict control of variables, the significant role of m-EDI in modulating alertness was confirmed within the varying-intensity group. Both KSS and EEG results showed a marked increase in alertness during the second hour, with significant differences in alertness levels across different m-EDI conditions. This indicates that changes in m-EDI can significantly influence alertness.
Regarding the photopic dimension, indeed, the five lighting conditions with SPDs 2–6 have an overlap in photopic illuminance within a small range from 319.6 lx to 327.1 lx (within a 2.3% difference), which may affect the fitting quality. However, from another perspective, the corresponding values of KSS and β-band energy ratio for the five lighting conditions are from 7 to 3.5 and from 0.246 to 0.301, respectively, which suggests a quite significant change in alertness. In other words, identical photopic illuminance does not ensure a consistent effect of light on alertness. On the contrary, among the five, the three lighting conditions SPDs 3–5 also an overlap in the melanopic dimension: while the photopic illuminance still ranges from 320.1 lx to 327.1 lx (within a 2.2% difference), the m-EDI ranges from 229.6 lx to 235.5 lx (within a 2.6% difference). It can be found that with the constraint of similar m-EDI, the corresponding values of KSS and β-band energy ratio are from 6 to 6.5 and from 0.265 to 0.275, respectively, which is quite small. It can be clearly seen that, compared to photopic illuminance, m-EDI was more effective in predicting individual alertness.
Previous studies have reported the role of m-EDI in modulating non-visual effects such as circadian rhythms and alertness.46–48 Our findings in this study reinforce the view that m-EDI is a robust predictor of alertness and establish a quantitative correlation between the m-EDI at the eyes and its impact on alertness level. It is worth noting that the photopic illuminance levels in our study were limited to only three conditions, which may have partially contributed to the weak regression fit observed in Figure 5(a) and (c). On the other hand, it can be clearly seen in the Figures, for the five lighting conditions with similar photopic illuminance (with different m-EDI values), both EEG and KSS metrics show significant variations, while in Figure 5(b) and (d), for the three lighting conditions with similar m-EDI values, both EEG and KSS metrics show very close results.
Melatonin suppression is often regarded as a key mechanism through which light affects alertness. However, in this study, the melatonin–suppression pathway may not have played a dominant role, as our experiment was conducted during daytime hours when melatonin levels are low. This result supports the possibility that other neural pathways may have contributed to the observed changes in alertness. In particular, Rautkyläet al. 49 proposed a dual-pathway model in which light can influence alertness not only through the Suprachiasmatic Nucleus (SCN)-melatonin axis but also by directly influencing arousal-related brain regions such as the amygdala, which are involved in arousal and emotional regulation. Although this model can only be considered as a preliminary theoretical proposal, it provides a possible framework for interpreting how light exposure during the day modulates alertness via non-circadian, non-melatonin pathways.
To examine potential saturation effects in alertness responses at elevated m-EDI levels, we conducted a comparative analysis between SPD-6 (262.3 lx) and SPD-7 (517.7 lx) conditions, representing a 97% incremental increase in m-EDI. Notably, both psychophysiological metrics revealed minimal differential responses (Δ < 5%) despite this near-twofold enhancement in melanopic stimulation. These results suggest a saturation effect in the alerting response to melanopic illuminance beyond approximately 260 lx. Previous studies have suggested that m-EDI is the most significant factor influencing melatonin suppression, with a saturation effect observed at higher levels of melanopic illuminance.45–47 However, studies directly addressing the impact of m-EDI on alertness are relatively limited. Furthermore, although studies such as those by Schöllhorn et al. 46 and Brown et al. 47 have explored the relationship between m-EDI and alertness, they have primarily relied on subjective measures like the KSS to assess alertness, without incorporating objective physiological metrics to verify these findings. Our study fills this gap by combining subjective (KSS) and objective (EEG) measurements to assess alertness. Additionally, this saturation effect is consistent with previous recommendations that propose a minimum daytime melanopic EDI of 250 lx to support physiological and behavioural functions. 50 These findings provide valuable insights for future lighting applications.
Regarding the impact of cyanopic illuminance on alertness, although previous neuroanatomical studies suggest that S-cones contribute to the ipRGC-mediated non-visual photoreception pathway, 30 our findings indicate that the modulation of alertness by cyanopic illuminance is relatively minimal: even when the increase in cyanopic illuminance from SPD-3 to SPD-5 reached approximately 119%, the EEG- and KSS-based measures of alertness were very limited. Specifically, the KSS score changed from 6 to 6.5, and the β-band energy ratio changed from 0.265 to 0.275. It suggests that cyanopic stimulation alone does not exert a dominant or independently measurable influence on alertness when m-EDI is tightly controlled. This interpretation aligns with prior findings that even large changes in S-cone input may not lead to measurable alerting responses. 31
Based on previous studies, 51 to minimise the influence of different daily light exposure before the experiment sessions, only university students were recruited as participants. They were instructed to maintain their usual campus routines, which typically involved staying indoors (e.g. in classrooms or dormitories) before arriving at the lighting laboratory in the afternoon. Additionally, a one-hour washout period under the reference lighting condition was implemented before the formal experiment to mitigate the effects of differing daylight exposure histories. Furthermore, participants were required to follow a consistent sleep and wake schedule to ensure controlled baseline conditions.
The median age of participants was 19 years. Due to age-related factors (e.g. reduced corneal diameter and pupil size in older adults), the results of this study may not be applicable to the elderly population.
In our study, no structured eyes-closed periods were included in the protocol. Therefore, EEG-based paradigms such as the Karolinska Drowsiness Test and the Alpha Attenuation Test were not applied. 52 This design choice limited the use of alpha- and theta-based indicators for assessing drowsiness. Future studies may consider incorporating these approaches to enable a more comprehensive evaluation of neurophysiological alertness. Although a pre-experiment self-report questionnaire was used to confirm participants’ sleep–wake schedules and substance intake, the study did not employ objective assessments such as actigraphy or drug screening.
Finally, despite behavioural instructions aimed at minimising eye movements and maintaining a steady gaze during EEG acquisition, residual ocular artefacts were inevitable. Therefore, ICA was applied during EEG data preprocessing to isolate and remove components associated with eye blinks and movements.
5. Conclusion
Through human-factor studies utilising KSS and EEG evaluation methods, we demonstrated a significant correlation between m-EDI (ranging from 110.8 lx to 517.7 lx) and alertness level, whereas photopic illuminance showed no statistically significant association. Additionally, S-cone-related cyanopic illuminance was found to have a minimal influence on alertness.
In examining the dose–response relationship between m-EDI and KSS/EEG-derived metrics, we identified a saturation threshold at approximately 260 lx: below this value, alertness level increased with m-EDI, but beyond it, additional m-EDI yielded diminishing returns on alertness level. These findings support m-EDI as a key indicator of light-induced alertness, suggesting it is a more reliable predictor than photopic illuminance.
This study provides scientific evidence identifying the fundamental lighting parameter that influences alertness and establishes its quantitative relationship with alertness levels. These insights can support the development of personalised and integrated lighting solutions that target optimised cognitive and visual performances.
Footnotes
Declaration of conflicting interests
The authors declared no potential conflicts of interest with respect to the research, authorship, and/or publication of this article.
Funding
The authors disclosed receipt of the following financial support for the research, authorship, and/or publication of this article: This study is supported by the National Natural Science Foundation of China (52278095) and GONEO Optoelectronics Technology Co., Ltd, China.