
Abstract
Achieving thermal comfort while maintaining energy efficiency in buildings requires an integrated approach that includes both Heating, Ventilation, and Air Conditioning (HVAC) and lighting systems. This study examined the combined effects of horizontal illuminance, correlated colour temperature (CCT) and air temperature on human thermal perception under steady-state conditions. Fifty-four healthy young female participants were exposed to three air temperatures, six illuminance levels and five CCT settings in an artificial climate-controlled chamber. Physiological responses were measured using mean skin temperature, whereas psychological responses were assessed using subjective thermal sensation and comfort ratings. Results showed that mean skin temperature increased with air temperature but was unaffected by illuminance or CCT, indicating physiological thermal neutrality under all visual conditions. Thermal sensation increased with both air and skin temperature. Psychologically, low-illuminance levels consistently reduced perceived warmth and improved comfort, especially under warmer conditions. CCT had limited influence on thermal sensation, but warm-toned lighting enhanced comfort in slightly cool settings. These findings suggest that warm-CCT lighting may enhance comfort in cooler environments without additional thermal load.
1. Introduction
Global warming has intensified extreme weather events such as heavy rainfall and storms, increasingly affecting agricultural productivity and outdoor thermal environments. At COP28 (December 2023), the international community reaffirmed its commitment to limiting global temperature rise to within 1.5°C above pre-industrial levels. 1 Consequently, reducing energy consumption, particularly in the building sector, has become an urgent global priority. In Japan, household energy consumption reports indicate that space heating and cooling account for approximately 29%, while motive power and lighting, including appliances, represent about 33% of total use. 2 Recent surveys further show that lighting comprises roughly 15% to 23% of electricity consumption under summer cooling conditions in residential and commercial sectors,3,4 highlighting the substantial energy demand of HVAC and lighting systems. Improving their efficiency is therefore essential for both environmental sustainability and energy conservation.
Beyond engineering optimisation, understanding how environmental factors influence thermal comfort is key to achieving further energy reductions. 5 Thermal sensation, the subjective perception of warmth or coolness, is governed not only by heat exchange but also by visual stimuli such as colour and lighting, which can modulate perception through psychological pathways.6–14 Japan’s energy-saving guidelines recommend a summer indoor temperature of 28°C, regarded as thermally neutral for lightly clothed, sedentary individuals.15,16 However, this setting may not ensure comfort in workplaces where behavioural adjustment is limited. 17 Previous studies have shown that visual factors, including indoor greenery and colour composition, can enhance comfort in slightly warm environments.11–13
The Hue–Heat hypothesis 18 proposes that colour influences thermal perception: warm colours (e.g. red) evoke warmth, while cool colours (e.g. blue) evoke coolness. Lighting with higher correlated colour temperatures (CCTs) appears bluish and cooler, whereas lower CCTs appear reddish and warmer. Many studies have supported this relationship,7,8,19–41 though others found minimal or inconsistent effects,29,34,35,37,40–43 particularly for thermal comfort or under prolonged exposures.35,37 These discrepancies suggest that the Hue–Heat effect is strongest under short-term or near-neutral conditions and weaker under steady-state environments. When colour is considered as light colour, its interaction with illuminance becomes important. Studies examining CCT together with illuminance suggest that preferences and evaluations can depend on the combined lighting conditions.44–45 Other studies have reported that user characteristics, season, and ambient conditions further influence this relationship.23–25,46–51 Overall, low CCTs are preferred in winter under low illuminance, whereas higher CCTs are favoured in summer under bright conditions.23–25
However, many previous experiments focused on transient exposures or visual impressions without full thermal adaptation, limiting their applicability to steady-state conditions. Few studies have systematically examined the combined effects of air temperature, illuminance and CCT on thermal sensation and comfort under stable physiological conditions. Therefore, this study addresses that gap by testing the following hypotheses: (1) air temperature primarily determines physiological responses such as mean skin temperature under steady-state conditions; (2) lighting parameters (illuminance and CCT) modulate psychological responses, thermal sensation and comfort, independent of physiological change and (3) suitable combinations of illuminance and CCT can mitigate thermal discomfort at higher cooling setpoints (around 28°C).
2. Method
2.1 Experimental protocol
The experiment was conducted in a net-curtain exposure booth within an artificial climate-controlled chamber designed to minimise extraneous visual stimuli. Figure 1 presents the chamber layout. As illustrated in Figure 1, the booth is enclosed by a full-height net curtain. The curtain provides a visually neutral, optically diffuse boundary that reduces strong edge contrasts and minimises colour cues within the field of view. All interior surfaces were painted white and covered with thin white fabric to ensure visual neutrality.
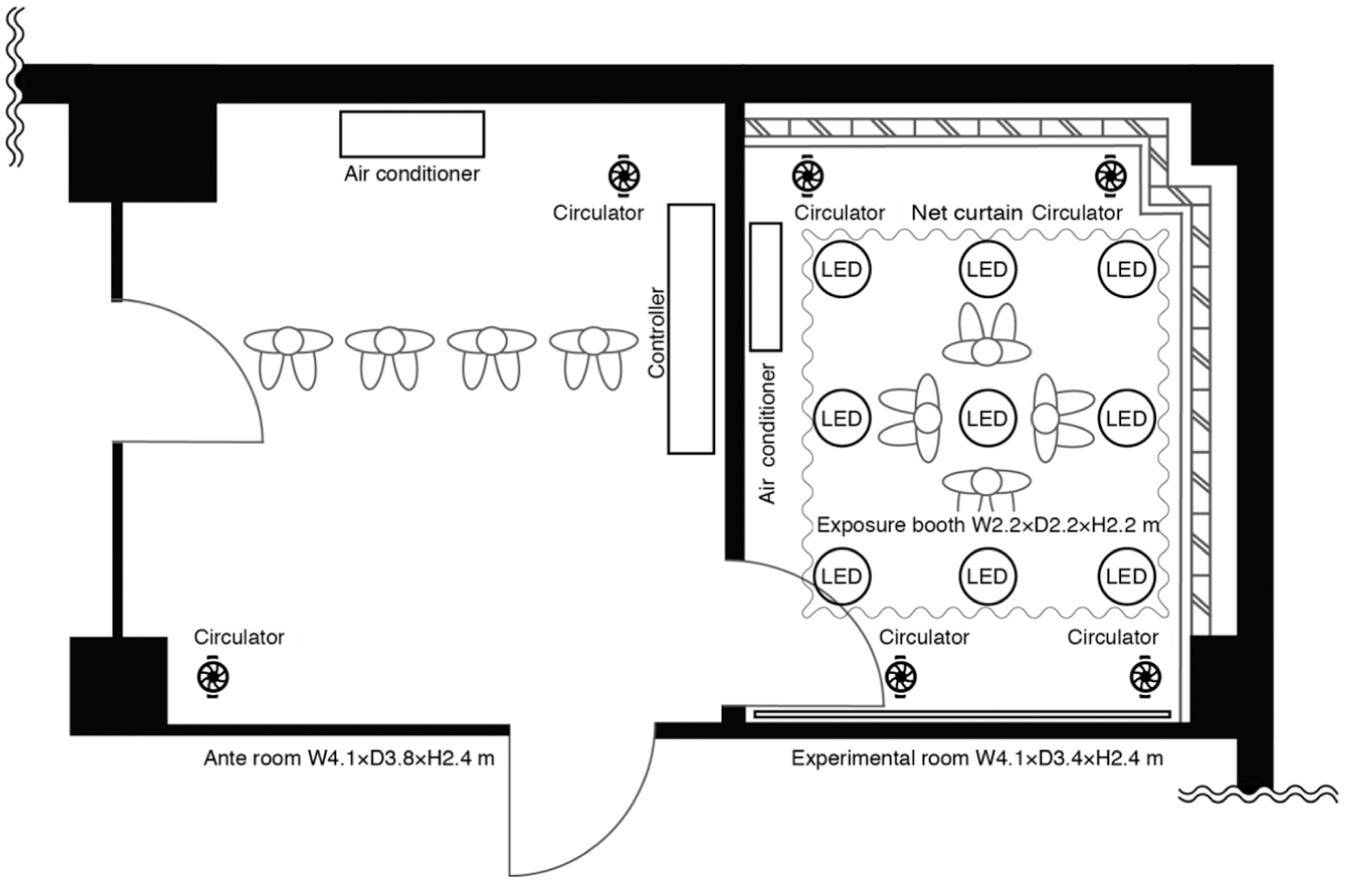
Plan of the experimental setup in which participants were exposed to controlled thermal conditions
Owing to observable twisting and sagging of the net curtain, we adopt a conservative lower-bound estimate of its total area of ≥29.04 m2. The booth was framed with 40 mm × 90 mm timber members; the total exposed timber surface area, excluding opposing faces that form mutual radiation surfaces, was 5.94 m2. Given the substantially larger area of the curtain, radiative exchange within the enclosure is expected to be dominated by the net fabric rather than the timber frame, assuming comparable view factors and surface temperatures. Moreover, because the net fabric is highly air-permeable, its surface temperature is expected to closely track the ambient dry-bulb air temperature under steady-state indoor conditions without direct solar gains. Accordingly, wall surface temperatures were maintained equal to air temperatures to establish a uniform thermal environment and to minimise radiant-temperature non-uniformity across seating positions.
Lighting was provided by ceiling-mounted LED luminaires (BYLH: FC-ZCIL-XX60, 50 W, 4750 lm, 2700 K to 6500 K), enabling precise control of horizontal illuminance and CCT. The lighting arrangement was designed to illuminate the net-curtain enclosure uniformly. No specific gaze direction was prescribed; participants were instructed to maintain a relaxed seated posture facing the illuminated front area, ensuring consistent visual exposure across conditions.
Three ambient air-temperature conditions were tested: 26°C (slightly cool), 28°C (thermally neutral for lightly clothed sedentary individuals)15,16,52–54 and 30°C (slightly warm). Surface temperatures closely matched air temperatures across all conditions, minimising radiant heat discrepancies. Air velocity was maintained below 0.2 m s−1, and relative humidity was fixed at 50% relative humidity. Experiments were conducted during the following periods: 28°C from July to September 2023 and June to August 2024, 26°C from May to August 2024 and 30°C from June to September 2024. Participants wore light-coloured clothing to minimise visual influence and remained seated and motionless throughout the trials to ensure consistent metabolic heat production.
2.2 Acclimatisation protocol
The acclimatisation schedule accounted for previous findings on thermal and visual acclimatisation times,55–57 ensuring that both physiological stability and visual perceptual baselines were adequately addressed prior to data collection. Based on the findings of Isoda et al., 55 it is known that mean skin temperature stabilises after approximately 60 min to 90 min under a constant thermal environment. Accordingly, participants were first acclimatised in a thermally neutral antechamber for a minimum of 60 min.
To ensure physiological and perceptual stabilisation prior to visual exposure, participants first underwent a thermal acclimatisation phase in a thermally neutral antechamber for a minimum of 60 min. This allowed thermal equilibration and eliminated prior environmental influence. Figure 2 illustrates the experimental protocol.
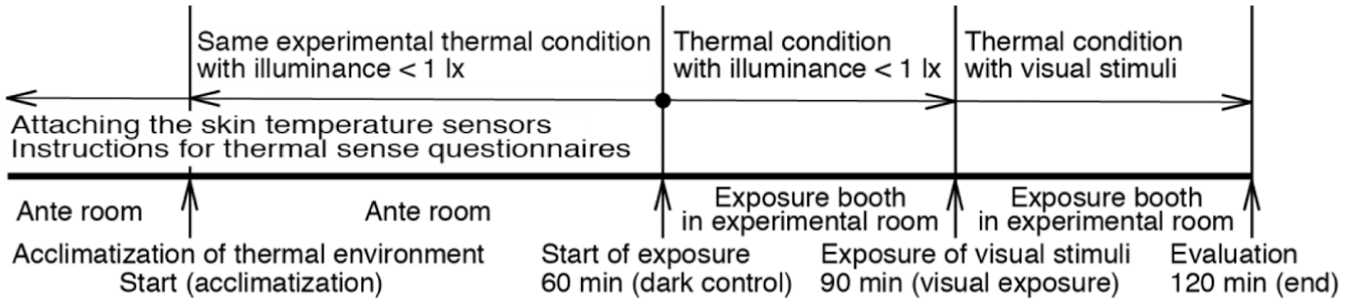
Experimental protocol
Following the protocol, participants entered the experimental chamber for a 30-min visual acclimatisation control phase with the lights turned off (<1 lx), ensuring minimal visual input. This was followed by a 30-min exposure to a specified visual condition under constant thermal conditions. The total acclimatisation and testing session lasted approximately 120 min per condition. This pre-exposure phase ensured the elimination of thermal history effects and allowed physiological equilibration. Nordby et al. 56 reported that dark acclimatisation reaches its threshold within 20 min to 30 min, while Shimakura and Sakata 57 demonstrated that colour acclimatisation stabilises after roughly 20 min. To accommodate both thermal and visual acclimatisation requirements, each test session included a 30-min control period in the experimental chamber with the lights turned off, followed by 30 min of exposure to the designated visual condition under constant thermal conditions. Psychological response data were collected at the end of each full cycle.
2.3 Thermal and visual exposure sequence
Following the acclimatisation protocol, each participant underwent two consecutive phases within the climate-controlled chamber: a control phase with no lighting and an exposure phase under specific visual conditions. During both phases, participants remained seated and motionless to ensure consistent metabolic activity and avoid confounding effects from physical movement. The test conditions included a matrix of 30 combinations (6 levels of illuminance × 5 CCT levels) in addition to the dark control. To mitigate any order-related effects, the presentation sequence of visual conditions was fully randomised across participants. Psychological assessments were conducted immediately after the 60 min session (control + exposure) to capture integrated subjective responses. This protocol ensured both physiological stabilisation and sufficient perceptual engagement, thereby supporting the validity of subjective ratings for thermal sensation and comfort.
2.4 Visual stimuli conditions
Figure 3 summarises the combinations of horizontal illuminance and CCT applied in this study. The target lighting conditions were selected with reference to Japanese regulations and domestic/international lighting standards in order to represent realistic indoor environments.
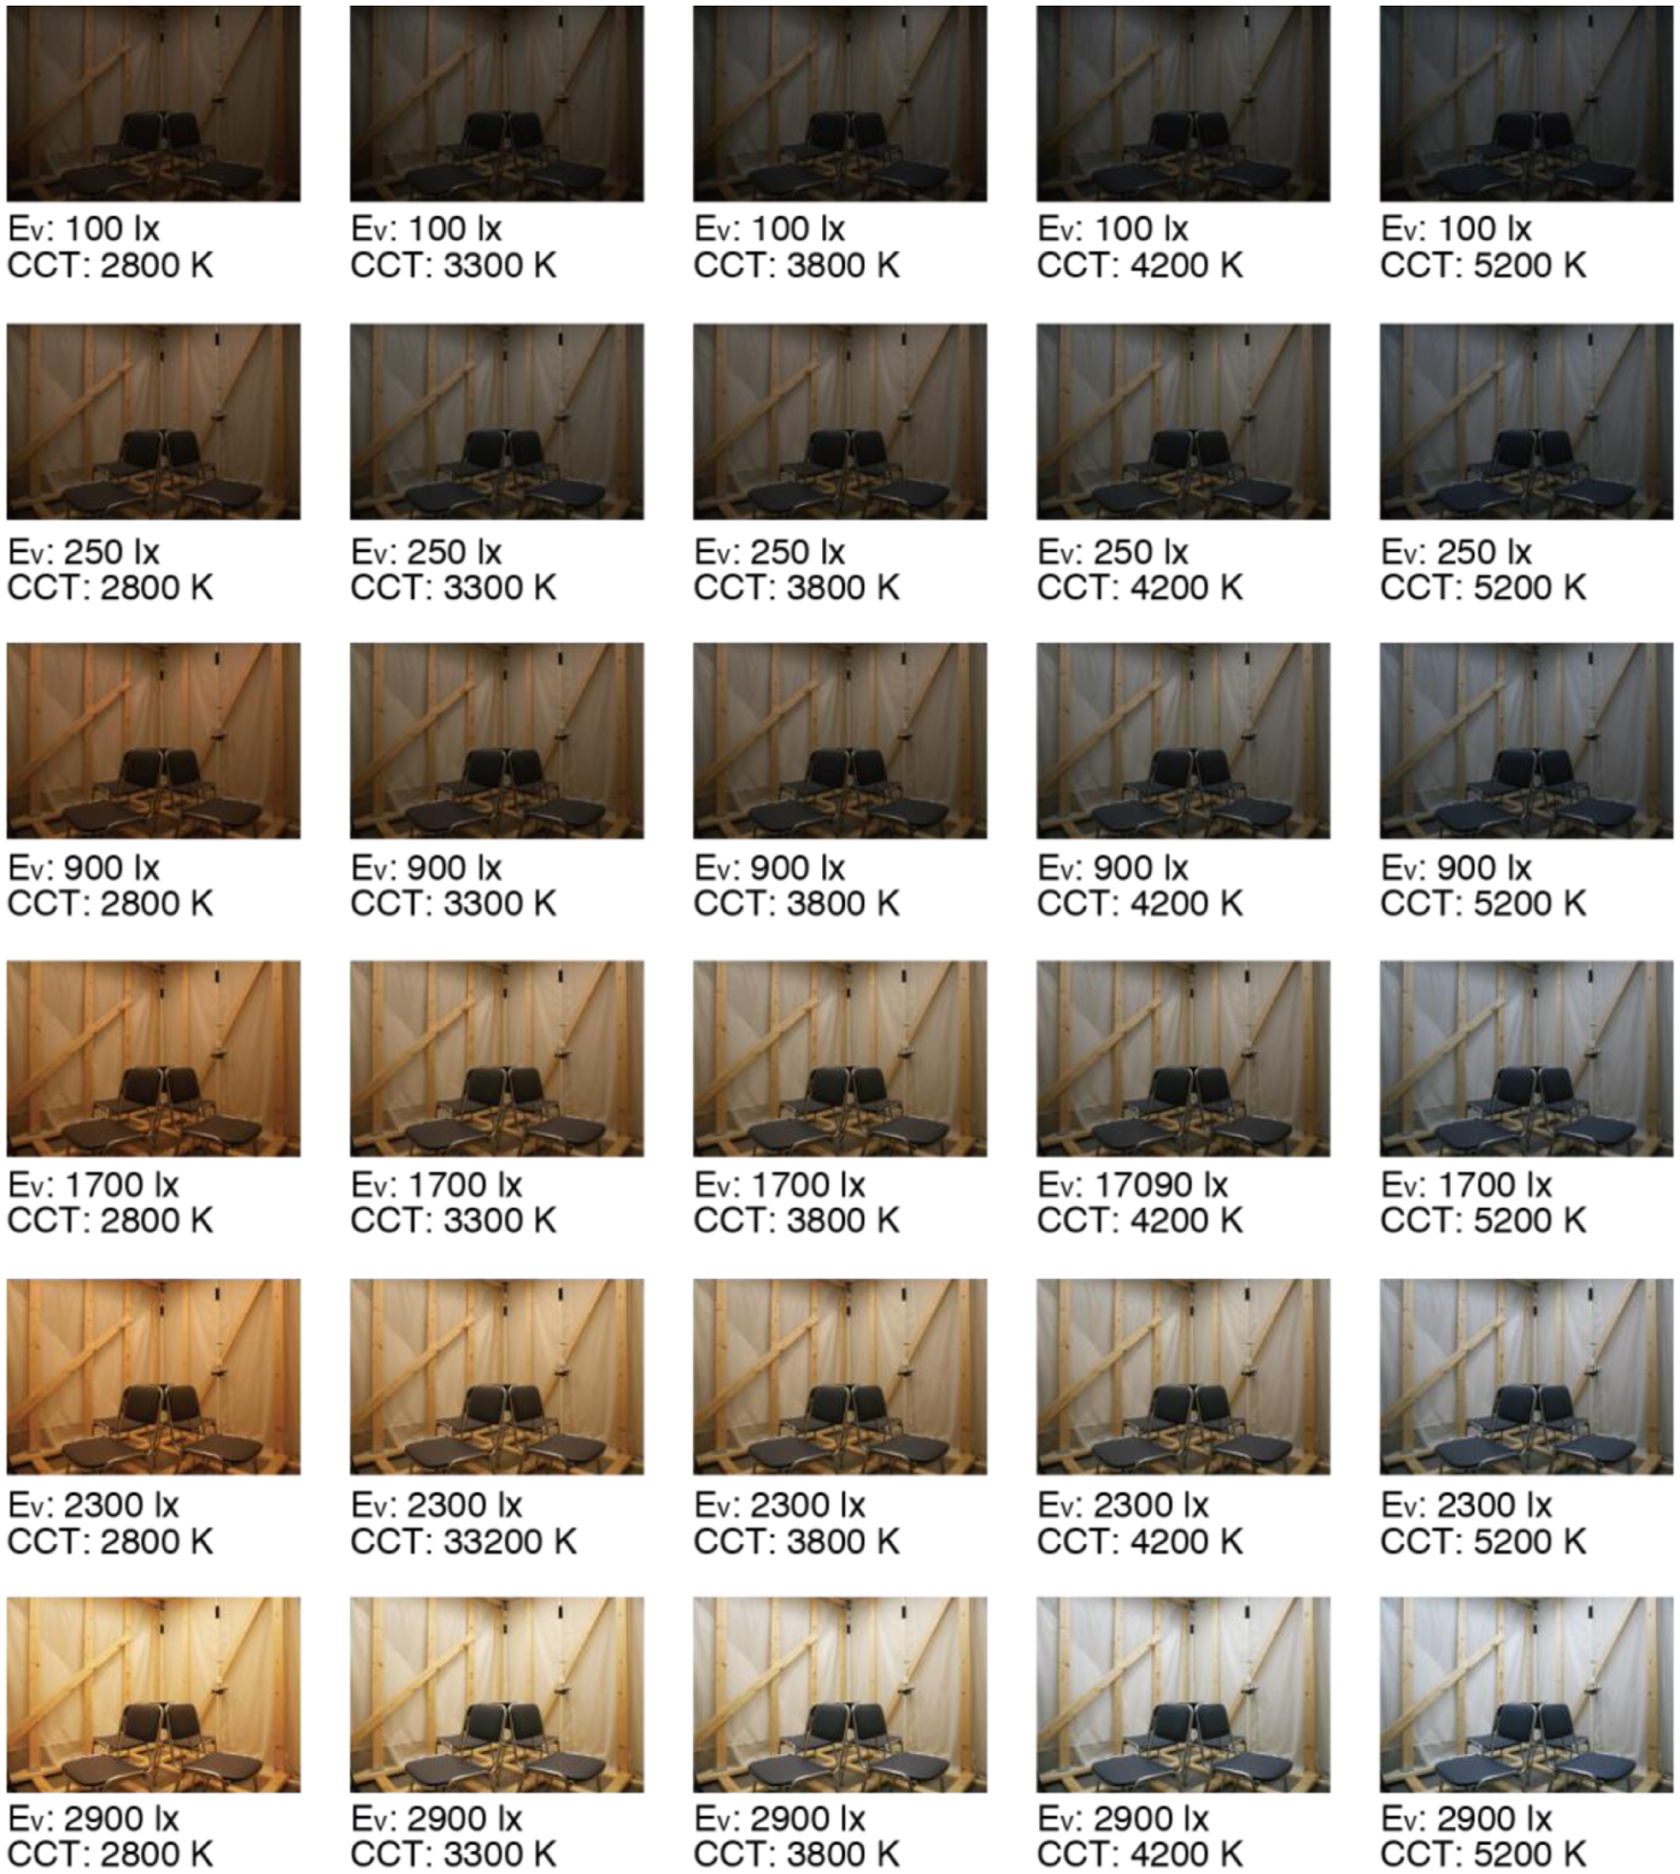
Experimental visual stimuli
Under the Japanese Office Sanitation Standards Regulation (pursuant to the Industrial Safety and Health framework), the minimum maintained illuminance on the task plane in rooms where workers routinely work is 300 lx for general office work and 150 lx for ancillary office work. 58 In addition, ISO/CIE 8995-1:2025 specifies lighting requirements for indoor workplaces and recommends maintained illuminances that vary with task demands, broadly spanning ordinary visual tasks to very fine/precision tasks. 59 Accordingly, we defined six illuminance conditions of approximately 100 lx, 250 lx, 900 lx, 1700 lx, 2300 lx and 2900 lx to cover a wide but practically relevant range from dim to very bright indoor lighting.
For lamp colour appearance, five CCT levels (approximately 2800 K, 3300 K, 3800 K, 4200 K and 5200 K) were selected to span typical categories from warm to cool white (e.g. incandescent/warm white to neutral white/daylight) as defined by Japanese colour classification standards for light sources. 60
Despite careful calibration, minor deviations from nominal settings occurred due to fixture geometry relative to each participant, surface reflectance and the interaction between illuminance and spectral tuning. Therefore, all analyses were conducted using the actual measured illuminance and CCT at each participant’s position rather than nominal setpoints, ensuring that the statistical results reflect the true exposure conditions experienced during the experiment.
2.5 Test participants
A total of 54 healthy young female participants took part in the study, distributed across the three air-temperature conditions as follows: 26°C (N = 16), 28°C (N = 22) and 30°C (N = 16). As each participant was only exposed to a single air-temperature condition (between-subjects design), repeated measures were not required and standard ANOVA techniques were employed for intergroup comparisons. The mean height was 159.5 ± 3.2 cm, the mean weight was 49.5 ± 4.4 kg, the mean body surface area (BSA) was 1.50 ± 0.07 m2 and the mean body mass index (BMI) was 19.4 ± 1.4. All participants fell within standard BMI ranges, indicating normal physiological status. BSA was used to confirm inter-condition uniformity of participants’ physique and to ensure physiological comparability among temperature groups, but it was not treated as an analytical parameter. BSA was calculated using the formula proposed by Kurazumi et al. 61 and validated in subsequent research. 62
The study adhered to the ethical standards of the Declaration of Helsinki. 63 Informed consent was obtained from all participants after full disclosure of the procedures. The study protocol was reviewed and approved by the Ethics Committee for Research Involving Human Subjects at Meijo University (Approval No. 2023-19). 64 Although this design minimised inter-individual variation, the findings are primarily generalizable to young female participants; further studies including male and mixed-sex cohorts are required to validate these results.
2.6 Experimental parameters
Environmental parameters were measured to accurately characterise the thermal and visual conditions experienced by participants. The following instruments and protocols were employed: all thermocouples and sensors were calibrated prior to testing using a standard reference thermometer (accuracy ±0.1°C). The reported ±0.3°C represents the mean deviation across measurement points, not the instrument’s precision limit.
Air temperature and relative humidity: Measured using an aspirated psychrometer. Air velocity: Assessed with an omnidirectional hot-wire anemometer. Vertical air and surface temperatures: Recorded using T-type thermocouples (ϕ = 0.3 mm) at 30 s intervals across multiple heights (floor, 10 cm, 30 cm, 60 cm, 90 cm, 120 cm, 150 cm, 170 cm, 200 cm and ceiling) to confirm stratification and ensure thermal uniformity. Illuminance and CCT: Measured at each participant’s seated position using a Konica Minolta CL-70F illuminance metre, with the sensor placed 70 cm above the floor and 50 cm in front of the torso, corresponding approximately to the participants’ eye level in a seated posture. This setup ensured precise capture of individual exposure conditions.
Mean skin temperature: Measured using thermistor sensors (Nikkiso-Thermo N542R; range: −50°C to 230°C; resolution: 0.01°C), attached to eight body sites (forehead, chest, upper arm, hand, thigh, calf, foot, sole) using breathable surgical tape (NICHIBAN Surgical Tape-21N).
Clothing insulation: Estimated using the trapped air layer method based on self-reported clothing ensembles. 65 Participants wore standardised light clothing (T-shirt, shorts, underwear, bra top made of polyurethane, polyethylene, nylon or cotton), with self-supplied undergarments.
Psychological responses: Whole-body thermal sensation and whole-body thermal comfort were evaluated using a linear, unidirectional rating scale validated by prior studies.15,66–68 Whole-body thermal sensation and thermal comfort were evaluated using a linear unidirectional rating scale 66 after 30 min of exposure to each visual condition. The scale ranged from 0 (cold, comfortable) to 100 (hot, uncomfortable), targeting specific thermal responses attributable to heat exchange between the body and its environment.
Given that occupants in thermally controlled environments often experience only mild discomfort, a significance threshold of α = 0.10 was used in regression analyses to capture subtle psychological trends. Statistical analyses were conducted using JMP 14.3.0 (SAS Institute, Tokyo, Japan).
3. Results
3.1 Thermal and visual–environmental conditions
At 26°C, the air temperature was well controlled; the standard deviation (SD) from the setpoint during steady-state operation was 0.3°C. The mean radiant temperature (MRT) was up to 0.6°C below the setpoint with minimal temporal fluctuation, indicating near-equivalence between wall surface temperatures and air temperature. Slightly lower wall temperatures near the floor were attributed to the influence of conventional air-conditioning. The operative temperature remained within 0.3°C (SD). Relative humidity varied by up to 4.0% (SD), and air velocity by 0.05 m s−1 (SD). At 28°C, thermal control remained stable. The air temperature showed an SD of 0.3°C. MRT exceeded the setpoint by up to 0.5°C, plausibly reflecting convective effects associated with HVAC operation. The operative temperature remained within 0.3°C (SD). Relative humidity varied by 4.2% (SD), and air velocity by 0.05 m s−1 (SD). At 30°C, the air-temperature variability was further reduced (0.2°C, SD), while MRT showed a maximum deviation of 0.5°C. The operative temperature remained within 0.3°C (SD). Relative humidity varied by up to 5.0% (SD), and air velocity by 0.06 m s−1 (SD). Slightly elevated wall temperatures near the ceiling were again attributed to HVAC-related convection.
Thermocouple sensors were calibrated against a precision reference thermometer in a constant-temperature water bath before each experimental series. In this section, the reported stability values for air temperature, operative temperature, relative humidity and air velocity represent SDs calculated from repeated trials under the same nominal thermal condition, evaluated during steady-state periods, rather than the precision limit of the measurement system. Overall, the thermal environment was stable across all setpoints, supporting near steady-state heat exchange between participants and the surrounding indoor environment during exposure.
At 26°C, the SD from target illuminance levels was 7.0 lx (100 lx), 9.8 lx (250 lx), 26.3 lx (900 lx), 69.7 lx (1700 lx), 66.8 lx (2300 lx) and 52.6 lx (2900 lx). The corresponding CCT SDs were 11.2 K (2800 K), 17.2 K (3300 K), 21.7 K (3800 K), 30.9 K (4200 K) and 55.0 K (5200 K). At 28°C, illuminance SDs were 3.2 lx (100 lx), 9.1 lx (250 lx), 25.7 lx (900 lx), 30.8 lx (1700 lx), 50.2 lx (2300 lx) and 59.7 lx (2900 lx). The corresponding CCT SDs were 11.2 K (2800 K), 17.2 K (3300 K), 21.7 K (3800 K), 30.9 K (4200 K) and 26.2 K (5200 K). At 30°C, illuminance SDs were 4.6 lx (100 lx), 4.7 lx (250 lx), 28.4 lx (900 lx), 38.9 lx (1700 lx), 45.4 lx (2300 lx) and 42.6 lx (2900 lx). The CCT SDs were 19.8 K (2800 K), 34.6 K (3300 K), 37.5 K (3800 K), 21.6 K (4200 K) and 38.2 K (5200 K).
For the visual environment, the SD values reported above were calculated by pooling measurements across all repeated trials conducted under the same nominal lighting condition, including variability attributable to seating position within the booth. Although horizontal illuminance and CCT therefore exhibited some spatial non-uniformity, the magnitudes of these pooled SDs were small relative to commonly reported perceptual thresholds. Hu and Davis 69 reported an illuminance just noticeable difference of approximately 7.4% relative to a reference level. JIS Z 9125:2023 70 provides guidance on minimum perceptible illuminance differences under typical viewing conditions. With respect to CCT, Diode LED 71 indicates that perceivable changes are typically on the order of ≥100 K at warm colour temperatures and ≥500 K at cool colour temperatures, while CIE TN 001:2014 72 relates perceptible colour differences to approximately Δu′·v′ ≈ 0.001 to 0.002, depending on chromatic adaptation. Taken together, these criteria suggest that the observed variability in illuminance and CCT is unlikely to have introduced systematic perceptual differences across participants, and thus is unlikely to have confounded comparisons between the prescribed lighting conditions. Accordingly, any residual spatial non-uniformity was incorporated into the reported pooled SDs and is unlikely to bias the condition-wise comparisons.
Although direct luminance measurements were not performed, the ceiling-mounted LED system was designed to provide diffuse and spatially uniform illumination within the booth. Spatial illuminance mapping confirmed an even horizontal illuminance distribution across the exposure area, supporting consistent perceived brightness within the participants’ field of view.
3.2 Mean skin temperatures
Mean skin temperature, a physiological indicator of the thermal response, was assessed under all test conditions. Figure 4 illustrates the relationship between CCT and mean skin temperature at each air-temperature setting. Previous studies indicate that, under steady-state conditions, neutral thermal sensation is typically achieved when mean skin temperature lies between 33.5°C and 34.5°C.55,73–75 In the present study, the reported values represent means over the exposure periods. Across all air-temperature settings, the SD of mean skin temperature was approximately ±0.6°C around the respective means and the values generally fell within, or close to, the neutral range, indicating that participants were close to physiological thermal neutrality.
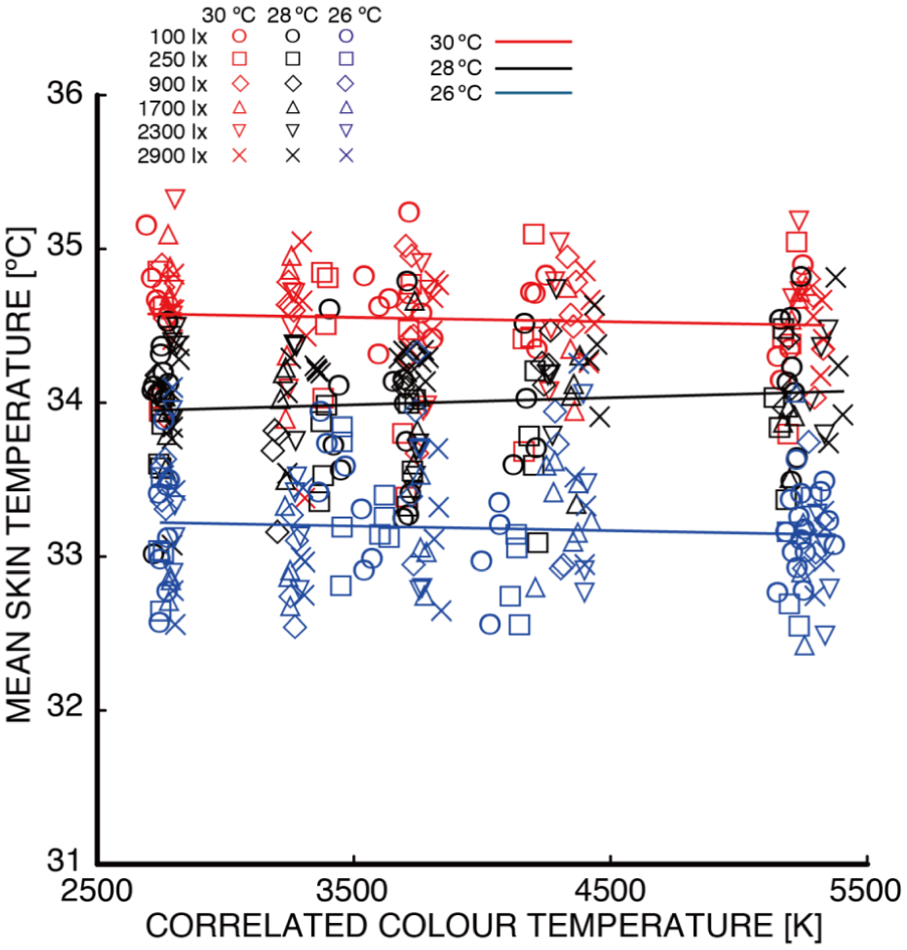
Relationship between CCT and mean skin temperature under three air-temperature levels
As expected, mean skin temperature was highest at 30°C and lowest at 26°C. Statistical analyses confirmed significant differences in mean skin temperature across air-temperature conditions (test of parallelism: p < 0.01; homogeneity test: p < 0.01; Tukey–Kramer comparisons: p < 0.01). At 26°C, regression analysis showed no significant slope (p = 0.27), and the tests of parallelism (p = 0.45), homogeneity (p = 0.48) and the interaction between CCT and illuminance (p = 0.52) were all non-significant. Mean skin temperature remained stable at approximately 33.2°C. Under the 28°C condition, whilst ANOVA did not indicate a significant slope (p = 0.13), the tests of parallelism and homogeneity indicated significant differences (p < 0.01). Tukey–Kramer comparisons identified significant differences only between 250 lx and 2900 lx (p < 0.01), whereas the CCT–illuminance interaction remained non-significant (p = 0.92). Mean skin temperature averaged approximately 34.0°C. At 30°C, no significant slope was observed (p = 0.48), and regression analyses across illuminance and CCT conditions (parallelism: p = 0.77; homogeneity: p = 0.76; interaction: p = 0.90) indicated no significant effects. Mean skin temperature was approximately 34.5°C.
In summary, significant physiological differences were observed across air-temperature conditions, but neither illuminance nor CCT had a meaningful effect on mean skin temperature. These findings confirm that the visual stimuli within the tested ranges did not alter physiological thermal balance.
3.3 Thermal sensation
Figure 5 illustrates the relationship between CCT and thermal sensation. A high degree of inter-individual variability was observed across all CCT levels, reflecting the inherently subjective nature of thermal perception under visually stimulated conditions. Nonetheless, clear trends emerged as air temperature increased, with participants generally reporting warmer sensations.
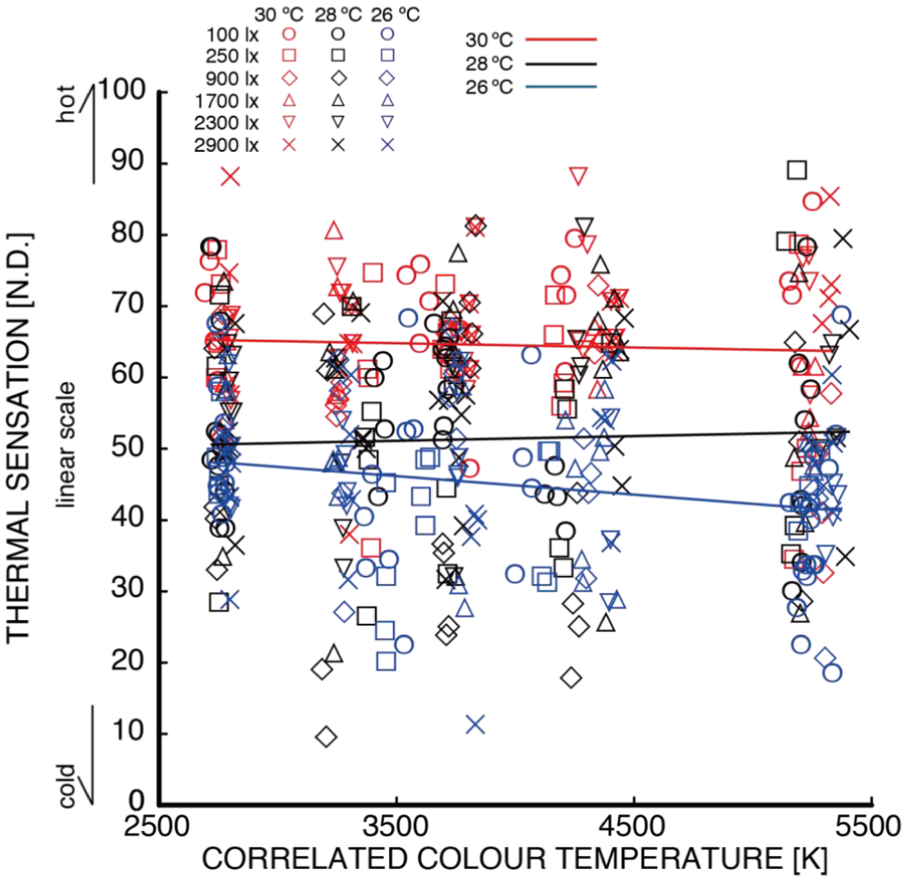
Relationship between CCT and thermal sensation under three air-temperature levels
At 26°C, thermal sensation showed a weak decreasing trend with increasing CCT. However, statistical analyses indicated no significant differences (test of parallelism: p = 0.49; homogeneity test: p = 0.36; Tukey–Kramer comparisons: p > 0.10), suggesting a stable perceptual response across CCT and illuminance levels under slightly cool conditions. Under the 28°C condition, the test of parallelism indicated significant differences in slope (p < 0.01), suggesting that illuminance modulated the rate of change in thermal sensation. Variance remained homogeneous (p = 1.00), and most pairwise comparisons were non-significant (p > 0.10), except for differences between 900 lx and higher illuminance levels (p < 0.10), indicating some sensitivity to illuminance. At 30°C, both the slope (p < 0.01) and variance (p < 0.01) differed significantly. Tukey–Kramer comparisons identified significant contrasts between 900 lx and 100 lx, 2300 lx and 2900 lx (p < 0.10), suggesting a stronger influence of visual stimuli on thermal perception under higher thermal loads.
Cross-condition comparisons revealed significant differences in slope and variance across air temperatures (tests of parallelism and homogeneity: p < 0.01), with pairwise differences among 26°C, 28°C and 30°C confirmed by Tukey–Kramer tests (p < 0.10). Analysis of CCT–illuminance interactions indicated that higher CCTs (≥4200 K) under high illuminance (>2000 lx) slightly increased thermal sensation, whereas the same CCTs under low-to-moderate illuminance (≤1500 lx) produced cooler impressions. These patterns were supported by statistical tests (parallelism: p = 0.05; homogeneity: p = 0.06; multiple comparisons among illuminance levels: p < 0.10).
These findings are partly consistent with ISO/CIE 8995-1:2025, 59 which reported that high CCTs evoke cool impressions and low CCTs evoke warmth. The present study refines this understanding by demonstrating that illuminance level mediates this effect, particularly under thermally warm conditions.
3.4 Thermal comfort
Figure 6 illustrates the relationship between CCT and thermal comfort. Substantial inter-individual variability was observed across all CCT levels, consistent with the analysis of thermal sensation. Overall, thermal comfort ratings decreased as air temperature increased, indicating greater discomfort under warmer conditions. When the regression lines for horizontal illuminance were examined at each air-temperature setting, thermal comfort showed a consistent decline with increasing air temperature. The test of parallelism indicated significant differences in slope (p < 0.01), and Tukey–Kramer comparisons confirmed significant pairwise differences among all temperature levels (p < 0.10). The homogeneity test likewise revealed significant differences in variance (p < 0.01).
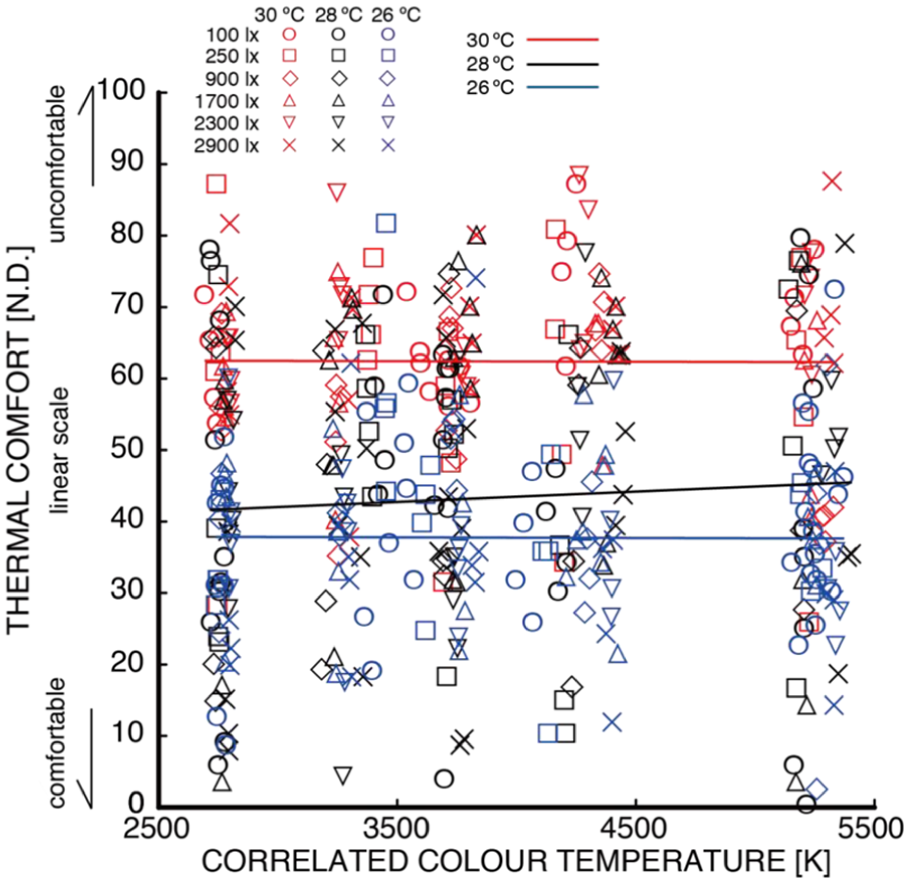
Relationship between CCT and thermal comfort under three air-temperature levels
At 26°C, no significant differences were observed in slope or variance across illuminance or CCT levels (parallelism: p = 0.50; homogeneity: p = 0.44; Tukey–Kramer: p > 0.10), suggesting that, under slightly cool conditions, thermal comfort remained stable regardless of visual stimuli. At 28°C, the slope and variance tests were also non-significant (parallelism: p = 1.00; homogeneity: p = 1.00), indicating perceptual stability under moderate warmth. However, at 30°C, the visual environment began to influence comfort ratings more noticeably: both the slope (parallelism: p = 0.01) and variance (homogeneity: p = 0.01) differed significantly. Tukey–Kramer comparisons identified significant differences, particularly between 250 lx and 900 lx, and between 900 lx and 2300 lx (p < 0.10), confirming that higher illuminance reduced thermal comfort under warmer conditions. Across all conditions, the main effect of CCT on thermal comfort remained limited. Statistical tests (parallelism: p = 0.92; homogeneity: p = 0.91; Tukey–Kramer: p > 0.10) showed no consistent differences attributable to CCT alone.
These findings are consistent with Bennett and Rey 18 and Grenne and Bell, 76 who reported that CCT exerts minimal influence on thermal comfort. The present study extends this evidence by demonstrating that, under warmer conditions, horizontal illuminance can amplify or mitigate thermal discomfort depending on its intensity. In particular, high illuminance levels (>2000 lx), which are common in technical workspaces, slightly increased discomfort when paired with high CCTs, whereas lower illuminance (<1500 lx), which is typical of general office or transitional spaces, was associated with improved comfort. Thus, whilst CCT alone does not strongly affect thermal comfort, its interaction with illuminance and ambient temperature becomes relevant under specific environmental conditions.
3.5 Mean skin temperature and thermal sensation
Figure 7 shows the association between mean skin temperature and thermal sensation. Thermal sensation increased with mean skin temperature across the tested conditions. Mean skin temperature values varied across the three air-temperature settings, whereas the experimental environment was maintained under steady-state conditions.
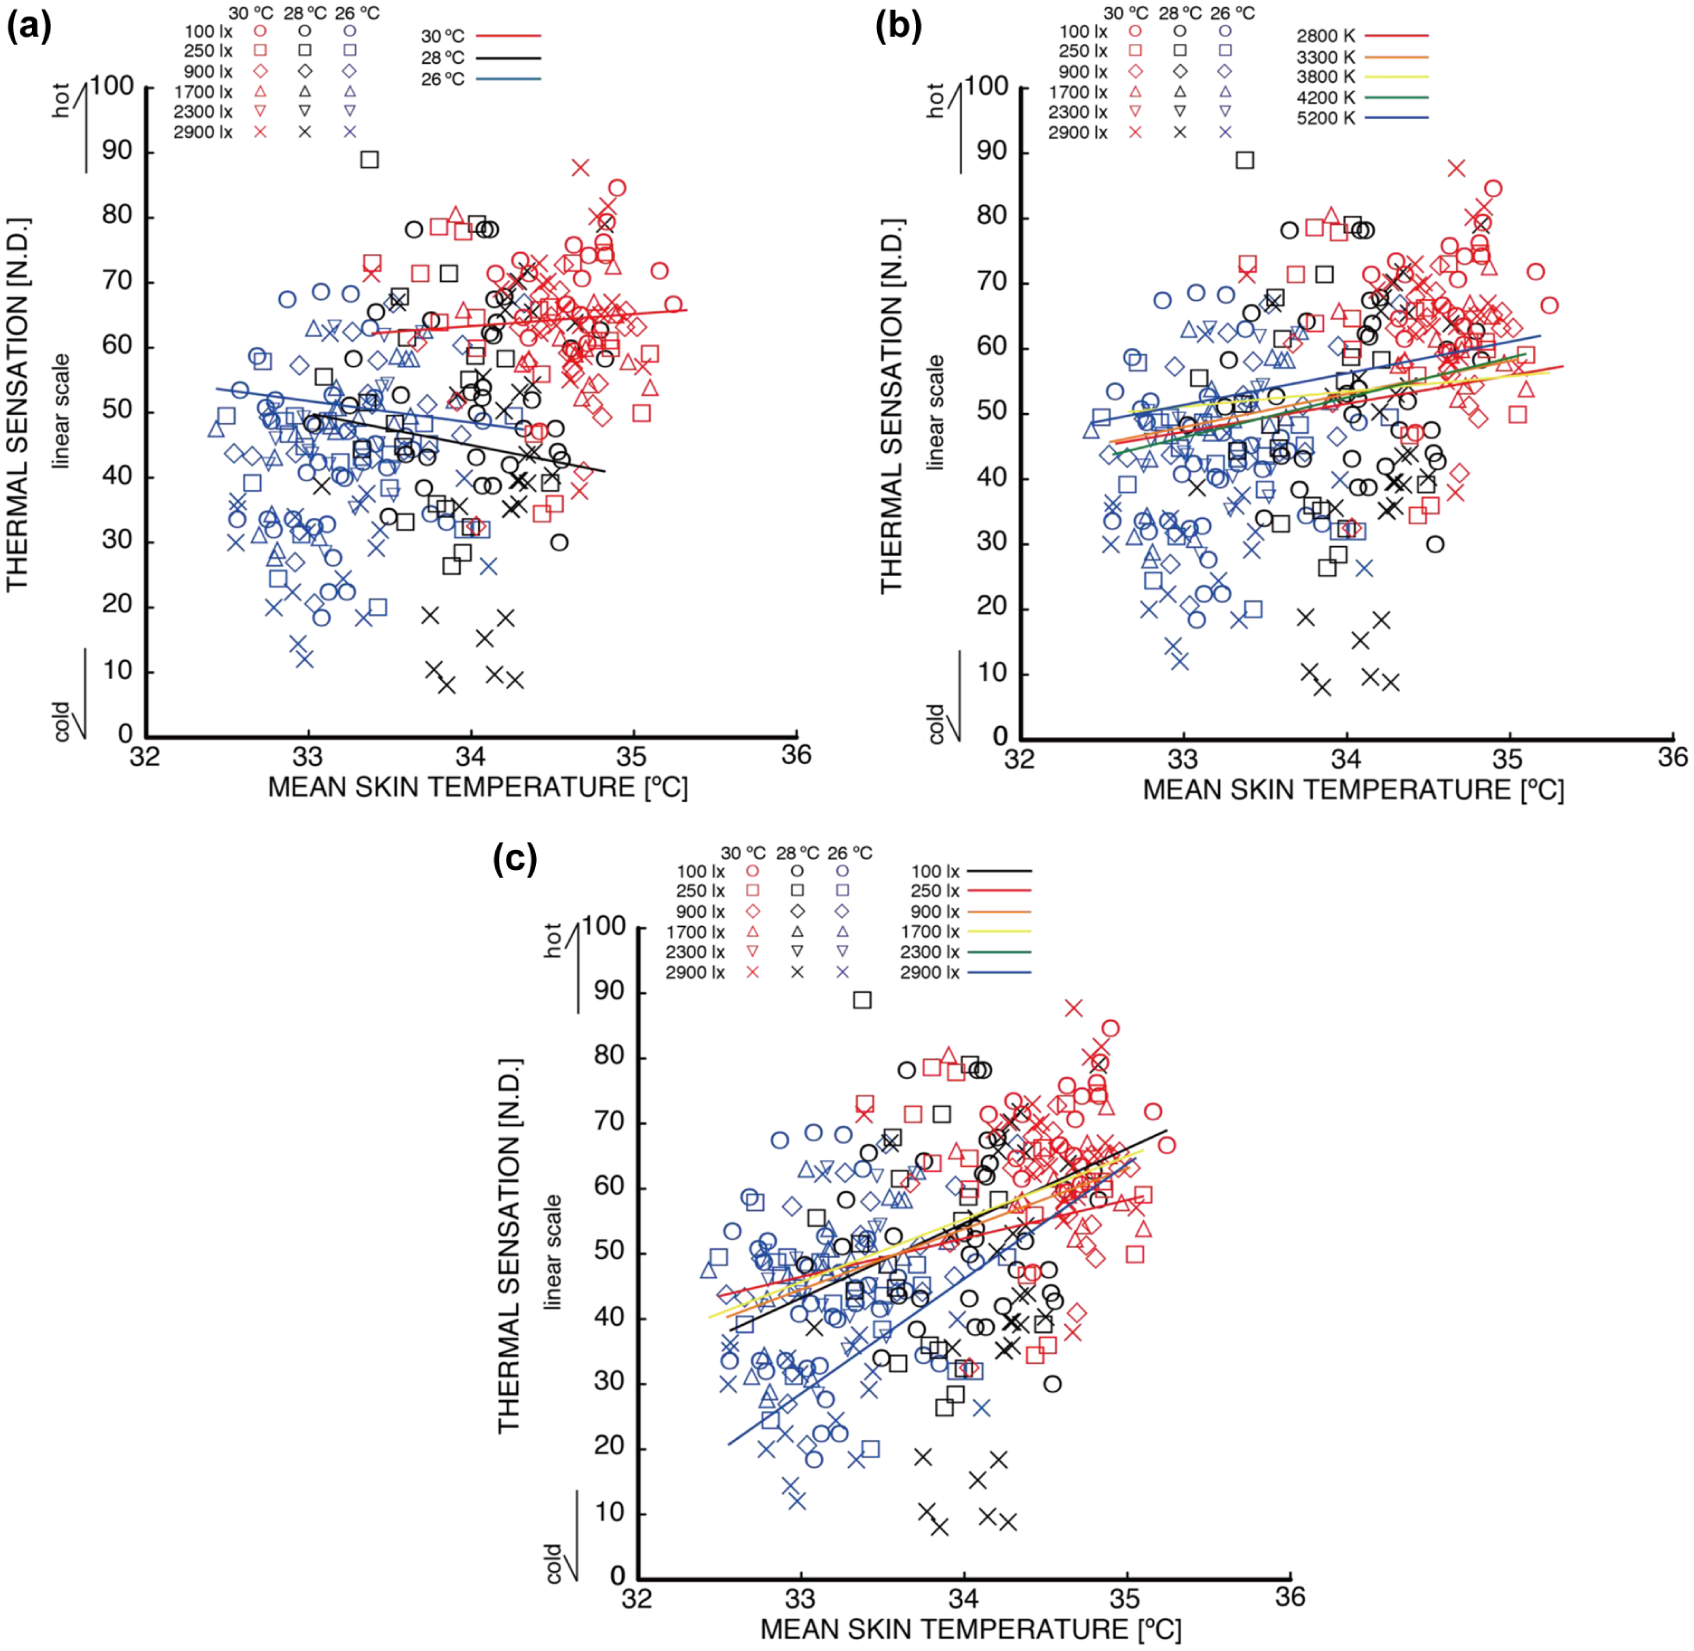
Relationship between mean skin temperature and thermal sensation under three air-temperature levels (a), five CCT levels (b) and six illuminance levels (c)
When horizontal illuminance was used as the explanatory variable, the regression analysis did not indicate a significant overall trend. However, the parallelism test and the homogeneity test indicated differences among regression lines at the 10% significance level (parallelism: p < 0.10; homogeneity: p < 0.10). Tukey–Kramer comparisons identified significant differences between specific illuminance pairs (100 lx vs. 900 lx, 250 lx vs. 1700 lx and 900 lx vs. 1700 lx; p < 0.10).
When CCT was used as the explanatory variable, no statistically significant differences were detected (parallelism: p = 0.50; homogeneity: p = 0.54; Tukey–Kramer: non-significant). At the lower end of mean skin temperature, thermal sensation ratings were slightly higher under 2800 K than under other CCT conditions.
3.6 Mean skin temperature and thermal comfort
Figure 8 presents the relationship between mean skin temperature and thermal comfort. Thermal comfort decreased as mean skin temperature increased, indicating a close association between physiological thermal load and discomfort under the present steady-state conditions.
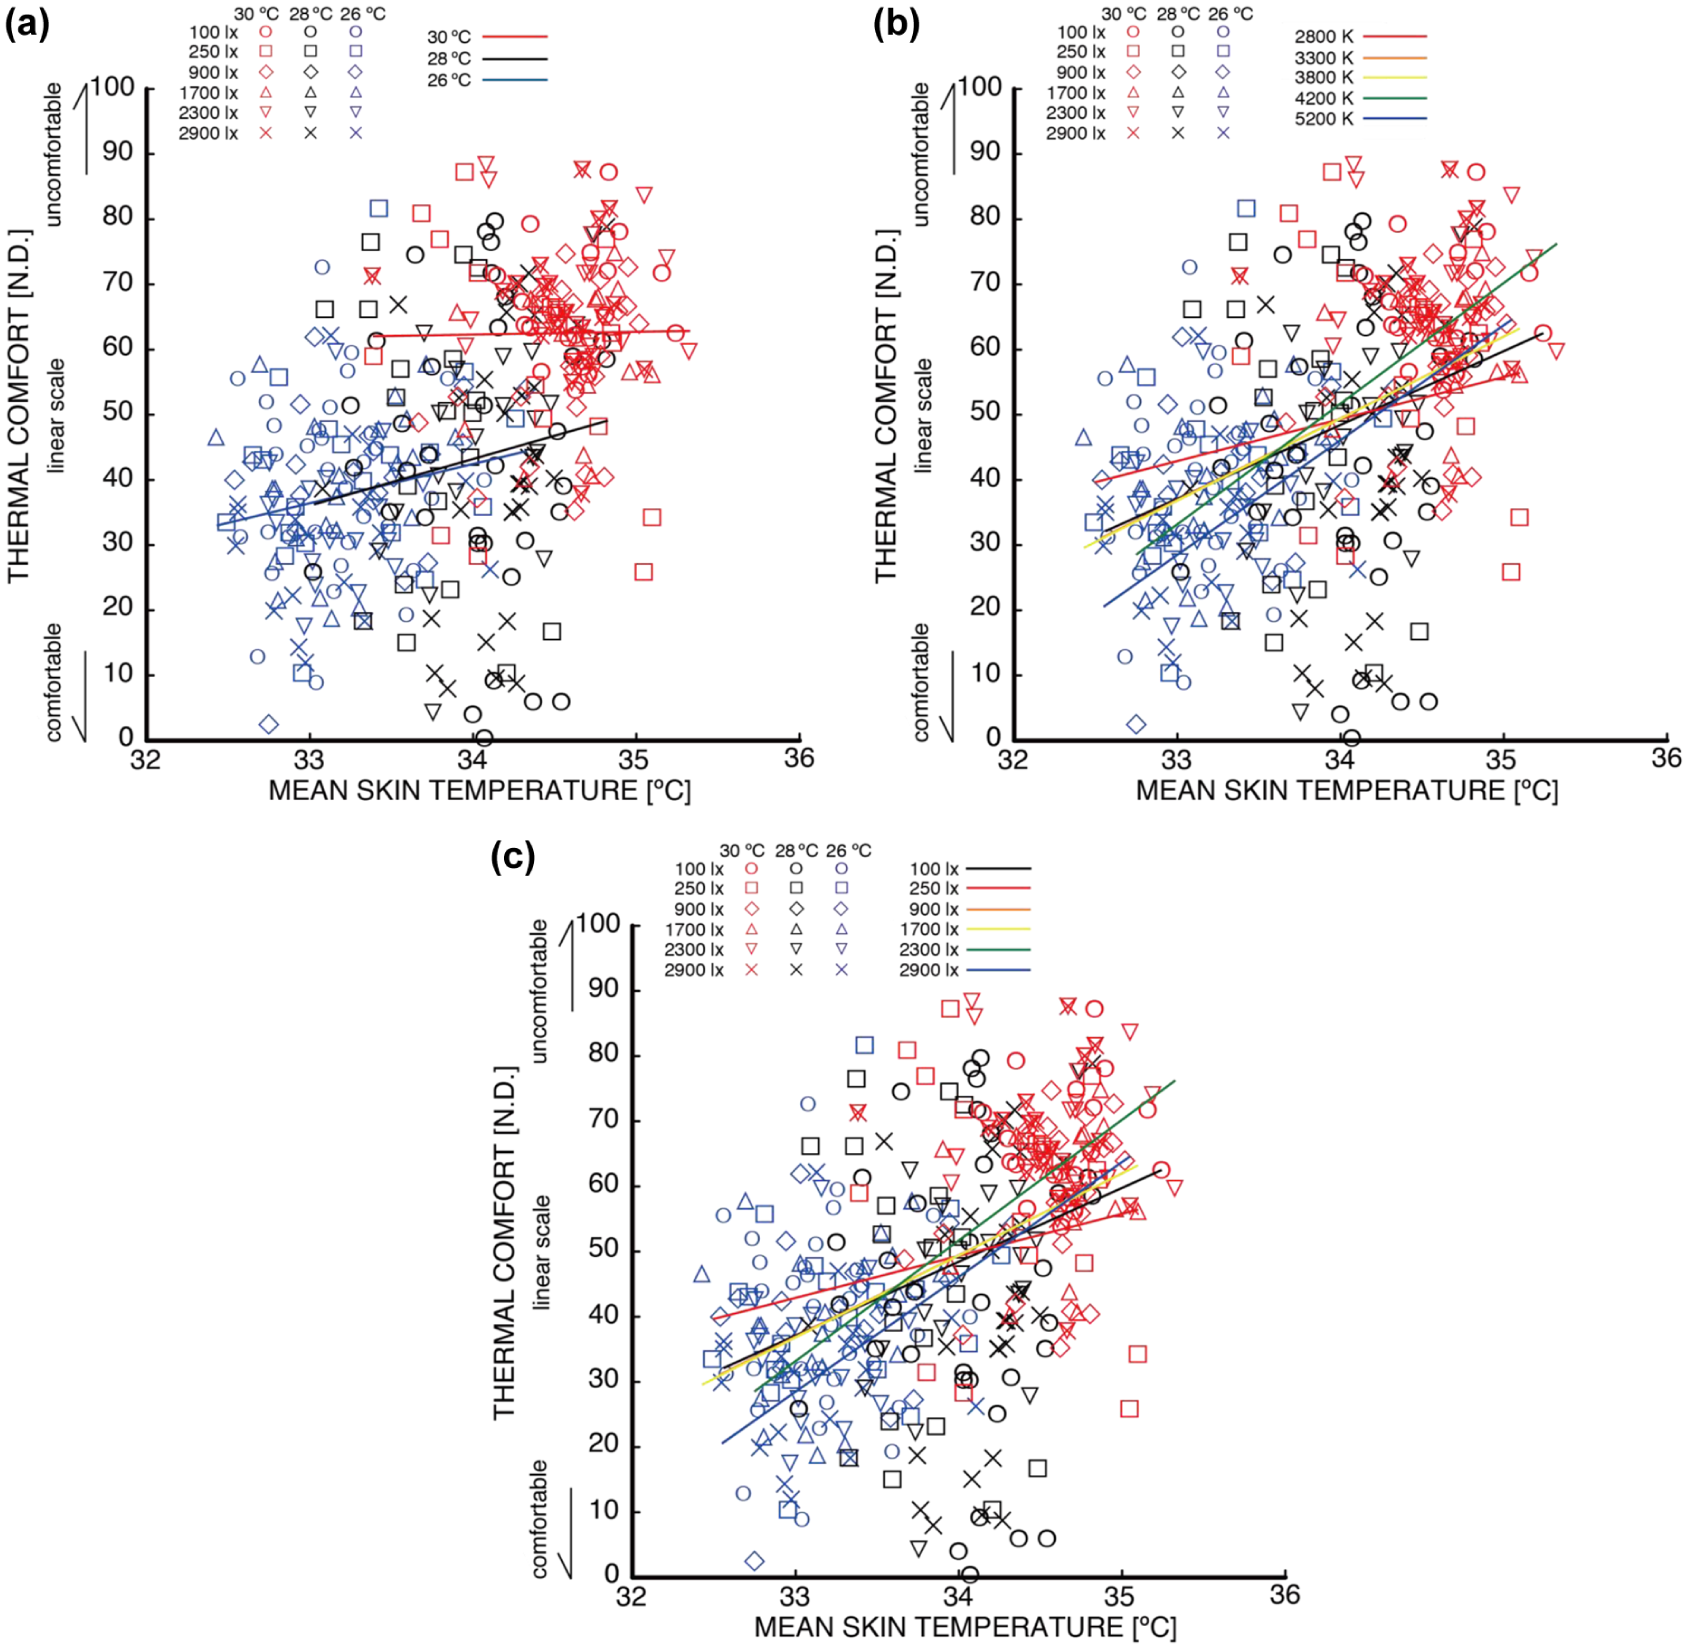
Relationship between mean skin temperature and thermal comfort under three air-temperature levels (a), five CCT levels (b) and six illuminance levels (c)
Regression analyses stratified by horizontal illuminance indicated that the strength of the mean skin temperature–comfort relationship differed across illuminance conditions. Lower illuminance levels (100 lx to 250 lx) were associated with a weaker relationship, whereas higher illuminance levels (2300 lx to 2900 lx) were associated with a stronger relationship, particularly when mean skin temperature exceeded approximately 34°C.
Statistical testing indicated significant differences among regression lines (homogeneity: p < 0.01). Tukey–Kramer comparisons showed differences between several illuminance pairs, including 1700 lx versus 2300 lx and 2900 lx; 100 lx versus 2300 lx and 2900 lx and 250 lx versus 2900 lx (p < 0.10).
In contrast, regression analysis using CCT as the visual factor indicated no statistically significant effect on the relationship between mean skin temperature and thermal comfort (parallelism: p = 0.27; homogeneity: p = 0.26; Tukey–Kramer: non-significant). Thus, within the tested range, CCT did not measurably alter the association between physiological thermal load and thermal comfort.
3.7 Thermal sensation and thermal comfort
Figure 9 illustrates the relationship between thermal sensation and thermal comfort. Thermal sensation votes were distributed predominantly near the neutral point (approximately 50 on the 0–-100 scale), and thermal comfort ratings were also highest in this region.
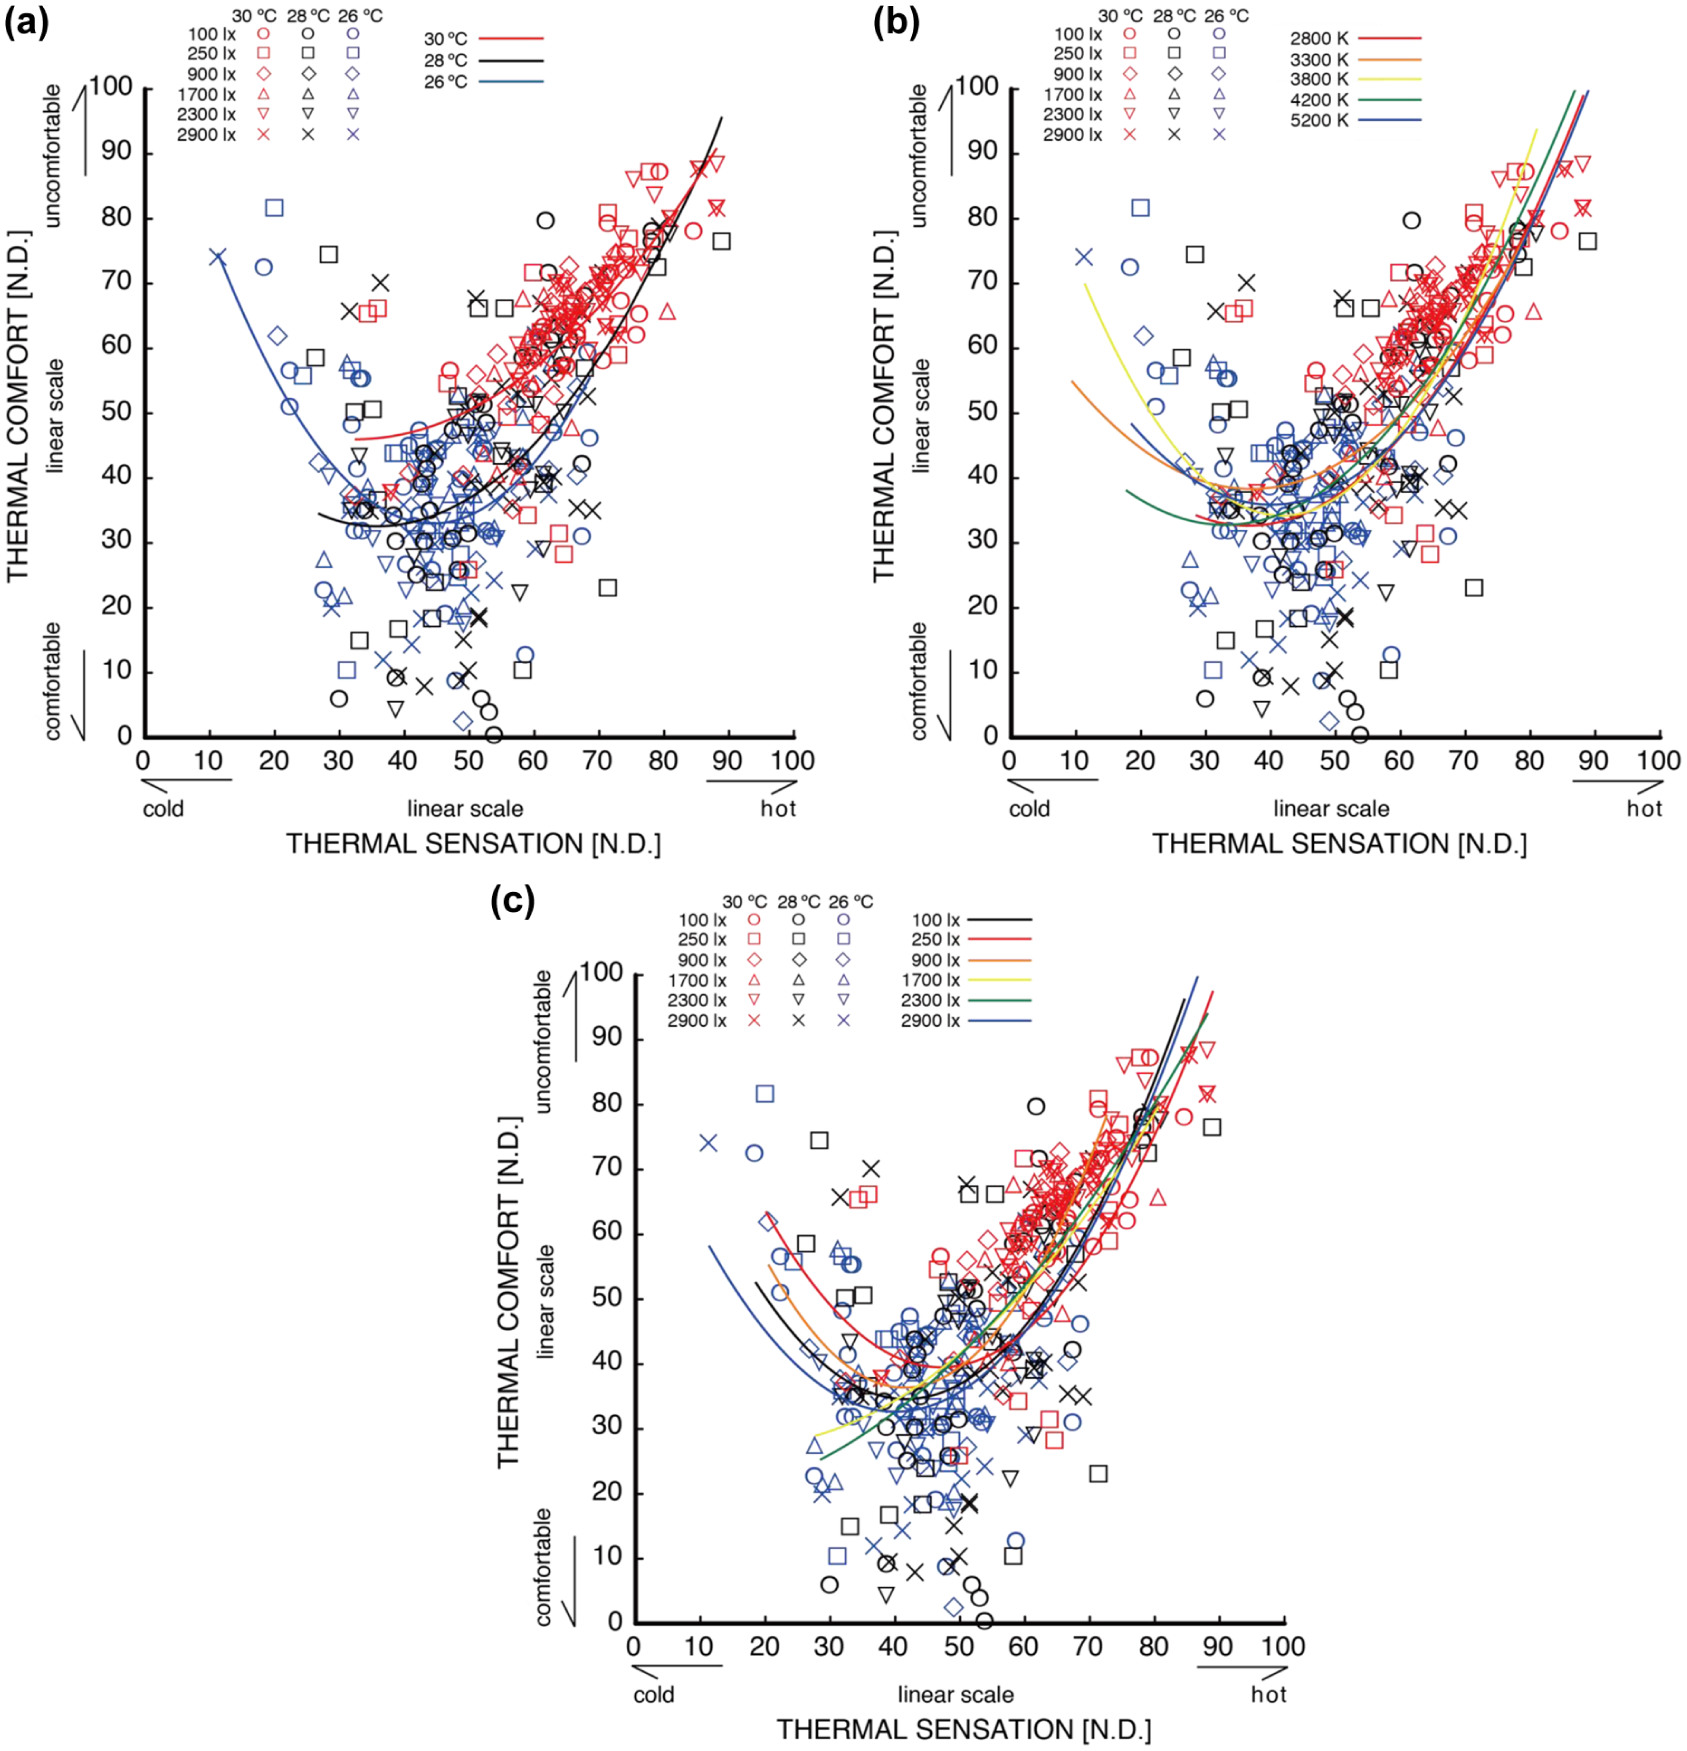
Relationship between thermal sensation and thermal comfort under three air-temperature levels (a), five CCT levels (b) and six illuminance levels (c)
Regression analysis indicated that maximum comfort occurred at slightly cooler sensation values, namely 44.2 at 26°C, 36.1 at 28°C and 32.3 at 30°C. Thermal comfort was similar between 26°C and 28°C. But decreased markedly at 30°C when thermal sensation exceeded neutrality. At 26°C, comfort also decreased when thermal sensation fell well below neutral, indicating a lower bound beyond which further cooling was associated with discomfort.
The thermal-sensation range associated with comfort was 23.3 to 65.1 at 26°C, 8.4 to 63.5 at 28°C and 16.2 to 48.4 at 30°C. The comfort-tolerance range was widest at 28°C and narrowest at 30°C, whereas the 26°C condition showed an asymmetric pattern with greater sensitivity to cold discomfort.
Across CCT levels, regression analysis indicated no significant differences on the warm side of the thermal-sensation scale. Under cooler conditions, however, thermal comfort was higher at 2800 K. Differences in regression slopes were significant (parallelism test, p < 0.01), and Tukey–Kramer comparisons indicated differences among 2800 K, 3300 K and 4200 K (p < 0.10). Variances were homogeneous (p = 0.91).
4. Discussion
4.1 Interpretation of mean skin temperature–thermal sensation relationship
Previous studies54,71–73 reported neutral thermal sensation at mean skin temperatures of approximately 33.0°C to 34.5°C. The mean skin temperatures observed in the present study generally fell within or close to this range, suggesting that participants were, on average, near thermal neutrality with only modest deviations.
Although illuminance did not yield a significant overall regression trend, the significant differences among regression lines and the pairwise differences identified at the 10% significance level indicate that thermal sensation may be perceptually modulated at particular illuminance ranges. Recommended illuminance levels for offices and general indoor tasks are typically 300 lx to 1500 lx in Japanese and international standards.58–60 The pattern observed around 900 lx is consistent with the recommended values and may indicate an illuminance range in which visual input begins to influence thermal perception.
By contrast, CCT showed no statistically significant modulation across the tested range. Nevertheless, the slightly higher thermal sensation ratings under 2800 K at lower mean skin temperatures may reflect a compensatory psychological response under relatively cooler physiological states. This interpretation is consistent with Oe et al., 50 Lee et al. 77 and Fu et al., 78 who reported enhanced relaxation and comfort under low-CCT lighting.
In the present study, 2800 K tended to be perceived as warmer at lower mean skin temperatures but cooler at higher ones, implying that any thermal impression associated with CCT may depend on the baseline thermal state rather than acting as a uniform effect.
Overall, mean skin temperature functioned as a robust physiological correlate of thermal sensation, whereas horizontal illuminance, particularly around 900 lx, showed evidence of perceptual influence on thermal sensation under the tested conditions. The influence of CCT was weaker and appeared context-dependent.
These findings align with previous work indicating that lighting can indirectly affect comfort-related judgements. Ishii and Horikoshi 22 reported that, at an operative temperature of 28°C under steady-state heat balance, thermal sensation did not differ between fluorescent lighting (4200 K) and incandescent lighting (2850 K), although lower illuminance improved overall comfort. While non-specific comfort (involving higher-order cognitive appraisal such as spatial impression) differs from specific thermal comfort, their results support the possibility that illuminance and CCT can modulate comfort appraisals indirectly.
From an application perspective, the 900-lx condition, typical for office tasks,58,60 suggests that reducing task illuminance may mitigate perceived warmth and thereby improve comfort under warm indoor conditions. Modern LED systems enable precise control of luminous flux and CCT with low additional energy demand; therefore, lowering general lighting levels during cooling periods may permit slightly higher cooling setpoints (e.g. 28°C instead of 26°C) without compromising perceived comfort. Given that a 1°C increase in the cooling setpoint can reduce cooling energy use by approximately 3% to 10%,79–81 such strategies may contribute to comfort-oriented, energy-efficient building operation.
In Japan, the FY2022 Annual Report on Energy by the Ministry of Economy, Trade and Industry (METI) reports that space cooling and heating account for approximately 29% of household energy consumption, while motive power and lighting account for approximately 33%. 2 Given the substantial contribution of space conditioning to residential electricity demand, applying low-illuminance strategies that support higher cooling setpoints could yield meaningful energy savings, consistent with national energy-conservation and carbon-neutrality goals.
4.2 Interpretation of mean skin temperature–thermal comfort relationship
The results suggest that horizontal illuminance modulates thermal discomfort under warm conditions. The stronger decline in thermal comfort at high illuminance, particularly when mean skin temperature exceeded ∼34°C, implies that bright lighting can exacerbate discomfort when the physiological thermal load is elevated, whereas lower illuminance may attenuate discomfort.
This interpretation is consistent with Ishii and Horikoshi, 22 who reported that, under steady-state thermal balance, lower illuminance improved overall comfort. Although overall comfort (which involves higher-order cognitive appraisal, such as spatial impressions) is not identical to thermal comfort, the findings collectively support the view that illuminance can influence comfort judgements indirectly.
More broadly, lighting characteristics are known to affect alertness and relaxation. For example, standards guidance notes that neutral-white light (4600 K to 5500 K) is associated with greater alertness, whereas warm-toned light (2600 K to 3250 K) tends to promote relaxation. 60 Bright light may sustain arousal and improve task performance,78,79 which could plausibly increase sensitivity to discomfort in warm conditions. In the present study, CCT showed little overall influence on the mean skin temperature–comfort relationship; however, under low illuminance, a CCT of 2800 K appeared to improve thermal comfort in some conditions, suggesting a secondary, context-dependent role.
From a practical perspective, the reduction in discomfort under low illuminance in warm conditions indicates a potential strategy for energy conservation. By optimising visual conditions, specifically, reducing horizontal illuminance to below approximately 300 lx during cooling periods, it may be possible to maintain acceptable comfort at higher cooling setpoints (e.g. 28°C instead of 26°C).
In Japan, the FY2022 Annual Report on Energy by the METI indicates that space cooling and heating account for approximately 29% of household energy consumption, while motive power and lighting account for approximately 33%. 2 Increasing the cooling setpoint by 1°C can reduce HVAC electricity use by approximately 3% to 10%,79,80 and a 2°C increase could yield 6% to 20% savings,79–81 depending on climate, building envelope and system efficiency. Therefore, low-illuminance strategies that preserve comfort at higher setpoints may reduce cooling demand and associated emissions, supporting both energy-efficient building operation and national energy-conservation goals.
4.3 Interpretation of thermal sensation–thermal comfort relationship
The present results indicate that maximum thermal comfort tended to occur under mildly cool sensations, and tolerance narrowed substantially at 30°C. This pattern suggests that, as ambient warmth increases, participants become less tolerant of additional warmth and maintain comfort at lower thermal-sensation values.
Although the influence of visual factors on thermal comfort remains incompletely characterised, the present findings indicate condition-dependent effects, particularly under cooler sensations. Previous studies conducted under more extreme lighting and/or thermal conditions have reported both significant8,19–28,31,34–35,37,38,78,82 and negligible18,36,41,76 CCT-related influences on thermal perception. In the present study, CCT effects were negligible under warm sensations but were detectable under cooler sensations, where 2800 K was associated with higher comfort. This supports the possibility that low-CCT lighting may be beneficial when occupants are in relatively cooler perceptual states, including conditions around 28°C.
Lighting characteristics are also associated with behavioural and cognitive states. High-CCT lighting (approximately 4600 K to 5500 K), commonly used in office settings, is often linked to increased alertness and task performance,56,71,72 whereas low-CCT lighting (approximately 2600 K to 3250 K) is associated with relaxation and is commonly perceived as thermally warm. Similarly, higher illuminance can sustain arousal and task performance,83,84 whereas lower illuminance is associated with calmer states. These psychophysiological associations provide a plausible context for why visual conditions may modulate comfort judgements even when thermal balance is maintained.
Consistent with Ishii and Horikoshi, 22 who reported improved overall comfort under lower illuminance in steady-state thermal balance, the present results suggest that illuminance may indirectly influence thermal comfort, even though overall comfort and thermal comfort are not identical constructs. In addition, standards guidance notes that neutral-white light (4600 K to 5500 K) is associated with alertness and concentration, whereas warm-toned light (2600 K to 3250 K) tends to promote relaxation, 60 which may contribute to comfort appraisal under mildly cool or warm states.
From an energy-efficiency perspective, these findings suggest that optimising the visual environment, particularly by using lower horizontal illuminance (e.g. <300 lx) and, where appropriate, low-CCT lighting (∼2800 K), may help maintain or enhance thermal comfort at higher cooling setpoints (e.g. around 28°C). If acceptable comfort can be achieved with reduced reliance on mechanical cooling, such strategies may reduce HVAC energy demand and associated emissions, supporting integrated comfort–energy design.
Established guidance indicates that increasing the cooling setpoint can reduce cooling electricity consumption, with the magnitude depending on climate, envelope performance, system efficiency and operating schedules.79–81 In Japan, the FY2022 Annual Report on Energy by the METI reports that space cooling and heating account for approximately 29% of household energy consumption, while motive power and lighting account for approximately 33%. 2 Given the substantial contribution of cooling demand during summer, visual–environment optimisation that enables higher setpoints without loss of comfort could contribute to energy conservation and carbon-neutrality
4.4 Limitations
This study focused on the summer cooling season. Human thermal sensation can vary across seasons due to acclimatisation (longer-term seasonal adjustment) and adaptation (shorter-term adjustment). Regarding seasonal effects of CCT, Kakitsuba et al.24,25 reported minimal physiological and psychological effects in winter but measurable effects in summer; extending this to transitional seasons, Kakitsuba et al. 23 observed no effect in autumn but observable effects in spring. These studies primarily examined CCT in isolation, with limited consideration of horizontal illuminance or its interaction with CCT. Based on this literature, and on the expectation that visual cues may more readily modulate thermal appraisal under warm conditions, we hypothesised that combined illuminance–CCT effects would be most detectable during the cooling period. Accordingly, focusing first on summer responses was methodologically justified.
Experiments were conducted exclusively with female participants. Previous studies85–87 indicate that, relative to men, women tend to prefer lower illuminance and lower CCT; however, these studies only weakly linked such preferences to the concurrent thermal environment. In addition, sex-related differences in thermoregulatory control, including the core-temperature setpoint, are well documented. To reduce sex as a potential confounder and to clarify visual–thermal interactions, the present study evaluated lighting effects in conjunction with thermal conditions in a female cohort. Consequently, the generalisability of the findings is primarily to young female participants, and confirmation in mixed-sex and male cohorts remains an important direction for future work.
5. Conclusion
This study examined the combined effects of air temperature, horizontal illuminance and CCT on thermal sensation and comfort under steady-state indoor conditions with 54 healthy young female participants. Mean skin temperature was primarily driven by air temperature, whereas subjective responses reflected contributions from both thermal and visual factors.
Across the three temperature levels, 28°C provided the widest comfort–tolerance range, while 26°C and 30°C showed narrower ranges (the latter constrained on the warm side, the former skewed towards cold discomfort). Under slightly warm conditions (≥28°C), reducing horizontal illuminance to <300 lx mitigated discomfort and shifted thermal sensation towards coolness. Under slightly cool conditions (≤26°C), low-CCT lighting (∼2800 K) improved comfort by offsetting perceived coldness. Overall, illuminance exerted a stronger influence on both thermal sensation and comfort than CCT within the tested ranges, while CCT effects were secondary and context-dependent (beneficial mainly on the cool side).
From an application standpoint, adjusting lighting, lowering general illuminance during cooling periods and using warmer colour temperature when occupants feel cool can support comfort at higher cooling setpoints (e.g. around 28°C) without additional HVAC cooling, thereby contributing to energy-efficient, occupant-centred operation. These recommendations should be implemented in conjunction with visual task requirements and lighting standards and interpreted within the scope of this study (female, steady-state cooling, illuminance 100 lx to 2900 lx, CCT 2800 K to 5200 K). Future work should verify generalizability in mixed-sex and male cohorts, and under dynamic thermal/visual conditions.
In office-like settings, creating zones with lower general illuminance for non-critical tasks while maintaining task lighting as required can balance visual performance and thermal comfort, and may enable higher thermostat setpoints.
Footnotes
Declaration of conflicting interests
The authors declared no potential conflicts of interest with respect to the research, authorship, and/or publication of this article.
Funding
The authors received no financial support for the research, authorship, and/or publication of this article.