
Abstract
It has been shown that the use of CIE standard r-tables, instead of actual reflection properties of stabilised pavements, frequently leads to non-compliance with EN 13201 standard, particularly in terms of uniformities. Furthermore, the conventional observation geometry of 1° does not represent the preferred observation geometries of different road users in urban areas. In this paper, we present the device COLUROUTE2 that can be used to measure the r-table of a road surface on site for observation angles between 1° and 10°. Our experimental campaigns carried out on 18 different pavements (with bituminous mixtures and cement concretes) confirm that the CIE road photometric indicators S1, Q0 and Qd generally decrease as the observation angle increases. Our results show that the assumption of equivalence of Q0 and Qd measurements between 1° and 2.29° in the CIE 144 technical report is not always valid, but there are strong correlations between the different observation angles.
1. Introduction
For motorised vehicles, the CIE
1
defined the M lighting classes that set the performance criteria for a lighting installation in terms of luminance. The surface of a pavement is described according to its reflection properties.
2
The most characteristic parameter is the luminance coefficient q (unit sr−1 or cd.m−2.lx−1), given as the quotient of the luminance L of a surface element in a given observation direction and the illuminance E on the same surface element from directional incident illumination. In road lighting, this coefficient is measured for a conventional observation angle of
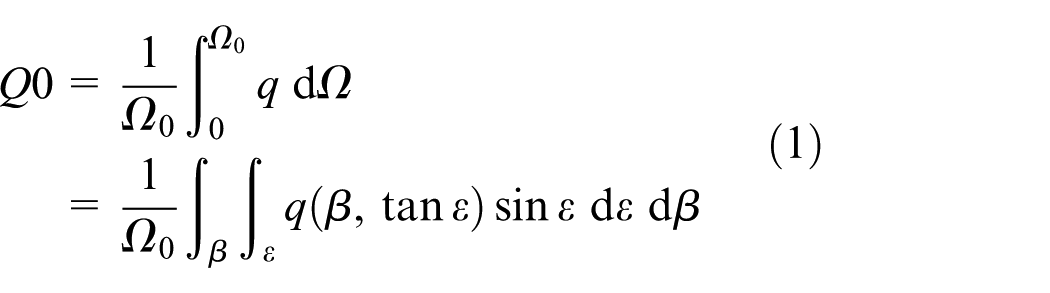
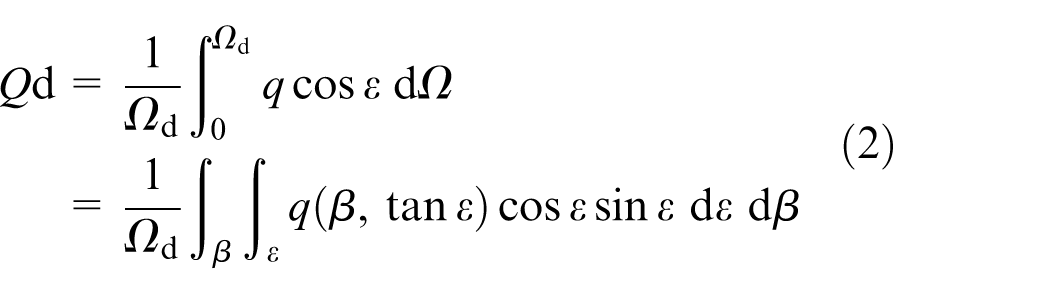
Since the 1970s, the CIE defined several indicators to represent globally the photometry of road surfaces under the standard 1° conventional observation angle.3,4 The specular factor S1 represents the degree of specularity (shininess) of the observed surface. It is defined as the ratio between the reduced luminance coefficients of two specific illumination condition: r(β = 0, tan(ε) = 2) divided by r(β = 0, tan(ε) = 0). The average luminance coefficient Q0 represents the degree of lightness of the measured surface. It is computed as the average of the luminance coefficients over a solid angle, corresponding to the whole r-table. In 2001, the CIE also introduced the luminance coefficient under diffuse illumination Qd. 2 It is the average of the luminance coefficient weighted by cos(ε) integrated over the complete hemisphere above the road surface. Qd was first introduced for the characterisation of road marking under daytime illumination, with an observation angle of 2.29°.2,9
Moreover, CIE 144 technical report 2 makes recommendations for the consideration of road surface for road lighting dimensioning in luminance. It recommends that standard r-tables be scaled using the diffuse luminance coefficient Qd instead of Q0 and provides weighting coefficients for estimating Qd (as for Q0) from an r-table. This recommendation to use Qd instead of Q0 for scaling is not applied in practice for several reasons.
- In the most widely used lighting design software, only Q0 scaling is possible.
- The commercial devices capable of measuring road markings Qd have a measurement angle of 2.29° instead of the conventional observation angle of 1° used in road lighting. In the CIE 144 report, this difference in geometry is mentioned, 2 but the Note 4 of Section 2.4 states that this is not a problem because ‘Qd is not sensitive to the observation angle in this range. Q0 is in practice derived from r-tables. The simultaneous use of Qd, Q0 and r-tables implies interchangeable use of 2.29° and 1° for the observation angle. This does not result in significant discrepancies, but a single value should be selected eventually’. At the end of the introduction part, it is also written: ‘It is recommended that both values be used for the time being and that the value of 2.29° be adopted in the future’.
The recent review 10 on worldwide practices of luminance has confirmed that the CIE standard r-tables are still used among the world. When a standard r-table scaling is recommended (like in Belgium, Denmark, Finland, Italy, New Zealand, Sweden and Switzerland), another Q0 is always recommended and never a Qd. What does research say about the relevance of using Qd instead of Q0 in road lighting and on the influence of the viewing angle on the reflective properties of road surfaces?
Concerning the use of Qd, the first suggestion to use Qd instead of Q0 for road lighting designing dates from the 1990s and was introduced by Sørensen et al. 11 A device able to measure Qd and Q0 was developed with an observation angle of 1.37°. A method to compute Qd from an r-table was given and later introduced in the CIE 144 report. 2 Sørensen 12 calculated the average luminance (Lave) and illuminance (Eave) for a typical lighting installation with two different lamp settings for all standard r-tables provided in the different CIE classifications (C, R, N and W). He compared the ratios Lave/Eave obtained with these 14 different r-tables to the values of Q0 and Qd. For the two road lighting installations used, Qd gave the best estimate of the average luminance, with discrepancies between 0% and ±8% for Qd and an underestimation from −12% to −39% for Q0. In a 1997 French study, 13 the same comparison was made with 12 lighting installations and the measured r-tables of 174 different pavements. The mean discrepancy was between −2% and −13% for Q0 and between −13% and −41% for Qd. The results obtained were always better when using Q0 and showed that the Qd factor underestimates the specular effect with larger differences for pavements presenting high specularity.
However more recently, Greffier et al. 14 compared the performance of scaling CIE standard r-tables according to Q0 or Qd. To do this, they carried out simulations on the 7 CIE reference lighting situations 15 with 731 measured r-tables and compared their results with same simulations conducted on the corresponding standard r-tables scaled either according to Q0 and Qd. They have shown that the use of Qd seems more relevant than Q0 for scaling a standard r-table. Like CIE 144 report, this study recommends using Qd instead of Q0 for scaling an r-table. However, this is a Qd calculated from a table measured at 1° and not from a retroreflectometer at 2.29°. Greffier et al.’s study also found a linear relationship between the Qd at 1° estimated from an r-table and the Qd obtained directly using a laboratory setup 16 under the road marking geometry (diffuse illumination, observation at 2.29°).
Several researches investigated the impact of different observation angles on the road surface reflection properties. For example, Stockmar 17 indicated that the use of an observation angle of 3° instead of 1° induces a 10% reduction of Q0. Sorensen et al. 18 developed a device able to measure at 1°, 1.5° and 2.29°. Their first results on a class RII pavement showed that the impact on Q0 and S1 was weak, especially for Q0 and Qd and S1 decreases with increasing angle. In the Greffier et al. 19 case study, the impact of using observation angles of 2.29°, 3° and 5° was studied with an Imaging Luminance Measurement Device (ILMD). The luminance and uniformities were calculated according to the EN 13201 mesh grid, using the concept of moving observer proposed by Stockmar. 17 They showed that the luminance decreases with an increase of the observation angle. In Gibbons pHd, 20 a four-angle gonioreflectometer was used, and the influence of different observation angles was studied on 20 cores of pavements with α = 1°, 2°, 3°, 5°, 7°, 10°, 12°, 15°, 20°, 30°, 45° and 90°. It was shown that the lightness of the pavement changes with the observation angle and except for the smaller observation angles, the specularity decreases with the observation angle. This result was confirmed more recently by Greffier et al. 21 on four different road surfaces and Saint-Jacques et al. 22 on 22 road surfaces. In the CIE 144 report, there were no references or data validating the equivalence of Q0 and Qd measurements at 1° and 2.29°. Furthermore, there have been no large-scale studies (either in the laboratory or on site) that have investigated these differences since then.
However, what is the optimal geometry for road lighting design, especially on urban areas? In 2008, Chain and Marchaut 6 proposed several observation angles in urban areas: 3° for vehicle drivers in urban streets, 10° for the bicycles and pedestrians and 45° for visually impaired people. Stockmar 17 also suggested an angle of 3° in urban area, introducing the concept of the moving observer that Greffier et al. 19 used in their case study. In the EMPIR SURFACE project, 23 recommendations where given, 24 based on stopping distances, with 2.29° for urban environment and consistency with standard road marking characterisation geometry 2 and 5° for urban driving at low speed, cycling and scooters. All these various proposals were not based on an objective study of the angles preferred by different users. Two studies25,26 with eye-tracking devices show differences in visual strategy of cyclists as a function of age. Moreover, Pashkevich et al. 27 showed that the distribution of gaze fixations of cyclers are 42.5% on the roadway while it is 36.5% for electric scooters. However, neither of these papers propose a preponderant angle of observation. Lebouc et al. recent study 28 used virtual simulation and an eye tracker to find the preferred observation geometries for different road users, depending on their mode and speed of travel. For drivers travelling at 75 km h−1, an angle of 1° is still relevant. However, in an urban environment, when driving at 25 km h−1 or cycling, an angle of 3° seems more appropriate. In their very recent opinion paper, Fotios et al. 29 extended one step further by suggesting the introduction of a new lighting class called U classes for urban area in the next update of CIE115. A luminance angle of 3° would be used for motorists travelling at lower speed on urban roads and cyclists on mixed-use roads, while the angle of 1° would remain valid for motorists travelling at higher speed on interurban roads (M classes).
These changes in viewing angles will require a better understanding of the reflection properties of road surfaces and therefore the collection of r-tables for different observation angles. The aim of this study is to characterise the reflection properties of pavements for different types of users (and therefore for different angles of observation), and also to verify the strong hypothesis of equivalence of geometry between 1° and 2.29° for Q0 and Qd indicated in CIE 144 report, which, to our knowledge, has not been scientifically proven. To do this, a prototype called COLUROUTE2 was used to measure road surface r-tables on site for observation angles between 1° and 10°. Indeed, the advantage of field measurements is that they are non-destructive, and therefore pose no risk of damaging the surface to be characterised.
This paper first presents the measuring device, the experimental sections and the measuring protocol. The results section comprises four parts: validation of the used protocol, the r-tables measured at the different angles, the comparison of Q0 and Qd at 1° and 2.29° and finally the links between the different indicators. The last section gives our conclusions and perspectives.
2. Method
2.1 Presentation of the prototype COLUROUTE2
A portable measurement device, called COLUROUTE2, was developed by the Cerema and complies with the specifications of the CIE 144 technical report. 2 With this instrument, shown in Figure 1, the luminance coefficients of a road surface are measured on site, day or night, without extracting pavement cores and for several observation angles, whereas COLUROUTE only allowed for 1° measurements. 30 In addition to the conventional 1° observation angle for road lighting, angles of 3° and 10° were chosen based on the recommendations of the study by Chain and Marchaut, 6 and an angle of 2.29° was adopted in order to comply with the geometry recommended for road markings and in the CIE 144 report. Since there were no validated angle recommendations for urban areas at the time COLUROUTE2 was developed, the 5° angle was added to provide an intermediate value between 3° and 10°.
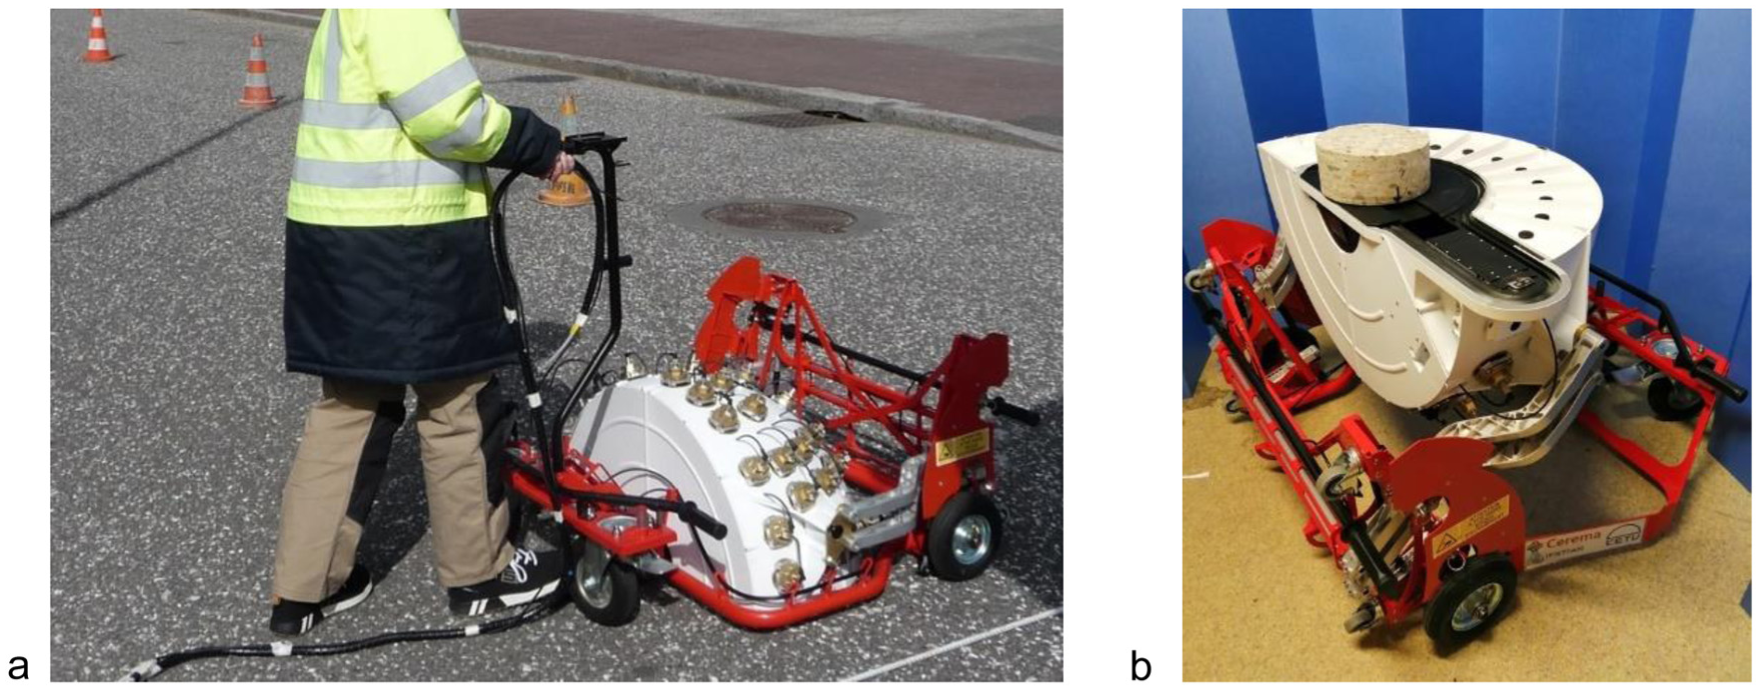
Photographs of the COLUROUTE2 measuring road surfaces on field (a) and in its ‘head-up’ position (b)
COLUROUTE2 is a quarter sphere made with a 3D printer integrated into a chassis and can both measure road surfaces on site (see Figure 1(a)) and samples in its ‘head-up’ position as shown in Figure 1(b).
Like for the first generation of COLUROUTE, 30 27 lighting sources illuminate successively the road surface with different fixed combinations of angles β and ε. The position of COLUROUTE2 lighting sources, represented in Figure 2, were chosen judiciously to optimise both the reconstruction of the complete r-table and to allow the calculation of the specularity factor S1 directly, since there is a source for r(β = 0, tan(ε) = 0) and another for r(β = 0, tan(ε) = 2).
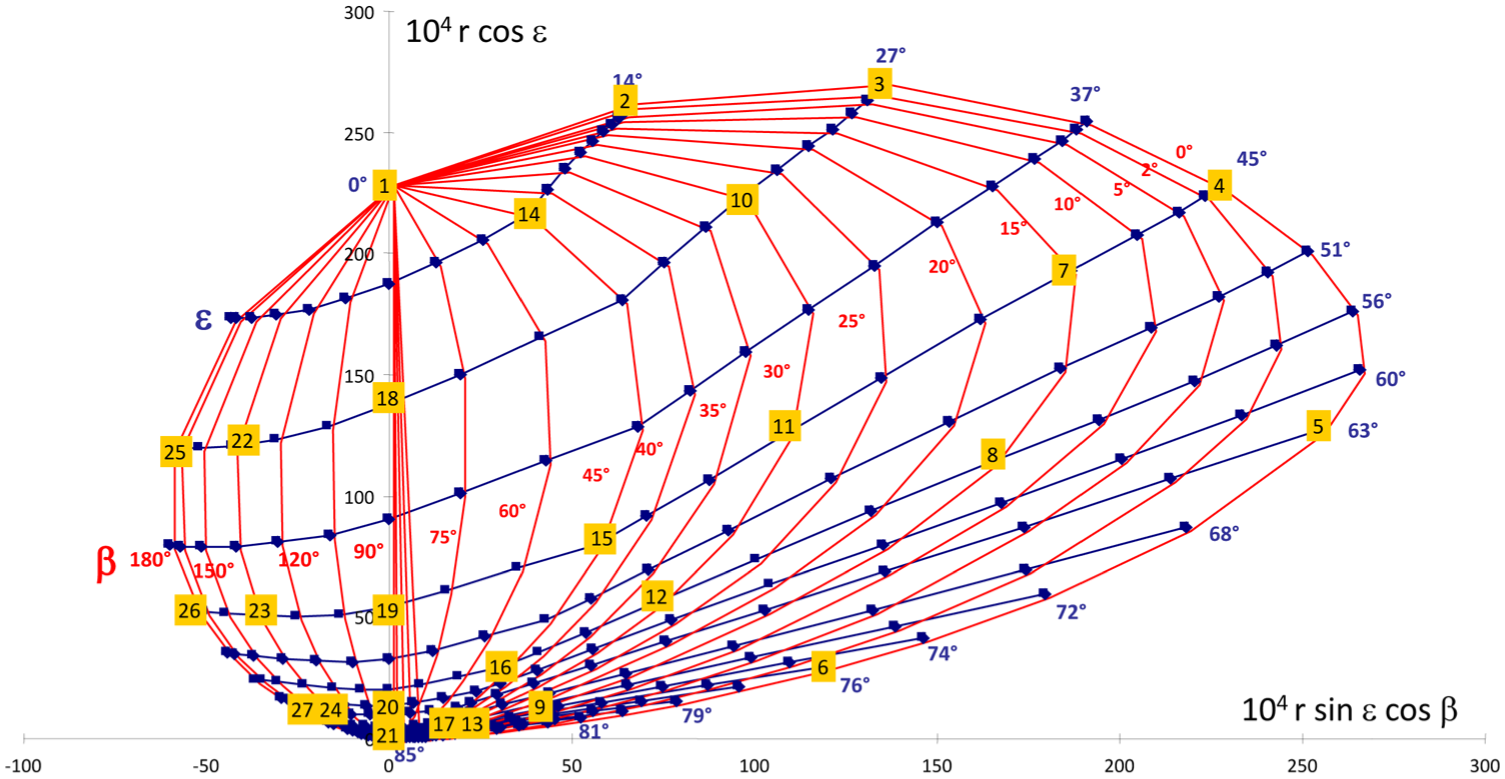
Representation of the reflexion indicatrix of an r-table. The angle β is in red, the angle ε is in blue and the localisation of COLUROUTE2 illuminating angles are represented in yellow with the source number indicated
The development of the parametric functions used for the reconstruction of the complete r-table was based on an experimental study. A reference set of 109 representative r-tables measured with Cerema laboratory gonioreflectometer 31 was used, and the 27 control points corresponding to the position of the sources were extracted. The objective was to preserve the control points, obtain good accuracy for both Q0 and S1 and maintain a realistic shape of the reflectance indicator. In the resulting algorithm, the columns (β) and rows (ε) of the r-table are calculated in turn, using cubic Hermite polynomials, a log-normal law and a decreasing exponential. Figure 3 shows the performance of the model for the CIE standard r-tables of the R classification. The reconstruction error was evaluated on 41 road samples. The average error on Q0 is 4.1% and 1.7% without roads in class R4. Very specular surfaces reflect light differently than others at illumination angles β of 2° and 5°. This lower modelling performance for higher specularity is due to the absence of measurement sources at 2° and 5° due to lack of space.
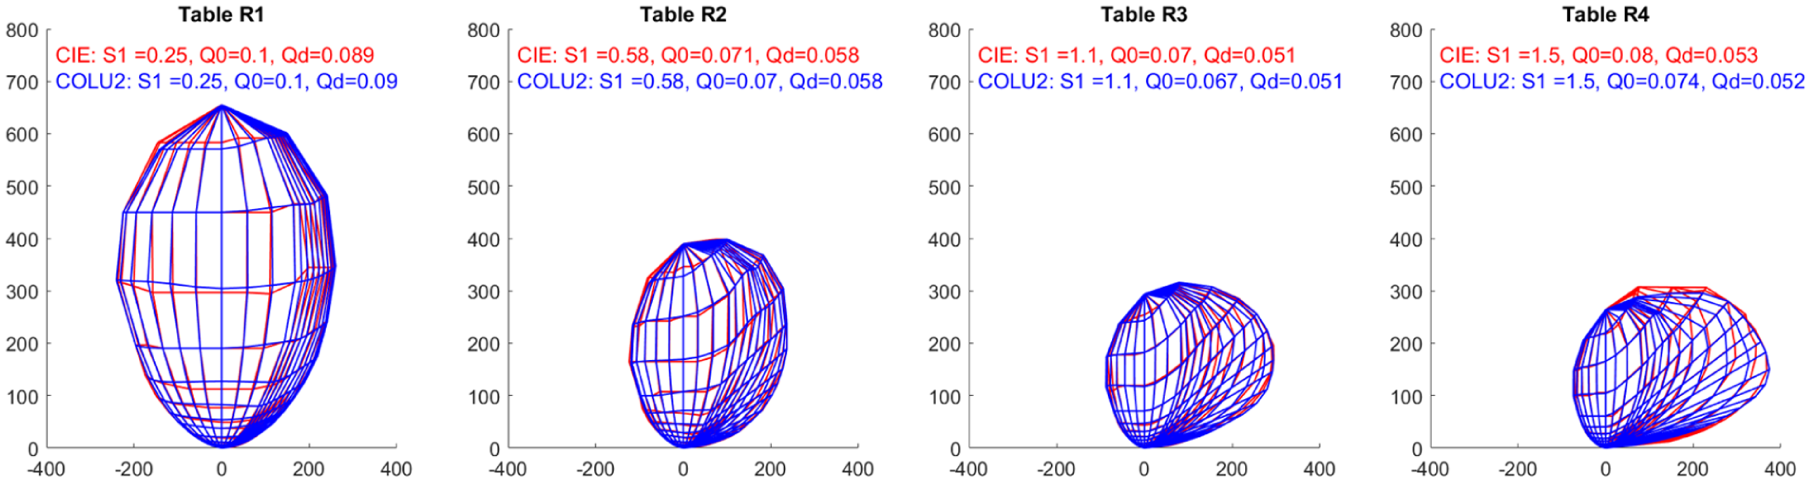
Standard r-tables R1, R2, R3 and R4 in red and COLUROUTE2 reconstruction in blue
The 27 lighting sources are composed of white LEDs and an optical system that generates a parallel ray of light of 5 cm diameter (plan of Figure 4(a)). Thanks to an elliptic diaphragm adapted to the incidence angle
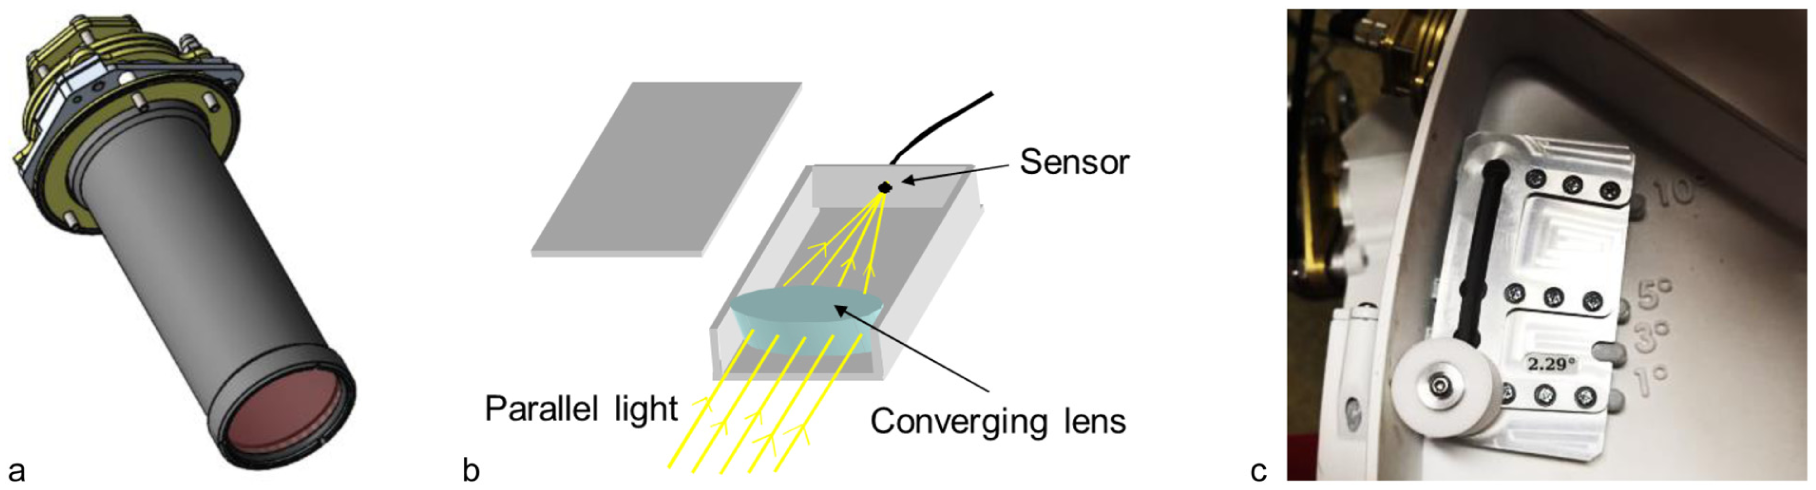
Plan of a lighting source (a), of the detector box (b) and picture of the mechanical setup used to change the observation angle (c)
The CIE 144 technical report recommends measuring an area of at least 100 cm2 to characterise the photometry of a pavement. Since the illumination area of the measuring device is only 20 cm2, five acquisitions are conducted on close area while moving manually the device. A measurement therefore corresponds to an average of five acquisitions. COLUROUTE2 lighting sources are calibrated using reference surfaces previously measured by the Cerema gonioreflectometer thus giving 27 r values. The remaining 361 points of the r-table are calculated by interpolation and extrapolation of the measured points. The corresponding Q0 and Qd are then computed according to Equation (1) for Q0 and Equation (2) for Qd, using the trapezoidal integration methodology. 32 The same procedure is applied for each observation angle.
with
with
2.2 The measured sections
For this study, 37 measurements were conducted during 2024 33 and 2025 on 18 different French road sections either in Strasbourg, Limoges or Angers. Table 1 presents the different nature and specificities of road sections, in accordance with the standard denominations. 10 There is also the indication of their localisation, age and type of traffic. There are 13 bituminous mixture sections composed of 6 classic raw sections, 2 classic initially treated sections, 2 initially treated sections with light aggregates and 3 other sections with a red one, one with synthetic binder and one with porcelain chips. There are five cement concrete sections with three different initial treatment. Most of the roads are circulated by cars, but there are also three bicycles paths and four sections on pedestrian areas. Figure 5 presents pictures of several sections with a 5 × 3 cm2 mire to indicate the scale and direction of measurement corresponding to the direction of traffic.
Table presenting the different road sections with their nature (indicated in bold), specificity, measuring index, age, localisation and usage
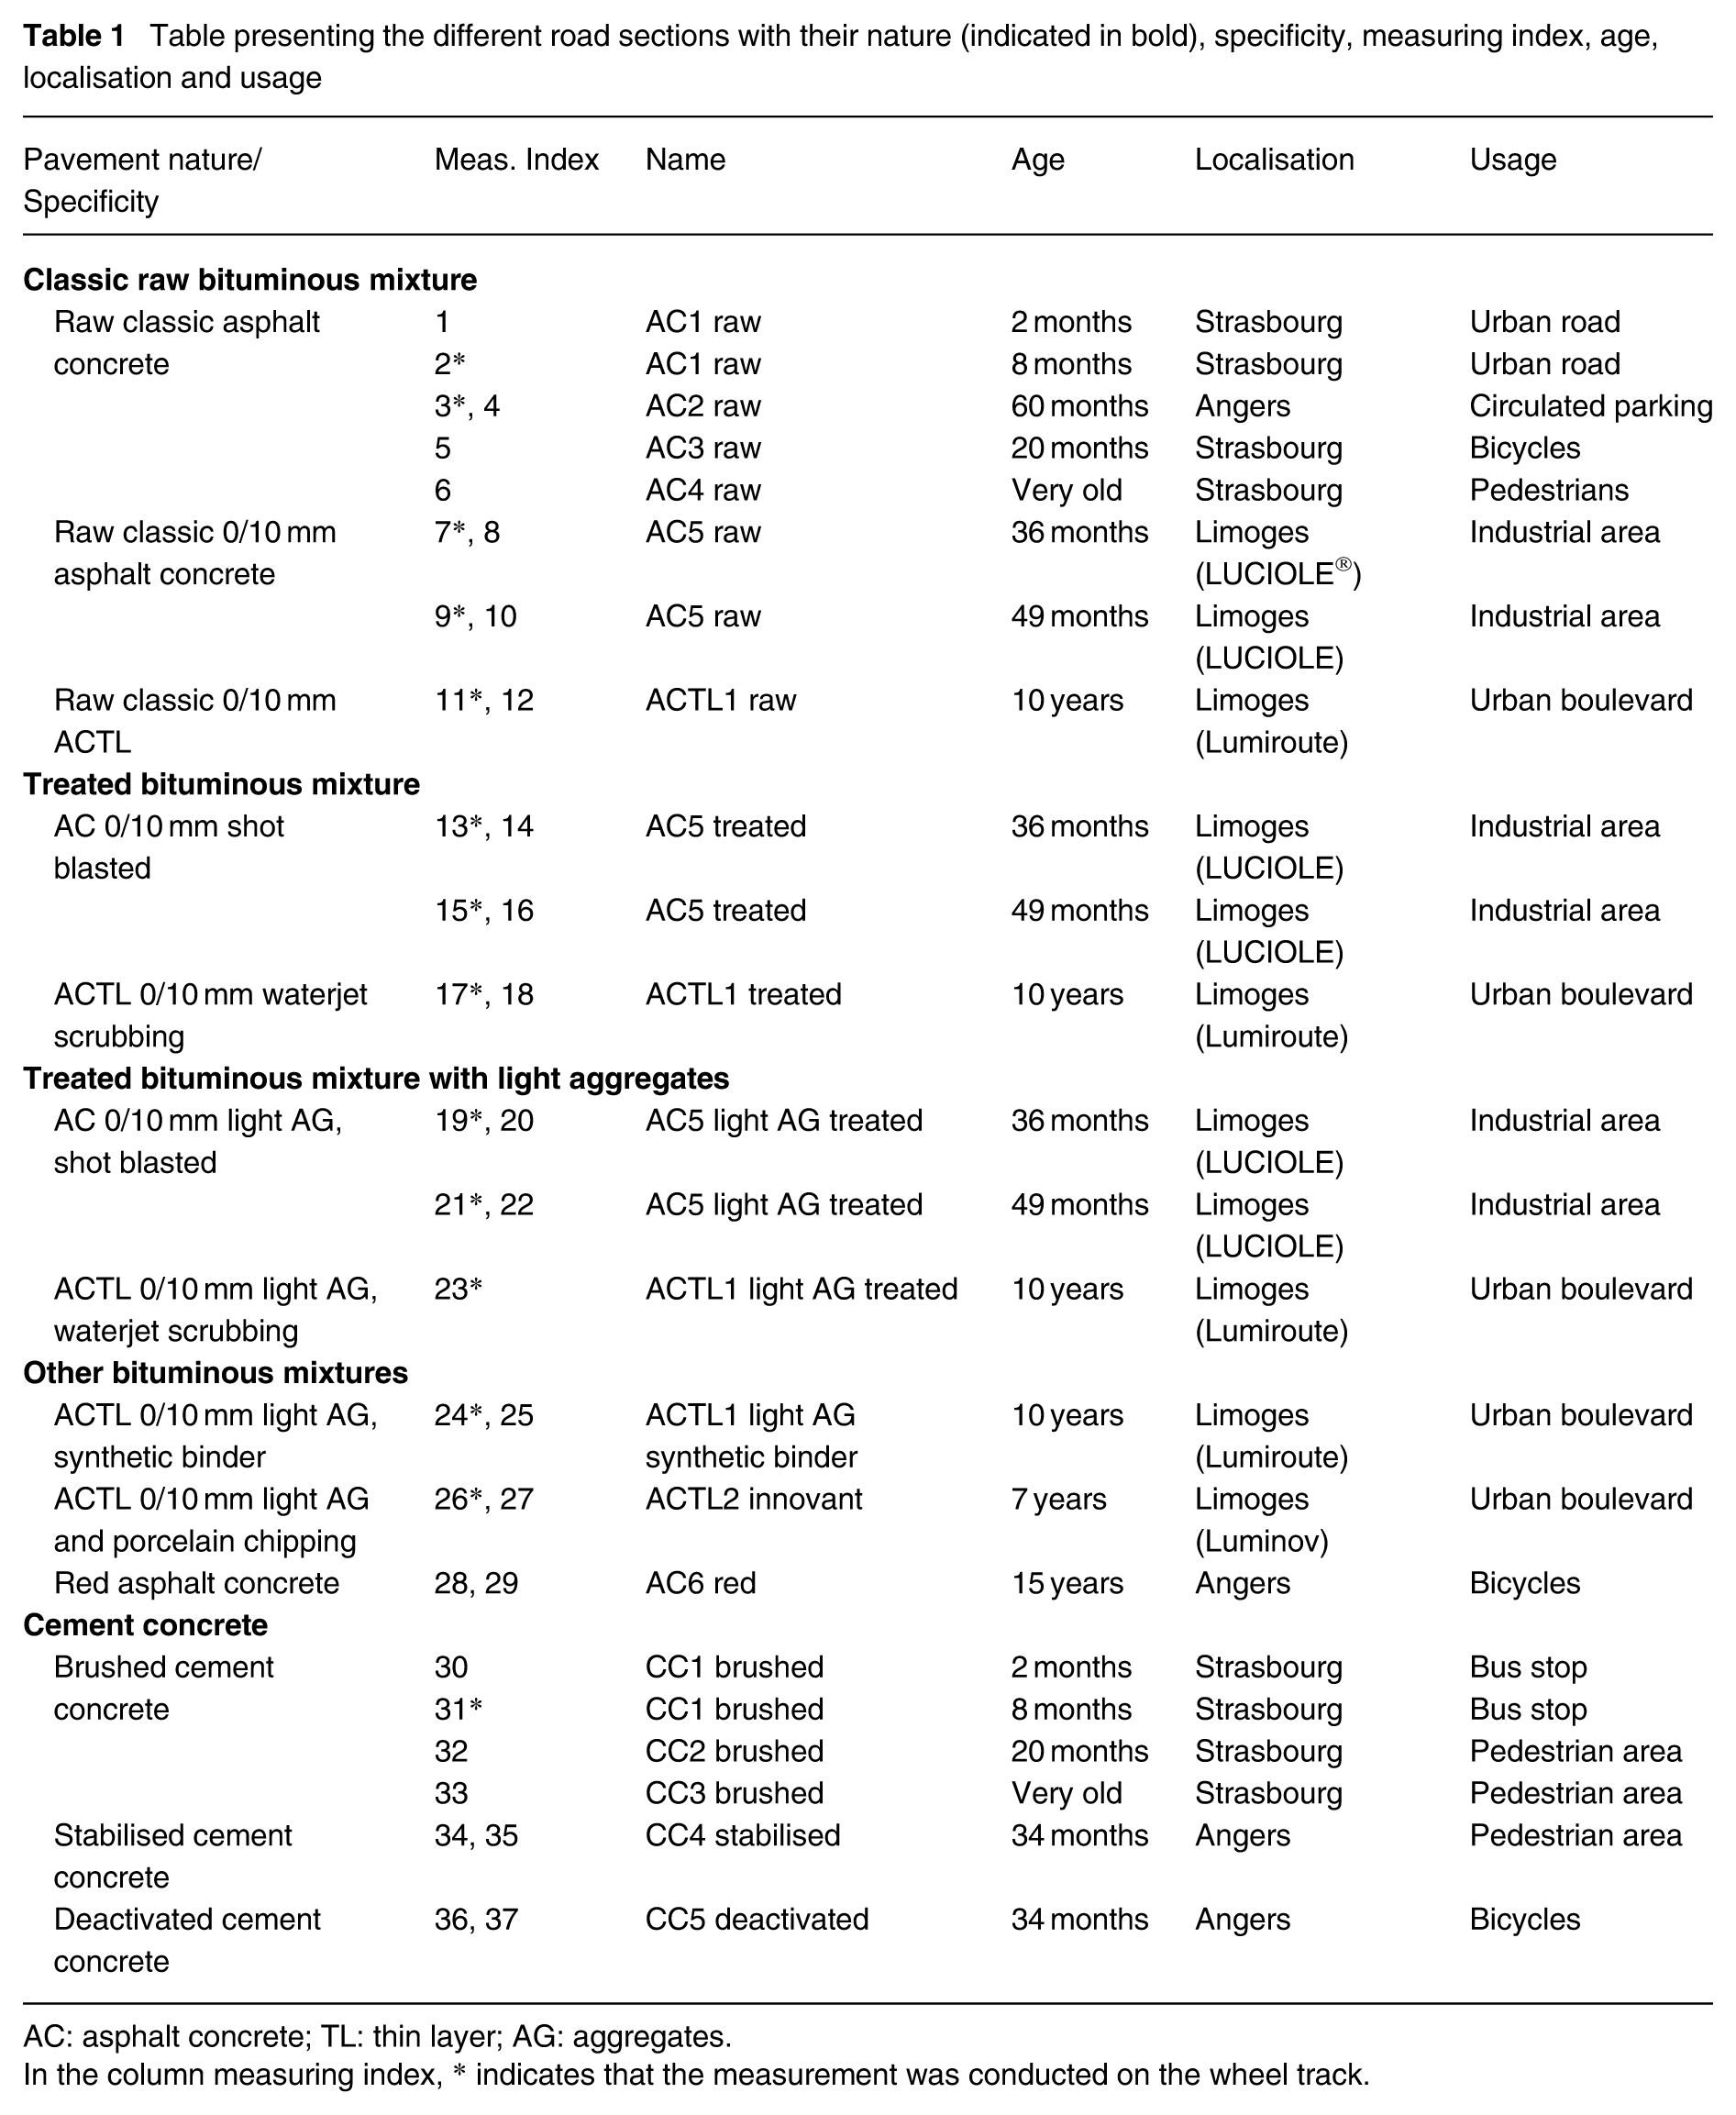
AC: asphalt concrete; TL: thin layer; AG: aggregates.
In the column measuring index, * indicates that the measurement was conducted on the wheel track.
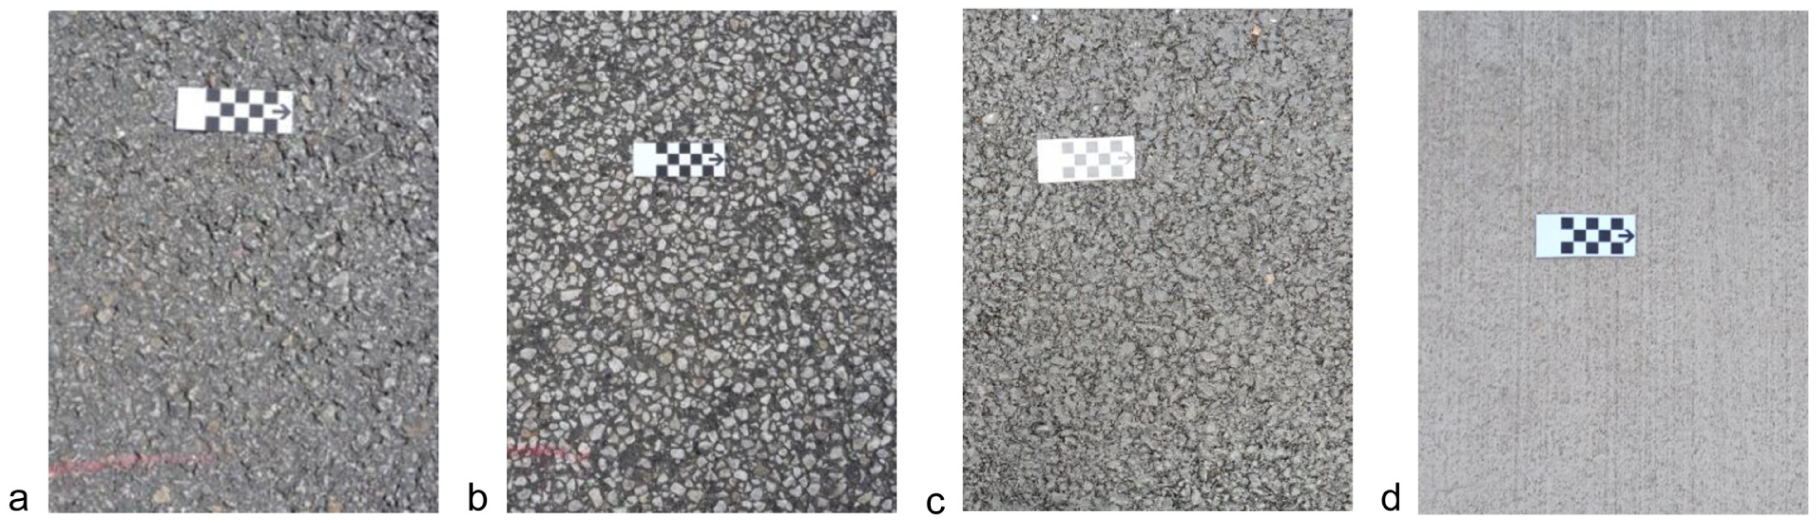
Picture of some of the measured road sections: the 3-year raw AC5 with grey aggregates (a), the 3-year treated AC5 with light aggregates (b), the 2-month AC1 (c) and the 2-month brushed cement concrete CC1 (d)
As Table 1 shows, the measurements were taken on a variety of road surfaces of different types, ages (between 2 months and 15 years old) and uses. For the 18 roads, the r-tables were measured with COLUROUTE2 at 1°, 2.29°, 3°, 5° and 10° with at least one area. For stabilised surfaces used by vehicles, two locations where generally characterised, with the first on the wheel track and the second on the central lane. For the footpaths and cycle paths, two series of measurements were performed when the visual aspects were different.
2.3 Presentation of the measuring protocol
Since the angle is changed manually (see Figure 4(c)), the first step was to establish a protocol to be sure that the same area is measured at all observation angle. We followed a very pragmatic approach, using a chalk marker for the initial positioning and a graduated ruler for the displacements corresponding to the five successive acquisitions averaged for the measurement (see illustrations in Figure 6).
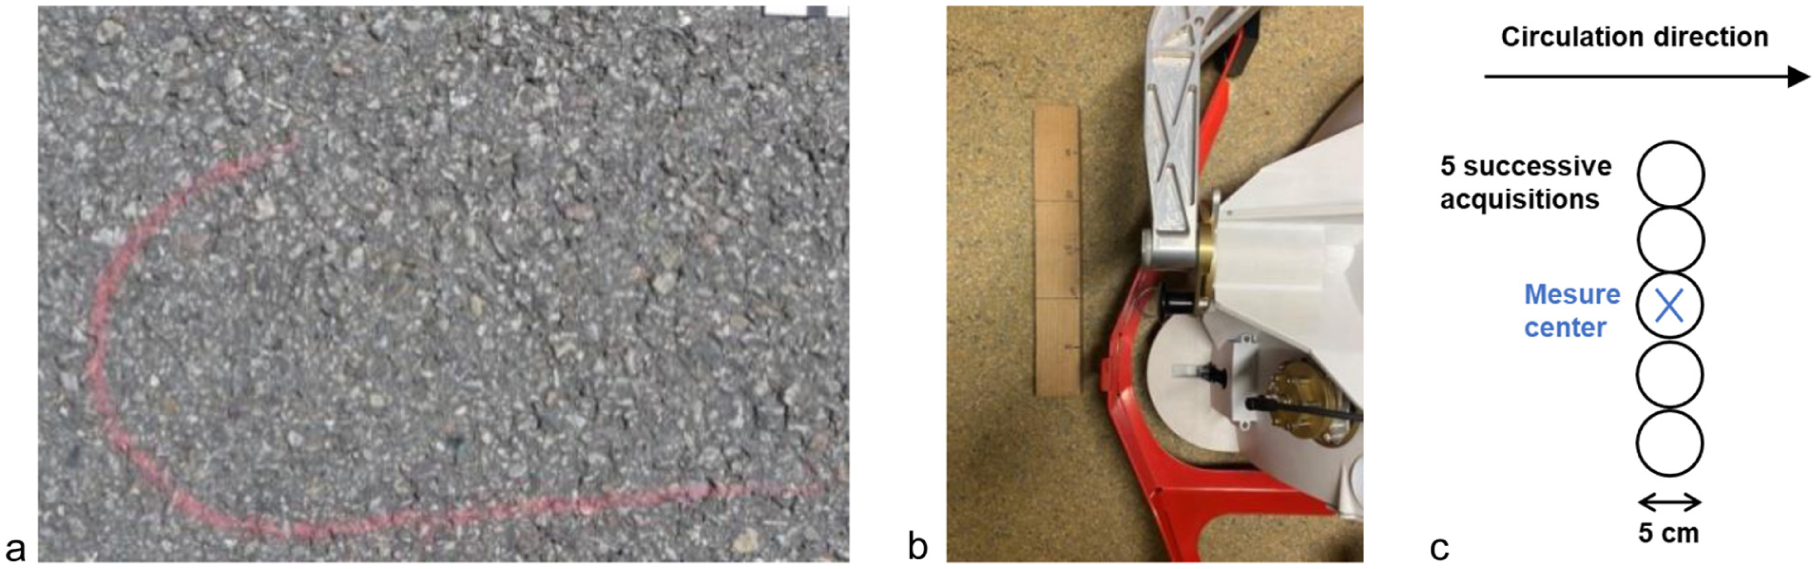
(a) Chalk line showing the location of COLUROUTE2; (b) a wood graduated ruler indicates the 5 cm displacement between each acquisition and (c) the schematic representation of the measurement protocol
3. Results
3.1 Validation of the methodology
The first step was to verify that it is possible to be positioned at the same locations for measurements at different angles. To do this, on one of the pavements, three successive measurements were taken at the same angles in order to check the reproducibility of the positioning. Figure 7 represents three measurements of r-tables conducted successively at two observation angles, with the instrument repositioned each time with our protocol. The difference between the three measurements remains small, both for the r-table representation and the photometric indicators. The average reproducibility error of the r-table was calculated according to ISO 5725. 34 We first compute, for each point, the sum of squared deviations between the repeated measurements and their average. These sums are then aggregated to obtain the global intra-series sum of squares, which is divided by the total degrees of freedom to yield the global reproducibility standard deviation sR. Finally, the global relative uncertainty is obtained by dividing sR by the global mean and multiplied by k = 2 to obtain the expanded reproducibility uncertainty. It is 3.5% at 1° and 3.7% at 2.29°. The expanded reproducibility uncertainty is approximately 3.5% for S1 and less than 2.5% for Q0 and Qd, considering both angles simultaneously. The measurement protocol was therefore validated.
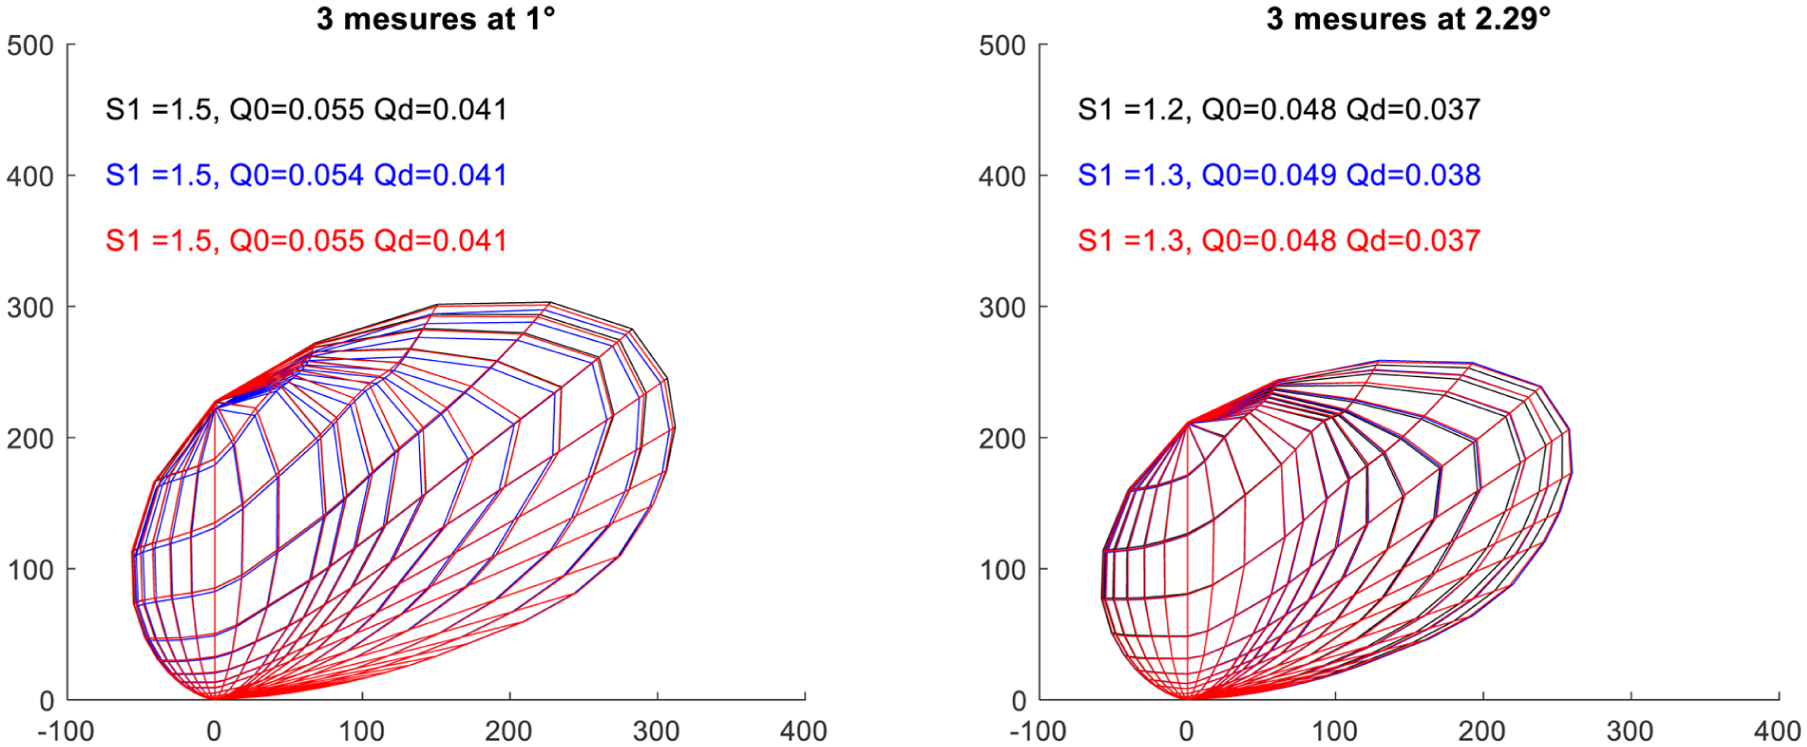
Representation of the reflexion indicatrix of the two months AC1 with three successive measurements conducted at 1° (left) and 2.29° (right)
3.2 Results of the measurements conducted at the different observation angles
Figure 8 presents the measured reflection indicatrix between 1° and 10° for three different road surfaces. The results are presented for the 10 years old 0/10 mm asphalt concrete for thin layer (called ACTL1) situated on an urban boulevard with its classic raw formulation (up) and the formulation with light aggregates that was initially treated to remove the bituminous layer (middle) and also for the 34-month-old deactivated cement concrete CC5 situated on a cycle path (bottom).
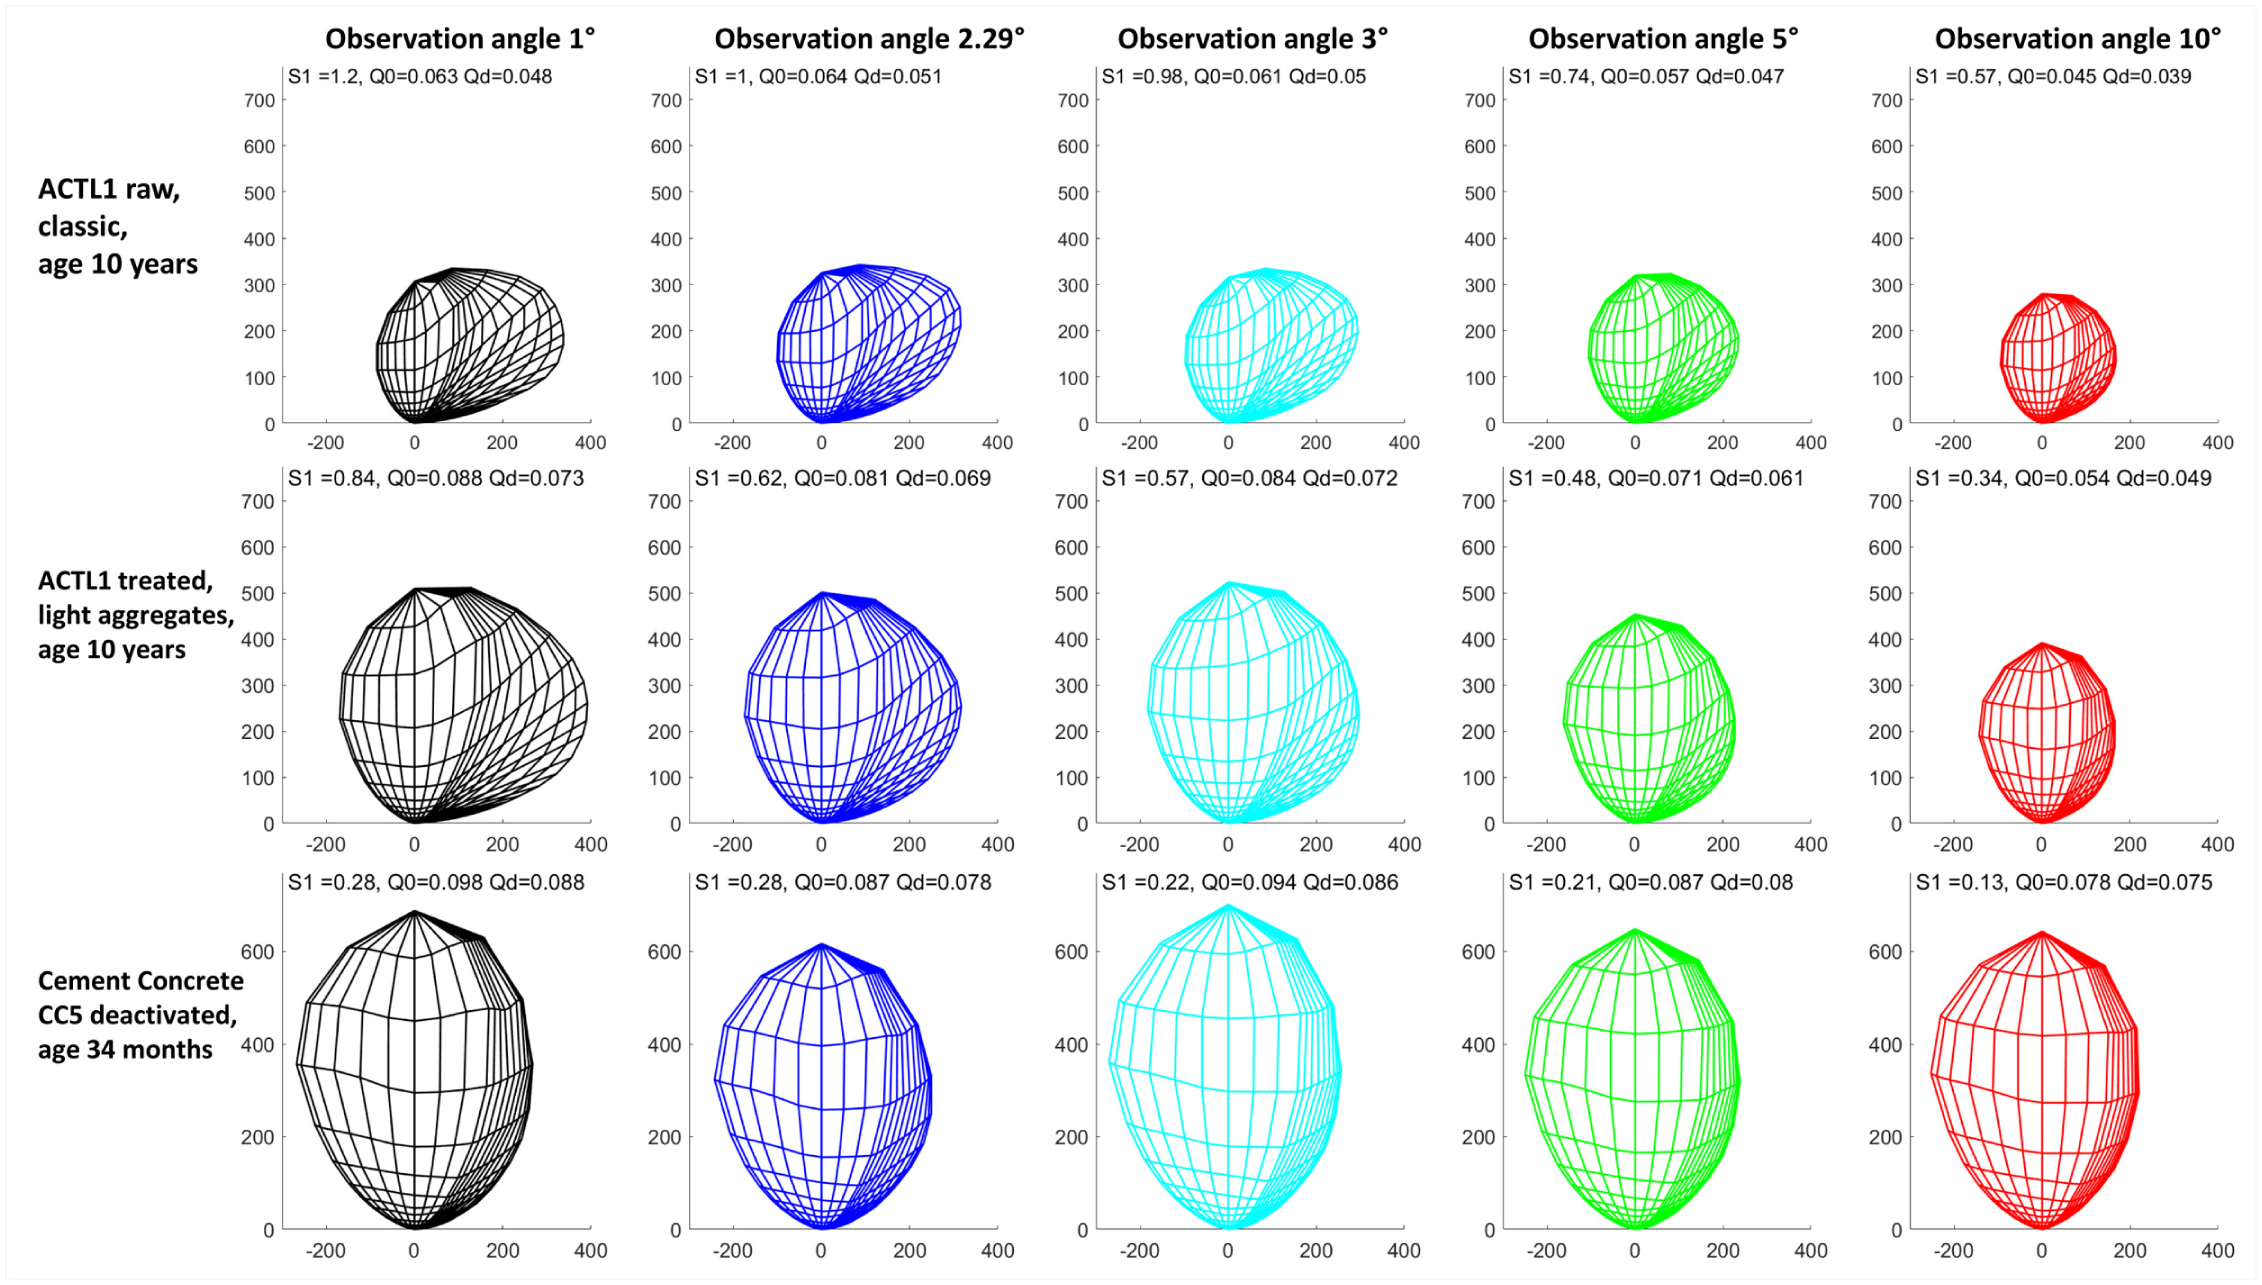
Representation of the reflection indicatrix measured at 1° (in black), 2.29° (in dark blue), 3° (in light blue), 5° (in green) and 10° (in red). Results for the 10-year-old ACTL1 raw (up), the ACTL1 clear treated (middle) and for the 34-month-old cement concrete (CC5) (bottom)
For those three road surfaces, the reflection indicatrix changes with the augmentation of the observation angle, and this change is particularly important at 10° with a global size reduction, resulting in a lower Q0, and less amplitude on the right of the indicatrix, resulting in a lower S1. It could be noticed that even after 10 years, the ACTL raw section is more specular and has a lower Q0 compared to the one with light aggregates that was initially treated. This result was already shown after 3 years for r-table measured at 1°, 35 but is now confirmed for all measured observation angles and after 10 years of ageing under circulation. Concerning the cement concrete section, even if it was already quite diffuse at 1° (with S1 = 0.28), the specularity still decreases for the higher observation angles.
The results of all measurements are shown in Figure 9 for S1 (top), Q0 (middle) and Qd (bottom) for the different observation angles, classified according to the nature of road surface. It should be noted that on roads with traffic, photometric indicators sometimes differ for the same section of road depending on its transverse location. In particular, the specularity of classic raw bituminous mixtures is higher on the wheel track than on the central track, regardless of the angle of observation (see e.g. measurements 11 compared to 12, 17 compared to 18). At 1°, this result is fairly typical for this type of road surface. 36 A decrease of the indicators S1, Q0 and Qd is generally observed when the observation angle increases. The decrease in S1 occurs at grazing angles for raw bituminous mixtures and is less pronounced for cement concretes. However, it is always observed when comparing 1°, 5° and 10°. The behaviour of Q0 and Qd is similar, which is not surprising given that the same data is used for their calculation. Here too, a decrease is always observed when comparing 1°, 5° and 10°. These results have also been observed for laboratory measurements.20–22 They are confirmed here in the field, both for motorised roads, cycle and footpaths.
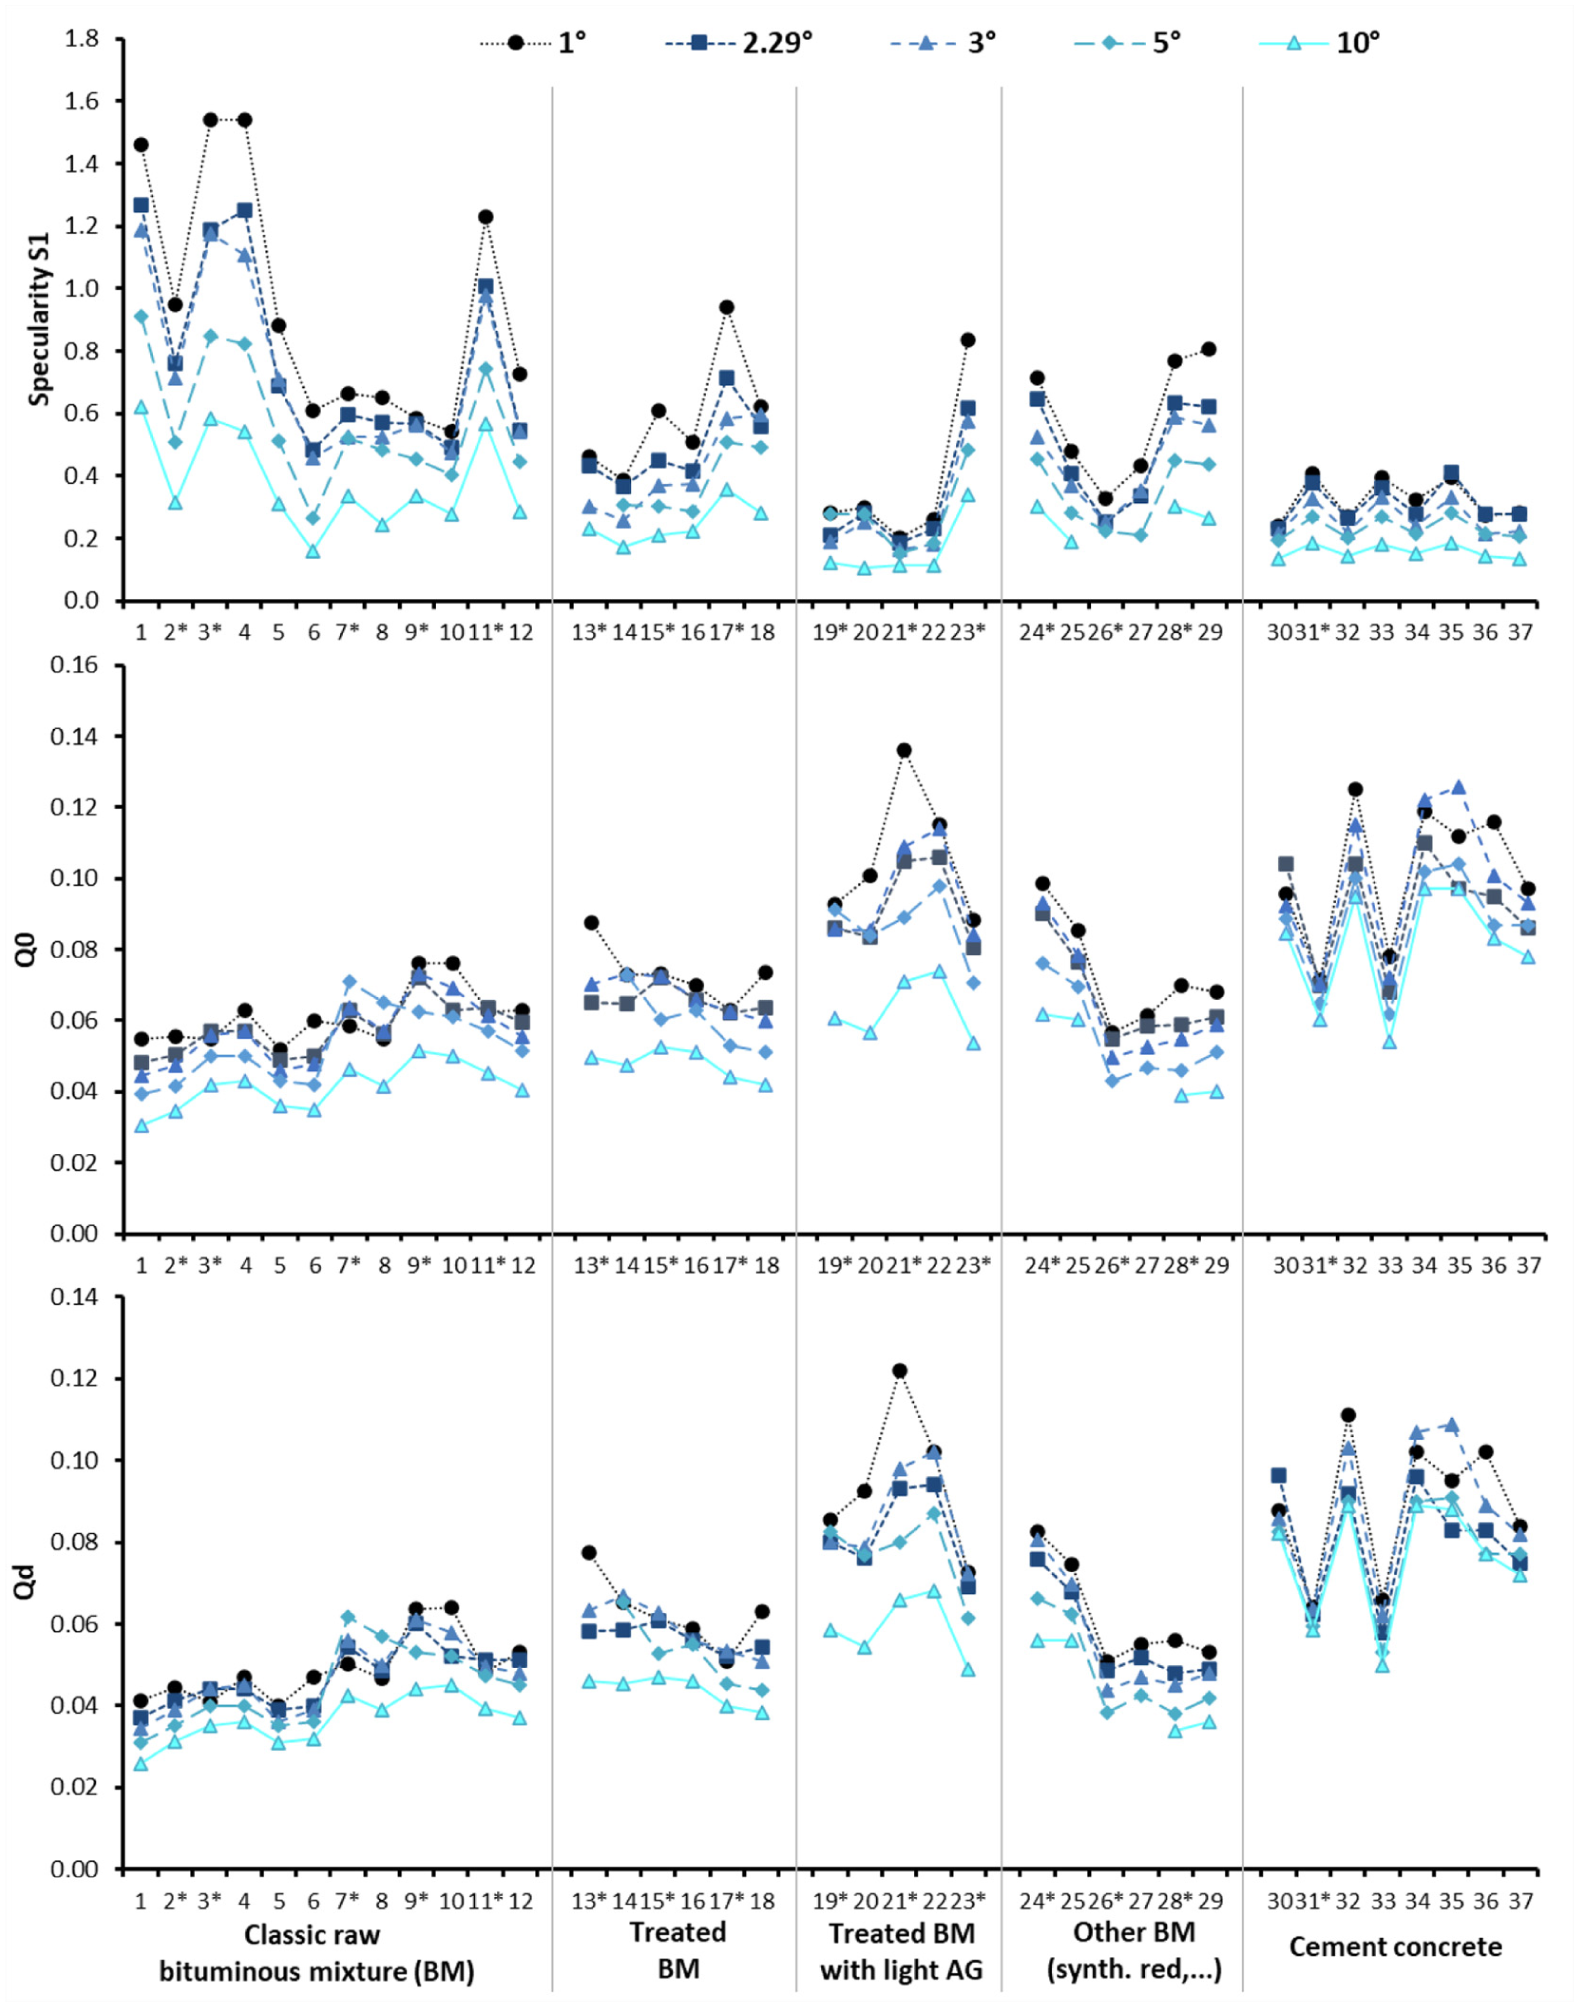
Representation of the results for S1 (up), Q0 (middle) and Qd (bottom) for the different observation angles for the different nature of surfaces with the indication of the measurement number
3.3 Study of the interchangeability of Q0 and Qd between 1° and 2.29°
The CIE 144 technical report states that the simultaneous use of Q0 and Qd implies interchangeable use of 2.29° and 1° and does not result in significant discrepancies. Figure 10 presents the extreme case with Q0 at 1° and Qd at 2.29°, and Figure 11 presents the corresponding difference in percentage, considering the conventional measurement of Q0 at 1° as the reference. Both figures show that both indicators and angles are not equivalent. Indeed, the difference is important for all nature of road surface, and greater than 10% for 95% of the measurements taken and with an average difference at −22%.
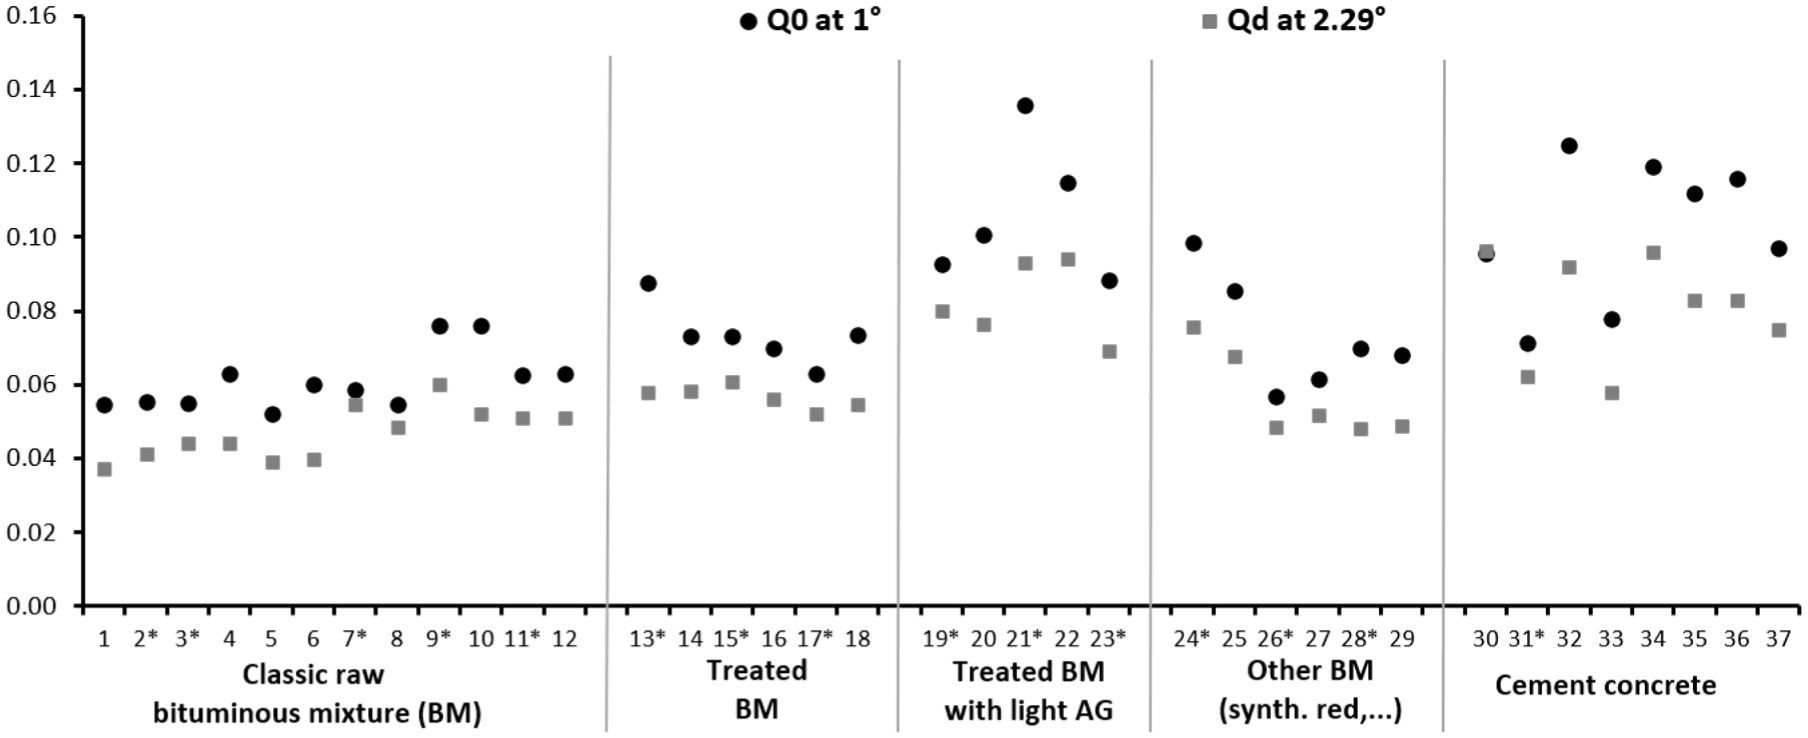
Representation of Q0 at 1° (black circle) and Qd at 2.29° (grey squares) for all road surface nature
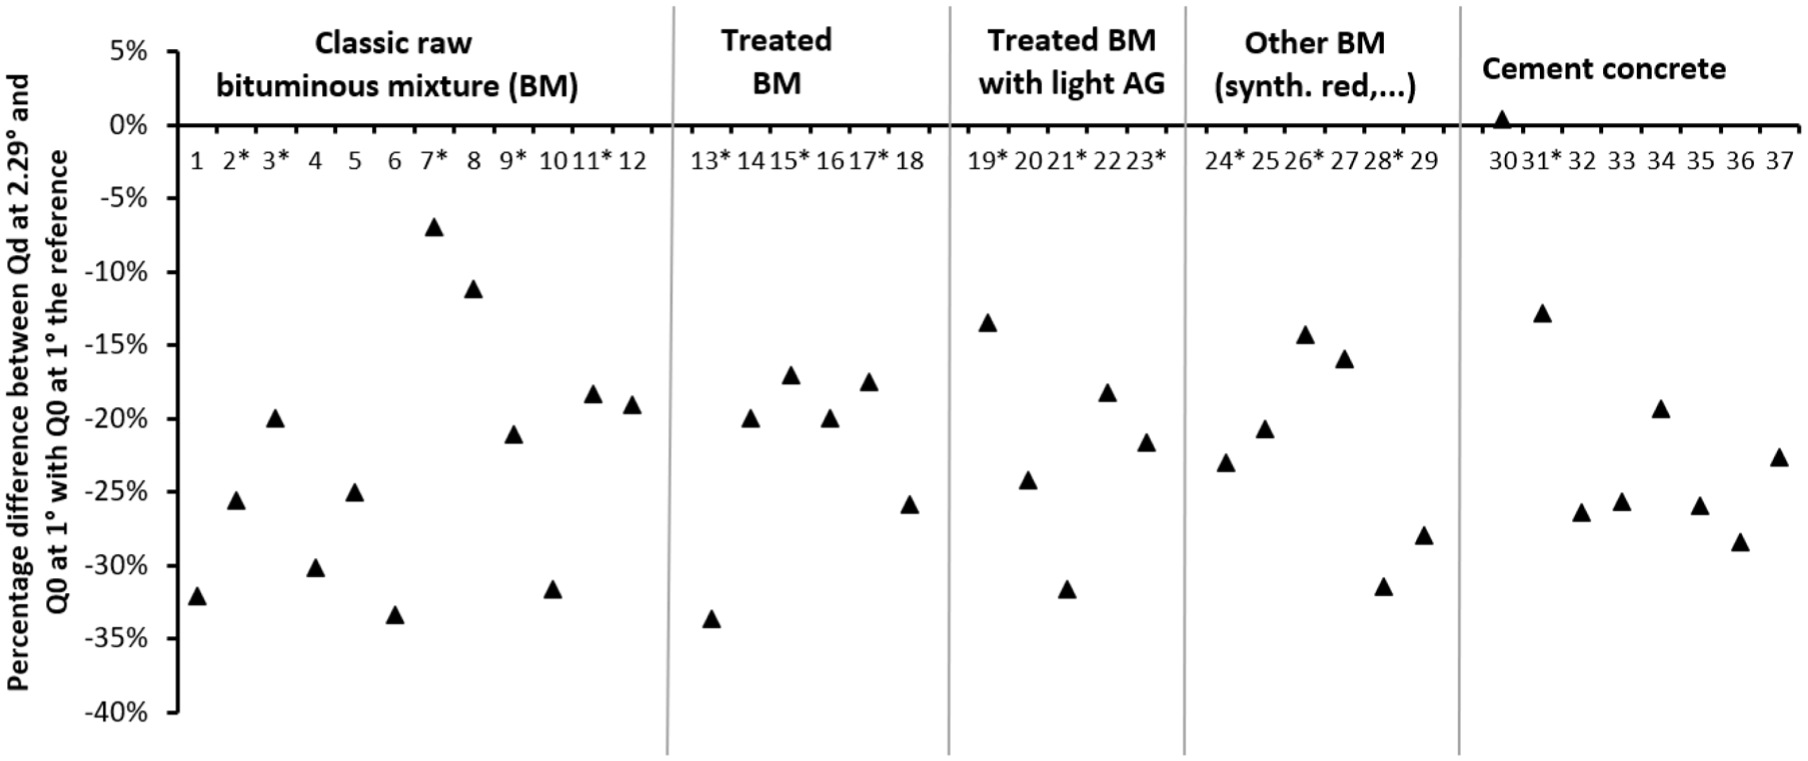
Representation of the percentage difference between Qd at 2.29° and Q0 at 1°, with Q0 at 1° the reference
In Table 2, statistics on the differences between observation angles of 1° and 2.29° are calculated for both Qd and Q0, taking Q0 at 1° as a reference. It shows both the decreasing trend in values as the observation angle increases and, above all, the extent of the differences between the indicators, particularly between Q0 and Qd, with differences greater than 10% in more than 90% of cases, regardless of the angle considered.
Calculation for all measurements of means and standard deviations of differences in % between 1° and 2.29°, for both Q0 and Qd, with Q0 at 1° as the reference
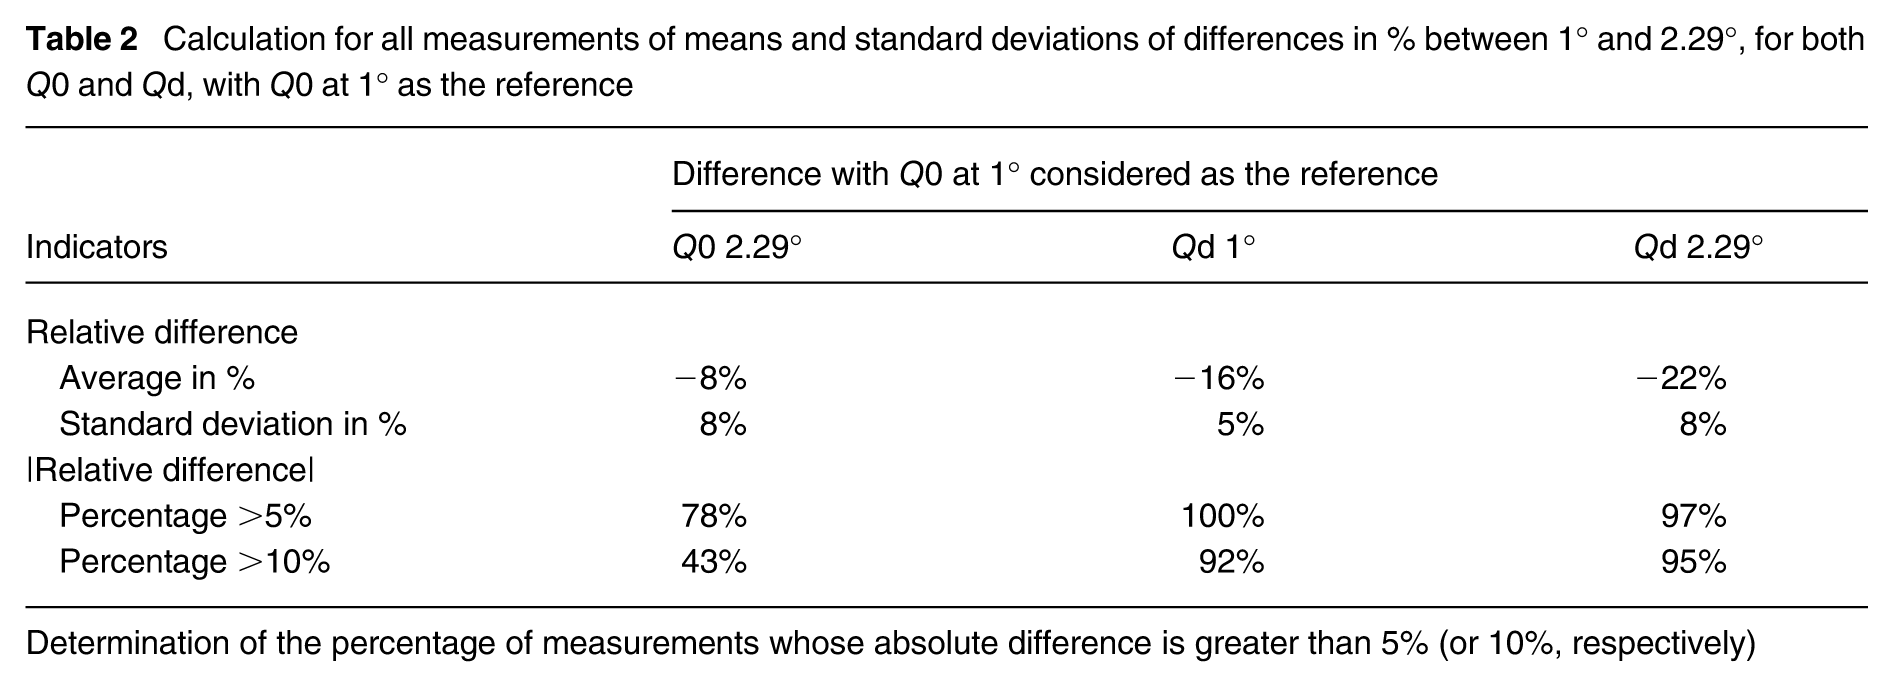
Determination of the percentage of measurements whose absolute difference is greater than 5% (or 10%, respectively)
All these results show that the assumption of equivalence between 1° and 2.29° for Q0 and Qd suggested in CIE 144 technical report is not verified.
3.4 Study of the links between the photometric indicators Q0 and Qd calculated with r-tables and S1 at the different angles measured
As recent studies suggest that the standard observation angle in urban areas will probably be 3°,28,29 the correlations between angles of 1° and 3° are studied in greater details in this section. For the same observation angle, the Qd coefficient is strongly correlated with Q0, with a correlation coefficient always greater than 0.99. This very high correlation is a consequence of the use of the same r-table to compute both Q0 and Qd. Figure 12 shows the photometric coefficients S1, Q0 and Qd at 3° as a function of measurements taken at 1°. There is a very strong correlation between these two angles, greater than 0.99 for S1, Q0 and Qd. The linear regression lines show that it is possible to estimate these three indicators at 3° based on a r-table measurement taken at 1°. The slope factor is always less than one, again showing a decrease in photometric indicators as the angle of observation increases, with a greater decrease for S1.
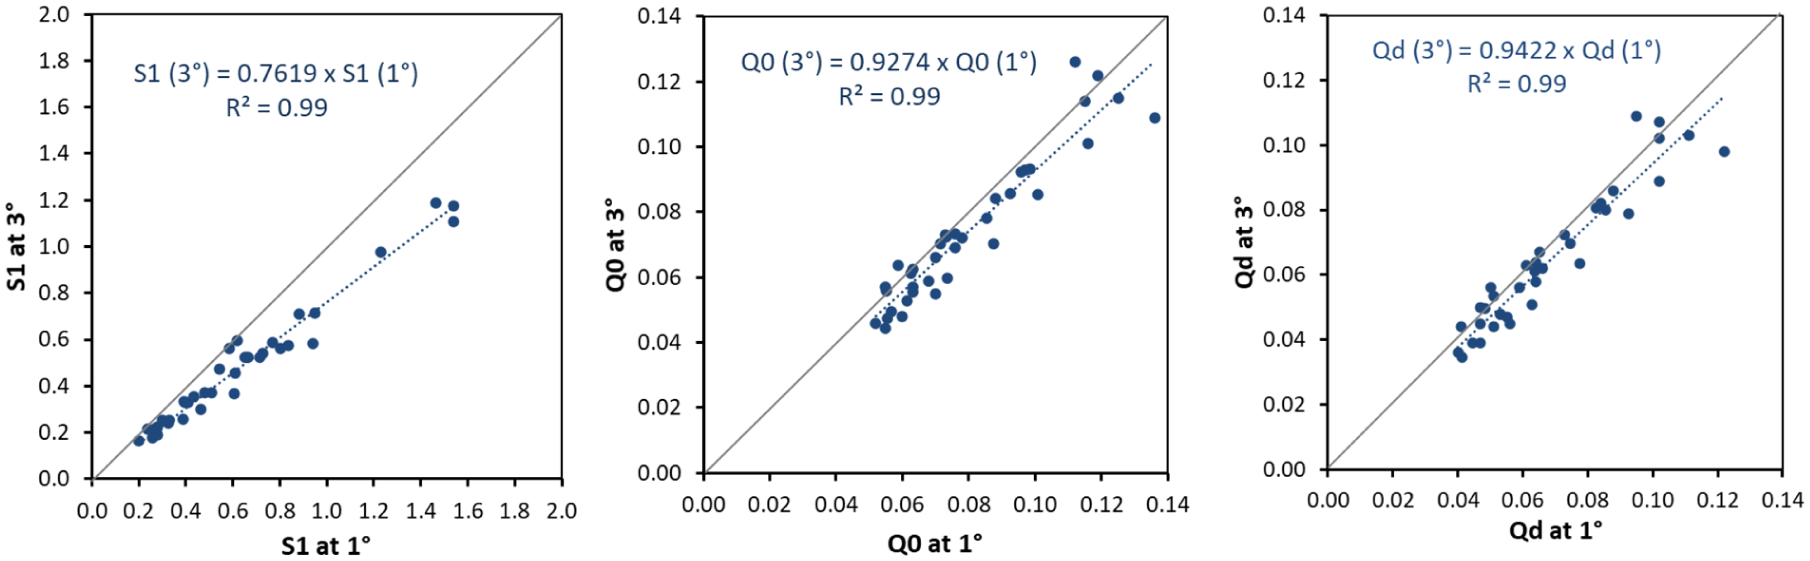
Representation of measurements S1 (left), Q0 (middle) and Qd (right) taken for respective observation angles of 3° as a function of those at 1°. The corresponding linear regression line is represented in dotted blue with the corresponding equation and determination coefficient. The line y = x is shown in grey
4. Discussion
Fotios et al.’s 29 opinion paper states that an observation angle of 3° could represent urban areas and propose to define an urban class for motorists travelling at lower speed and cyclists, and enhance the need of collecting r-tables at this geometry. However, as there is no commercially available measuring device for this geometry, it is essential to go further and study the link between Qd estimated from r-table and Qd measured by portable retroreflectometers. For example, if it was possible to estimate Qd at 1° from a commercial retroreflectometer measurement at 2.29°, it would be possible to use this estimate to scale the new standard r-tables that will be proposed by TC4-50. To validate this proposed approach, lighting calculations and Qd scaling based on measurements made with a commercial retroreflectometer could be conducted and compared with r-table measurements. Concerning the estimation of the specularity S1 to define the class of a road pavement, the problem remains unresolved because there is no commercially available device allowing the measurement of this parameter.
5. Conclusions
The device for on-site measurement of r-tables for angles of observation between 1° and 10° presented in this study has been validated. COLUROUTE2 can be used to characterise the reflection properties of pavements for different urban users without sampling. Our results confirm those obtained in the laboratory on road cores,20–22 with the Q0, Qd and S1 coefficients decreasing with increasing observation angle, which is a consequence of the increase in the diffuse nature of road surfaces, particularly at 10°.
Our measurements conducted on field on 18 different French road sections, show that the assumption of equivalence of measurement of Q0 and Qd between 1° and 2,29° in the CIE 144 technical report 2 is not validated, especially between Q0 at 1° and Qd at 2.29°. Whether for S1, Q0 or Qd estimated from r-table, there are strong correlations between the measurements at 1° and 3°, which could make it possible to take better account of the needs of different users. These results may provide input for the current work of the CIE TC4-50 in the update of CIE 144 report. 2
Footnotes
Acknowledgements
A previous version of this paper was presented at the CIE 2025 Midterm Meeting Conference. The authors thank Florian Greffier for his consistently helpfull suggestions.
Declaration of conflicting interests
The authors declared no potential conflicts of interest with respect to the research, authorship, and/or publication of this article.
Funding
The authors disclosed receipt of the following financial support for the research, authorship, and/or publication of this article: This research was in part funded by the French National Research Agency under the REFLECTIVITY project: ANR-22-CE22-0006.