
Abstract
This paper provides the first significant profile of offenders convicted of bribery in England & Wales (E&W) and Norway, based upon a sample of 75 cases from E&W and 46 from Norway, which were collected through searches of the media and other relevant sources between 2003 and 2015. The paper provides a profile of bribe payers and takers: in both E&W and Norway they are predominantly male, middle aged and involved in a median bribe of between £20,000 and £30,000; the sectors experiencing the most bribes paid are public administration and defence and the sector paying the most bribes is construction. In both countries, the period from the start of the crime to conviction was around six years. The paper also notes some significant differences between the two countries. In Norway there was a larger percentage of higher-grade professionals involved in bribery and in E&W detection by law enforcement was more common, suggesting greater interest by such bodies. The average sentence received by offenders was also slightly higher in E&W. The paper offers many other insights into the characteristics of bribery in the two countries in a rarely researched area.
Introduction
Corruption is seen as one of the greatest obstacles to economic and social development (Brun et al., 2015: 1; Trivunovic et al., 2011: 2; World Bank, 2006). In the global struggle against corruption, detection and prosecution are regarded as essential measures. One of the most salient examples of corruption is bribery and this has received very little academic research (Gottschalk, 2014; Lord, 2013, 2015; Lord and Levi, 2017). One study of overseas bribery cases in the UK and Germany found that investigators and prosecutors thought that uncovering the case was the most difficult part of the prosecution process (Lord, 2015: 583). Although there is some research on who detects cases involving overseas cases of bribery (OECD, 2014), this project investigates both domestic and overseas cases that resulted in a conviction in England & Wales [E&W] and in Norway between 2003 and 2015.
Fighting corruption is a global concern that remains high on the international agenda. This development has partly been driven by international conventions such as the Convention on Combating Bribery of Foreign Public Officials in International Business Transactions of the Organisation for Economic Co-operation and Development (OECD), which came into force in 1999. It is seen as a key instrument in combatting global corruption (Transparency International, 2015: 4) and was one of the reasons for the introduction of the UK Bribery Act (Rose, 2012: 487). Similarly, the United Nations Convention against Corruption (UNCAC) has, since it was implemented in 2003, contributed strongly to place the fight against corruption on the international agenda (Brun et al., 2015: 1). Both these conventions promote the criminalization of bribery (Rose, 2012: 486; U4 Anti-Corruption Resource Centre, 2010: 2), and successful compliance implies that cases are investigated and prosecuted. In other words, the first step towards complying with these conventions is successful detection of bribery.
Building on criminological theory, it is debatable to what extent corruption can be explained solely though this rational choice theory or whether it is better explained through behavioural concepts such as social and institutional factors (Dimant and Schulte, 2016: 56; Gilling, 1997: 36; Sutherland, 1941: 32). A case study of bribery committed on behalf of German companies found that high-ranking employees paid bribes in the pursuit of an organizational goal, as opposed to personal gain for themselves (Pohlmann et al., 2016: 95). Pohlmann and his colleagues go on to argue that bribe takers can be explained through rational choice theory, whereas bribe payers should be explained by other mechanisms. The environment of the organization or individual is also important, because economic, social and political structures are all seen to influence the level of corruption in a country (Fletcher and Herrmann, 2012: 36). Though there are several possible explanations as to why people commit bribery, it is generally assumed that a low risk of detection and punishment will make corruption more prevalent (Association of Certified Fraud Examiners, 2016). Hence, an increased perceived risk of detection, either by a group or by an individual, could reduce bribery.
Defining bribery
Many of the suggested definitions of corruption are quite broad, such as the Asian Development Bank (1998: 6), which defines it as ‘the abuse of public or private office for personal gain’. Even more generally it could be defined as ‘the abuse of entrusted power for personal gain’ (Transparency International, n.d.) or as ‘selling’ a decision to the benefit of the bribe payer (Søreide, 2014: 1). These definitions overlap with other crimes, such as fraud (Button and Gee, 2013: 10; Transparency International UK, 2011: 1) and embezzlement (Johnson and Sharma, 2004: 2).
The legislation in E&W and Norway have different definitions of bribery. The most recent law, the UK’s Bribery Act 2010, is regarded as one of the toughest in the world (Yeoh, 2011: 50). It defines bribery as an act of offering/giving/promising or requesting/accepting a financial or other advantage (Ministry of Justice, 2011). To be convicted of bribery, there must be an intent to influence someone to perform improperly in a relevant function or activity (Ministry of Justice, 2011: 10). The law applies to domestic cases and also forbids bribery of foreign public officials (Maton, 2010: 37–8). Prior to the Bribery Act, corruption was regulated through several laws, including a common law offence and through three statute laws (Brown, 2007: 181). The Bribery Act replaced most of these (Maton, 2010: 38), with the exception of cases committed by persons who are public office holders, which also after the Bribery Act often are prosecuted as Misconduct in Public Office (Crown Prosecution Service, n.d.; Parsons, 2012: 183).
In Norway, the legislation is a part of the Norwegian General Civil Penal Code (the Penal Code). The law was changed in 2003 and the motivation behind the change was to establish the strictest anti-corruption regime in the world (Elgesem, 2014). The Penal Code defines corruption as to give/offer or request/receive/accept an improper advantage related to position, office or assignment (Økokrim, 2015a). In contrast to the UK Bribery Act, it is not a condition that the intention of the bribe is to cause any action or neglect by the receiver of the bribe. The question is whether or not the advantage is improper (Økokrim, 2015a). Similarly to E&W, the Norwegian anti-bribery legislation covers domestic cases as well as corruption committed anywhere else in the world (Elgesem, 2014). The Norwegian legislation refers to ‘corruption’, but the described offence is comparable to the offence under the UK Bribery Act, and the term ‘bribery’ will therefore also be used in the Norwegian context.
Though the legal definition of bribery is quite similar in E&W and Norway, given the complex legislation in E&W it was necessary to define what is understood to be bribery in this project. The applied definition is built on the legislation mentioned above, and consists of three main elements. Firstly, there is a financial or other advantage that is either offered/promised/given or requested/received. Secondly, this advantage is given in connection with a function, office or assignment. Thirdly, there is an intention that these actions will make the receiver of the bribe perform improperly or, alternatively, the financial advantage is in itself regarded as improper. This definition implies that a bribe paid by one ‘ordinary’ person to another is not regarded as bribery, for example if an accused person offers a bribe to a witness in order to make the witness give a certain statement in court. In contrast, it falls under the definition if the accused person attempts to influence the outcome of the case by offering a bribe to police, a judge or others who are in a position of trust.
Corruption is a hidden crime (Fletcher and Herrmann, 2012: 17). Hence, the prevalence of corruption is difficult to measure, although both perception-based surveys and more reliable estimates have documented that the extent of the problem is severe (Olken and Pande, 2011: 42). There is very little measurement of the level of bribery in E&W or in Norway. One source is the International Crime Victim Survey, which last collected data in 2003–4 and sought data amongst the general public on bribe-seeking by public officials. For E&W, the score was 0 percent and for Norway 0.4 percent. For London, however, the score was 0.7 percent and for Oslo 0.2 percent. The highest-scoring country in this report was Greece, at 13.5 percent (Dijk et al., 2007: 90). Every year Transparency International also publishes the Corruption Perception Index, which ranks countries by the perceived level of public corruption. In the 2015 index, the UK had a score of 81, which makes it number 10 out of 167 countries, while Norway was number 5 with a score of 87 (Transparency International, 2016: 6). Though this is not an accurate measure of corruption, it indicates that people in the UK and Norway perceived the levels of public corruption to be at a fairly similar level.
Even though many agencies are involved in the investigation of economic crime, the police are of particular importance because they are the gatekeepers of the criminal justice system, including the power to arrest, to conduct searches and to access information (Lewis et al., 2014: 4). Both countries in this study have specialized local economic crime units within the police (Button et al., 2014; National Police Directorate, 2012). Both countries have national bodies for the investigation of complex economic crime (Doig and Macaulay, 2008: 185; Økokrim, n.d.) and these bodies have specialized units for the investigation of corruption (City of London Police, n.d.; Økokrim, 2015b; Serious Fraud Office, n.d.). The Serious Fraud Office (SFO) actively encourages confidential whistleblowing and self-reporting from companies that have uncovered bribery in their organization (Lord, 2015: 584–5). The SFO has been criticized for not having the capacity to follow up on the tips it receives (Dunkley, 2015), so it is debatable to what extent these measures are effective. To date, there are no similar arrangements in Norway.
The number of cases investigated by the police can provide a basis for assessing to what extent the strict anti-bribery laws are actually enforced. In E&W there are several cases of bribery that have resulted in a conviction; for example, the 75 cases that have been identified in this project. However, data collection is challenging owing to the complex legislation, and the overall number of cases is therefore unknown (European Commission, 2014: 1). In Norway, there are statistics on all cases of bribery reported to the police. The statistics on registered cases from 2003 to 2015 were disclosed for the purpose of this research by the National Police Directorate (T. Eriksen, personal communication, 25 May 2016). This material shows that, for all types of bribery, both national and international, there were 702 incidents of bribery reported to the police. The outcome was recorded and, of all of these, 366 were recorded as dismissed for various reasons. The most prevalent reason was on the grounds of the evidence. Of the cases taken to court, 50 resulted in acquittal and 130 resulted in a sentence to some sort of sanction, including jail and community work. This gives an acquittal rate of 28 percent, which is rather high compared with all criminal cases in Norway, for which the rate is 7 percent. This illustrates the greater challenges in securing convictions in bribery-related cases (Ministry of Justice and Public Security, 2017: 126). Of the remaining incidents, 31 resulted in a fine or a waiver of prosecution, and 125 had no recorded information regarding the outcome. The data do not, however, provide information on the characteristics of the cases or how they were detected.
Detection of bribery
Central to the understanding of how bribery is detected is the question of who detects it. Though there is a lack of available data to assess this accurately, there is some research of interest. At a trans-national level, the OECD investigated 427 cases of overseas bribery and found that self-reporting was the authorities’ information source in one-third of cases (OECD, 2014: 9). Information from whistleblowers was the source in only 2 percent of the cases (OECD, 2014: 9). By contrast, a study by KPMG found that 61 percent of corruption-related frauds were detected because of whistleblowers (KPMG, 2016: 12). KPMG investigated how the case was initially revealed, whereas the OECD’s study (2014: 12) measured how the case came to the attention of the authorities, and naturally there will be some differences. A study in Norway found that 22 percent of people convicted of bribery were detected by journalists (Gottschalk, 2014: 190), whereas the media were recorded as the source in only 5 percent of the cases in the OECD’s selection (2014: 9). As Gottschalk points out, the category ‘media’ may conceal whistleblowers who gave the information to the journalist. Law enforcement detected 13 percent of the bribery cases in the study by the OECD (2014: 9), whereas they detected only 1 percent of white-collar criminals in Norway (Gottschalk, 2014: 189). In the UK, referrals from companies or other agencies, such as the Financial Conduct Authority, were the main source of overseas bribery cases investigated by the SFO (Lord, 2015: 584). There could be several reasons for these divergent findings, including sample selection and analysing techniques. Though these studies examine different types of cases, the studies show that a variety of organizations and individuals are involved in the detection of bribery.
Methodology
The idea behind this project was to provide basic descriptive data on the profile of bribery cases in the two countries. This objective was achieved by undertaking a content analysis of bribery cases resulting in a conviction in E&W or Norway. The cases were found using Google, the database Lexis, which contains news articles from the UK, and the database Atekst, which provides news articles from Norwegian media; press releases by the SFO and its Norwegian counterpart Økokrim were also assessed, as well as reports by Ernst and Young (n.d.) and Transparency International Norway (2016). These searches, limited to articles published between 2003 and 2015, identified 75 cases from E&W and 46 cases from Norway. The methodology used in this study has been used previously in other criminological studies, such as studies of white-collar criminals in Norway (Gottschalk, 2014) and ‘cash-for-crash’ insurance fraudsters in the UK (Button et al., 2017) and an examination of stranger child abduction in the UK (Collie and Greene, 2017). Similarly to these three studies, this study uses the media as a source to find objective information, as opposed to analysing how a subject is presented by the media.
The comparative design of this research was chosen in order to have a foundation for understanding the findings in each country. Moreover, comparing the two countries could possibly identify which characteristics are country specific and what could be more general findings. Investigating only two countries naturally has its limitations as regards finding international trends. Nevertheless, when the results are analysed in the light of other studies they can prove to be useful. The assumption in this research is in a positivistic tradition where there are assumed to be some ‘universals’ in the justice system (Pakes, 2015: 18). The two countries were chosen because they have a tradition of policy transfer in criminal justice, for example, implementation of the KREATIV model for investigative interviewing in Norway was based on the British PEACE-training course (Fahsing and Rachlew, 2009: 52). This project could serve as a starting point for further research on how the criminal justice systems in the two countries deal with bribery cases and search for successful policies.
Content analysis should be objective and replicable and the technique is expected to be reliable (Krippendorff, 2013: 24). A main measure to ensure this is to design a coding manual where all the possible categories for each variable are included, together with adequate guidance on how to use them (Bryman, 2008: 283). The variables in this project are partly adapted from Gottschalk’s (2014) study in Norway, from Dyck et al. (2010) and from some commonly used standards. The classification in this research is superficial when it comes to classifying socioeconomic class, because no additional information regarding education and income was collected. Social class is often defined by a combination of education, occupation and income (Rose and Pevalin, 2003: 29). The category used in this research is adopted from Bryman (2008: 284), which is based on Goldthorpe’s work. His classification combines occupational categories in which members are comparable in terms of their source and level of income, their degree of economic security and their location within the system of authority (Marshall et al., 1988: 21). Guidelines from the University of Essex were used to distinguish between the classes (Institute for Social and Economic Research University of Essex, n.d.). For the economic sectors, the International Standard Industrial Classification of All Economic Activities Rev. 4 was used (United Nations Statistics Division, 2008).
Reliability and validity interact because a measure cannot be valid unless it is reliable (Robson, 2011: 86). Reliability could be described as the trustworthiness of the data (Krippendorff, 2013: 268). A research method is reliable when it ensures that the same phenomenon is measured consistently (Robson, 2011: 85). For the content analysis, this implies that, if someone else did the same searches and used the coding manual, they would find the same sample of cases and identify the same characteristics as in this research. A disadvantage with content analysis is that it is only as good as the documents that are studied (Bryman, 2008: 291). A drawback with the media as a source is that they can be unreliable and suffer from bias (Gottschalk, 2014: 39). The reliability of the data was improved by using additional sources when possible. This measure does not counter the bias in the selection of cases, and the sample suffers from the inherent bias of media coverage, such as focusing on the most serious cases, ‘the good story’ and famous people (Gottschalk, 2014: 41).
Another limitation of the sample was that the researcher had to make judgements about the evidence in each case in order to decide if the case should be included. For the Norwegian sample, this did not cause any major concerns because everyone who was convicted of bribery in accordance with the Penal Code had committed bribery as it is defined in this research. Because of the complex legislation in E&W, there were several cases that were questionable. For example, several news articles described a corrupt officer who had been convicted of misconduct in public office, an offence that includes much more than bribery. Only cases where the officer had received a financial or other advantage in exchange for the misconduct were included in the sample. It could sometimes be challenging to find the relevant information to evaluate whether or not a bribe had been paid. A potential consequence of this is that cases that are relevant for this study were not included owing to the lack of proof of bribery. Moreover, because people were convicted of offences that primarily cover other types of behaviour than bribery, the news articles might not mention ‘bribery’ or ‘corrupt’ and the cases would therefore not be included in the sample.
A second question related to the trustworthiness of the research is whether or not the findings are valid. This refers to the accuracy of the results and to the extent to which the indicators measure the concept they are intended to measure (Bryman, 2016: 158). Because the sample in this research is regarded as a convenience sample, it is a non-probability sample (Bryman, 2008: 183). In this project, the whole population comprised bribery cases resulting in a conviction. The number of persons and organizations in the Norwegian sample was 127 and, as shown above, the number recorded in the police statistics from 2004 to 2015 was 130. This comparison suggests that the Norwegian sample probably is close to containing the whole population of cases and it should therefore also be a valid sample. A similar comparison could not be done for the sample from E&W because the number of the whole population of cases remains unknown. Based on the wide range of sources, it can be assumed that the sample from E&W is also likely to include close to the whole population of cases resulting in a conviction. Given the hidden nature of the crime, however, and particularly of bribery-related cases, it is not possible to evaluate to what extent the population studied in this project is representative of bribery cases in general (those that do not reach the criminal courts or have not been detected).
Profile of bribery cases
The sample consists of 121 cases (75 from E&W and 46 from Norway) involving 325 convicted persons/organizations (198 in E&W and 127 in Norway). Some of the findings are presented at case level, whereas others are shown at a person/organization level. The number convicted per case varies between 1 and 18 in E&W and between 1 and 15 in Norway, an average of 2.6 and 2.8 respectively. When possible, data were obtained from law enforcement or legal sources, such as official transcripts from the legal database Westlaws, press releases by the SFO or convictions from Norwegian courts. This type of additional information was obtained for 161 of the convictions – 83 of 198 (42 percent) from E&W and 78 of 127 (61 percent) from Norway. The additional sources did not necessarily confirm all elements of the case, but they did substantiate the most important such as the value of the bribe and the characteristics of those convicted. In order to have a sample that also contains more recent cases, appealed cases were included and they constitute 1 convicted in E&W and 11 convicted in Norway, divided amongst five cases. The distribution of cases over the years is quite even, though both countries had most convictions in 2010 and 2011, with 13 in E&W in both years and 7 and 8 respectively in Norway.
The complex bribery legislation in E&W means that several offences are included in the sample. Table 1 shows that the categories ‘misconduct in public office’ and ‘other’ were the largest in the sample, accounting for 28 percent and 25 percent respectively. Within the category ‘other’, there were 24 convictions for perverting the course of justice and 19 convictions for fraud or conspiracy to defraud.
Number of convictions by offence, England & Wales (2003–15).
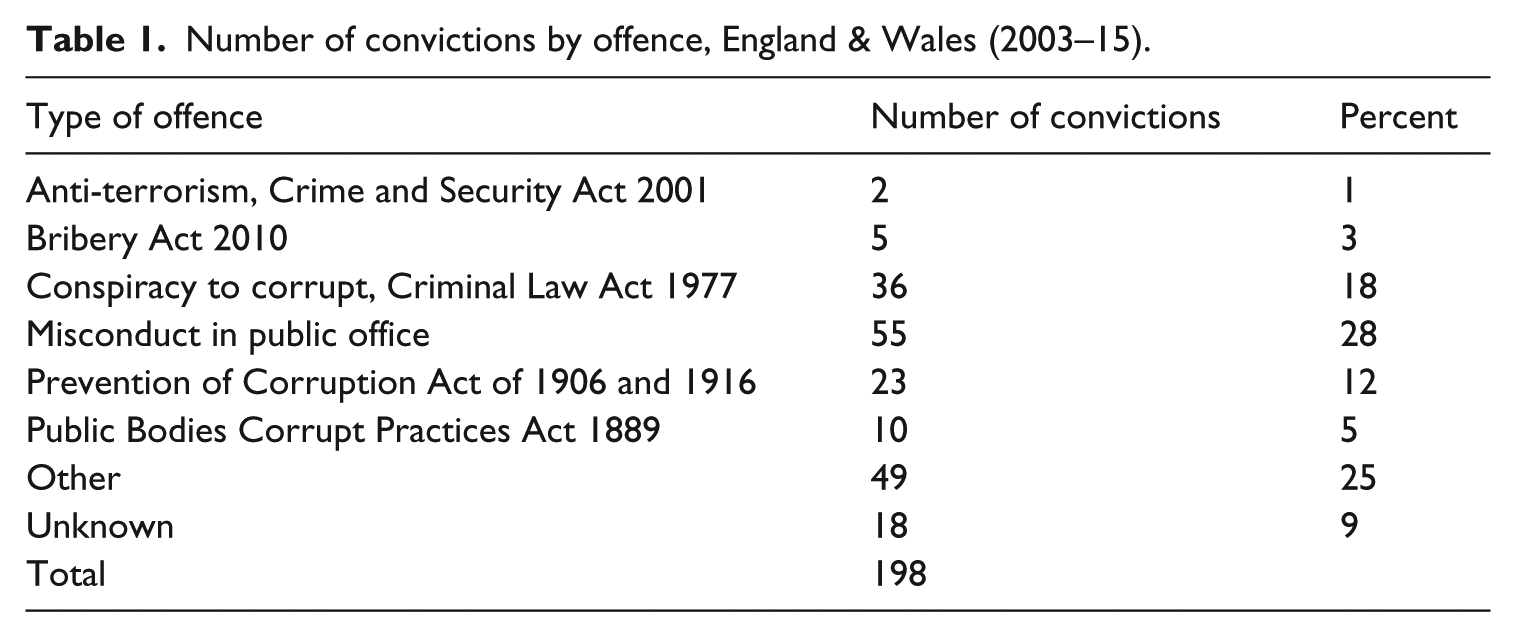
In the sample from Norway, there was relatively little variation: 113 were convicted under the current legislation, Penal Code sections 276a, 276b or 276c; of the remaining convictions, 3 were convicted under the bribery legislation prior to 2003, 2 were convicted of other offences and 9 were unknown.
The median time from when the crime started to final conviction was six years in both countries. The mean value was 6.4 in E&W and 6.7 in Norway. The median time from when the investigation started to final conviction was three years in both countries. The mean value was 3.0 in E&W and 3.3 in Norway. There were no data for 63 of the 325 convictions (19 percent). Though this makes the data incomplete, it indicates that bribery cases take a relatively long time to detect, investigate and prosecute. In both countries, about half of the cases were investigated by local police forces alone (53 percent in E&W and 49 percent in Norway). The other half were investigated by either a national body alone or in cooperation with local bodies. The investigating police force was unknown for 24 of all cases (17 in E&W and 7 in Norway).
Who are the convicted?
In both countries, the vast majority of those convicted were male: only 17 of 193 (9 percent) convicted persons in E&W were female; only 1 of 112 (1 percent) in Norway was female (the gender was unknown for 12 convictions). Of all those convicted, only eight were organizations: five in E&W and three in Norway. The average age of those convicted at the time of conviction was 43.3 years in E&W and 51.1 years in Norway. In E&W, if ‘misconduct in public office’, ‘other’ and ‘unknown’ were excluded from the calculation, the average age rose to 47.7 years. When it comes to the occupational status of those convicted, it was found that 33 percent of the convicted individuals in E&W and 51 percent in Norway were higher-grade professionals or managers in large companies. Occupational information was unknown for 39 in E&W and for 15 in Norway. Interestingly, these findings are similar to some global studies of fraud that found that most offenders were males (Association of Certified Fraud Examiners, 2016: 57; KPMG, 2016: 7; Van Onna et al., 2014) in either a management or an executive position (KPMG, 2016: 8). The similarity in the profile could suggest that a certain proportion of fraud and bribery is committed by individuals of high social status and therefore could be seen as typical ‘white-collar crime’ as described by Sutherland (1941). It is also important to note that several studies of fraudsters beyond occupational fraud have noted that wide sections of society are involved (Button et al., 2017; Levi, 2008; Weisburd et al., 1991).
The financial advantage
A key aspect of bribery is the ‘financial or other advantage’. In the sample, information regarding the value of this advantage was available for 159 of the convictions in E&W and for 124 in Norway. In some cases, this information was only partly available and this implies that the recorded value might be lower than the actual amount. One example of this is a case from E&W where a driving examiner demanded a bribe of £1000 to pass candidates who had failed (Robinson, 2011). The data did not provide information on how many times he accepted this bribe, and the recorded amount was therefore £1000, though it is clear that a bribe was paid by several candidates. Other factors contributed to an increase in the recorded value of the bribes. Several people can be convicted for paying or receiving the same bribe, and people are convicted of accessory to bribery. One example is a case from Norway where two employees in a consultancy firm were found guilty of bribing a foreign official with £55,509 (Norconsult-ansatte dømt, 2011). In the content analysis both are recorded with this amount, though the bribe was paid only once. This, together with the large variation in bribery amounts, makes average values less useful. Though not further analysed, the average value of the bribe was calculated as £498,916 for E&W and £205,756 for Norway. The median value was, however, £20,000 for E&W and £32,827 for Norway. Rather than analysing average values further, the cases were grouped into value categories (see Table 2).
Number of convictions by the category of the value of the bribe.
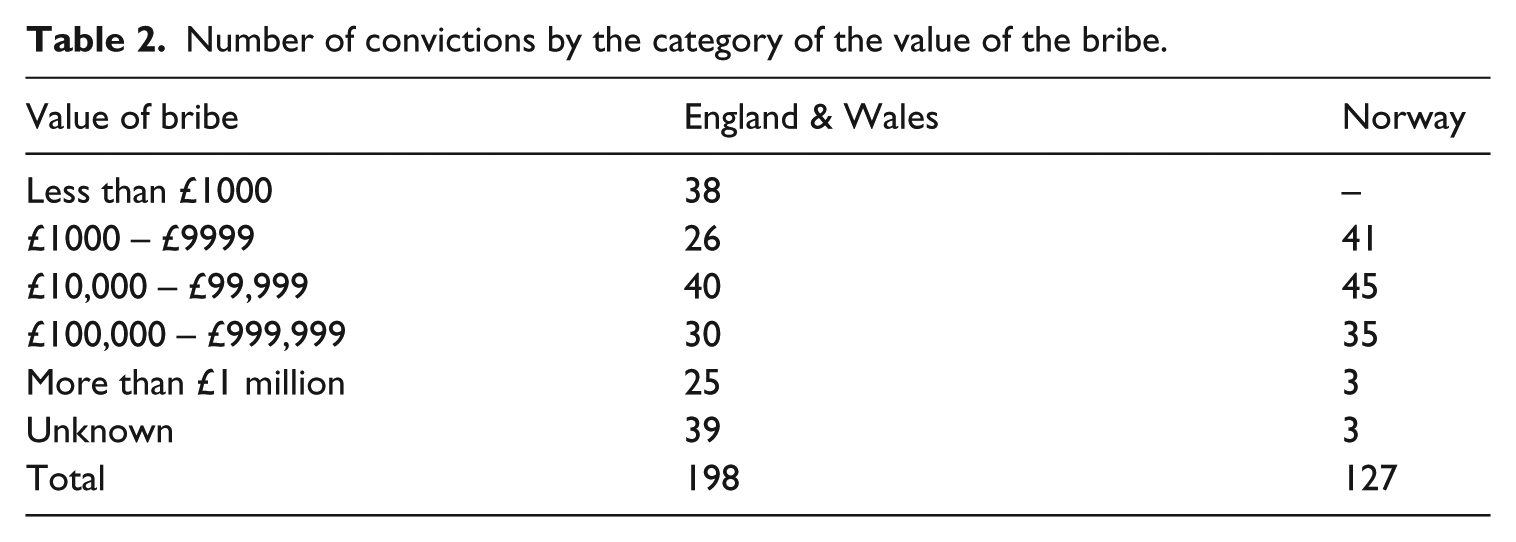
As Table 2 shows, the sample from E&W has a wider variety in the value of the bribes than the Norwegian sample, where the majority of the cases fall within the middle categories. Further analysis of the value of the bribes shows that they tended to be higher when the bribe was paid overseas than when it was paid within the country. Figure 1 illustrates this by showing the value categories split between overseas and domestic. ‘Overseas’ is here defined as cases where a payment crossed a border. A possible explanation for this could be that cases with international elements are resource intensive to investigate and that law enforcement bodies therefore only investigate particularly serious cases. Another reason for the larger sums in cases with international elements could be that these cases relate to very large contracts.
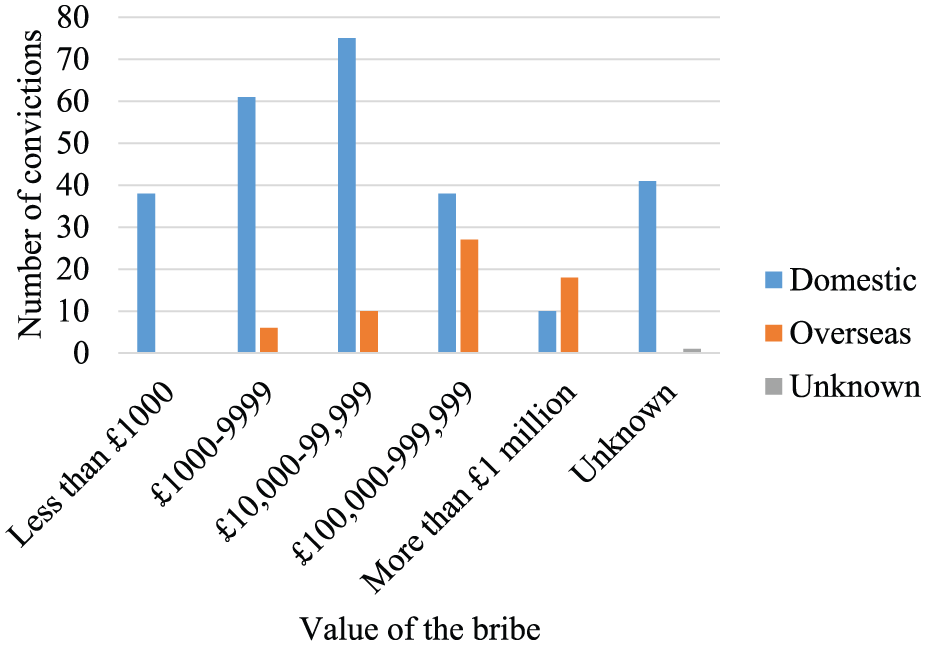
Number of convictions by the value of the bribe, split between domestic and overseas cases.
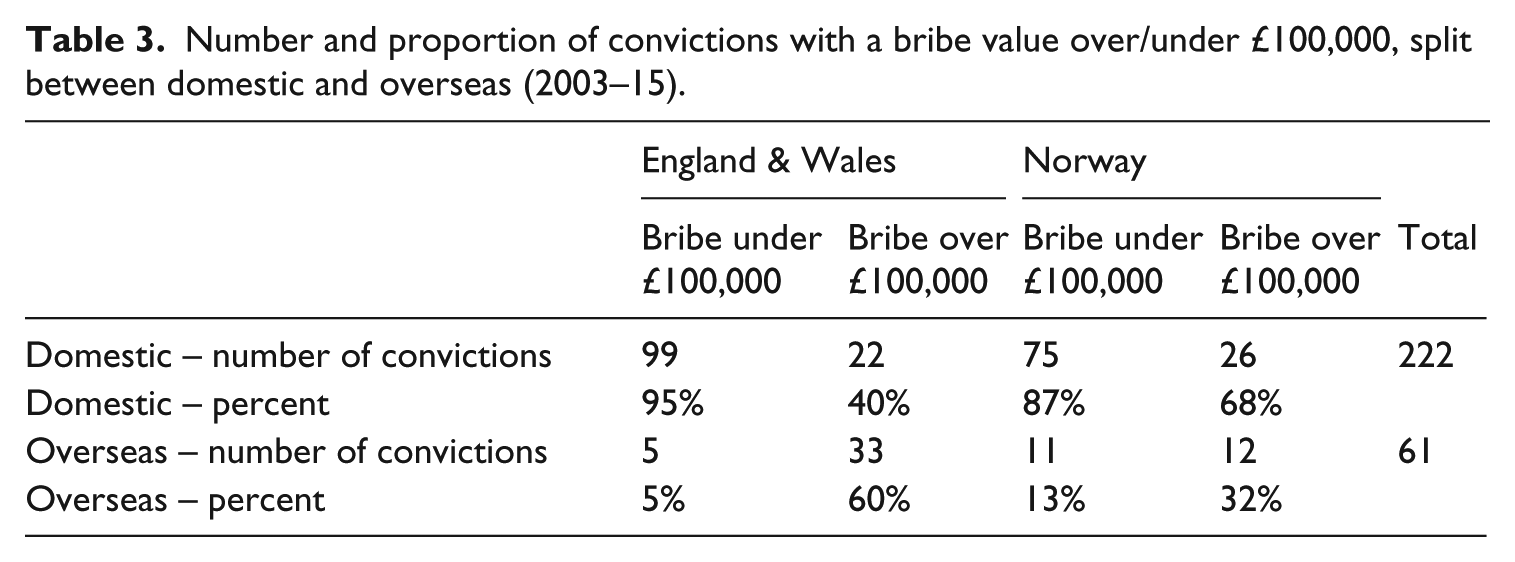
Studying each country separately, the trend was the same. However, it was clearer in E&W where the majority of convictions over £100,000 were overseas, and the majority of the convictions under £100,000 were domestic (Table 3).
Number and proportion of convictions with a bribe value over/under £100,000, split between domestic and overseas (2003–15).
Who benefited from the bribe?
In addition to the value of the bribe, it was investigated who benefited from the bribe. This was done by using two main categories, namely the bribe payer and the organization on whose behalf he/she was acting. Because many of the bribe payers were in a senior position in the organization on whose behalf they were acting, it could be assumed that they would have had some sort of direct or indirect benefit if the organization secured contracts through paying bribes. This category can therefore not be used to distinguish between those who were motivated by the prospect of personal gain and those who did it with only the best interests of the organization in mind. No data on the bribe receiver were recorded because the bribe receiver in all cases benefits when he/she receives a financial or other advantage. The result of this analysis, which was done on a case level, showed that in 37 percent of the cases from E&W the bribe payer was acting on behalf of others, whereas in Norway this accounted for 54 percent. This finding is to some extent in line with the finding on occupational status: the sample from Norway had a higher share of cases where those convicted were higher-grade professionals or managers in large companies.
In what sectors did the cases occur?
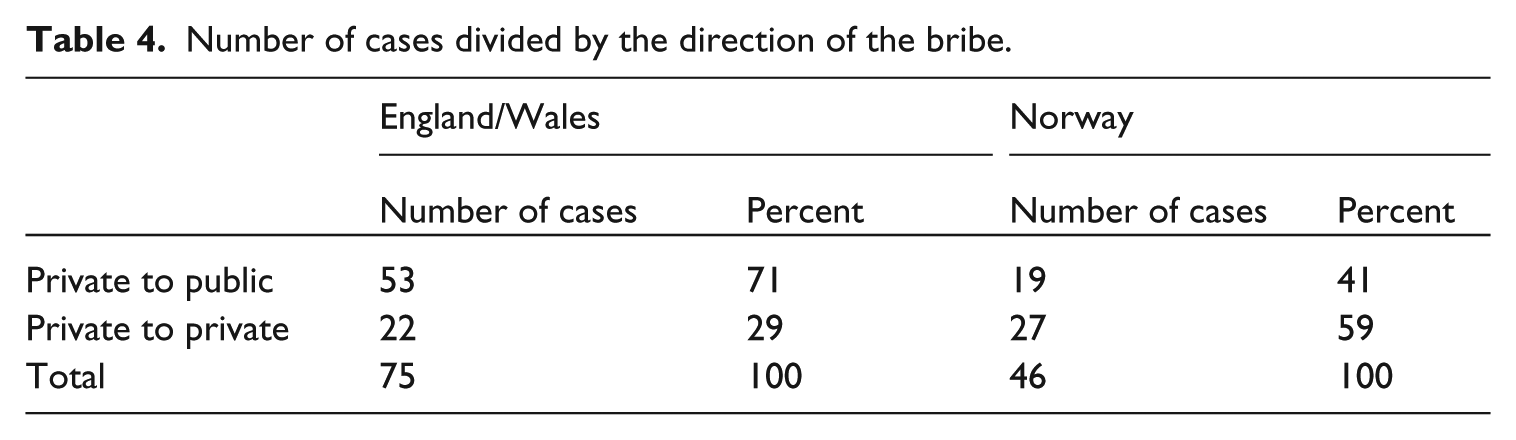
The cases were analysed to see where the bribe was paid from and to whom (Table 4). There were no cases of bribery within the public sector or from the public to the private sector. In E&W, 29 percent of the cases happened within the private sector and in 71 percent of the cases the bribe was paid from the private to the public sector. By contrast, the majority of cases in Norway happened within the private sector. These differences might be a reflection of variation in the type of bribery cases the country chooses to detect and prosecute. However, the observed result might also be caused by the inherent bias in the sample and reflect a difference in the type of cases the media choose to highlight, rather than an actual difference in the type of cases that result in convictions. Nevertheless, building on the above findings, this could suggest that there is a difference in the type of detected cases in Norway and E&W. Compared with E&W, Norway seems to detect more cases involving people in high positions within the private sector. This could suggest that E&W are more concerned than Norway with bribery within the public sector. It is important to bear in mind here that this study examines only detected cases of bribery resulting in a conviction. Therefore, it does not measure the true prevalence of bribery, and it remains unknown to what extent there are differences between E&W and Norway in the level of bribery within the private and public sectors.
Number of cases divided by the direction of the bribe.
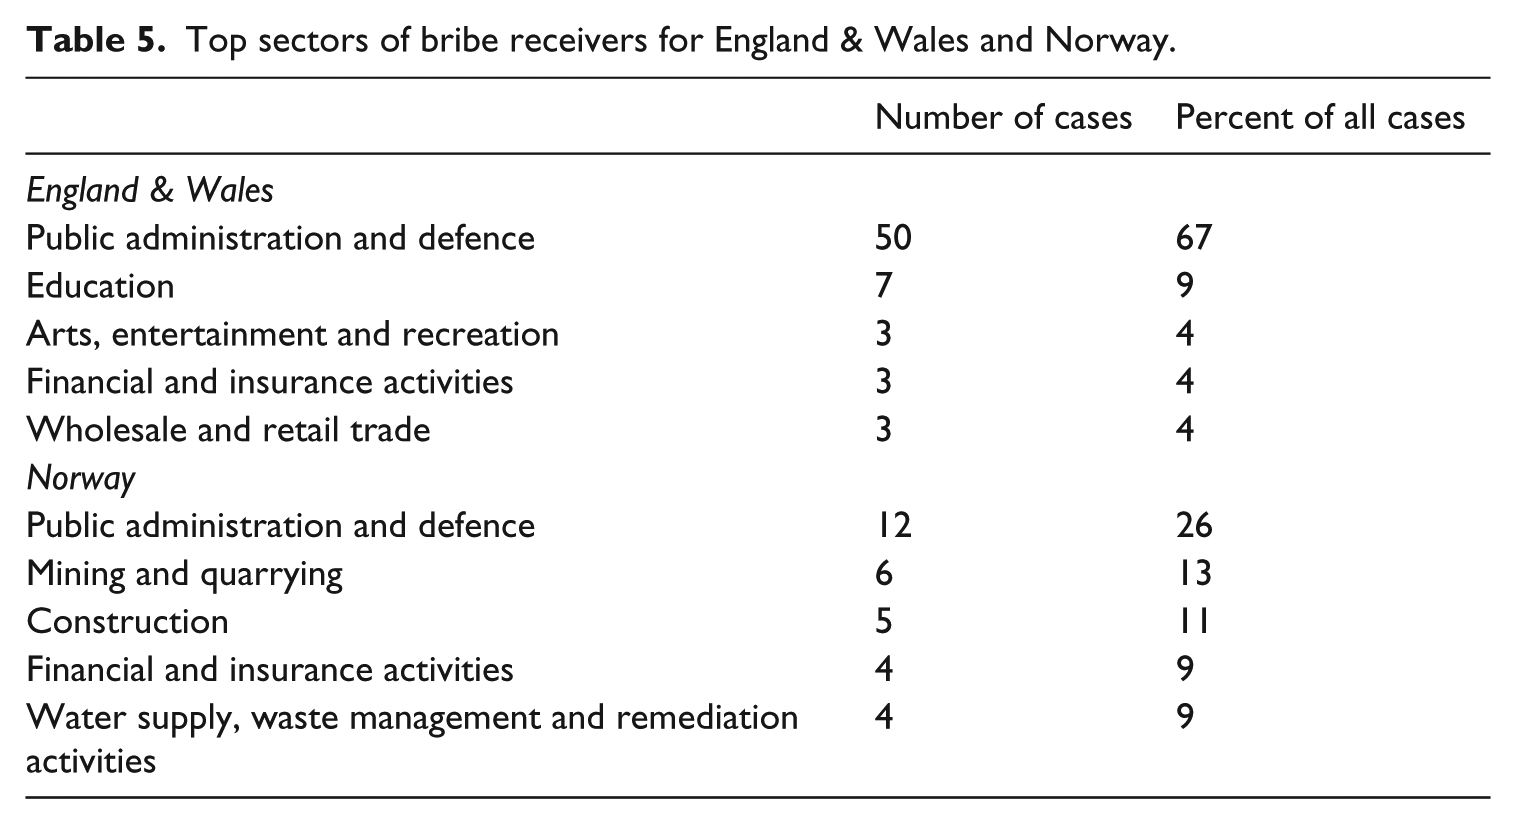
The sector of the bribe payer and of the bribe receiver were recorded (Tables 5 and 6). More than 20 categories were used, although only the categories accounting for more than two cases are shown here. As one might expect based on Table 4, in the majority of cases the bribe was paid to the public administration in E&W, accounting for 67 percent of the cases, whereas in Norway this category accounts for 26 percent of the cases. The other top sectors were different in the two countries and caution must be applied when interpreting this result because each category accounts for only a few cases and the finding could therefore be random rather than a trend. A possible explanation of the apparently high prevalence of a bribe paid to someone in the category ‘Mining and quarrying’ could be the dominant role of the petroleum industry in the Norwegian economy (Ministry of Petroleum and Energy, 2014: 10).
Top sectors of bribe receivers for England & Wales and Norway.
Top sectors of bribe payers for England & Wales and Norway.
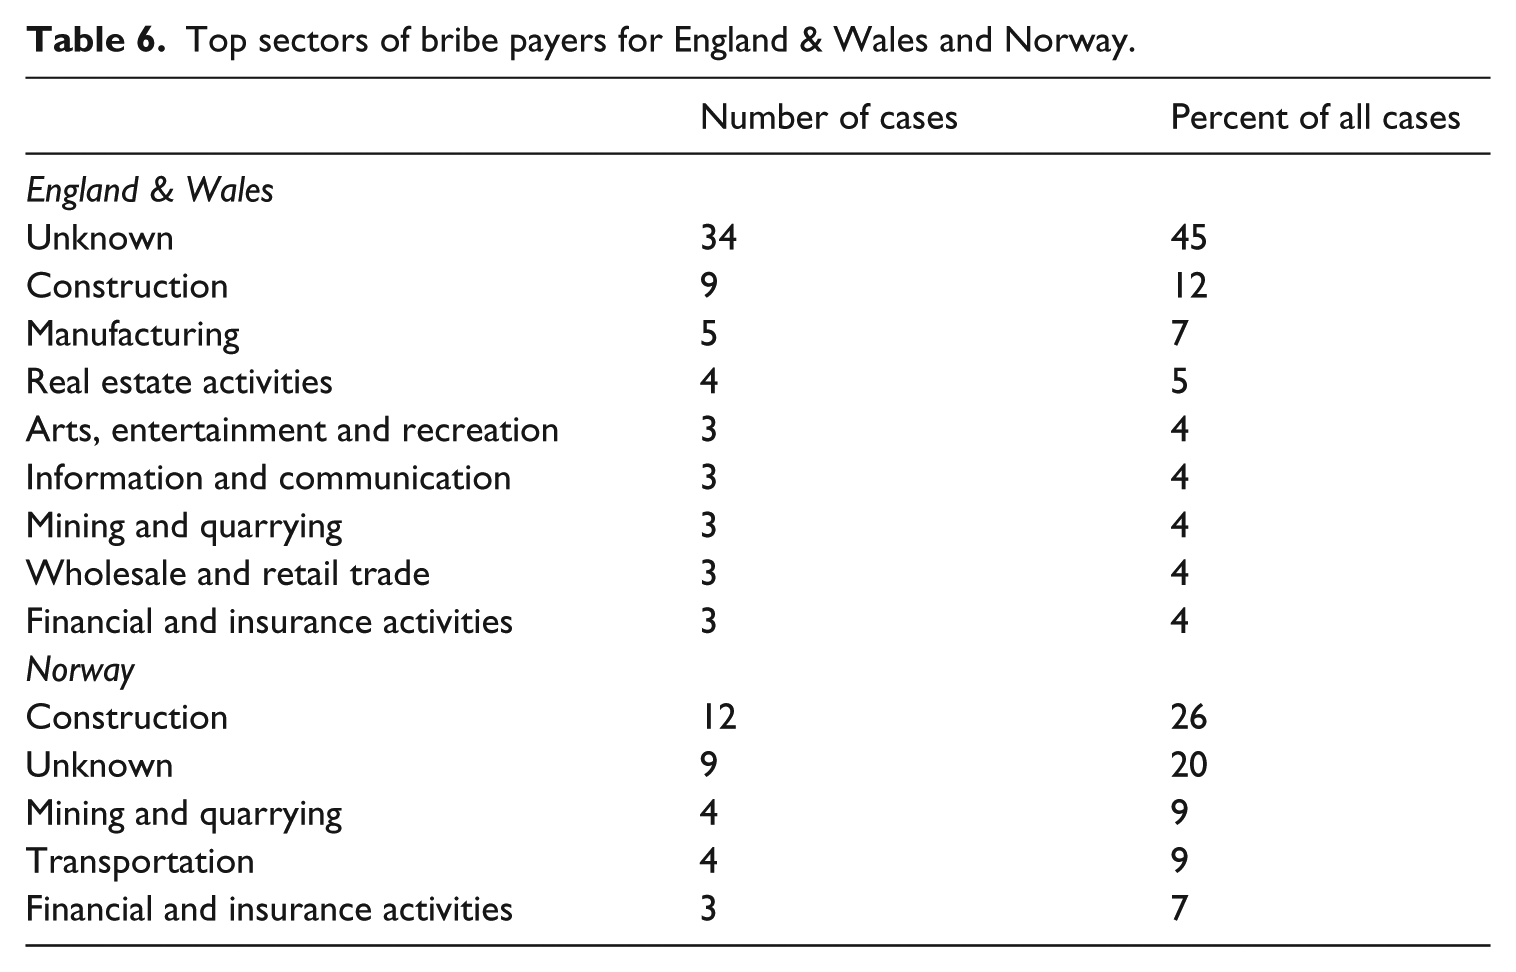
When it comes to the bribe payer, the categories ‘construction’ and ‘unknown’ were amongst the most prevalent in both counties (Table 6). In E&W, the highest number of cases was found in the ‘unknown’ category, with 34 cases. In some of these cases the bribe payer was described as ‘criminal’, ‘gang leader’ or similar descriptions. Many of the cases with an unknown bribe payer, 18 of 34 (53 percent), were convictions for ‘misconduct in public office’.
Who detected the cases?
Who the case was detected by was recorded for 102 of 121 cases (84 percent). Recording this variable was quite challenging because there was often more than one actor who detected it, but details about all of them were rarely publicly available. Only 27 of 121 (22 percent) cases contained information about an additional source of detection. Naturally, it will often be in the interest of the whistleblower to stay anonymous and sometimes this could imply that it is kept undisclosed that the case initially was detected by a whistleblower. In almost all the other categories there could be a whistleblower involved. Especially ‘law enforcement’, ‘media’ and ‘self-reporting’ are categories where it can be assumed that the case is started by whistleblowers, but that this information is kept out of the public domain.
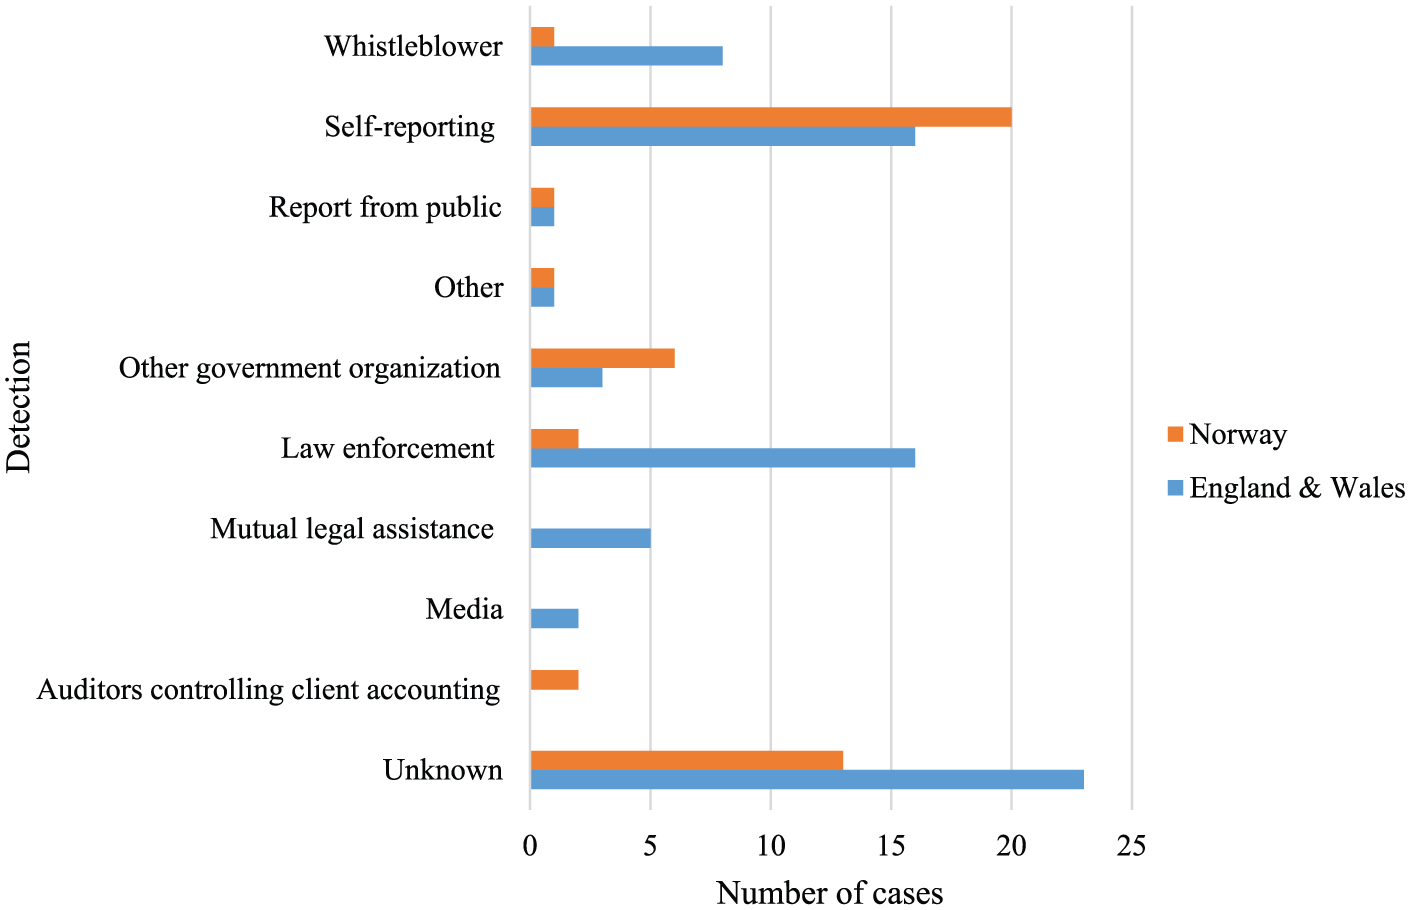
As shown in Figure 2, most cases were recorded as detected by a ‘whistleblower’, by ‘self-reporting’ or by ‘law enforcement’. Existing research has divergent findings for the prevalence of whistleblowers as a source of detection, ranging from 61 percent (KPMG, 2016: 12) to 2 percent (OECD, 2014: 9). In this research, whistleblowers detected 22 of 75 (29 percent) cases in E&W and only 7 of 46 (15 percent) in Norway. A possible explanation for this could be that whistleblowers in Norway are more ‘hidden’ in other categories than they are in E&W, for example in the category ‘self-reporting’, which is recorded as the source for 13 of 46 (15 percent) cases. This explanation might, however, not be sufficient because the phenomenon of ‘hidden’ whistleblowers might be similarly prevalent in the sample from E&W. It is noteworthy that auditors account for the detection of few cases in both countries – one case in E&W and two in Norway. This could suggest that audits are less important than other measures when it comes to the detection of bribery. However, auditors might also be ‘hidden’ in categories such as ‘self-reporting’, and in reality may have been involved in the detection of more cases than is observed here.
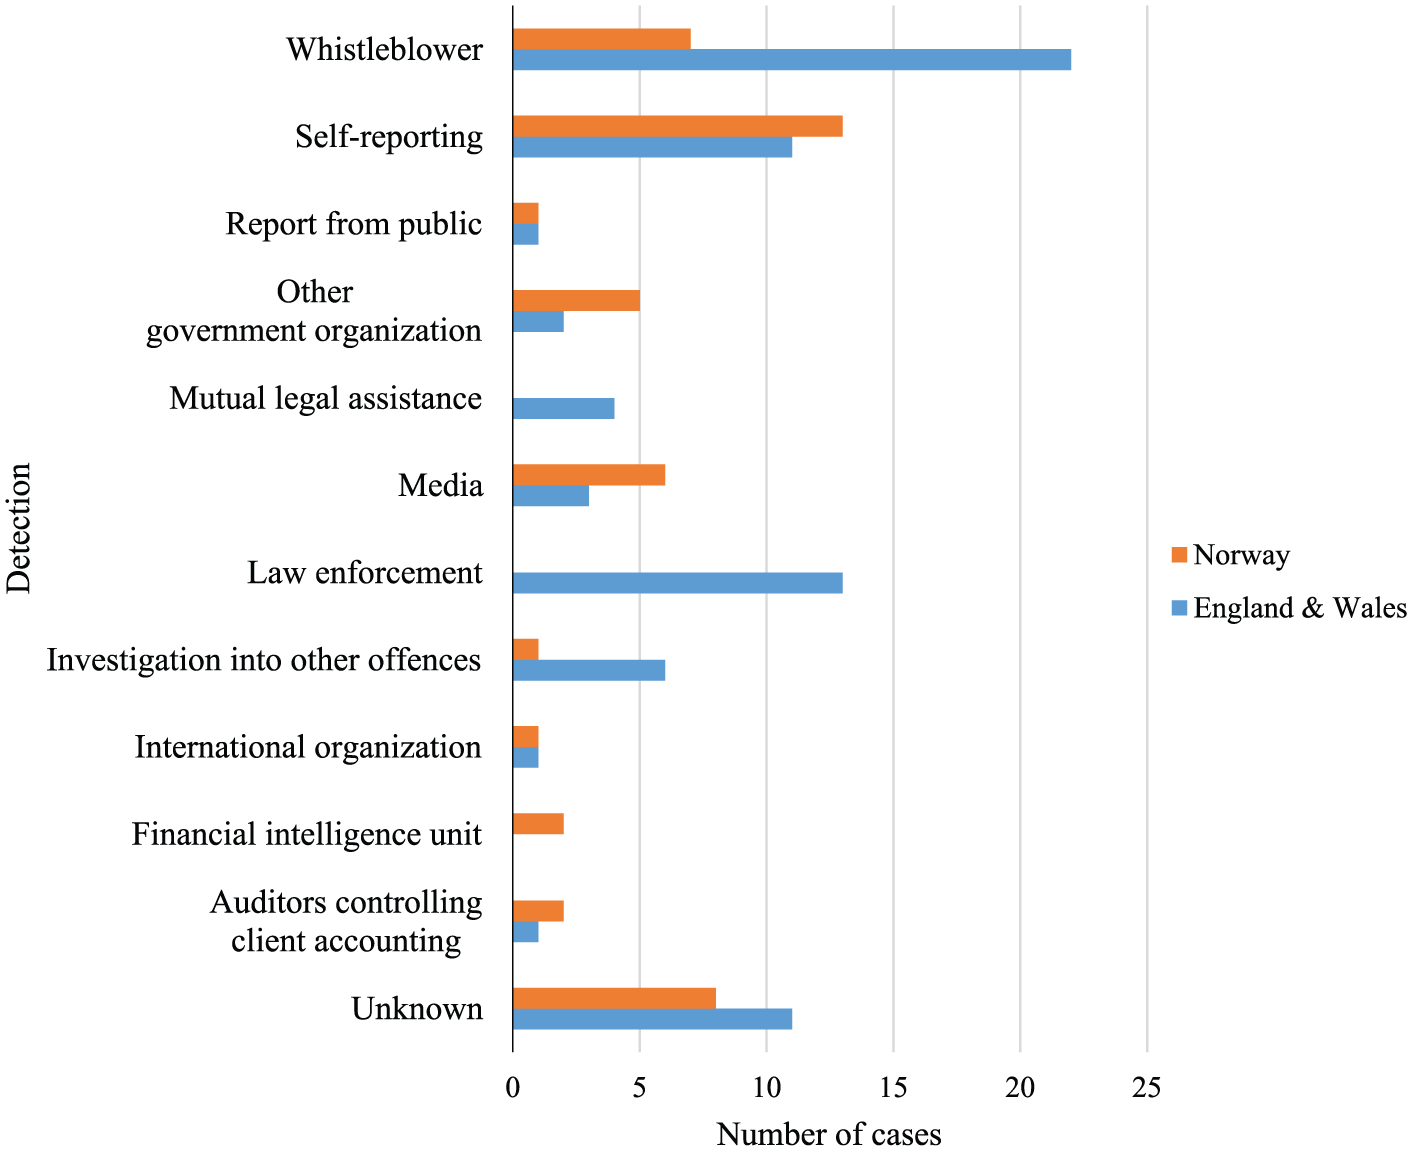
Number of cases by the category of who detected the crime, England & Wales and Norway.
When studying the relative share of who detected the cases in each country there are some interesting differences (Figure 3). The role of law enforcement seems to be different in E&W and in Norway. No cases were detected by law enforcement bodies in Norway, a finding that is consistent with a study from Norway that found that the police detected 1 percent of white-collar crime (Gottschalk, 2014: 189). By contrast, ‘law enforcement’ was recorded as the source of detection in 17 percent of cases (13 of 75) in E&W. This is a similar finding to that of the OECD (2014: 9) where 13 percent of the cases were initiated by law enforcement bodies. These findings suggest that law enforcement bodies in E&W are more active in detecting bribery cases than are the police in Norway.
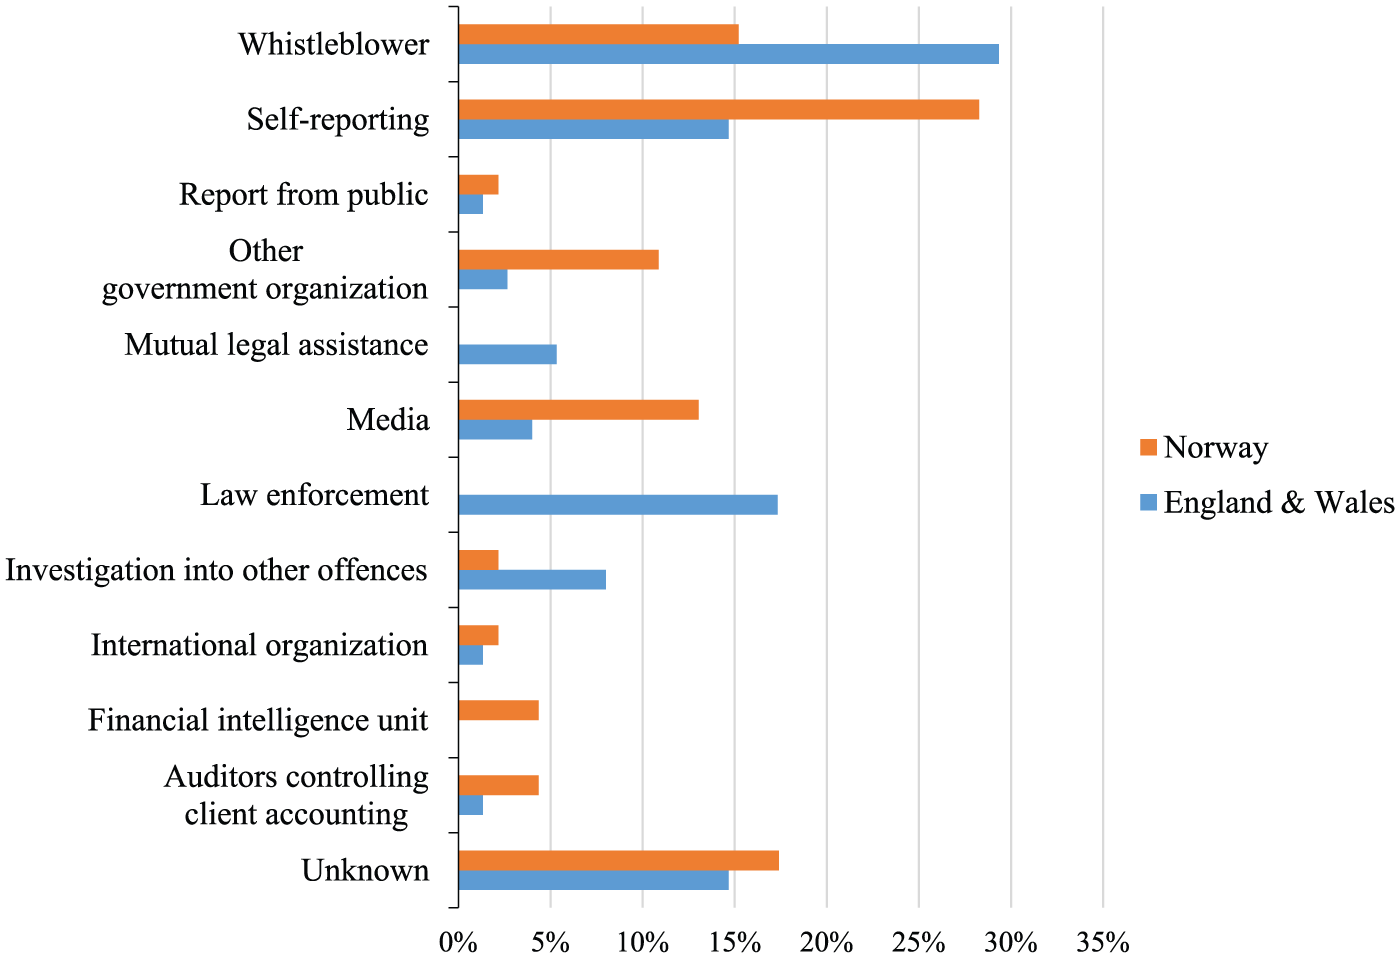
Percentage of cases in each category of who detected the crime, England & Wales and Norway.
Another interesting difference between E&W and Norway is the proportion of cases detected by the media. This research found that the media detected 13 percent (6 of 46) of cases in Norway. The finding is to some extent supported by Gottschalk (2014: 190), who found that 22 percent of people convicted of bribery in Norway were detected by journalists. Though these findings are not consistent, they are interesting because both figures are high compared with E&W, where the media accounted for just 4 percent of cases (3 of 75) and the OECD’s study (2014: 15), where the media detected 5 percent of cases. These findings suggest that journalists in Norway might be in a unique position when it comes to detecting bribery. This could possibly explain the small proportion of whistleblowers in the Norwegian sample, because whistleblowers could be ‘hidden’ in this category.
Who detected the most serious cases?
As shown earlier in this paper, there was a great variety between the cases. When studying detection, it could be interesting to know who detected the most serious cases. Though the variable ‘value of the bribe’ does not necessarily capture the severity of the case, it is probably the best variable in this project since no further analysis of the consequences of the bribe was conducted. For E&W, there were 36 cases involving bribes over £100,000 and for Norway the number was 16 (see Table 7). A limitation with this analysis is that it was conducted at a case level and there could be convictions for different amounts within the same case (the recorded value at case level was one of these amounts – it was not summarized). Nevertheless, this analysis provides an indication of who detected the most serious cases.
Number of cases divided by the category of the value of the bribe.
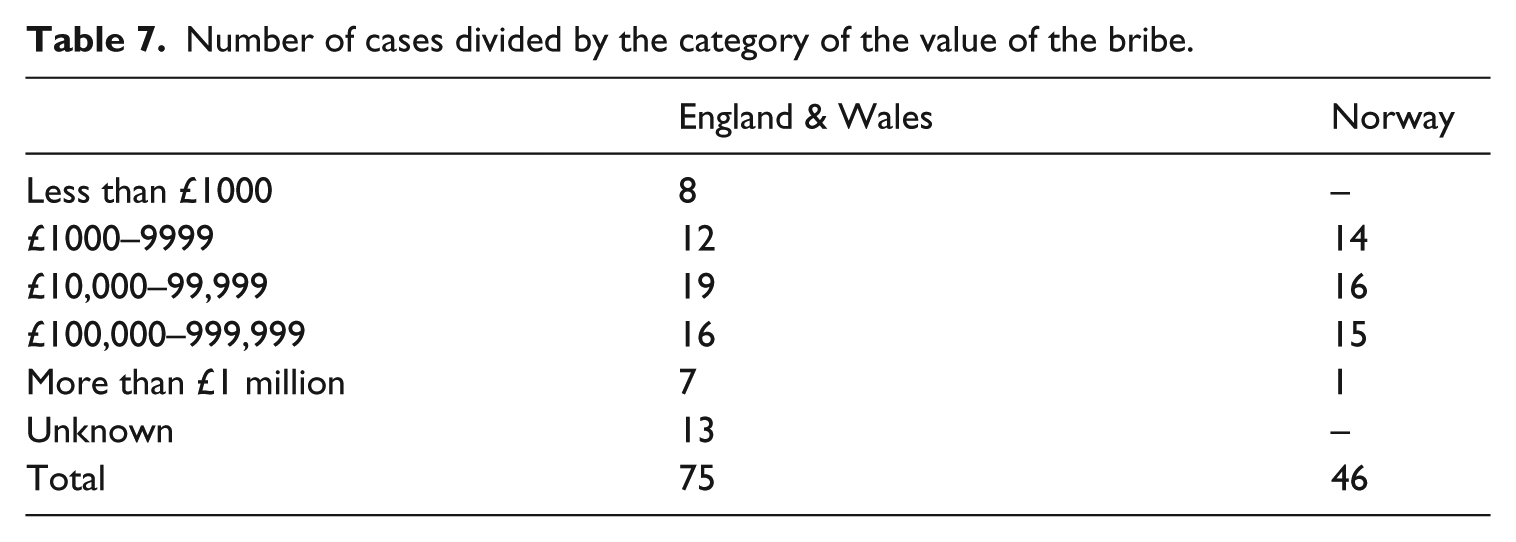
Figure 4 shows, similarly to the analysis of all cases, that whistleblowers detect most cases in E&W. However, the second-highest number of cases was detected through ‘mutual legal assistance’, which includes other countries’ governments, for example US government bodies that report cases to the SFO. This finding is to some extent in line with Lord (2015: 584), who found that referrals from other agencies were the main source of cases from the SFO. Interestingly, ‘law enforcement’ was recorded as the source of detection for only 1 of the cases over £100,000, in contrast to 12 of the cases with a value under £100,000. This might suggest that law enforcement bodies detect the less serious cases. For the Norwegian sample too, there was a consistency in the analysis of all cases and of cases over £100,000. Both analyses found that ‘self-reporting’ detected most cases, and ‘media’ was quite high in both analyses. Whistleblowers are also in this analysis a less prevalent source of detection in Norway than in E&W.
Number of cases with a value of the bribe over £100,000, by the category of who detected it, England & Wales and Norway.
Who reported the cases?
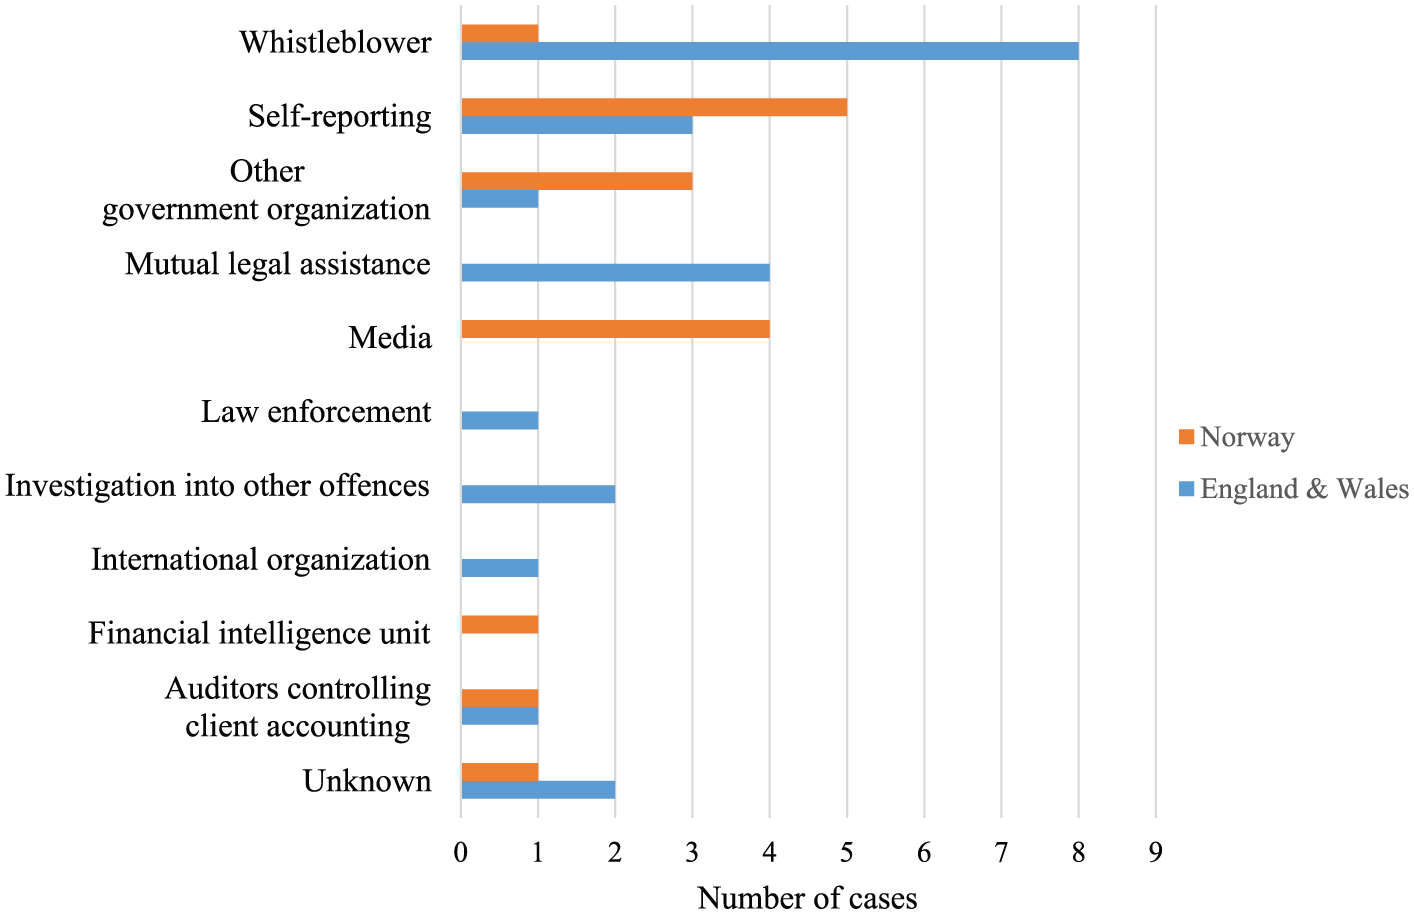
The main question in this research was how the cases were detected. However, in order for a detected case to result in a conviction, law enforcement had to be involved. The case could be reported by someone other than the one detecting it, for example, organizations might have an internal process before the case is reported to the police. In order to make a distinction between detection and reporting, who reported the case to the police was recorded for each case (Figure 5). Unfortunately, this information is unknown for 30 percent of the sample, in contrast to 16 percent unknown for detection.
Number of cases by the category of who reported the case, England & Wales and Norway.
In contrast to the findings on detection, this shows a higher number for ‘self-reporting’ for both countries, accounting for 30 percent of all the cases (21 percent in E&W and 43 percent in Norway). This might be a reflection of cases that are reported internally by a whistleblower and then reported to the police by the organization. The finding is in line with the OECD’s study (2014: 15), where 31 percent of cases were brought to the attention of law enforcement bodies through self-reporting.
Sanctions
For 298 of the 325 convicted, the cases resulted in either suspended or unsuspended imprisonment (22 resulted in community service or fines, and the sanction was not found for 5 of those convicted). For the whole sample, the average number of months in prison was 25. Caution must be used when using these statistics because 125 of the 298 (42 percent) jail sentences include other offences than bribery. For 175 persons in E&W being sentenced to imprisonment, the average time was 27.4 months. For 114, the sentence included only bribery, and the average time was 21.7 for those convicted. For the Norwegian convicted, the average for the 123 cases resulting in imprisonment was 21.5 months. Only 50 of these were convicted only of bribery, and the average sentence for them was 10.7 months in prison. It seems to be more common to separate the imprisonment for each offence in E&W than in Norway, where the court often sets one sentence for all offences. It is therefore beyond the scope of this project to provide comparable data between the two countries. Nevertheless, these findings do suggest that the sanction level is higher in E&W than in Norway, but overall sentences were comparable to other white-collar-related offences such as fraud (Levi, 2010).
Conclusion
This paper provides important foundation data on the profile and nature of bribery in two industrialized countries in Europe noted for low levels of corruption, illustrating both similar and different characteristics (Transparency International, 2016). The research has utilized a methodology based upon open source reports in the public domain, which could be replicated in other countries and for other types of white-collar crime. It is hoped this paper will stimulate further research in this area and using this technique.
Based on a sample of 121 cases from E&W and Norway, this research found that there was a great variation between the cases, in terms of both severity and complexity. They varied from cases where one person accepted bribes for issuing a driving licence to people who were not entitled to it, to cases involving millions of pounds in bribes paid to foreign officials. The overall picture for both countries is that the public administration was the main bribe receiver, whereas there was found to be a greater variation in the sector of the bribe payers. In E&W, most cases involved a bribe paid from the private sector to the public sector, whereas most cases in Norway occurred within the private sector. A relatively large number, 44 percent, of the bribe payers paid the bribe on behalf of an organization. This is interesting because it illustrates that bribery could be explained as a social process as much as individuals’ considerations of cost and benefit. Moreover, the consequences of bribery, for example the decision that is bought with a bribe, could be visible to others, for example competing companies that lose a contract because of the bribe. From a detection perspective, this could represent a potential indicator that could be used to incentivize those in a position to observe it to report it.
The profile of who was involved in bribery provided both similarities between the two countries as well as differences. In both countries those convicted were predominantly male (91 percent in E&W and 99 percent in Norway). They were also largely middle aged, with an average age at conviction of 43.3 in E&W, but a slightly older group in Norway at 51.1. The status of those convicted, where it was possible to determine this, was higher in Norway, with 51 percent higher-grade professionals, compared with 33 percent in E&W. The average value of the bribe was just under £500,000 in E&W, compared with just over £200,000 in Norway; however, when the median was considered, the values were £20,000 and £32,827 respectively.
There was a variation in who detected the cases. Whistleblowers detected the largest share of cases in E&W, whereas self-reporting was the most prevalent source of detection in Norway. One interesting difference between the countries was that law enforcement bodies in E&W seem to be more active in detecting bribery than their Norwegian counterparts, which did not detect any of the cases in the sample. Another difference was the role of the media, which seem to have a more active role in the detection of bribery cases in Norway than in E&W. For the media and several other of the categories, there could be whistleblowers involved without this information being publicly available. This might explain the variation in the proportion of cases detected by whistleblowers. Different levels of detail regarding the detection process might explain why other studies have a huge divergence in the percentage of cases detected by whistleblowers. Another possible explanation for the discrepancy in this and other studies is that it can be difficult to define when a case is detected. Some studies, for example OECD (2014), use the time when the case is reported to law enforcement, whereas this study has attempted to distinguish between initial detection and reporting.
A general limitation of this project is the time covered. Although this is a study of historical data, the hope was that the findings could give an indication of the current situation. During the period 2003–15 there were changes in legislation and increased attention regarding bribery in both countries, as well as at the international level. This could imply that the situation today is significantly different from the situation described in this study. Another limitation of the sample is that it does not contain cases that resulted in only a civil recovery order or a fine for an organization. Many cases where a company is investigated for bribery are settled with these kinds of sanctions. Self-reporting is found to be a quite frequent type of detection/reporting in this research. It is beyond the scope of this research to investigate the considerations within an organization as to whether they decide to report a case themselves or not. For the future, research regarding how risk of later exposure is evaluated in this decision-making process and how spontaneously organizations self-report would be welcome. If the aim is to detect more cases of bribery, more should be done in order to encourage people to bring their concerns forward. A remaining question is who they should report to. Police budgets in UK police are decreasing, particularly for the SFO (Lord, 2015: 582). The literature reviewed in this project shows that the available resources for the investigation of financial crime are quite similar in the UK and in Norway. This research has found that in both countries it typically takes three years from the start of the investigation until there is a final conviction. This suggests that the prosecution of bribery cases is resource intensive, and a question for further debate and research is whether prosecution is the most effective measure in countering bribery.
Footnotes
Funding
The author(s) received no financial support for the research, authorship, and/or publication of this article.