
Abstract
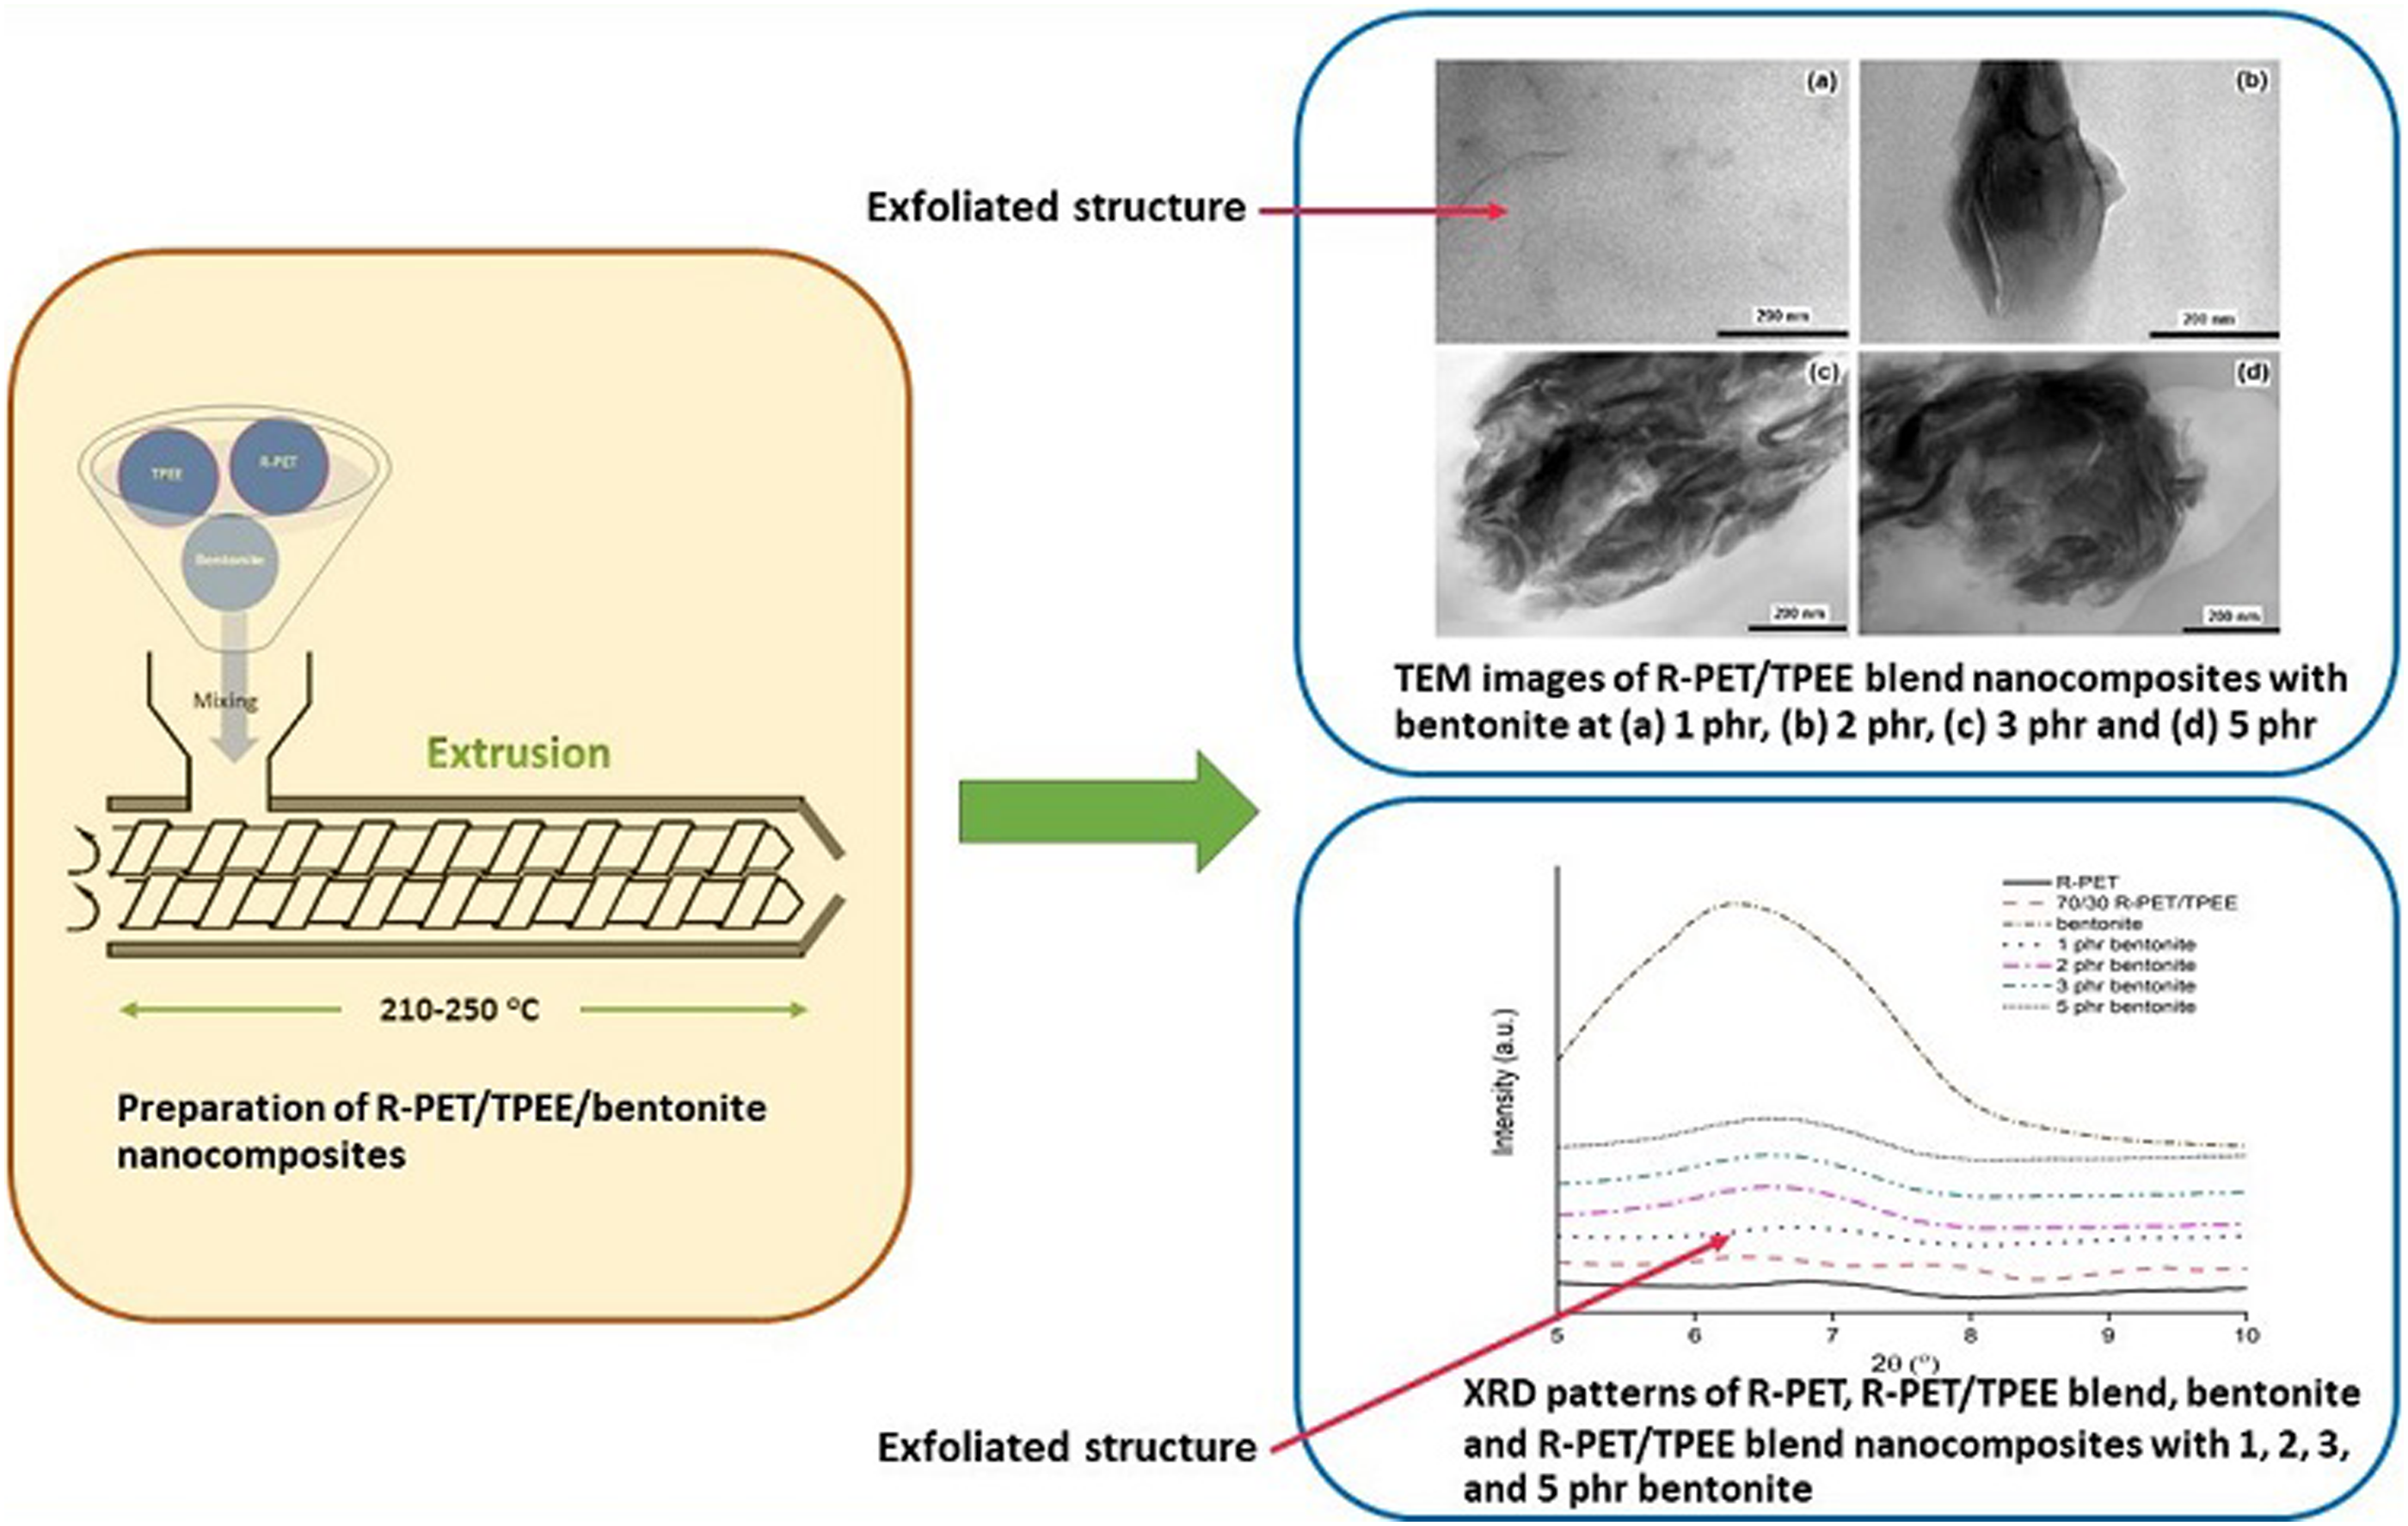
The synergistic effects of thermoplastic poly(ether-ester) elastomer (TPEE) and bentonite nanoclay on mechanical, morphological, thermal, and dynamic mechanical properties of recycled poly(ethylene terephthalate) (R-PET) were investigated. The efficiency of TPEE as impact modifier for the R-PET was evidenced by a significant increase in the impact strength and elongation at break with increasing TPEE contents (from 10 to 30 wt%), while the tensile strength and Young’s modulus exhibited an opposite trend. The 70/30 (wt%/wt%) R-PET/TPEE blend was selected as an optimum formulation for further blending with a very low loading of bentonite (1−5 parts per hundred of resin, phr) using the same processing techniques (extruding and injection molding). X-ray diffraction and transmission electron microscopy revealed that the 1 phr bentonite nanocomposite exhibited an exfoliated structure with the highest improvement in the mechanical properties compared with other nanocomposites and the unfilled blend. Meanwhile, the nanocomposites with 2, 3, and 5 phr bentonite formed tactoid or agglomerated bentonite morphology. Differential scanning calorimetry, thermogravimetric and dynamic mechanical analyses demonstrated a noticeable increase in the crystallization temperature, a comparable thermal stability, and a slight increase in the glass transition temperature, respectively, of all nanocomposites when compared with those of the neat R-PET.
Keywords
Introduction
Poly(ethylene terephthalate) (PET) is known as one of the important engineering thermoplastic polyesters that has been extensively used in such diverse applications as textile fibers, packaging films, bottles and containers, electronic components, and automotive parts because of its excellent balance of unique chemical, physical, mechanical and barrier properties.1–9 Recently, PET has become a preferred material over glass and metal, and also rapidly entered into our everyday life, particularly in the packaging industrial demand. The excessive production and consumption inevitably causes a large volume of PET scrap and waste accumulations both in factory and municipal waste, imparting much concern associated with the environmental pollution due to its non-biodegradability and very high atmospheric durability.2–4,6,10 To mitigate this solution, mechanical recycling is highly recommended because of the ecological and economic advantages.2,3,5,10 Although recycled PET (R-PET) is one of the most highly used for plastic recycling, but it is not suitable for reproducing water or beverage bottles. With an efficient recycling method, R-PET can be reclaimed and reprocessed into a variety of value-added products. However, the molecular weight, intrinsic viscosity, notched impact resistance, and thermal stability of the R-PET may be deteriorated during the injection molding reprocess due to its degradation by random chain scission at the ester bonds induced by heat, shear stress, and moisture, leading to the poor performance of R-PET products.3,6,7,11–13 Thus, the R-PET should be first considered for impact modification to overcome its limitation. An effective technique widely used for tailoring properties and applications of R-PET is melt mixing with proper polymers such as polyolefin, 1 thermoplastic elastomer, 3 poly(butylene adipate-co-terephthalate),3,6 poly(butylene terephthalate), 9 polycarbonate, 10 poly (lactic acid), 12 and thermoplastic polyurethane, 14 and/or reinforcements such as wollastonite, 6 nanoclay,7,8 and multi-walled carbon nanotubes 14 to upgrade the resulting products. Generally, the industrial plastic scraps have less quality variation, easier collection and segregation, superior properties, and more convenient for recycling than the post-consumer and city wastes. 15 Thus, the reduction of such post-industrial or pre-consumer waste as preform scraps in plastic bottling industry has been a strong motivation for replacing the virgin PET. In this study, the preform scraps was melt mixed with a commercial thermoplastic poly(ether-ester) elastomer (TPEE) (10−30 wt%) and a small amount of bentonite nanoclay (1−5 parts per hundred of blend resin, phr).
TPEE used in this study is a commercially available block copolymer with high elasticity, containing short crystallizable hard polyester segments (poly(butylene terephthalate)) and long amorphous soft/flexible polyether segments (polyether glycols).16–20 The role of TPEE is thus expected to improve both brittleness and notch sensitivity of R-PET. The hard phase having high glass transition temperature (Tg), offers strength and processability of thermoplastic to TPEE, while the soft phase with low Tg renders flexibility of high-performance elastomer, and so the TPEE properties depend on the polyester/polyether block ratio.18,20 The random distribution of these blocks combines many attractive properties of both elastomeric and plastic materials, including excellent resiliency, flexibility, impact strength and chemical resistance over a wide temperature range.17–20 Based on these advantages, TPEE seems to be a material of choice for modifying or enhancing certain properties of R-PET via melt blending, as a consequence of their similarity in molecular structures and functional groups and possible compatibilty. Additionally, the blends can be economically processed by many conventional thermoplastic processing techniques, including injection molding, extrusion, rotational molding, and blow molding, which enable them for variety of applications. Although the addition of thermoplastic elastomers to brittle plastics is very effective at increasing the ductility and toughness of the blends, but at the expense of reducing the tensile strength and stiffness as usual, which may limit their application as an engineering plastics. Therefore, polymers are hardly used in their neat forms, they are often filled with additives, including reinforcement. It is well established that the mechanical, thermal and barrier properties of polymer blends were developed using nanotechnology.7,19,21,22 Inorganic nanoparticles with high aspect ratio and tremendous surface area have attracted much attention in both academia and industry for preparing polymeric nanocomposites. Among them, nanoclay and layered silicates have been widely investigated, according to their natural accessibility, abundance, low cost and ability to form intercalated and exfoliated structures at the nanoscale in polymer matrix. 7,19,21–24
Bentonite nanoclay, a commonly used layered silicate, is aluminum phyllosilicate (2:1) clay, consisting approximately 85% of nanoclay known as montmorillonite, which is in the form of sheets with thickness of one to few nanometers and length of hundreds to thousands of nanometers.25–28 Many studies have been utilized bentonite at a rather low loading level (e.g., less than 5 phr) as a reinforcement for preparing polymer nanocomposites via melt processing.25–31 The enhanced properties were achieved as a result of the synergistic effect of both organic and inorganic constituents.28,29 This study aimed to improve some limited properties of R-PET by means of melt blending with TPEE and bentonite, and then investigating their effects on the mechanical, morphological, thermal, and dynamic mechanical properties of the resulting materials.
Experimental
Materials
R-PET flakes of preform scrap were supplied by Top Trend Manufacturing Company (Cholburi, Thailand). TPEE (Hytrel® G5544) pellets were purchased from DuPont de Nemours Company (Luxembourg) with the given properties; a melt flow index of 10 g/10 min (230°C, 2.16 kg), a density of 1.22 g cm−3, a very high impact strength (not broken), an elongation at break of 375%, a tensile strength of 31 MPa, a tensile modulus of 200 MPa, a Tg of −35°C, and a melting temperature (Tm) of 215°C. The unmodified bentonite nanoclay (BENTOLITE H) from BYK-Chemie GmbH (Germany) containing 68% SiO2, 14% Al2O3, 3% MgO, 1.2% Fe2O3, 1% CaO, 3.5% Na2O, 0.1% K2O, 0.2% TiO2, and 9% loss of ignition was provided by Metallurgy and Materials Science Research Institute, Thailand. All ingredients were used as received.
Sample preparation
Before compounding, R-PET flakes were oven-dried at 120°C for 4 h, while TPEE pellets were oven-dried at 110°C for 2 h to remove the residual moisture. Three different weight ratios (90/10, 80/20 and 70/30) were selected for preparing R-PET/TPEE blends. The compositions were melt mixed on a Barbender CTE-D02L800 co-rotating twin-screw extruder (Thailand), having a screw diameter of 15.75 mm and L/D ratio of 32. The melt mixing temperature profile is as follows: 210, 245, 260, and 250°C from the feed zone to the die. The screw rotational speed of 90 r/min was fixed for all the compositions. The resulting extrudates were subsequently pelletized, dried at 140°C for 4 h, and fabricated into the standard impact and tensile test specimens using an Arburg Allrounder 470°C Golden injection molding machine (Lossbrug, Germany) operated at a temperature profile of 240, 255, 260, 265 and 275°C from the feed zone to the die. The R-PET/TPEE blend with optimal toughness was selected for preparing nanocomposites containing 1, 2, 3 and 5 phr of bentonite by melt compounding as above using the same extruder and injection molding machine.
Mechanical properties
The notched Izod impact testing of each material was conducted in accordance with ASTM D256 on a rectangular sample (12.7 × 63.5 × 3 mm3) using a Ceast 9709 impact tester (Italy) with the hammer energy and striking velocity of 2.75 J and 3.46 m s−1, respectively. The tensile test was performed on a standard dumbbell-shaped specimen according to ASTM D638-Type I using a Hounsfield H 50 KS universal testing machine (UK) with a gauge length of 57 mm under a load cell capacity and a crosshead speed of 10 kN and 50 mm min−1, respectively. An average value for mechanical properties was obtained from at least five specimens for each formulation.
X-ray diffraction analysis (XRD)
The structures of pristine bentonite and all the resulting R-PET/TPEE/bentonite nanocomposites were evaluated using an X’Pert PRO MPD pw 3040/60, PANalytical X-ray diffractometer (Netherland) with a Ni-filtered Cu K
α
radiation source (λ = 0.1542 nm) under a voltage of 50 kV and a tube current of 40 mA in a 2θ range from 5° to 10°. The interlayer spacing (d001) was determined by the diffraction peak, using the well-known Bragg’s equation:

Differential scanning calorimetry (DSC)
The thermal and crystallization behaviors were analyzed on a Netzsch DSC 200 F3 differential scanning calorimeter (Germany) under a nitrogen (N2) atmosphere with a gas flow rate of 60 mL min−1 throughout the experiment. The sample (∼10 mg) was initially heated from room temperature (RT) to 300°C (first heating scan) and held isothermally for 5 min to remove previous thermal history, subsequently cooled down to the RT (cooling scan), and finally reheated to 300°C (second heating scan). The experiments were conducted at the same heating/cooling rate of 10°C min−1. The heat flow curves were recorded as a function of temperature, which provided Tg, Tm, cold crystallization temperature (Tcc), crystallization temperature (Tc), enthalpy of melting (ΔHm) and cold crystallization enthalpy (∆Hcc), while the degree of crystallinity (χc) was calculated using the following equation:

Scanning electron microscopy (SEM)
The morphology of sample on its impact fractured surface was observed by a Jeol JSM 6510 scanning electron microscope (Japan) at an accelerated voltage of 5 kV with a magnification of ×3,000. The fractured surface was sputter coated with a thin layer of gold under vacuum before examination for electron conductivity.
Transmission electron microscopy (TEM)
Nanocomposite was observed for the morphology using a Jeol JSM-2010 transmission electron microscope (Tokyo, Japan), operating with a high brightness LaB6 source of convergent and nanobeam electron diffraction and at an accelerating voltage of 200 kV.
Thermogravimetric analysis (TGA)
Thermal stability of the specimen was analyzed on a Mettler Toledo TGA/SDTA 851e thermal analyzer (Switzerland) under a N2 atmosphere with a gas flow rate of 40 mm min−1 to avoid a thermo-oxidative degradation and to remove corrosive gases involved in the degradation. 30 The measurement was carried out over the temperature range from 50 to 700°C at a heating rate of 20°C min−1. The temperatures for onset (Tonset), endset (Tendset) and maximum degradation (Tmax) and the char percentage (%char) were reported.
Dynamic mechanical analysis (DMA)
The specimen was investigated for the dynamic mechanical properties on a Mettler Toledo DMA/SDTA 861e instrument (Switzerland) under a bending mode at a constant frequency of 1 Hz and a heating rate of 3°C min−1 over a temperature range from 50 to 110°C. The Tg, storage modulus (E′), loss modulus (E″), and loss tangent (tan δ) were reported.
Results and discussions
Characterization of the R-PET and R-PET/TPEE blends
Mechanical properties of the samples.
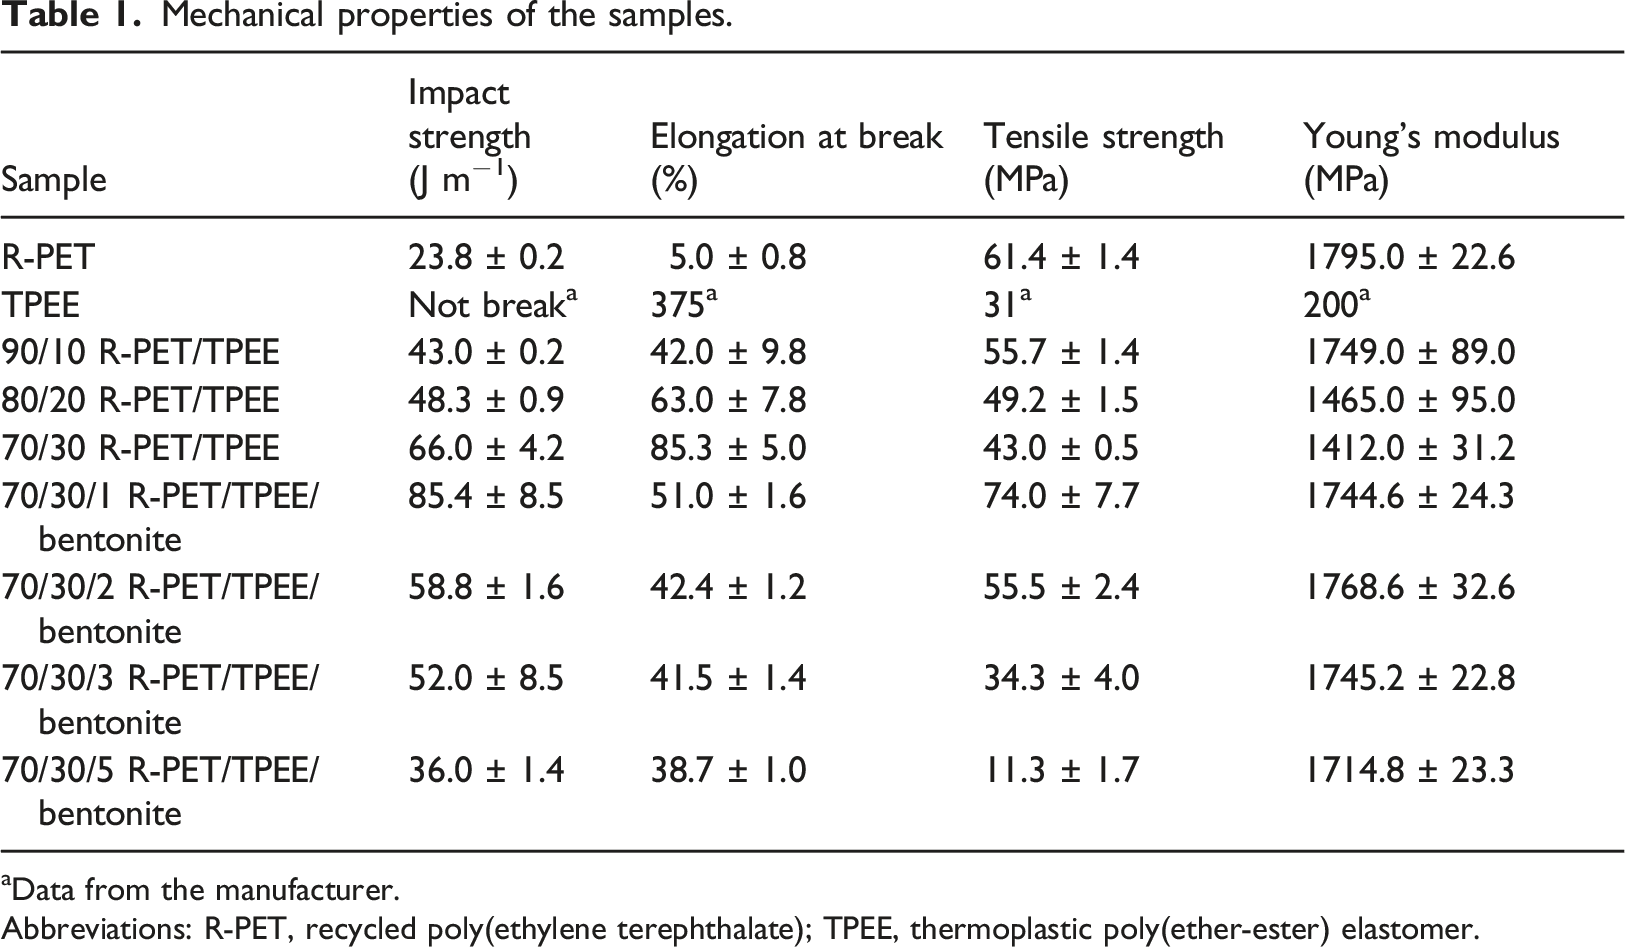
aData from the manufacturer.
Abbreviations: R-PET, recycled poly(ethylene terephthalate); TPEE, thermoplastic poly(ether-ester) elastomer.
Representative SEM micrographs (magnification at ×3,000) on the impact fractured surfaces of the R-PET and all the evaluated R-PET/TPEE blends are shown in Figure 1. The neat R-PET displayed a relatively smooth and uniform surface (Figure 1(a)), contributing to the brittle failure behavior. Meanwhile, the fractured surface roughness of the R-PET/TPEE blends increased with increasing TPEE contents (Figure 1(b)−(d)), suggesting an increased ductile characteristic. This is a logical consequence of the high ductility of TPEE that toughened the R-PET matrix. All micrographs revealed a single-phase morphology with no visible interface between R-PET and TPEE. Moreover, both TPEE pulled out particles and empty voids were not observed on the blend fractured surfaces, suggesting good affinity and compatibility of these two polymers. The homogeneous dispersion of TPEE throughout the R-PET matrix allowed high stress transfer across the phase of each polymer, which was in agreement with the enhancement of impact strength and elongation at break of the blends with increasing TPEE content over those of the neat R-PET as discussed above. Representative SEM micrographs of impact fractured surfaces (a) R-PET and (b)–(d) R-PET/TPEE blends at 10, 20, and 30 wt% TPEE, respectively.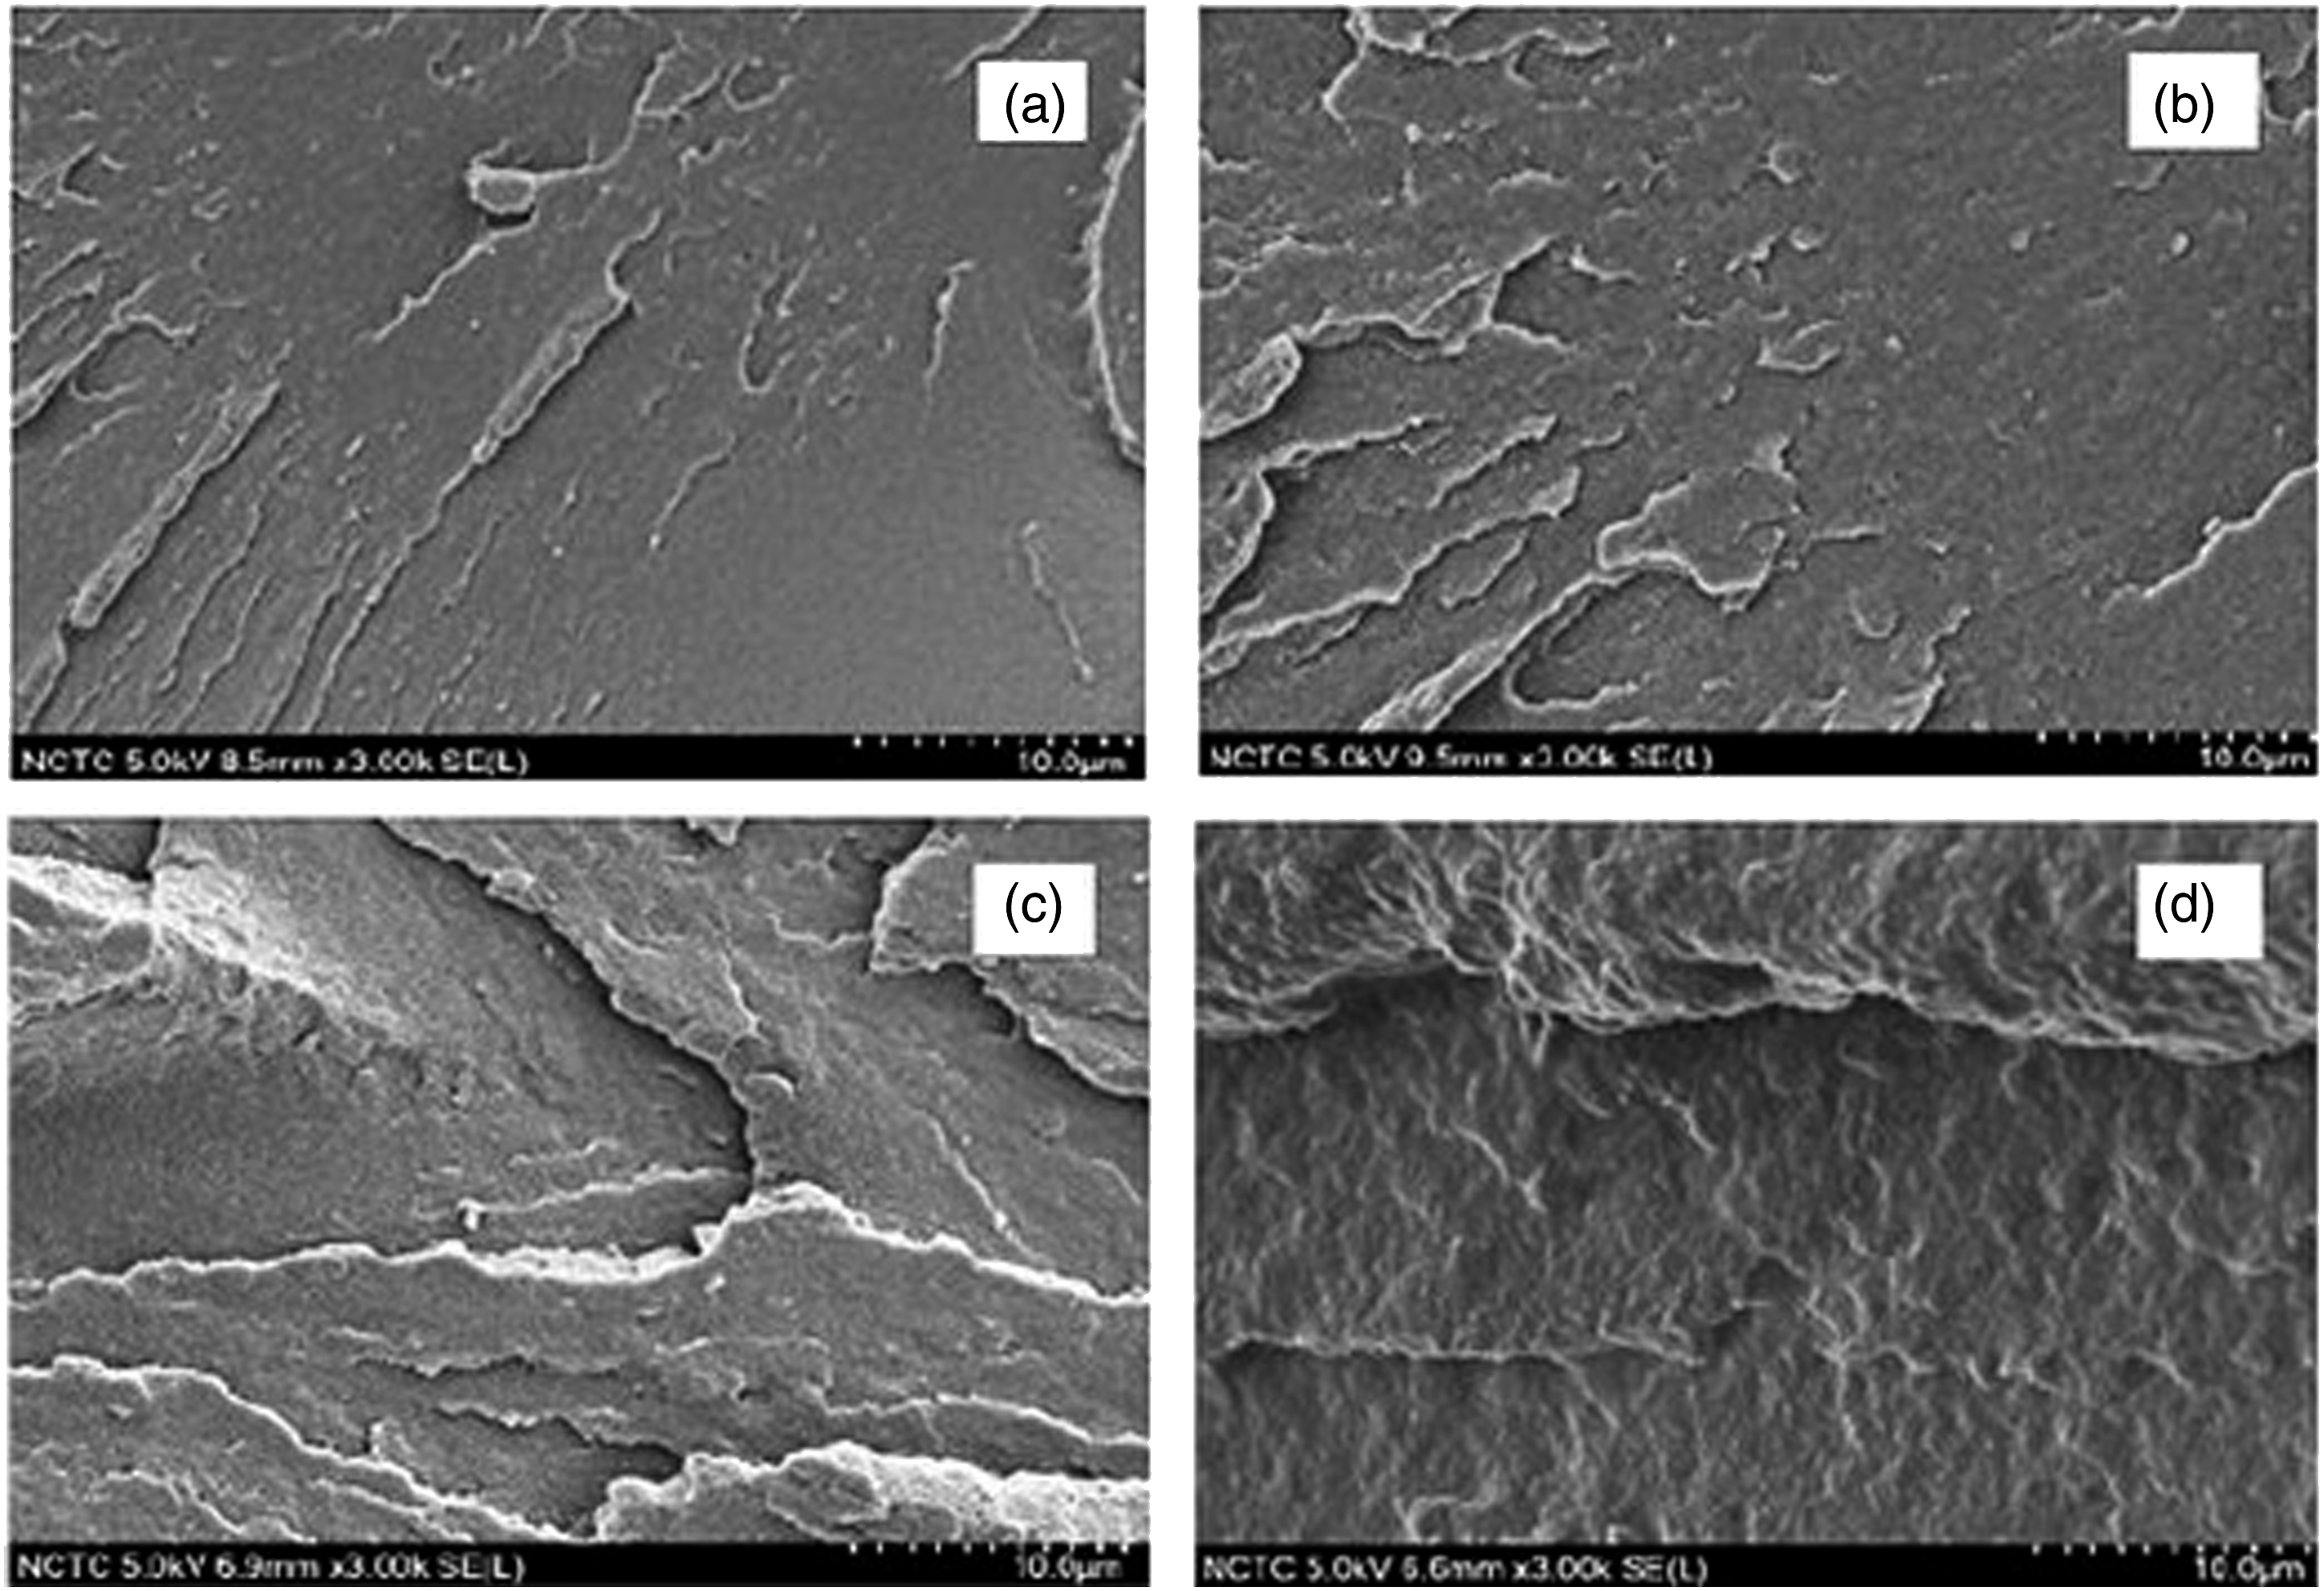
Characterization of the R-PET/TPEE/bentonite nanocomposites
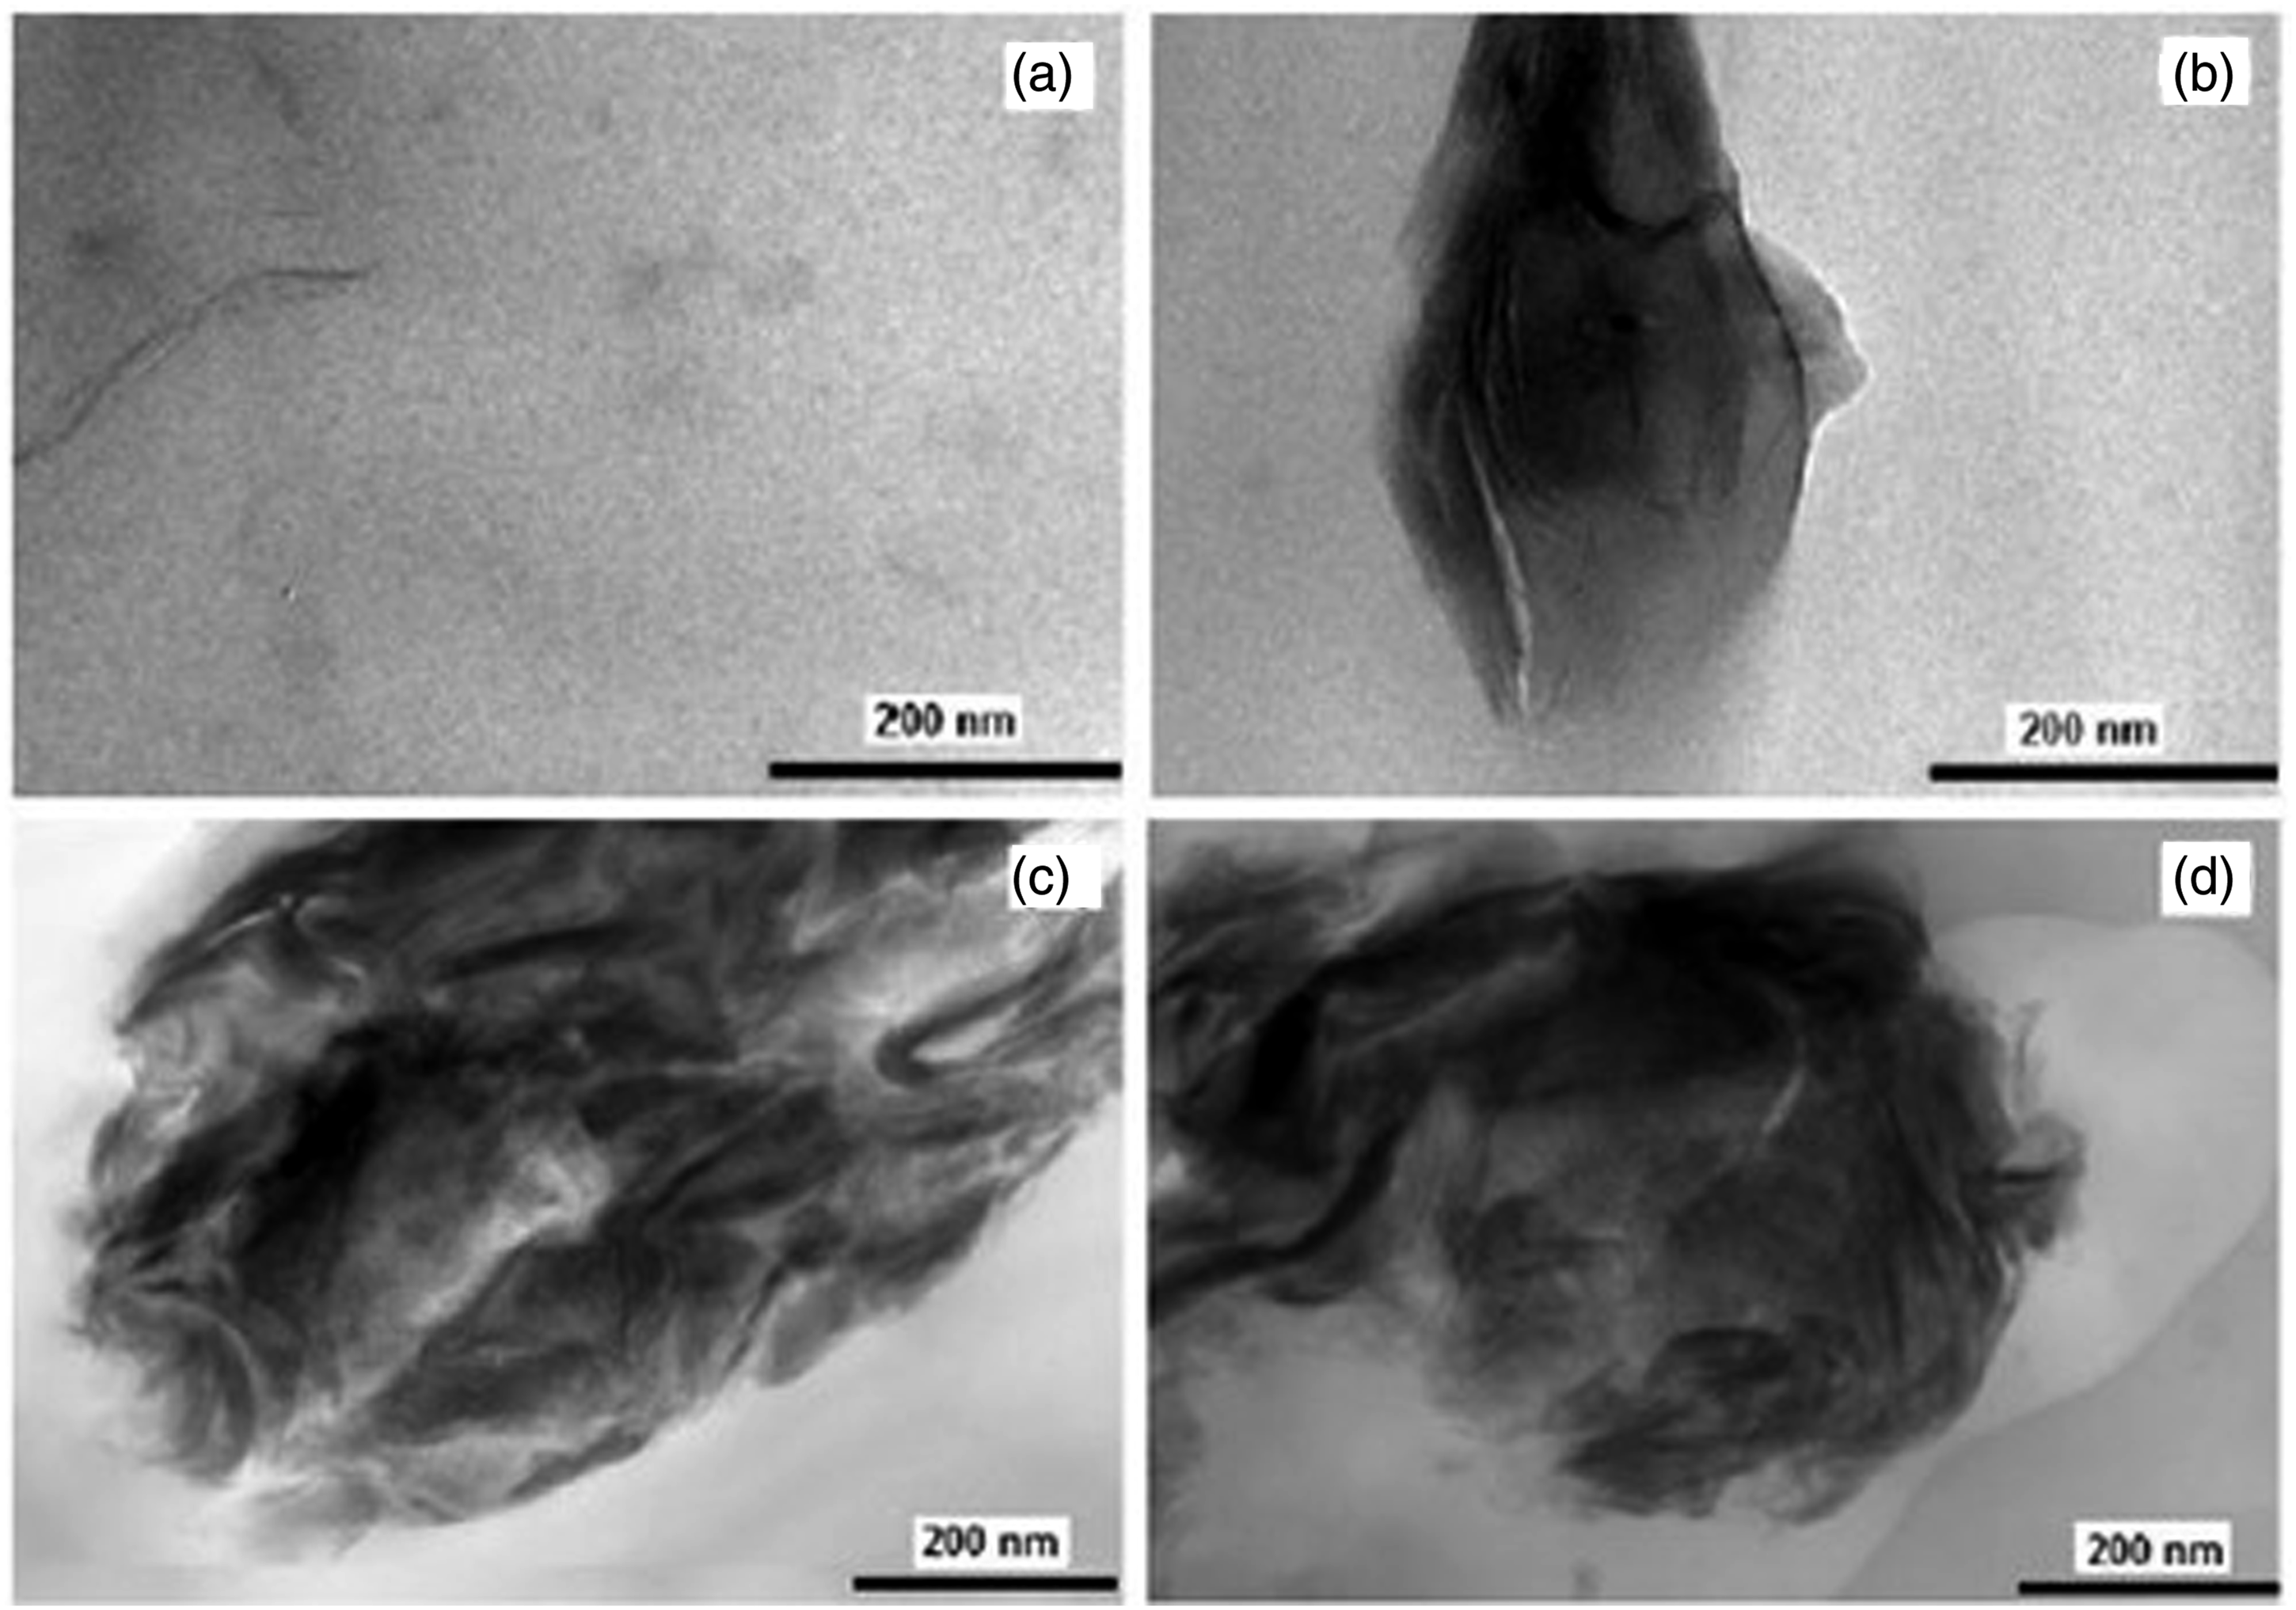
The XRD patterns in the 2θ range of 5−10° of bentonite and 70/30 (wt%/wt%) R-PET/TPEE blend nanocomposites with 1, 2, 3, and 5 phr bentonite are shown in Figure 2. The bentonite showed an intense diffraction peak at 2θ = 6.37°, corresponding to a d-spacing (d001) of 1.39 nm based on the Bragg’s equation (Equation (1)). With respect to the 1 phr-bentonite nanocomposite, there was no visible characteristic peak of bentonite, suggesting a homogeneous dispersion of the nanoparticles in polymer matrix and the formation of an exfoliated nanocomposite under shear during the melt processing.24,32 This observation was consistent with the TEM image shown in Figure 3(a), which verified that the bentonite layers were fully dispersed at a nanoscale level within the R-PET/TPEE blend matrix in an exfoliated form.
25
In contrast, the blend nanocomposites with 2, 3 and 5 phr bentonite exhibited a broad and low intensity of 2θ = 6.47°, 6.42°, and 6.22°, corresponding to the d001 of 1.37 nm, 1.38 nm and 1.42 nm, respectively, which suggested that the polymer chains hardly penetrated into the clay galleries. The marginal change in the d001 induced by the addition of bentonite at these concentrations was possibly due to the agglomeration of bentonite nanoparticles that led to a reduction in the contact area and the compatibility at interfaces between the nanofiller and polymer matrix.24,30,33,34 The TEM images (Figure 3(b)−(d)) of these nanocomposites confirmed the agglomerated or tactoid structure of bentonite (the darker area), which seemed to become denser with increasing bentonite loading and thus played only a slight role on property improvement.
35
XRD patterns of R-PET, R-PET/TPEE blend, bentonite and R-PET/TPEE blend nanocomposites with 1, 2, 3, and 5 phr bentonite. Representative TEM images of R-PET/TPEE blend nanocomposites with bentonite at (a) 1 phr, (b) 2 phr, (c) 3 phr and (d) 5 phr.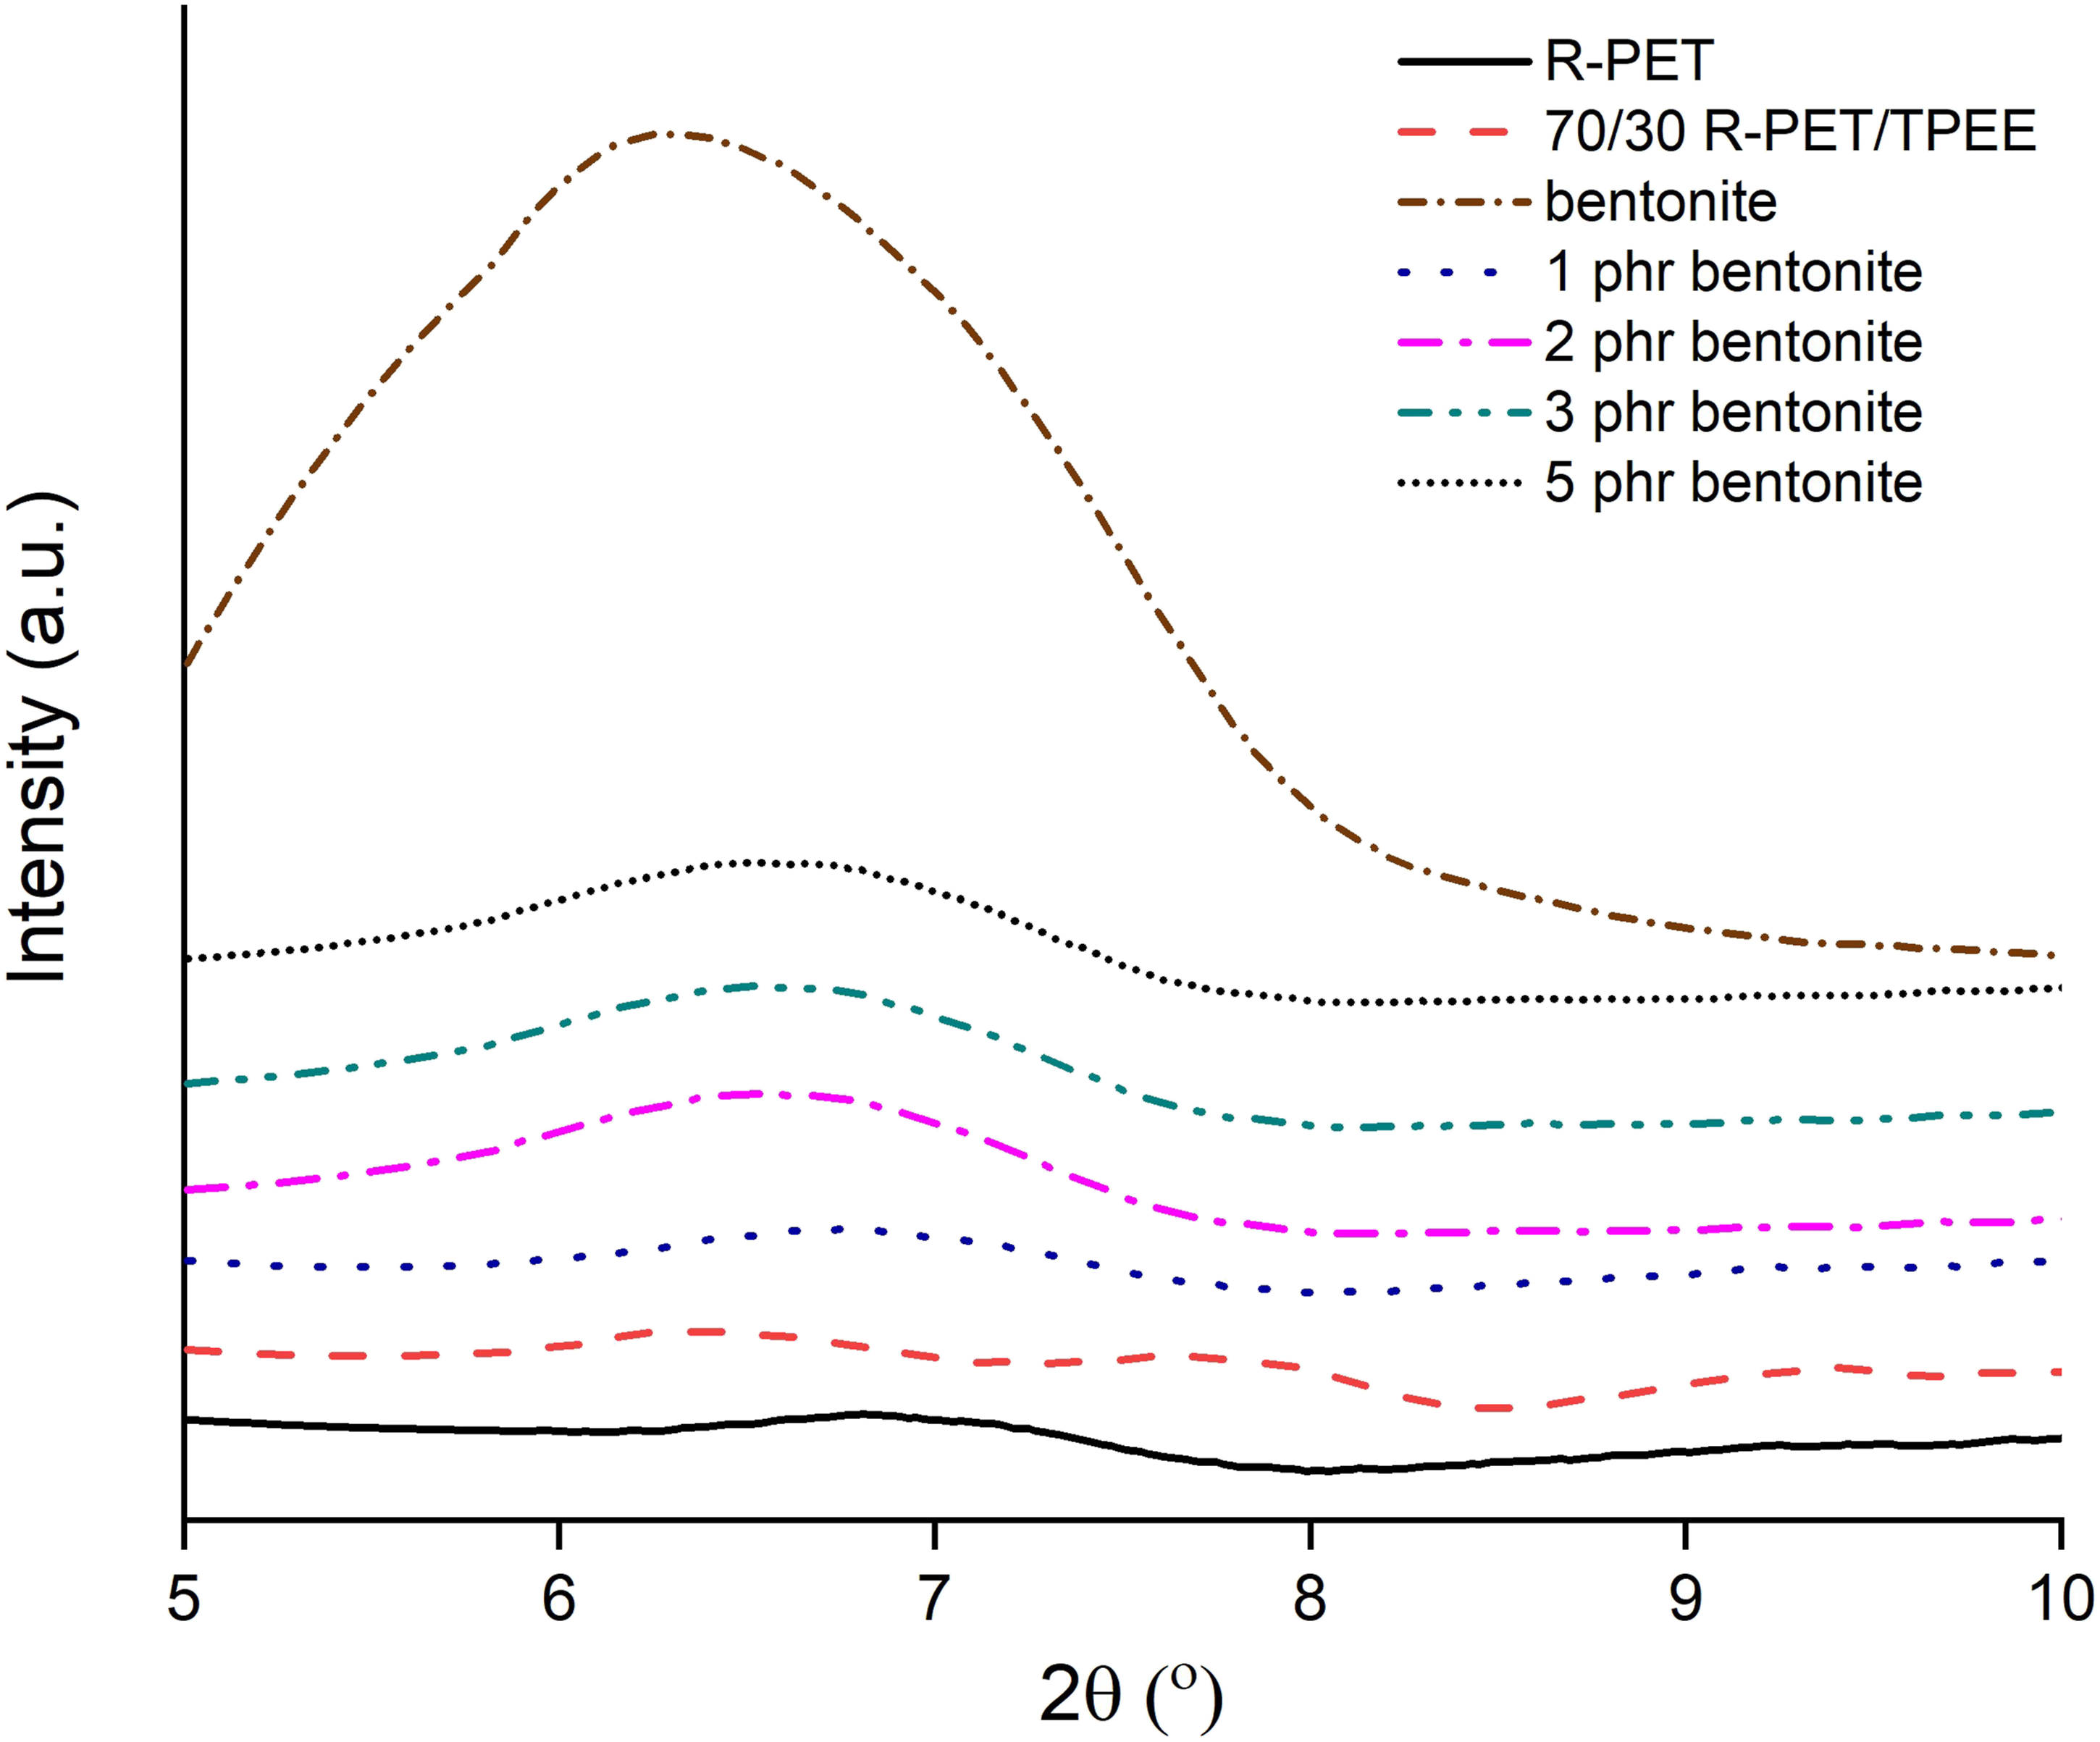
The mechanical properties of the resulting nanocomposites are also listed in Table 1. Among the four different nanocomposites, the one with 1 phr bentonite exhibited the highest impact and tensile strength, showing a significant improvement in these properties (1.3-fold and 1.7-fold, respectively) compared with those of the neat 70/30 (wt%/wt%) R-PET/TPEE blend. This is a consequence of the high aspect ratio and specific surface area of the bentonite particles, which were well dispersed in an exfoliated morphology, imparting high stress transfer from polymer matrix to nanofiller. Thus, the addition of 1phr bentonite was adequate to display a synergistic reinforcing effect with TPEE on enhancing simultaneously the toughness and tensile strength of the resulting nanocomposite. On the other hand, the nanocomposites with higher loading levels of bentonite (2, 3 and 5 phr) clearly exhibited a decrease in both impact and tensile strength. This was due to the agglomeration of excessive amount of nanoparticles that disturbed the continuity of matrix and acted as stress concentration sites. In contrast, the elongation at break of all the nanocomposites was lower (1.67- to 2.2-fold) than that of the neat blend but was much higher (7.74- to 10.2-fold) than that of the neat R-PET. The reduction in the elongation at break was primary due to the high stiffness of bentonite nanoparticles, which effectively restrained the mobility of the polymer chains. In addition, the Young’s modulus of all the nanocomposites was slightly higher (1.21- to 1.25-fold) than that of the neat blend but was comparable to that of the neat R-PET, suggesting that the stiffness of the neat blend was regained after incorporating a small amount of bentonite nanoclay. Hence, it can be concluded that the nanocomposite with 1 phr bentonite exhibited the highest balanced mechanical properties in terms of toughness, strength and stiffness.
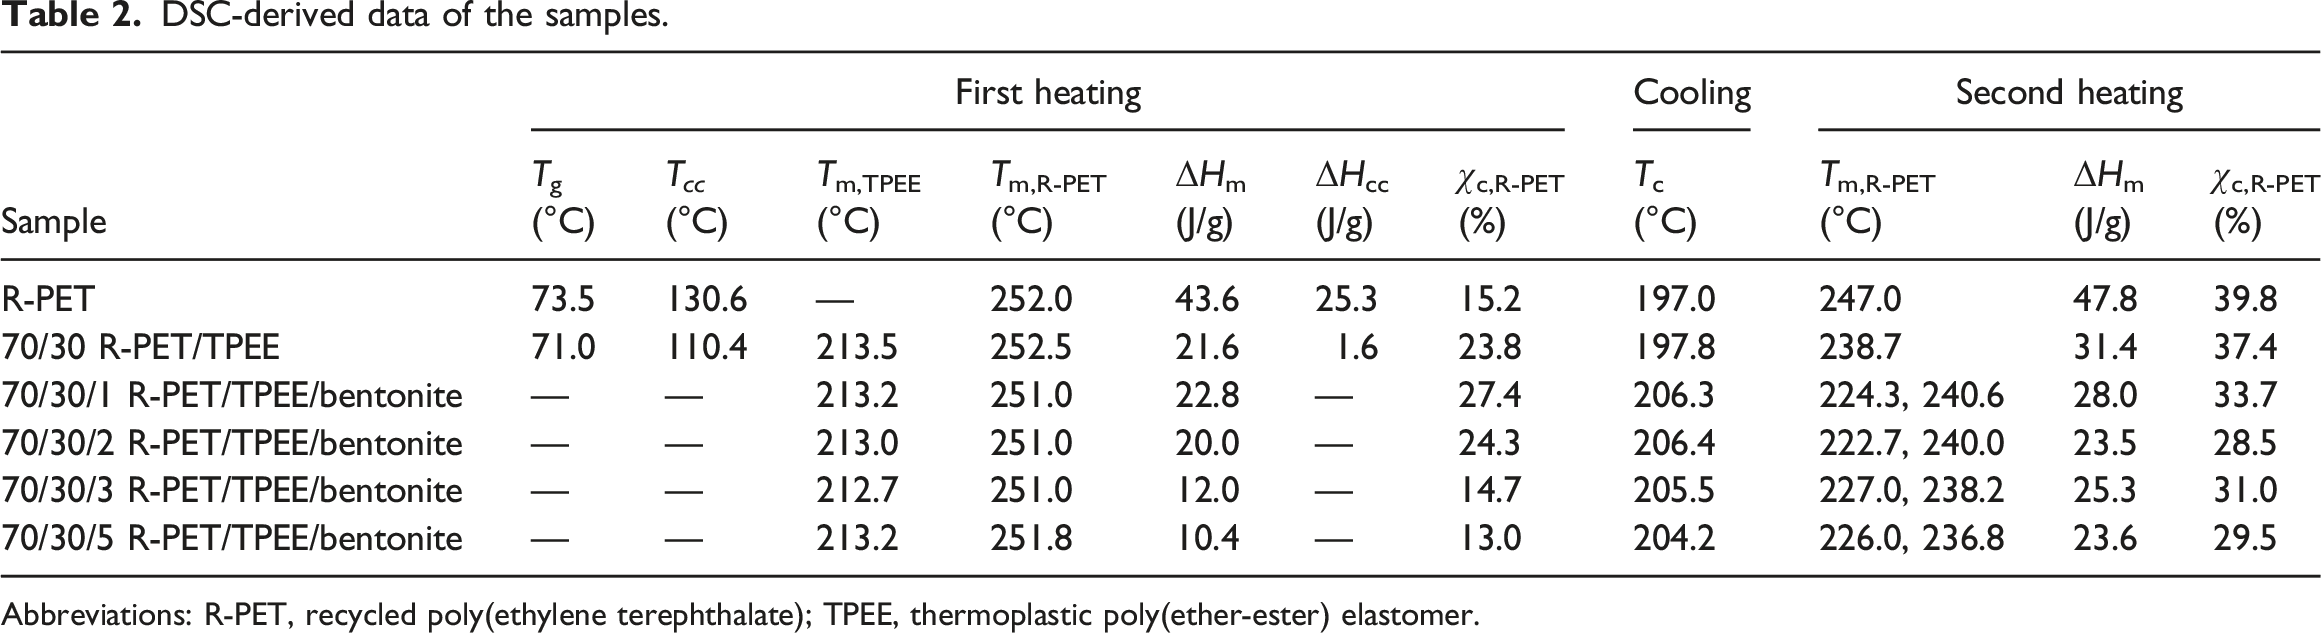
When it comes to the nanocomposites, only the DSC thermograms of the neat R-PET, 70/30 (wt%/wt%) R-PET/TPEE blend and four different nanocomposite samples derived from the first heating, cooling, and second heating scans are shown in Figure 4. The corresponding thermal parameters, including Tg, Tcc, Tc, Tm, ΔHm, ∆Hcc, and χc are listed in Table 2. From the first heating scan (Figure 4(a)), the neat R-PET exhibited Tg, Tcc, Tm and χc at 73.5°C, 130.6°C, 252°C, and 15.2%, respectively, suggesting that both amorphous and crystalline phases of the semicrystalline R-PET were co-exist. The relatively high Tg of the R-PET is a result of the presence of short ethylene groups and p-phenylene group in its repeating unit.2,33 However, the Tg of R-PET decreased slightly (2.5°C) with addition of 30 wt% TPEE, indicating that this blend was immiscible. This decrease was corresponded to the soft and flexible fractions within TPEE that increased the segmental mobility of the R-PET chains. Meanwhile, the Tcc of R-PET in the blend was about 20.2°C lower than that of the neat R-PET, implying that the TPEE accelerated the crystallization of R-PET fraction. This is a consequence of the flexible phase of TPEE that promoted the movement and alignment of R-PET molecules in forming small crystallites upon heating. Also, the neat 70/30 (wt%/wt%) R-PET/TPEE blend shows two endothermic peaks at around 213.5°C and 252.5°C resulted from the Tm of the crystalline fractions in TPEE and R-PET, respectively. However, the Tm of R-PET in the blend was quite similar to that of the neat R-PET, suggesting that the inclusion of TPEE did not affect the Tm of R-PET. This may be due to the increased χc of the R-PET (from 15.2 to 23.8%) that kept the Tm of the R-PET steadily. Moreover, nanocomposites with different loading levels of bentonite showed no Tg and Tcc of the R-PET component, suggesting that the amorphous R-PET was well crystallized in the processing step according to the nucleating effect of bentonite. Meanwhile, the Tm of either TPEE or R-PET in all the nanocomposites was almost constant, indicating that the addition of bentonite had no effect on the Tm of each polymer. It was also evident that the R-PET component in the nanocomposite at 1 phr bentonite had the maximum χc at 27.4%, due to the more uniform dispersion of silicate layers that provided more nucleating sites for the R-PET chains. However, at higher bentonite loadings, the χc of R-PET (13−24.3%) was continuously decreased as a consequence of the agglomerated bentonite that restricted the mobility and the alignment of the polymer chains and also decreased its nucleating effect.
3
From the cooling scan (Figure 4(b)), all samples had sufficient time to crystallize, and then a single Tc exotherm of the R-PET component was clearly visible. The Tc of the blend with 30 wt% TPEE (197.8°C) was found to be virtually unchanged as compared to that of the neat R-PET (197°C), while that of the four different nanocomposites increased considerably and was in the range of 204.2–206.4°C. This implied the nucleating effect of bentonite that accelerated the crystallization of R-PET in the nanocomposites. In addition to the second heating scan, each DSC curve exhibited only Tm endotherm of the R-PET component (Figure 4(c)), where the Tg was no longer present. This means that the amorphous content was very low and the crystalline content became larger than in the first heating scan. The neat R-PET melted at 247°C, but in the presence of 30 wt% TPEE, the Tm of the matrix decreased by 8.3°C due to the lower Tm of TPEE (215°C). Meanwhile, the R-PET in all nanocomposites exhibited double overlapping melting peaks with a small shoulder at the lower Tm. These two peaks were observed at 222.7−227°C and 236.8−240.6°C. This phenomenon is often observed in many semicrystalline polymers for non-isothermal crystallization process, which can be assigned to the simultaneous melting, recrystallization and re-melting processes of the distributed crystallites having different size and degree of order.2,3,6,36 The low-temperature melting peak was attributed to partial melting of the crystallites formed at Tc, while the sharper temperature peak was according to the melting of more perfect crystals achieved from the reorganization of the less perfect crystals as the temperature increased.2,6,36 However, the main Tm of R-PET in each nanocomposite was slightly different (0.5−1.9°C) from that of R-PET in the neat R-PET/TPEE blend, and so the presence of bentonite seem to have no significant effect on the melting behavior of both R-PET and TPEE components in the nanocomposites. Moreover, the χc of the R-PET in the blend (37.4%) was comparable to that of the neat R-PET (39.8%), while that of the R-PET in the prepared nanocomposites was found to be lower (28.5−33.7%), indicating that bentonite did not play the role of nuclei for crystallization during the second heating cycle. DSC thermograms derived from first heating scan, cooling scan and second heating scan of (a) R-PET, (b) R-PET/TPEE blend and (c)–(f) R-PET/TPEE blend nanocomposites with 1, 2, 3, and 5 phr bentonite, respectively. DSC-derived data of the samples. Abbreviations: R-PET, recycled poly(ethylene terephthalate); TPEE, thermoplastic poly(ether-ester) elastomer.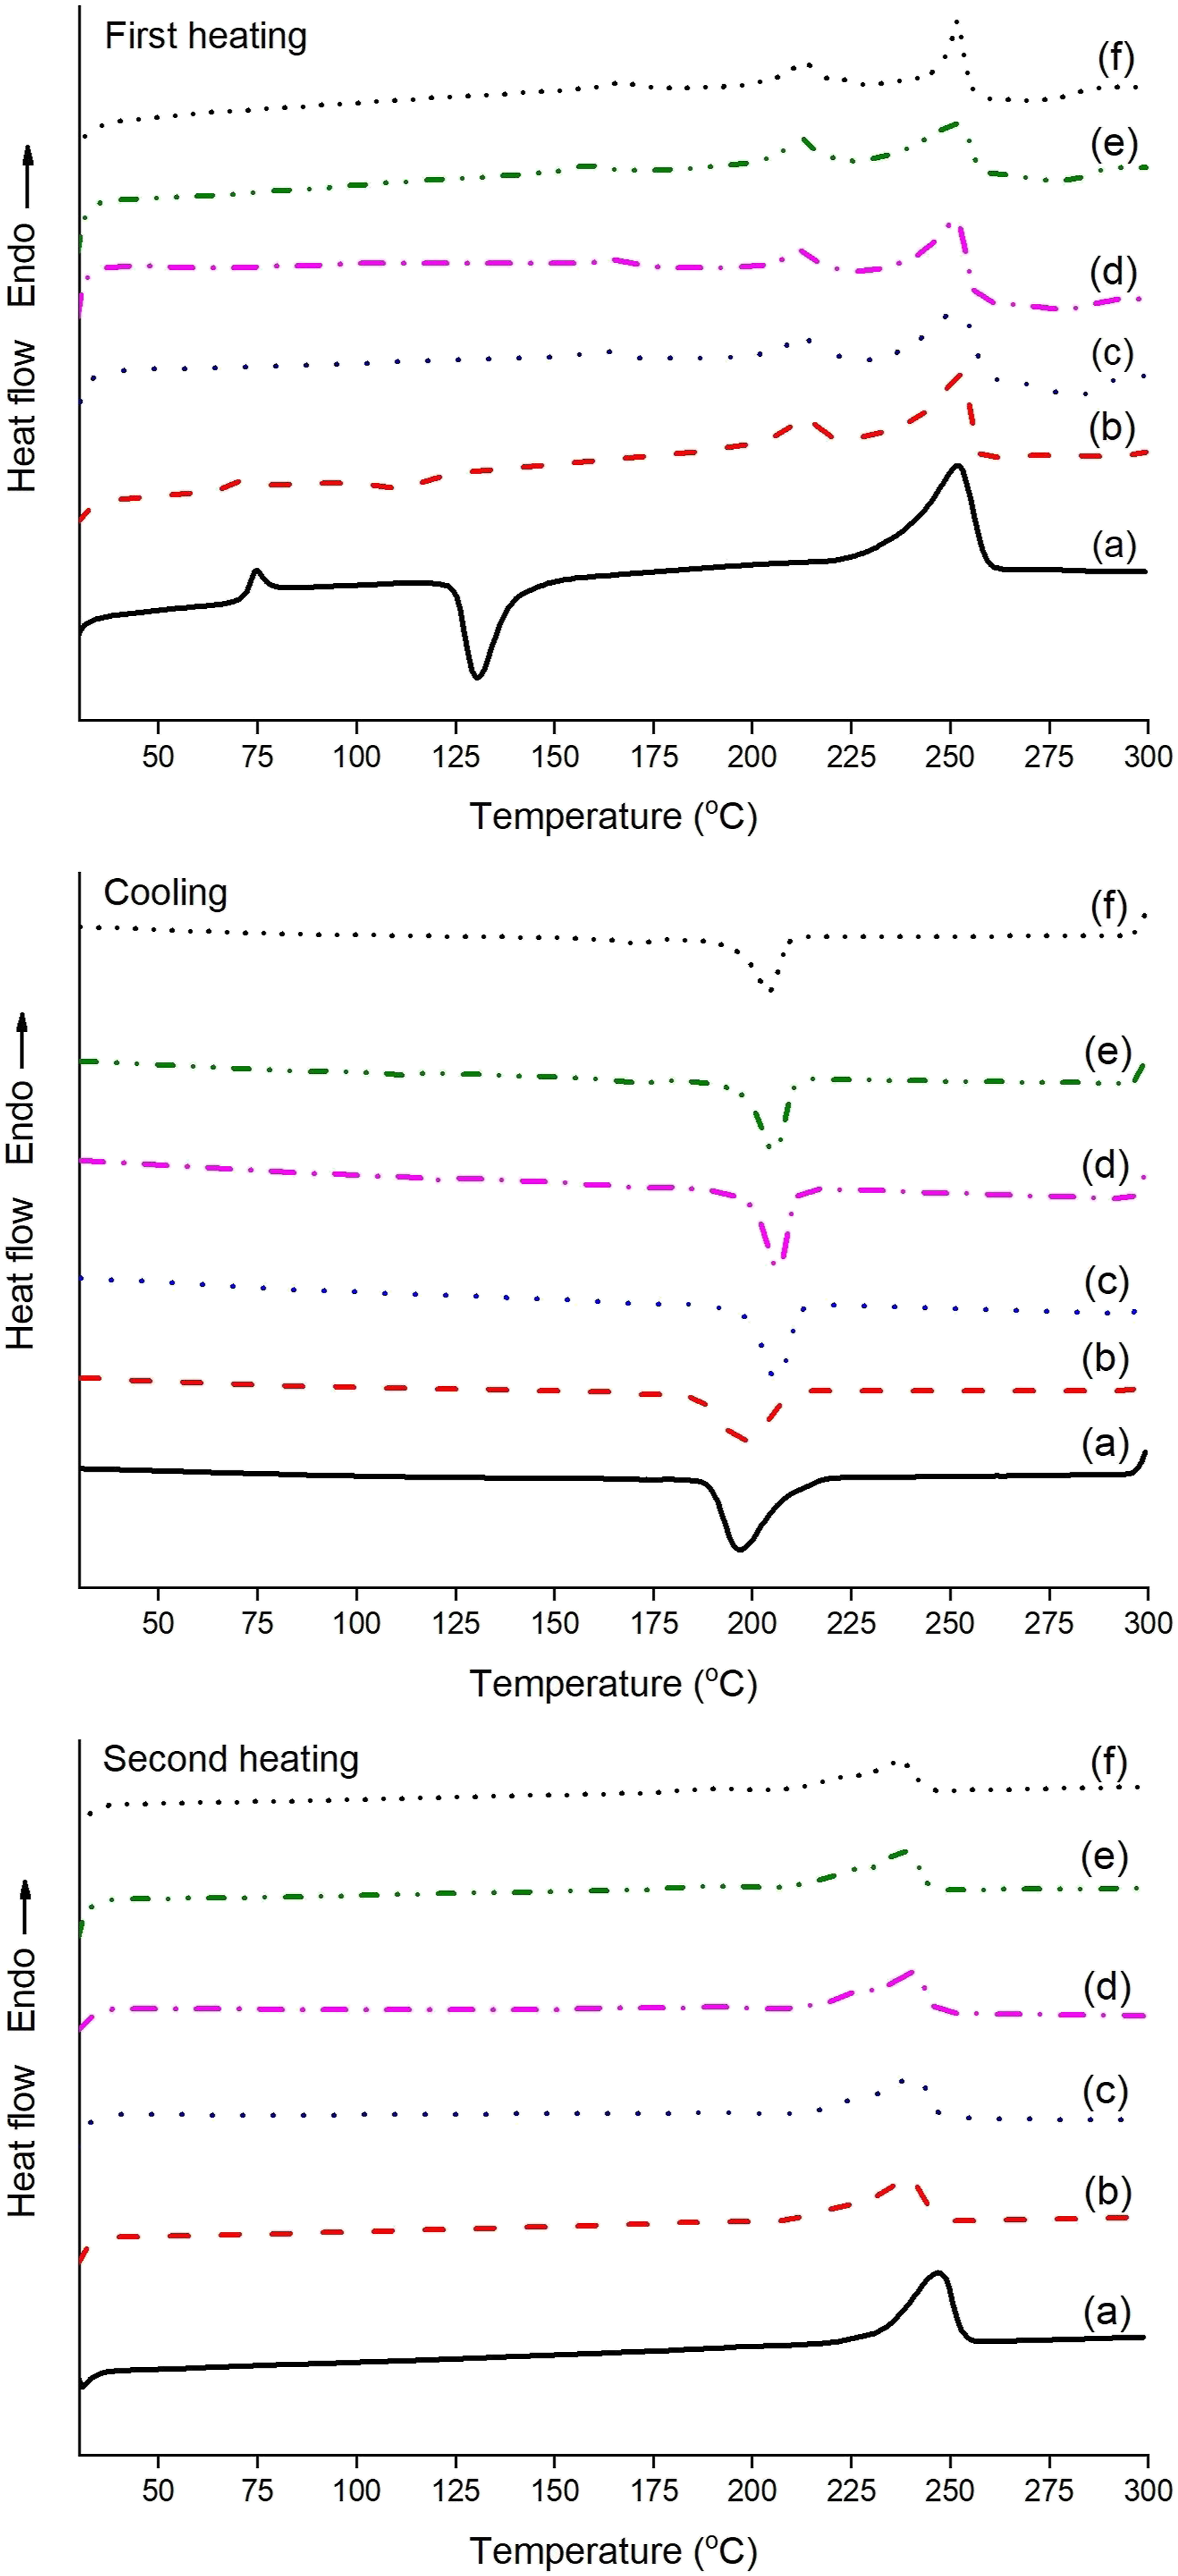
The TG and derivative thermogravimetric (DTG) curves of the neat R-PET, 70/30 (wt%/wt%) R-PET/TPEE blend and blend nanocomposites with bentonite (1, 2, 3 and 5 phr) are shown in Figure 5. The thermal degradation parameters, including Tonset, T50%, Tendset, Tmax and %char (at 700°C) are all listed in Table 3. All the samples showed similar TG/DTG patterns with a single degradation step. The weight loss obseved in the range of 399.2–466.2°C corresponded to the structural decomposition of both R-PET and TPEE, which mainly due to the breakdown of the ester groups and random chain scission of the C–O and C–C bonds on polymer backbones.3,6,9 The neat R-PET exhibited a Tonset at 427.2°C, a T50% at 451°C, a Tendset at 466.2°C, a Tmax at 450.6°C, and a %char at 14%. Evidently, the thermal stability of the resulting blend was diminished as could be seen from its lower Tonset, T50%, Tendset, and Tmax compared to those of the neat R-PET. This may be according to the lower thermal stability of the rubber phase within TPEE that induced less thermal stability to the prepared sample as expected. Moreover, the thermal stability of all the obtained nanocomposites was not found to be improved by the addition of bentonite to the R-PET/TPEE blend as expected. However, the whole thermal degradation parameters of the nanocomposites were similar to those of the neat blend. This suggested that the thermal barrier effect of bentonite was limited as a consequence of the acidic sites on the clay surface and the free metallic ions in its structure that accelerated the thermal degradation of polymers, as already observed by other researchers.7,25,26 However, all samples possessed adequate thermal stability for fabricating since they were processed at much lower temperatures than their degradation temperatures. Besides, there was only a marginal change in %char of the blend and nanocomposites compared to that of the neat R-PET, which were in the range of 13–15%. Thermal stability of R-PET, R-PET/TPEE blend and R-PET/TPEE blend nanocomposites with 1, 2, 3, and 5 phr bentonite obtained from (a) TG and (b) DTG thermograms. TGA and DMA-derived data of the samples. Abbreviations: R-PET, recycled poly(ethylene terephthalate); TPEE, thermoplastic poly(ether-ester) elastomer.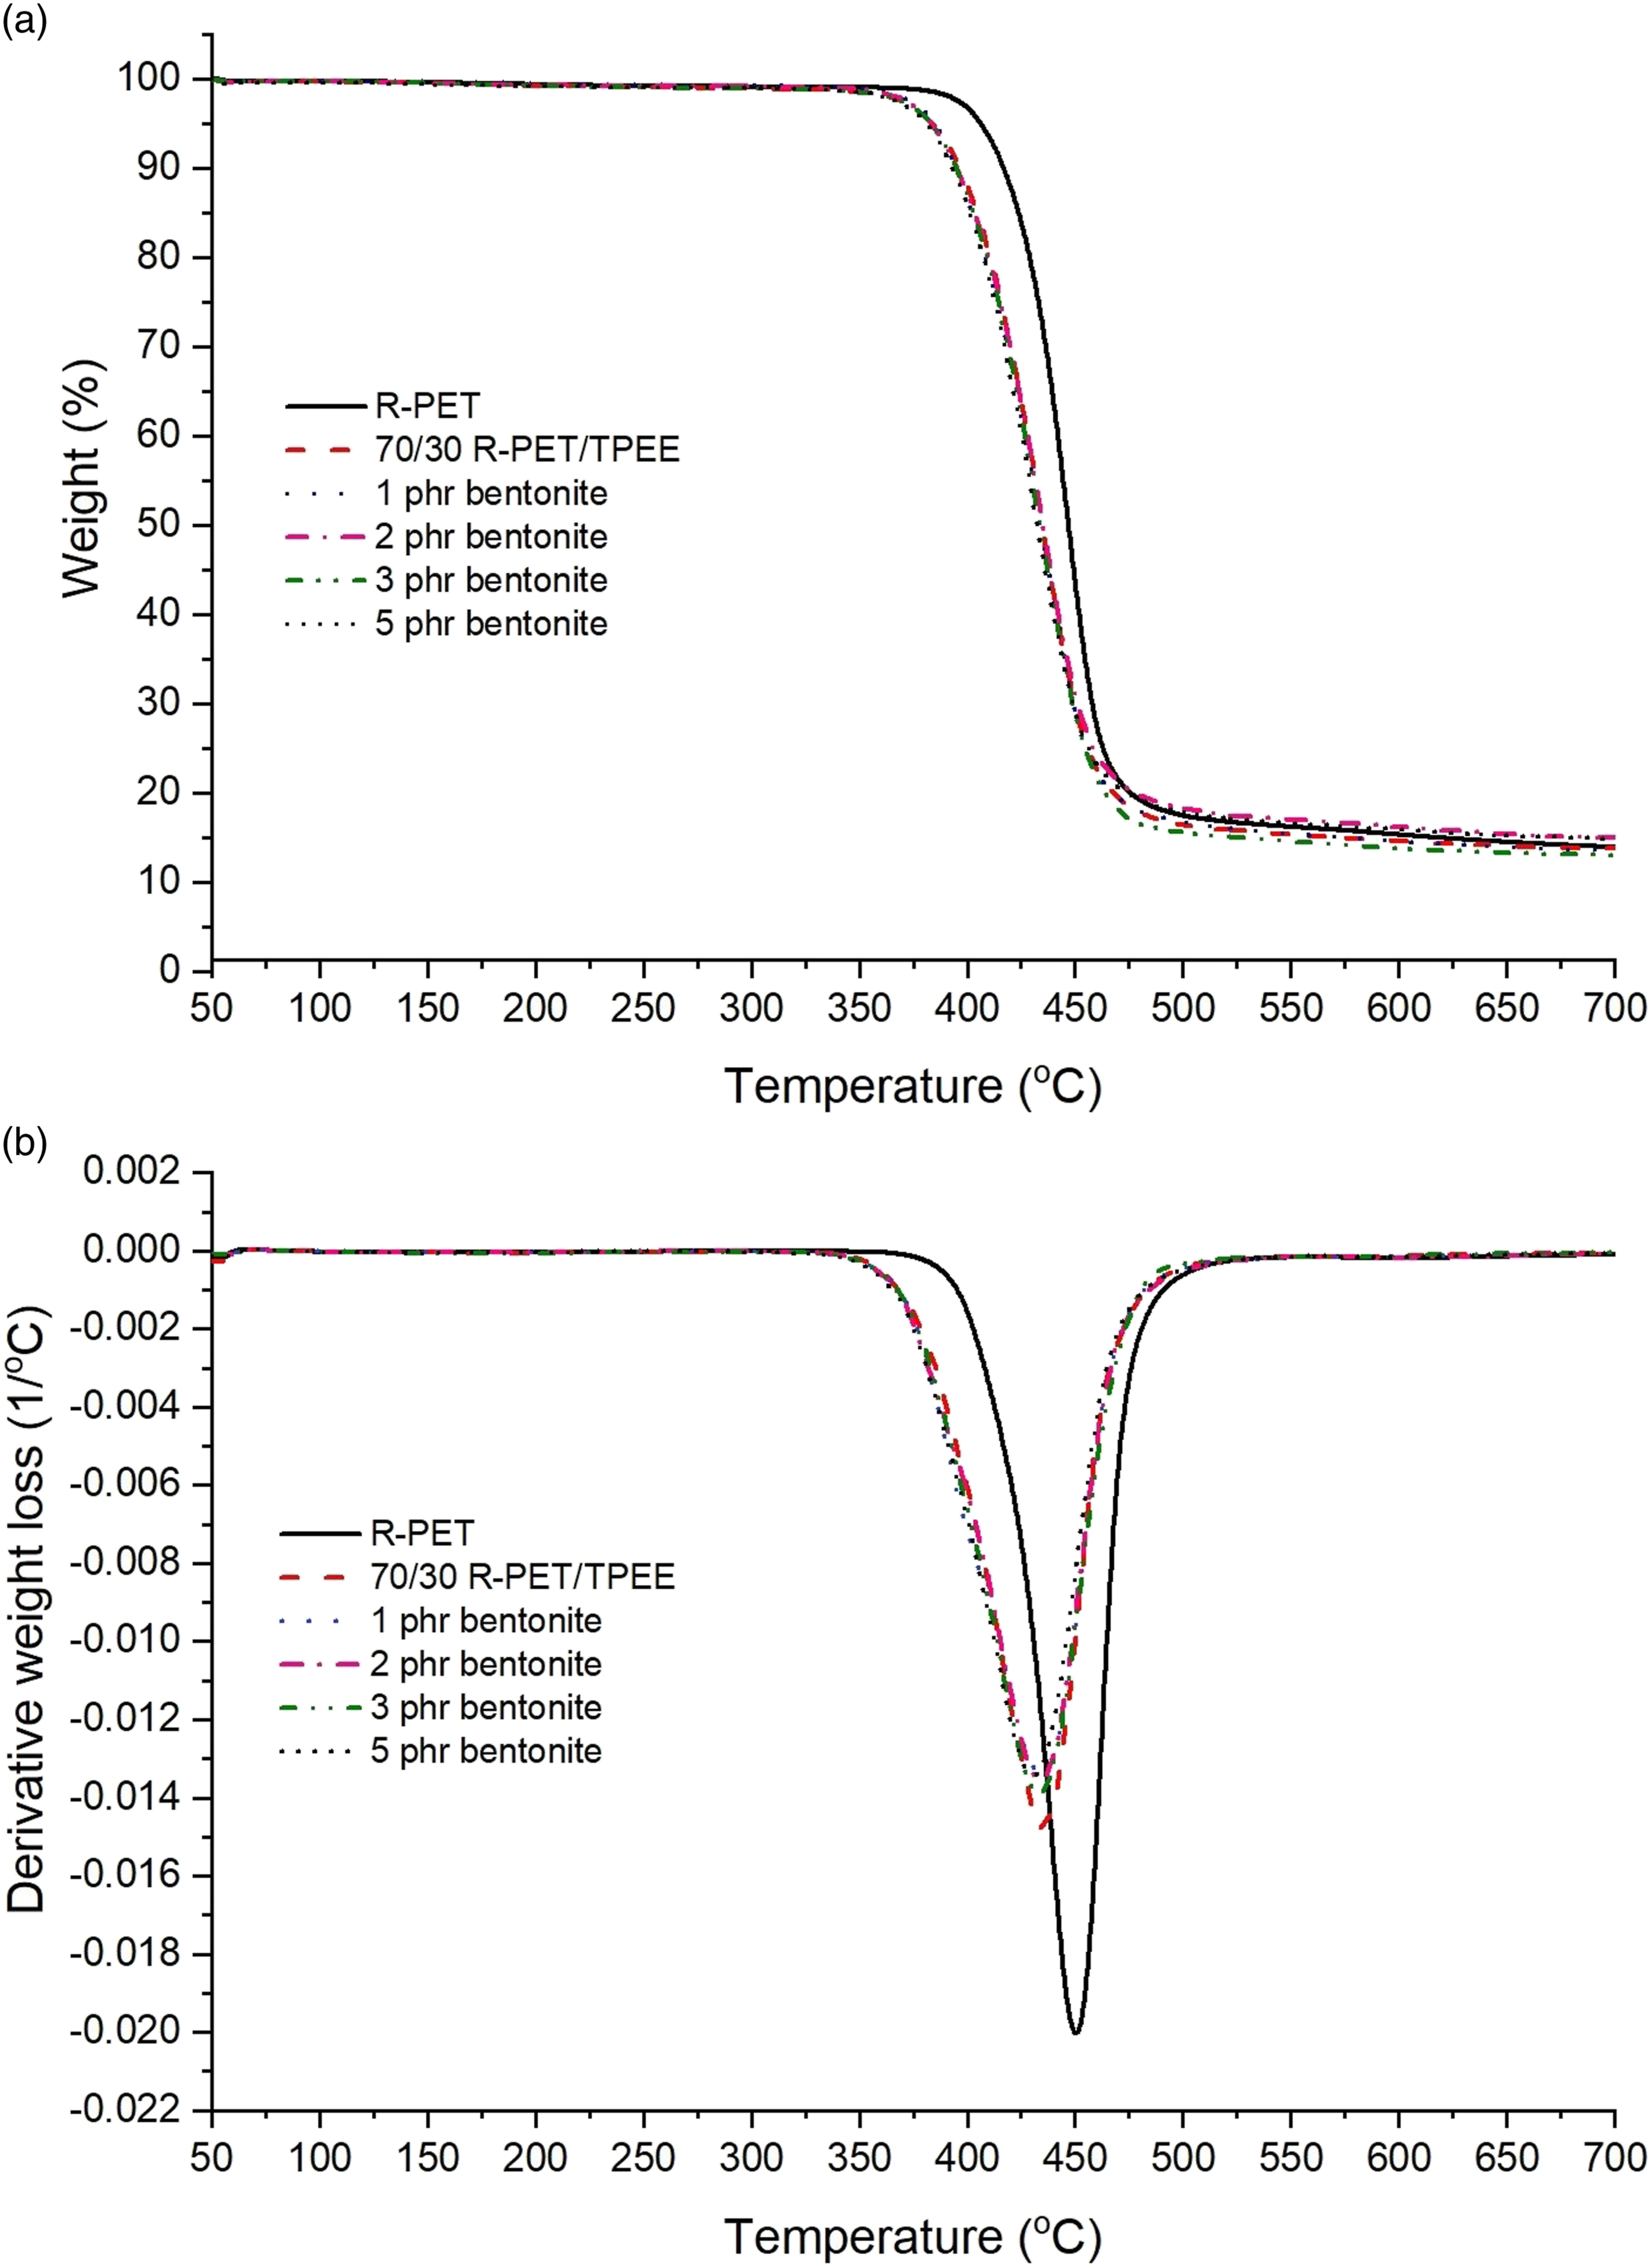
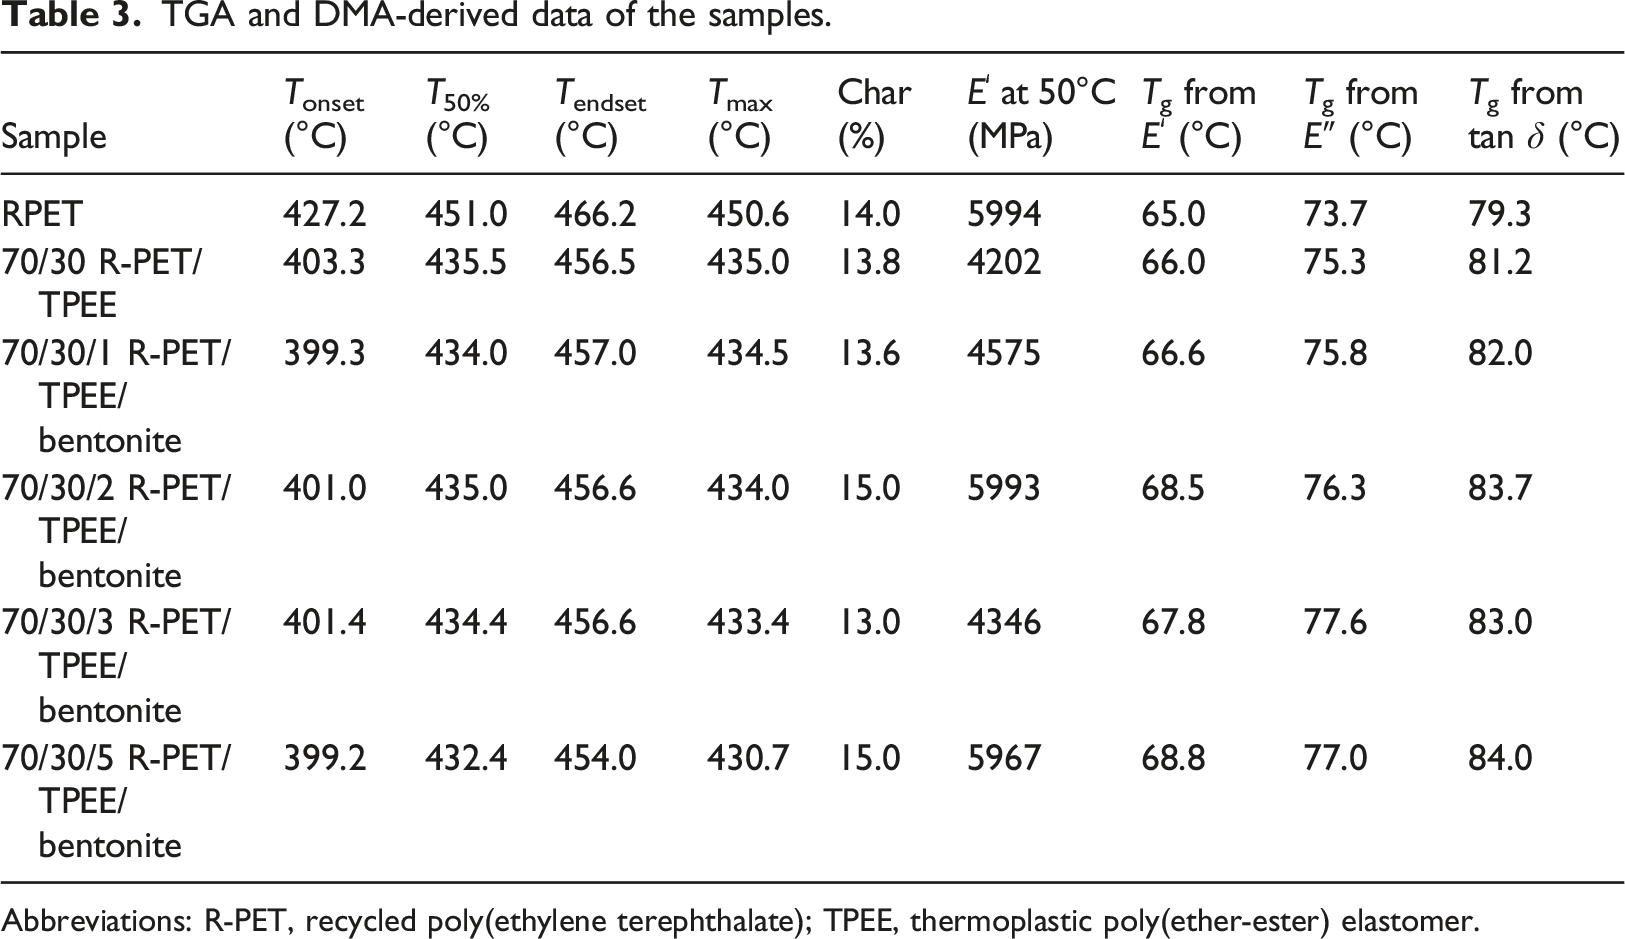
Figure 6 shows the DMA results of the evaluated samples in terms of the storage modulus (E′), loss modulus (Eʺ), and loss tangent (tan δ) as a function of temperature, ranging from 50 to 110°C. The values of E′ (at 50°C) and Tg (derived from E′, Eʺ and tan δ curves) are also presented in Table 3. It is seen that the E′ at 50°C of the neat R-PET (5994 MPa) declined gradually upon heating and then abruptly dropped at around 65°C (Figure 6(a)), which corresponded to its Tg, as a consequence of the segmental motion in the amorphous region. This also accompanied with the Tg values obtained from the Eʺ and tan δ peaks at 73.7°C (Figure 6(b)) and 79.3°C (Figure 6(c)), respectively. The R-PET blend with 30 wt% TPEE exhibited a lower E′ at 50°C (4202 MPa) and a broader glass transion region due to the flexible TPEE that increased the R-PET molecular mobility, as mentioned earlier. The R-PET chains became more mobile above the Tg, and the crystallization process proceeded as the temperature increased until the chain mobility was reduced by the enhanced crystallinity, and so noticed that the E′ of the blend was higher than that of the R-PET at high temperature. However, the Tg values obtained from the E′ (66°C), Eʺ (75.3°C), and tan δ (81.2°C) did not significant change for the neat blend in comparison with those of the neat R-PET. Moreover, the high aspect ratio, plate morphology, specific surface area, and stiffness of bentonite played a role in increasing the stiffness by restricting the mobility of the polymer chains, which resulted in an increase in the E′ (at 50°C) of all the obtained nanocomposites in a bentonite dose dependent manner compared to that of the neat blend. It is seen that the nanocomposites showed an inconsistent trend of change in the E′ (at 50°C). The E′ (at 50°C) of the nanocomposites with 1 and 3 phr bentonite (4575 and 4346 MPa, respectively) was slightly higher than that of the neat blend, while the nanocomposites with 2 and 5 phr bentonite was noticeably increased (5993 and 5967 MPa, respectively). However, the Tg values of the nanocomposites both obtained from the E′ curve (66.6−68.8°C), Eʺ peak (75.8−77.6°C), and tan δ peak (81.2−84.3°C) were slightly higher than that of the neat blend, indicating the less mobility of the R-PET chain segments.
36
DMA thermograms of R-PET, R-PET/TPEE blend and R-PET/TPEE blend nanocomposites with 1, 2, 3, and 5 phr bentonite in terms of (a) storage modulus (b) loss modulus and (c) tan δ.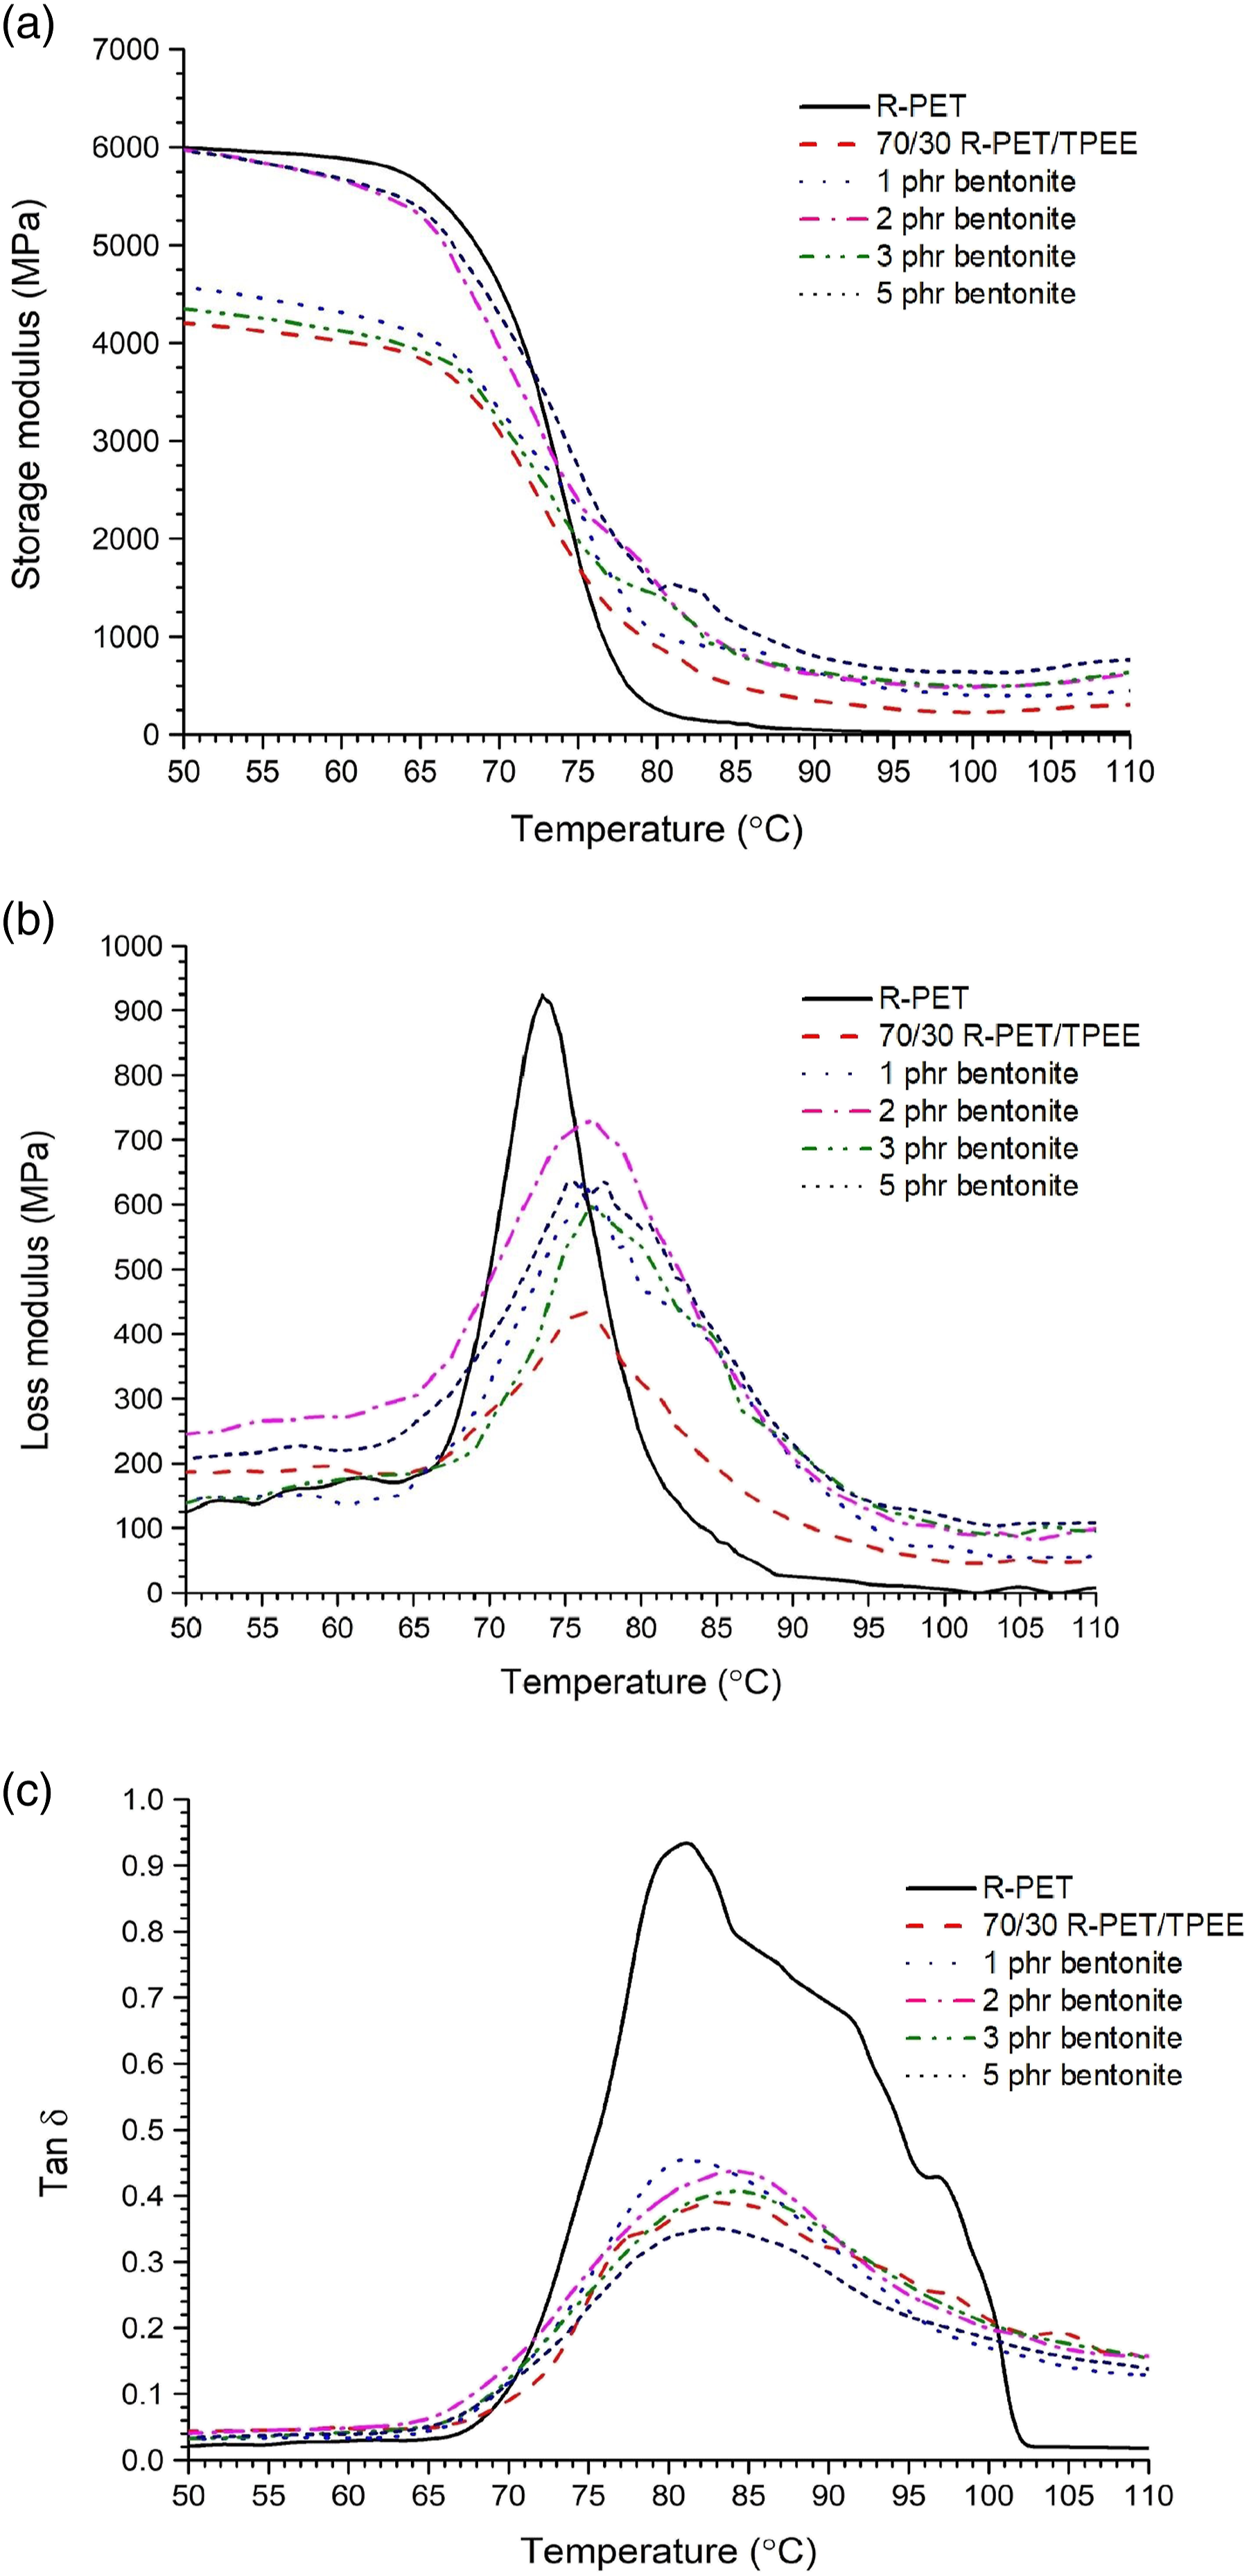
Conclusions
This study presented the mechanical recycling of R-PET derived from the pre-consumer preform scraps collected in plastic bottling industry. To improve its toughness, three different R-PET/TPEE blends (90/10, 80/20, and 70/30 (wt%/wt%)) were first prepared by the conventional extrusion and injection molding processes. The incorporation of TPEE into R-PET obviously increase the impact strength and elongation at break of the resulting blends with increasing TPEE content compared to those of the neat R-PET, but at the expense of reducing the tensile strength and Young’s modulus. The 70/30 (wt%/wt%) R-PET/TPEE blend, having the highest impact strength and elongation at break was subsequently blended with four different loadings of bentonite (1, 2, 3, and 5 phr) to improve some properties or minimize its drawbacks. The prepared nanocomposites were explored for the structure and morphological, mechanical, thermal, and dynamic mechanical properties. The nanocomposite with 1 phr bentonite exhibited an exfoliated structure as determined from the XRD pattern and TEM image, while the others showed cluster/tactoid structure of bentonite without either layer exfoliation or intercalation. The addition of a very low loading of bentonite (1 phr) was found to further increase the impact strength of the nanocomposite compared to that of the neat blend (from 66 J m−1–85.4 J m−1). The tensile strength and Young’s modulus also significantly increased from 43 MPa and 1412 MPa–74 MPa and 1745 MPa, respectively, whereas the elongation at break diminished from 83.5% to 51%. However, the elongation at break of the 1 phr bentonite nanocomposite (51%) was still quite high as compared with that of the neat R-PET (5%). The DSC results revealed that the addition of bentonite strongly affected the crystallization process of the nanocomposites by notably shifting the Tc values toward much higher temperatures compared to that of the neat R-PET and R-PET/TPEE blend according to the heterogeneous nucleation effect of bentonite. Meanwhile, the thermal stability and the Tg values of the nanocomposites were comparable with those the neat blend.
Footnotes
Acknowledgements
The authors would like to thank the Department of Materials and Metallurgical Engineering, Faculty of Engineering, Rajamangala University of Technology Thanyaburi, Metallurgy and Materials Science Research Institute, Chulalongkorn University, and MTEC, National Science and Technology Development Agency (NSTDA) for material, instrument supports, and facility for this research work.
Declaration of conflicting interests
The author(s) declared no potential conflicts of interest with respect to the research, authorship, and/or publication of this article.
Funding
The author(s) received no financial support for the research, authorship, and/or publication of this article.